measuring the electric charge and zeta potential of - lirias
TRANSCRIPT

1
Measuring the Electric Charge and Zeta Potential of
Nanometer-Sized Objects Using Pyramidal-Shaped
Nanopores
Nima Arjmandi 1, 2 *, Willem Van Roy 1, Liesbet Lagae 1, 2, Gustaaf Borghs 1, 2
1 IMEC, Kapeldreef 75, 3001 Leuven, Belgium
2 Department of Physics and Astronomy, Katholieke Universiteit Leuven, Celestijnenlaan 200 D, 3001
Leuven, Belgium
* E-mail: [email protected]
Abstract: Nanometer-scale pores are capable of detecting the size and concentration of nanometer-sized
analytes at low concentrations upon analyzing their translocation through the pore, in small volumes and
over a short time without labeling. Here, we present a simple method to measure the zeta-potential of
nano-objects using a nanopore. Zeta-potential i.e., a quantity that represents electrical charge in
nanocolloids, is an important property in manufacturing of pharmaceuticals, inks, foams, cosmetic and
food; it is also imperative to understand basic properties of complex dispersions including blood, living
organisms and their interaction with the environment. The characterization methods for zeta-potential are
limited. Using the nanopore technique the zeta-potential and the charge of nanoparticles can be measured
2
independent of other parameters, such as particle size. This simple method is based on measuring the
duration of the translocation of analytes through a nanopore as a function of applied voltage. A simple
analytical model has been developed to extract the zeta-potential. This method is able to detect and
differentiate nanometer-sized objects of similar size; it also enables the direct and precise quantitative
measurement of their zeta-potential. We have applied this method to different nanometer-sized particles
and compared the results with values measured by commercially available tools.
Key words: nanopore, zeta potential, nanoparticle, particle charge, particle size, electrophoretic mobility
Nanometer-sized objects in liquids are important materials in many respects. These include biological
macromolecules [1, 2], such as nucleic acids and proteins, which are dispersed in living cells; organelles,
such as vesicles, lysosomes and centrioles; and viruses. Moreover, synthetic polymers, such as
polyethylene glycol (PEG) and polymethyl methacrylate (PMMA), suspended in a liquid have numerous
industrial applications [3]. Furthermore, nanoparticle colloids, such as gold nanoparticles, have
important applications in biosensors [4], photovoltaics [5], cosmetics [6] and nanomedicine [7]. Despite
the numerous applications and the importance of these nanometer-sized floating objects, their detection
and the techniques used to characterize them are relatively limited. For instance, the available techniques
used to characterize nucleic acids are usually too time consuming and expensive in many applications
[8]. Virus detection techniques require high concentrations, which is impossible during the early
diagnosis of many diseases. Transmission electron microscopy (TEM) and different mass spectroscopy
techniques are accurate and reliable tools to measure size and charge; however, they cannot characterize
particles in their liquid environment and are expensive and time consuming. Dynamic light scattering
(DLS) [9] can be used to measure the size and zeta potential of these particles. However, it requires a
relatively large volume and cannot function at high or low analyte concentrations in addition to other

3
limitations similar to centrifugation [10], field flow fractionation [11], hydrodynamic fractionation [12],
chromatography [13], gel electrophoresis [14]; and electro acoustic methods [15] and micro
electrophoresis combined with nanoparticle tracking analysis can only work with particles that are large
enough to be visible using optical microscopy, and problems such as electrode polarization and the
introduction of gas bubbles may be encountered [16].
Nanometer-sized pores in a membrane (figure 1) have previously been introduced as a promising tool
for the detection of nanometer-sized objects dispersed in a liquid at concentrations lower than 107
particles per milliliter, with times as short as a few seconds and volumes as small as a few microliters
without any labeling or major sample preparation [17-20]. The ability of the nanopore technique to
differentiate between various nanoparticles has traditionally been based on the discrimination of particles
according to their size. Thus, its applications have been limited to analytes with detectable size
differences. However, different particles composed of different materials with different properties can
have similar sizes, and in complex samples, such as biological samples, many such particles exist [20].
Thus, we cannot rely only on the size of the particles to differentiate and detect particles. In addition,
particle size is determined by measuring the amplitude of the ionic current’s change during particle
translocation through a nanopore; this amplitude is a function of other parameters, including the ionic
concentration of the solution, particle material and the applied voltage, in addition to the size of the
analyte [21-23]. Therefore, we advocate the use of translocation duration and even better, its derivative
for measuring the zeta potential.

4
Figure 1. The nanopore device. a) Three-dimensional schematic representation of the nanopore
device. A silicon membrane separates two microfluidic chambers composed of poly(methyl
methacrylate) (PMMA) and sealed by poly dimethyl siloxane (PDMS). A pyramidal nanopore in the
membrane connects the two chambers. Nanometer-sized objects are electrophoretically driven from the
front chamber, through the nanopore and into the back chamber. The white blades represent the Ag/AgCl
electrodes that are used to apply the voltage to the liquid. b) Transmission electron microscopy (TEM)
cross section image of a 40 nm nanopore (for TEM sample preparation purposes the nanopore is filled
with silicon dioxide). The scale bar is 10 nm. c) Scanning electron microscopy (SEM) image of a 120 x
120 nm nanopore. The nanopore is the white square at center of the image where is the end of the
pyramidal etch pit that has resulted from KOH wet etching. The scale bar is 200 nm.

5
Nevertheless, measuring the zeta potential of colloids is required in many applications, such as protein
purification [2], production of paint and minerals, clay and drilling fluids, ceramics, pharmaceuticals,
and paper as well as in ore processing, water and wastewater coagulation, and biosensors [24]. The zeta
potential is defined as the electrical potential between the inner Helmholtz layer near a particle’s surface
and the bulk liquid in which a particle is suspended. It is a parameter that represents the charge of a
particle. Detection of electrophoretic mobility (which is a parameter related to the zeta potential) was
predicted [17] and translocation duration of polystyrene particles through a 3 µm long multi wall hollow
carbon nanotube was related to their mobility in the specific salt concentration and voltage [25-27].
Solid-state nanopores are subject of intense research as promising analytical tools [28], measurement of
zeta potential using them is not realized yet. In long and narrow cylindrical pores, or with flexible and
long chain-like analytes, there is a significant interaction between the translocating analyte and the pore
walls that can introduce deviation from the electrophoretic motion [29, 30]. Furthermore, due to
microscopic differences between the two flow cells on the two sides of the membrane, as well as the
electrodes, there is usually few millivolts offset voltage at zero current. Moreover, a minimum voltage is
needed for translocation, to overcome the entropic and energy barrier of the nanopore and make the
translocation probable [30-33]. Consequently, the translocation velocity-voltage curve generally has an
offset and is not going through the origin [30]. Moreover, low signal to noise ratio in thick membranes
[34] and lack of a physically meaningful definition of translocation duration [39] were preventing zeta
potential measurement by nanopore. Here, we present a reliable method that can be used to measure the
zeta potential and, consequently, the charge of nanometer-sized objects using a nanopore. This is done
using a sharp-edged pyramidal-shaped nanopore to minimize the pore-particle interaction and provide an
electrophoresis dominated translocation, while it gives a better field confinement as well [35], by using a
physically meaningful definition and a precise measurement of translocation duration, and by
elimination of the voltage offset by defining the mobility as derivative of the velocity-electric field curve

6
instead of ratio of the velocity to the field. Using this approach, several different nanometer sized object
have been analyzed in different conditions and the results were compared with commercial methods.
This method not only provides a fast and precise measurement of zeta potential of any nanoparticle
mixture even in low concentrations and small volumes; at different salt concentrations, particle sizes and
particle materials; this method provides perspectives for reliable detection and differentiation between
various particles including biological particles of similar size based on voltage dependence of
translocation duration, using a nanopore.
Operation principles The nanopore devices are composed of two microfluidic chambers separated by a membrane with a
nanopore that connects the two chambers (figure 1). A liquid fills these two chambers, one of which
contains the nanometer-sized analytes. By applying a voltage between these two chambers, an ionic
current flows from one chamber, through the nanopore, and into the other chamber. Furthermore, an
electric field is created and act on the particles near and inside the nanopore. This force can drive the
nanoparticles from one chamber, through the nanopore and into the other chamber. The temporary
presence of a nanoparticle in the nanopore changes the electrical resistance of the nanopore that can be
detected as a temporal change in the ionic current between the two chambers. Earlier theoretical
investigations based on the calculation of electrophoretic, electro-osmotic and drag forces have showed
the electrophoretic force to be the dominant force [36, 37]. In addition to the calculation of these forces
based on the measured dimensions, electrical properties and surface charges of our devices [38, 39], we
have also determined the electrothermal, gravitational and Brownian forces [40] using a continuum
model (see the supplementary information).
Our theoretical studies confirm the dominance of the electrophoretic force when the largest dimension
of the nanoparticle is sufficiently smaller than the pore size, nanoparticle are nearly spherical, with a

7
sharp pyramidal nanopore and thin electric double layer (EDL) compared to the pore size. Thus, the
electrophoretic and drag forces determine the translocation kinetics, and we can adopt the concept of
electrophoretic mobility. Accordingly, we can define the translocation mobility as:
trvE
µ ∂=∂ (1)
where tr
lvt
= is the average translocation speed,
VEl
= is the average electric field in the nanopore, V
is the applied voltage, trt is the measured translocation duration and l is the effective length of device’s
sensing zone, which is a calibration constant that depends on the device geometry and solution
conductivity. Although this length can be experimentally measured by measuring the translocation
duration of an analyte with a known zeta potential as a function of the applied voltage, our simulations
show the possibility of calculating it with sufficient precision (see supplementary information).
Previously, there were a few slightly different approaches for measuring the translocation duration, all
based on thresholding; the distance between the two adjacent crossing points of a threshold level, the
distance between the point that the signals leaves the baseline and the point that it returns to the baseline
[23], or considering the full width half max of the spike to reduce the effects of the limited bandwidth
[35, 20]. Although such definitions may reduce the effect of bandwidth, they have no physical meaning
and are prone to noise within the spike. Thus, we have developed a new definition for the spike’s
duration [39], which is least affected by the measurement bandwidth and noise, and most importantly has
a physical meaning. This definition considers the time that the center of nanoparticle enters the sensing
zone as the start of the spike and the time that its center leaves the sensing zone as the ending point. A
simple analytical calculation shows that these are the times at which the second derivation of the signal
reaches its maximum and minimum (figure 2).
8
Although classical definition of electrophoretic mobility is the ratio of velocity to electric field, it is
necessary to use the differential translocation mobility as the velocity-field curve is generally not going
through the origin and has an offset of tens of millivolts, as mentioned earlier. In addition to elimination
of voltage offset, as we will show in the next section, high precision can be achieved simply by
measuring the voltage dependence of translocation duration.
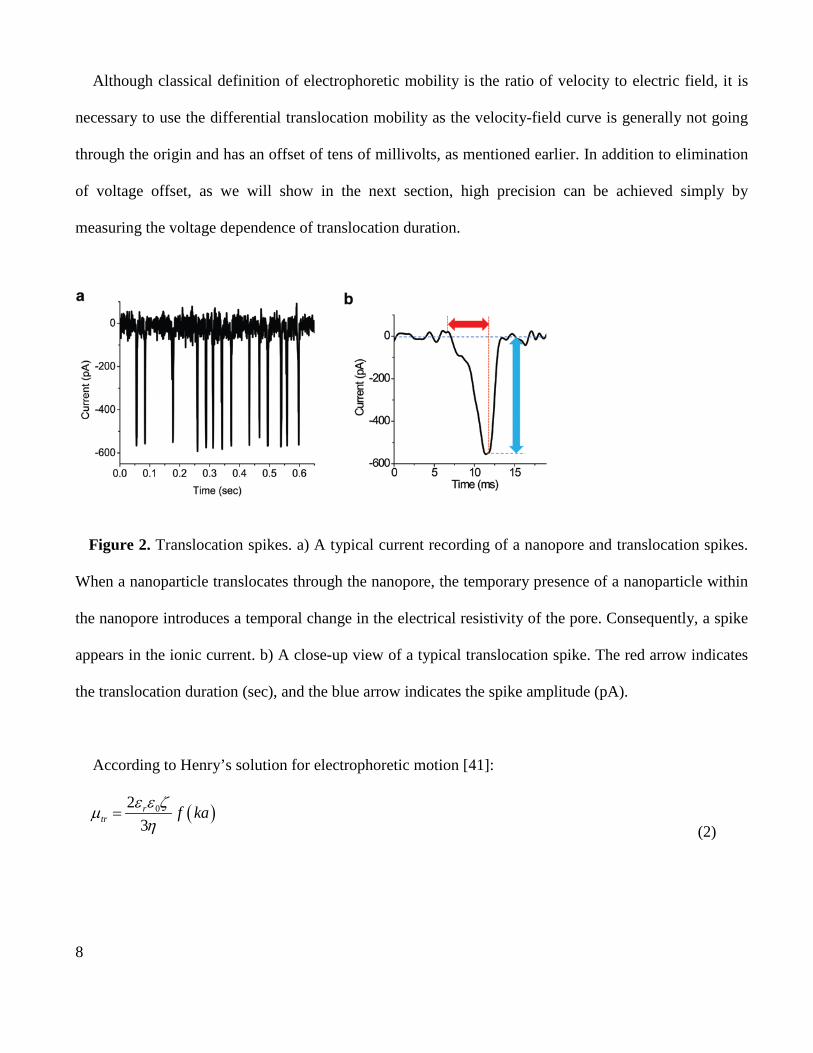
Figure 2. Translocation spikes. a) A typical current recording of a nanopore and translocation spikes.
When a nanoparticle translocates through the nanopore, the temporary presence of a nanoparticle within
the nanopore introduces a temporal change in the electrical resistivity of the pore. Consequently, a spike
appears in the ionic current. b) A close-up view of a typical translocation spike. The red arrow indicates
the translocation duration (sec), and the blue arrow indicates the spike amplitude (pA).
According to Henry’s solution for electrophoretic motion [41]:
( )023r
tr f kaε ε ζµη
= (2)
9
where 0rε ε is the solution permittivity, η is the solution viscosity, ζ is the zeta potential of the
particle. ( )f ka is a correction factor that depends on Debye length, k , and particle’s diameter, a ; and
can be curve fitted by the following equation:
( )( )( )1.13
2 13 2 1 0.072
f kaka
= −+
(3)
where
2 22
B
q z nkk Tε
∞=, q is the elementary charge, z is the valence of the EDL’s ions, n∞ is the bulk
solution concentration, Bk is the Boltzmann constant and T is the absolute temperature. For zeta
potentials of approximately 100 mV or higher, we can apply O’Brien’s correction factor [42], and for
jelly or porous particles, which are highly conductive, we can apply Dukhin’s correction factor [43].
Although these correction factors can improve measurement accuracy, in most practical cases and
applications, reasonably accurate results can be obtained without them. Because 1ka >> in our nanopore
devices, we can use Smoluchowski’s approximation [44] and simply write:
0rtr
ε ε ζµη
= (4)
Using equation (4) and the aforementioned parameters, the following relation between the average
translocation velocity, translocation mobility, zeta potential and the measured translocation duration can
be obtained:
1Tr
v l t = ,
( )12 Trtl
Vµ
∂=
∂ ,
( )2 1
0
Trt
r
lV
ηζε ε
∂=
∂ (5)
( )2
0Tr
r
ltV C
ηζε ε
=+ (6)
where C is an integration constant that is the voltage offset.
10
Knowing the zeta potential, we can use Graham’s equation to calculate the surface charge density of
the particles [44, 45]:
08 sinh2r B
B
zqn K Tk Tζσ ε ε∞
=
(7)
In most of the cases in which the zeta potential is smaller than 100 mV, equation (7) can be
approximated with good precision by the following linear equation:
0
0
r
r Bk Tqzn
ε ε ζσε ε
∞
= (8)
Accordingly, by measuring the zeta potential, we can measure the surface charge density of a
nanometer-sized object using a nanopore.
Zeta potential measurements We applied the zeta potential measurement method to tens of different nanometer-sized objects with
different sizes and zeta potentials that were composed of biological or synthetic materials. We used gold,
polystyrene, and silica nanoparticles with diameters ranging from 20 to 100 nm. To have a wider range
of particles with different properties and zeta potentials, the nanoparticles were capped with citrate
(C3H5O(COO)33-), carboxyl (COOH), amine (NH2), 1-mercapto-11-undecyl-tri (ethylene glycol)
(SH(CH2)11(OCH2CH2)3OH), its carboxyl derivative (SH(CH2)11(OCH2CH2)6COOH), and
deoxyribonucleic acid (DNA) linked with 5’-mercaptohexanol.
Measurements were performed using different nanopore devices measuring approximately 120 nm in
width and 720 nm in length in 20 x 20 μm membranes. Most of the investigations and measurements
were performed in 30 mM potassium chloride (KCl) solutions. Some of the particles that were stable at
higher ionic concentrations (see the supplementary information) were investigated and measured at such
concentrations as well.
11
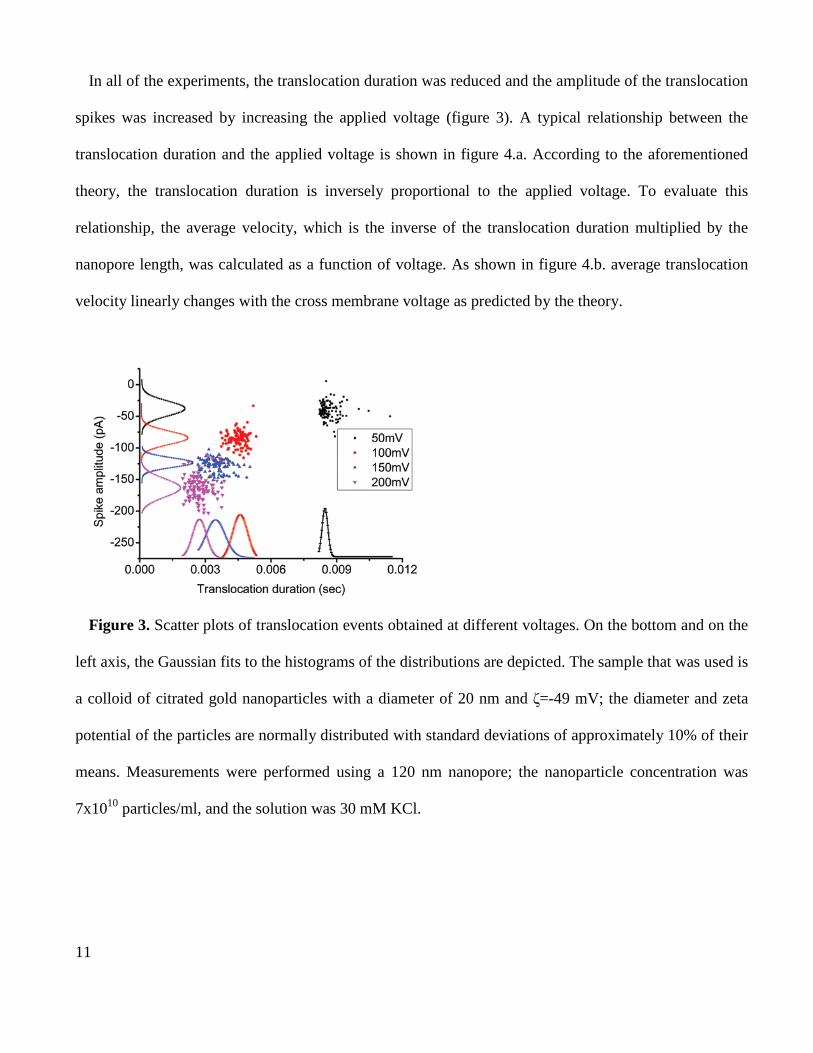
In all of the experiments, the translocation duration was reduced and the amplitude of the translocation
spikes was increased by increasing the applied voltage (figure 3). A typical relationship between the
translocation duration and the applied voltage is shown in figure 4.a. According to the aforementioned
theory, the translocation duration is inversely proportional to the applied voltage. To evaluate this
relationship, the average velocity, which is the inverse of the translocation duration multiplied by the
nanopore length, was calculated as a function of voltage. As shown in figure 4.b. average translocation
velocity linearly changes with the cross membrane voltage as predicted by the theory.
Figure 3. Scatter plots of translocation events obtained at different voltages. On the bottom and on the
left axis, the Gaussian fits to the histograms of the distributions are depicted. The sample that was used is
a colloid of citrated gold nanoparticles with a diameter of 20 nm and ζ=-49 mV; the diameter and zeta
potential of the particles are normally distributed with standard deviations of approximately 10% of their
means. Measurements were performed using a 120 nm nanopore; the nanoparticle concentration was
7x10¹⁰ particles/ml, and the solution was 30 mM KCl.

12
Figure 4. Voltage dependence of the translocation kinetics. a) Translocation duration as a function of
the applied voltage for SH(CH2)11PEO6COOH coated gold nanoparticles with 50 nm diameter and ζ=-38
mV; the diameters and zeta potentials of the particles are normally distributed with standard deviations
of approximately 10% of their mean values. Measurements were performed using a 120 nm nanopore;
the nanoparticle concentration was 7x10¹⁰ particles/ml, and the solution was 30 mM KCl. The error bars
show the standard errors of the population of the recorded translocation spikes. b) The average
translocation velocity as a function of the applied voltage calculated by dividing the nanopore length by
the translocation duration, and removing the voltage offsets (see supplementary information).
As mentioned previously, the velocity-voltage curves may shift from one device to another or from
one sample to another; however, the slopes of these curves are not affected by these shifts. Thus, the
slope represents a more precise and reliable parameter for the measurements. Translocation mobility can
be calculated by multiplying the slope of the velocity-voltage curve by a constant number, as described
by equation (5). A linear relationship between the translocation mobility and the zeta potential measured
by DLS has been found (see supplementary figure 6) which is in agreement with the theory. As predicted
by the theory, the translocation mobility is independent of nanoparticle size (see supplementary figure
5).

13
Finally, equation (5) was used to extract the zeta potential of the nanoparticles having their mobility
and the results are compared with the zeta potential of the same particles measured under similar
conditions by DLS (figure 5). As shown in this figure, the nanopore technique provides a simple and
advantageous method of measuring the zeta potential of nanometer-sized objects. According to equations
(7) and (8), knowing the zeta potential of a nanoparticle gives the particle’s surface charge.
Figure 5. Zeta potential of the nanoparticles measured by the nanopore device versus the zeta potential
of the same particles measured by a commercial DLS system. Error bars show the distribution in the
population; the measurement precision is on the order of millivolts. Blue line shows the translocation
mobility as predicted by the theory and dotted lines are showing the approximated dispersion due to the
dispersion in zeta potential of different particles.
Conclusion We have introduced a novel method for measuring the zeta potential and, consequently, the surface
charge of nanometer-sized objects suspended in a liquid. Because this method is based on a nanopore
technique, it does not require labeling and functions with optically active and inactive as well as opaque

14
and transparent samples; it requires only very small sample volumes and concentrations and no prior
knowledge of analytes. This simple method not only enables the precise measurement of the zeta
potential of nanometer-sized analytes using a nanopore technique, it also allows for the detection of and
differentiation between analytes based on surface charge. Measuring the voltage dependence of the
translocation spikes also enhances the precision, reliability and repeatability of size measurements and
reduces the need for calibration according to size. Hereby, the nanopore technique has been improved to
provide an inexpensive charge and size spectroscopy technique capable of characterizing analytes in
their natural liquid environments in small amounts and over a short period of time.
Materials and methods
Device fabrication We have previously described the fabrication process of similar pores [45]. Briefly, a pit was etched
through the back side of silicon on insulator wafer (SOI, 720 nm Si on 1 µm buried SiO2 on 700 µm Si)
by potassium hydroxide (KOH) wet etching to produce a 20 x 20 µm membrane on the front side of the
wafer that consists of 720 nm Si on 1 µm SiO2. A nanopore patterned by an electron beam lithography
(EBL) process [46] and etched away through the 720 nm thick of the front side’s silicon by anisotropic
KOH wet etching, followed by buffered hydrofluoric acid (BHF) wet etching to remove the 1 µm buried
oxide and open the nanopore. The device was packaged between two microfluidic flow cells, which
provide inlets and outlets for fluids, visual access, and Ag/AgCl electrodes for electrical contacts.
Measurement setups We have used an Axopatch 200B (Axon Instruments) patch clamp amplifier to apply the desired
voltage and measure the current. A MiniDigi (Molecular Devices) was used for digitization and a
pCLAMP 10 (Molecular Devices) was used for data acquisition. All measurements were performed in a
Faraday cage on an antivibration table in a dark room.
15
Sample preparation Commercially obtained citrated, carboxyl-capped and amine-capped gold nanoparticles (Ted Pella),
silica nanoparticles (Keiser Biotech) and polystyrene nanoparticles (Interfacial Dynamics) with
concentrations ranging from 5x10⁹ particles/ml to 7x10¹¹ particles/ml were diluted 5 to 200 times in the
desired KCl aqueous solutions. The thiol- and DNA-capping processes and the investigation of the
stability of these functionalized particles are described elsewhere [47]. We used 30 mM KCl for all of
the particles. In addition, for highly stable particles, such as thiolated particles, the experiment was
repeated at higher ionic concentrations. Some of the measurements were also repeated at lower ionic
concentrations.
Signal processing All signals were low-pass filtered by a 10 kHz 4-pole Bessel analog built-in filter in the amplifier. We
developed a software specifically for nanopore signal processing [39]. This software first reduces the
noise in the signal by a 5 kHz 8-pole Gaussian low-pass filter and using Bior3.9 wavelet for wavelet
denoising. Then, it removes the baseline by fitting a two component exponential. Thereupon, it detects
any fluctuation which is more than six times larger than noise RMS and uses a selection algorithm to
find the translocation signals. Finally, it uses the local maxima and minima of the second derivative of
the signal to find the starting and ending point of each spike; and reports all the parameters related to
each spike in a tab-delimited file.
Acknowledgements
The authors thank Gert Matthijs for useful discussions and suggestions on biological materials; Hilde
and Karolien Jans for discussions and in preparation of the used colloids, investigation of their stability
and DLS measurements.

16
Supporting information available Size measurement, Stability study of the nanoparticles, Calculating the forces acting in a nanopore,
Simulating the current spikes, Mobility-size and mobility-zeta potential relations. This material is
available free of charge via the Internet at
http://pubs.acs.org.
References 1. Venkatesan, B. M.; Bashir, R. Nanopore sensors for nucleic acid analysis. Nature Nanotechnology
2011, 6, 615-624.
2. Bowen, W. R.; Hall, N. J.; Pan, L.C.; Sharif, A. O.; Williams, P. M. The relevance of particle size
and zeta-potential in protein processing. Nature Biotechnology 1998, 16, 785-487.
3. Hamley, I. W. Block Copolymers in Solution: Fundamentals and Applications. John Willy and
sons: 2005.
4. Drummond, T. G.; Hill, M. G.; Barton, J. K. Electrochemical DNA sensors. Nature biotechnology
2003, 21, 1192-1199.
5. Franzman, M. A.; Schlenker, C. W.; Thompson, M. E.; Brutchey R. L. Solution-Phase Synthesis of
SnSe Nanocrystals for Use in Solar Cells. J. Am. Chem. Soc. 2010, 132, 4060–4061.
6. Nohynek, G. J.; Lademann, J.; Ribaud, C.; Roberts M. S. Grey Goo on the Skin? Nanotechnology,
Cosmetic and Sunscreen Safety. Crit. Rev. Toxicol. 2007, 37, 251-277.
7. Sugahara, K. N.; Teesalu, T.; Karmali, P. P.; Kotamraju, V. R.; Agemy, L.; Girard, O. M.; Hanahan,
D.; Mattrey, R. F.; Ruoslahti, E. Tissue-Penetrating Delivery of Compounds and Nanoparticles into
Tumors. Cancer Cell 2009 16, 510-520.

17
8. Shendure, J.; Mitra, R.; Varma, C.; Church, G. M. Advanced Sequencing Technologies: Methods
and Goals. Nature Rreviews Genetics 2004, 5, 335–345.
9. Berne, B. J.; Pecora, R. Dynamic light Scattering: with Applications to Chemistry, Biology and
Physics. General Publishing Company: 2000.
10. Bondoc, L. L.; Fitzpatrick, S. Size distribution analysis of recombinant adenovirus using disc
centrifugation. J. Ind. Microbiol. Biotechnol. 1998, 20(6), 317–322.
11. Giddings, J. C. Field-flow fractionation: analysis of macromolecular, colloidal, and particulate
materials. Science 1993, 260 (5113), 1456–1465.
12. Dosramos, J. G.; Silebi, C. A. An analysis of the separation of submicron particles by capillary
hydrodynamic fractionation (CHDF). J. of Colloid and Interf. Sci. 1989, 133(2), 302–320.
13. Sperling, R. A.; Liedl, T.; Duhr, S.; Kudera, S.; Zanella, M.; Lin, C. A. J.; Chang, W. H.; Braun,
D.; Parak, W. J. Size Determination of (Bio)conjugated Water-Soluble Colloidal Nanoparticles: A
Comparison of Different Techniques. J. Phys. Chem. C 2007, 111(31), 11552–11559.
14. Albert, B.; Bray, D.; Lewis, M.; Raff, M.; Robert, K.; Watson, D.J. Molecular Biology of the Cell.
Garland, New York, 1994.
15. Roberts, G. S.; Wood, T. A.; Frith, W. J.; Bartlett, P. Direct measurement of the effective charge in
nonpolar suspensions by optical tracking of single particles. J. Chem. Phys. 2007, 126, 194503-1 –
194503-12.
16. Seaman, G. V. F.; Knox, R. J. Particle electrophoresis for quality assurance and process control.
Electrophoresis 2001, 22, 373–385.

18
17. DeBlois, R. W.; Bean, C. P.; Wesley, R. K. A. Electrokinetic measurements with submicron
particles and pores by the resistive pulse technique. J. colloid interf. Sci. 1977, 61, 323-335.
18. Robertson, J. W. F.; Rodrigues, C. G.; Stanford, V. M.; Rubinson; K. A., Krasilnikov; O. V.;
Kasianowicz, J. J. Single-molecule mass spectrometry in solution using a solitary nanopore. Proceedings
of National Academy of Science 2007, 104, 8207-8211.
19. Clarke, J.; Wu, H. C.; Jayasinghe, L.; Patel, A.; Reid, S.; Bayley, H. Continuous base identification
for single-molecule nanopore DNA sequencing. Nature Nanotechnology 2009, 4, 265-270.
20. Fraikin, J. L.; Teesalu, T.; McKenney, C. M.; Ruoslahti, E.; Cleland, A. N. A high-throughput
label-free nanoparticle analyser. Nature Nanotechnology 2011, 6, 308–313.
21. Smeeth, R. M. M.; Keyser, U. F.; Krapf, D.; Wu, M. Y.; Dekker, N. H.; Dekker, C. Salt
dependence of ion transport and DNA translocation through solid-state nanopore. Nano letters 2006, 6,
89-95.
22. Reiner, J. E.; Kasianowicz, J. J.; Nablo, B. J.; Robertson, J. W. F. Theory of polymer analysis
using nanopore-based single-molecule mass spectrometry. Proceedings of National Academy of Science
2010, 107, 12080-12085.
23. Chang, C.; Venkatesan, B.M.; Iqbal, S.M.; Andreadakis, G.; Kosari, F.; Vasmatzis, G.; Peroulis,
D.; Bashir, R. DNA counterion current and saturation examined by a MEMS-based solid state nanopore
sensor, Biomed Microdevices 2006, 8, 263–269.
24. Willmott, G.; Vogel, R.; Yu, S.S.C.; Groenewegen, L.; Roberts, G.S.; Kozak, D.; Anderson, W.;
Trau, M. Use of tunable nanopore blockade rates to investigate colloidal dispersions, J. Phys.: Condens.
Matter 2010, 22, 454116-27.

19
25. Ito, T.; Sun, L.; Henriquez, R.R.; Crooks, R.M. A Carbon Nanotube-Based Coulter Nanoparticle
Counter, Acc. Chem. Res. 2004, 37, 937-945.
26. Ito, T.; Sun, L.; Crooks, R.M. Simultaneous determination of the size and surface charge of
individual nanoparticles using a carbon nanotube-based coulter counter. Anal. Chem. 2003, 75(10):
2399-2406.
27. Ito, T.; Sun, L.; Bevan, M.A.; Crooks, R.M. Comparison of Nanoparticle Size and Electrophoretic
Mobility Measurements Using a Carbon-Nanotube-Based Coulter Counter, Dynamic Light Scattering,
Transmission Electron Microscopy, and Phase Analysis Light Scattering. Langmuir 2004, 20, 6940-
6945.
28. Dekker, C. Solid-state nanopores, Nature Nanotechnology 2007, 2, 209 – 215.
29. Keyser, U.; Koeleman, B.; Van Dorp, S.; Krapf, D.; Smeets, R.; Lemay, S.; Dekker, N.; Dekker, C.
Direct force measurements on DNA in a solid-state nanopore. Nature Physics 2006, 2, 473–477.
30. Bacri, L.; Oukhaled, A.G.; Patriarche, G.; Bourhis, E.; Gierak J.; Pelta J.; Auvray, L. Dynamics of
Colloid in Single Solid-State Nanopore, J. Phys. Chem. 2011, 115, 2890-2898.
31. Houpaniemi, I.; Luo, K.; Ala-Nissila, T.; Ying, S.C. Langevin dynamics simulations of polymer
translocation through nanopore, J. Chem. Phys. 2006, 125, 124901-9.
32. Dubbeldam, J.L.A.; Milchev, A.; Rostiashvili, V.G.; Vilgis, T.A. Polymer translocation through a
nanopore: a showcase of anomalous diffusion, Phys. Rev. E 2007, 76, 010801-4.
33. Wong, C.T.A., Muthukumar, M. Polymer capture by electro-osmotic flow of oppositely charged
nanopores, J. Chem. Phys. 2007, 126, 164903-8.
20
34. Wanunu, M.; Dadosh, T.; Ray, V.; Jin, J.; McReynolds, L.; Drndic, M. Rapid electronic detection
of probe-specific microRNAs using thin nanopore sensors. Nature Nanotechnology 2010, 5, 807-814.
35. Lan, W.J.; Holden, D.A.; Zhang, B.; White, H.S. Nanoparticle Transport in Conical-Shaped
Nanopores, Anal. Chem. 2011, 83, 3840–3847.
36. van Dorp, S.; Keyser, U. F.; Dekker, N. H.; Dekker, C.; Lemay, S. G. Origin of the electrophoretic
force on DNA in solid-state nanopores. Nature Physics 2009, 5, 347-351.
37. Chang, H.; Kosari, F.; Andreadakis, G.; Alam, M. A.; Vasmatzis, G.; Bashir, R. DNA-Mediated
Fluctuations in Ionic Current through Silicon Oxide Nanopore Channels. Nano Letters 2004, 4, 1551-
1556.
38. Kox, R.; Deheryan, S.; Chen, C.; Arjmandi, N.; Lagae, L.; Borghs, G. Local solid-state
modification of nanopore surface charges. Nanotechnology 2010, 21, 335703- 115710.
39. Arjmandi, N.; Van Roy, W.; Lagae, L.; Borghs, G. Improved Methods for Nanopore Signal
Processing, to be published in Proc. Nanopore Conference, Lanzarote, Spain 2012.
40. Castellanos, A.; Ramos, A.; González, A.; Green, N. G.; Morgan, H. Electrohydrodynamics and
dielectrophoresis in microsystems: scaling laws. J. Phys. D: Appl. Phys 2003, 36, 2584-2596.
41. Masliyah, J. H.; Bhattacharjee, S. Electrokinetic and colloid transport phenomena. John Wiley and
sons: 2006.
42. O'Brien, R. W.; White, L. R. Electrophoretic mobility of a spherical colloidal particle. J. Chem.
Soc. Faraday Trans. 1978, 2, 1607-1626.
21
43. Dukhin, S. S.; Derjaguin, B. V. Electrokinetic phenomenasurface and colloid science. John Wiley
and sons: 1974.
43. Hans-Jurgen, B.; Graf, K.; Kappl, M. Physics and Chemistry of Interfaces. Wiley-VCH: 2006.
44. Loeb, A. L.; Overbeek, J. T. G.; Wiersema, P. H. The Electrical Double Layer Around a Spherical
Colloid Particle. J. Electrochem. Soc. 1961, 108, 269C-269C.
45. Arjmandi, N.; Liu, C.; Van Roy, W.; Lagae, L.; Borghs, G. Micro Flow Sensors Based on
Electrical Impedance of Metal-Liquid interface. Microfluidics Nanofluidics 2012, 12, 17–23.
46. Arjmandi, N.; Van Roy, W.; Lagae, L.; Borghs, G. Enhanced resolution of poly (methyl
Methacrylate) electron resist by thermal processing. J. Vac. Sci. Technol. B 2009, 27, 1915-1918.
47. Jans, H.; Stakenborg, T.; Jans, K.; Van de Broek, B.; Peeters, S.; Bonroy, K.; Lagae, L.; Borghs G.;
Maes, G. Increased stability of mercapto alkane functionalized Au nanoparticles towards DNA sensing.
Nanotechnology 2010, 21, 285608-285616.

22
Supplementary information
Size measurement It has been previously shown that the amplitudes of the translocation spikes can be used to calculate
the sizes of the translocating analytes [1]. We observed a linear relationship between the spike amplitude
and the applied voltage (supplementary figure 1). This demonstrates the fact that in the working region
of the nanopore device, a nanopore-nanoparticle complex acts as a linear resistor. We defined the
translocation resistance as the inverse slope of the spike amplitude-voltage curve, which is an
advantageous parameter in measuring analyte size. Amplitude-voltage curves may shift from one device
to another or even from one sample to another. These shifts are caused by the offset voltage between the
two sides of the nanopore that originates from the inequalities between the two sides, variations in the
surface of the nanopore and variations in the properties of the suspending liquid. These shifts reduce the
precision of size measurements using the spike amplitude and introducing the need for frequent
calibration of the device. This voltage offset can be approximated by measuring the voltage at which the
ionic current between the two chambers is zero. However, it is easier and more precise to use
translocation resistance instead of spike amplitude to measure the analyte size. Because the translocation
resistance is not affected by these shifts and is independent of the applied voltage, it can be used as a
more precise and reliable parameter for measuring the sizes of nanoparticles. The spike amplitude and
the translocation resistance are functions of the solution composition, nanoparticle charge and material
composition [2-5]. Consequently, it is necessary for size measurements to calibrate the device with
nanoparticles with known diameters that are composed of a material similar to the analyte material and
that are suspended in similar solutions.

23
Supplementary figure 1. The amplitudes of the translocation spikes as a function of the applied voltage.
Measurements were performed with a 120 nm nanopore in 300 mM KCl. The samples were citrated gold
nanoparticles with different sizes and zeta potentials. The standard deviation of the size and zeta
potential of the particle population is approximately 10% of the corresponding mean values. The error
bars show the standard errors of the population of the recorded translocation spikes.
Stability of the nanoparticles If the nanoparticles coagulate, the resulting coagulations will be larger than the individual particles.
Thus, the probability of these large coagulations being translocated through the nanopore will be very
small. In addition, because the nanopore is kept vertical during the measurement, the large coagulations
that settle more quickly do so far away from the nanopore, at the bottom of the microfluidic chamber.
However, particles that are much smaller than the nanopore may produce relatively small coagulations
that can translocate through the pore and that have sedimentation time constants that may be much
longer than the duration of the experiment. Thus, for a clearly understood and well-controlled
experiment and to ensure that the properties of the samples do not change during an experiment, we have
precisely investigated the stability of different nanoparticles. To do so, the theory of Brownian collision
was used to calculate the characteristic time between two collisions [6, 7]. This time was found to be on
24
the order of one hour for the concentrations and particles we used, whereas the ionic current recording
lasts only a few seconds, and the entire measurement lasts approximately one minute. In addition,
Woodcock’s theory was used to calculate the average surface-to-surface distance between the particles
[7]. For the conditions used in our experiments, the distance was found to be on the order of
micrometers, which is much larger than the range within which van der Waals force can act and produce
coagulations. Furthermore, the stability of the samples was experimentally verified using DLS by
measuring the zeta potential and size of the particles as a function of time.
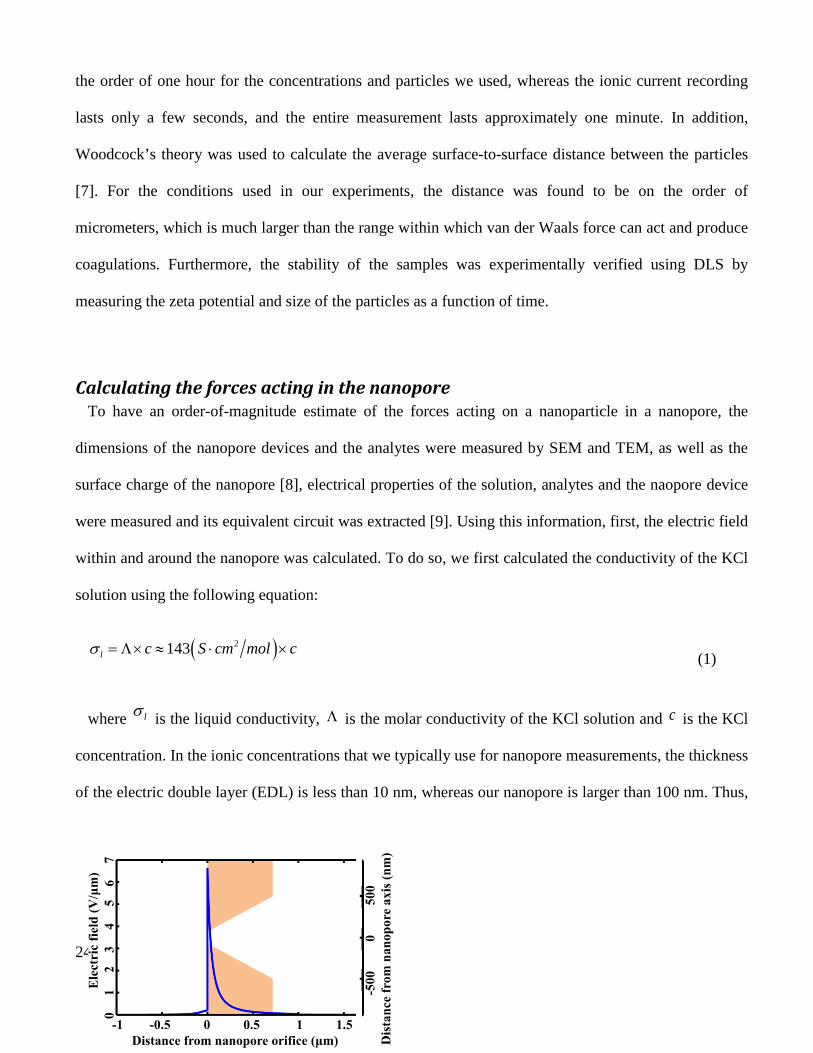
Calculating the forces acting in the nanopore To have an order-of-magnitude estimate of the forces acting on a nanoparticle in a nanopore, the
dimensions of the nanopore devices and the analytes were measured by SEM and TEM, as well as the
surface charge of the nanopore [8], electrical properties of the solution, analytes and the naopore device
were measured and its equivalent circuit was extracted [9]. Using this information, first, the electric field
within and around the nanopore was calculated. To do so, we first calculated the conductivity of the KCl
solution using the following equation:
( )2143l c S cm mol cσ = Λ× ≈ ⋅ × (1)
where lσ is the liquid conductivity, Λ is the molar conductivity of the KCl solution and c is the KCl
concentration. In the ionic concentrations that we typically use for nanopore measurements, the thickness
of the electric double layer (EDL) is less than 10 nm, whereas our nanopore is larger than 100 nm. Thus,

25
we are in the Smoluchowski regime and can neglect the surface conduction of the nanopore [8].
Consequently, we can numerically calculate the electric field within the nanopore device (supplementary
figure 2) by integrating over the liquid’s volume.
Supplementary figure 2. The calculated electric field along the axis of a 120 x 120 nm nanopore filled
with 30 mM KCl when 100 mV is applied between the two sides of the nanopore. The orange shadow
represents the cross section of the nanopore in order to show its position.
Knowing the electric field within the nanopore, we can calculate the forces involved, which are
governed by the following equations [10]:
Drag: 6 ( )dragF a U Vπη= − (2)
Electrothermal: 2 21 1Re .2 4EF E Eσ ε ε σ ε
σ∇ − ∇ = − ∇
(3)
Brownian: 2x D t∆ = ∆ (4)
Gravitational: ( )g p lF gυ ρ ρ= − (5)
Dielectrophoretic: ( )3 2ReDEP lF a K Eπ ε ω′= ∇ where
( )Re Re2
l
l
K ε εωε ε
−= +
(6)
where η is the viscosity of the liquid, a is the nanoparticle diameter, U is the nanoparticle velocity,
V is the liquid velocity, E is the electric field, D is the diffusion coefficient of the nanoparticles, x∆ is
the distance traveled during the time t∆ due to Brownian motion, υ is the nanoparticle volume, pρ is

26
the nanoparticle mass density, lρ is the liquid mass density, g is the gravity constant, lε is the liquid
permittivity with real part lε ′ and ε is the effective permittivity of the nanoparticle.
Because of the equal ionic concentration between the two sides of our nanopore, the diffusiophoresis
force is zero. Because we are working in a DC regime, the AC electroosmotic force is zero as well. The
electroosmotic force is calculated according to the model described in [11]. Supplementary figure 3.a
shows the driving forces acting on a nanoparticle along the nanopore’s axis. As shown in this figure, the
electrophoretic force is dominant, and the other acting forces are negligible.
Supplementary figure 3. Force fields and velocity that a nanoparticle experiences within a nanopore. a)
The forces acting on the nanoparticle as a function of its position on the axis of the nanopore. As shown
in the figures, the force fields extend out of the nanopore, and the main driving force is the
electrophoretic force. b) The nanoparticle velocity calculated as a function of its position. Calculations
were performed for a 40 nm citrated gold nanoparticle with ζ=-40 mV translocating through a 120 nm
pyramidal nanopore covered with silicon dioxide and filled with 30 mM KCl solution. The orange
shadows represent the cross section of the nanopore in order to show its position.
Forc
e (p
N)
-600
-
200
0
200
Velo
city
(mm
/s)
-30
-2
0
-
10
0
-1 -0.5 0 0.5 1 1.5Distance from nanopore orifice (μm)
-1 -0.5 0 0.5 1 1.5Distance from nanopore orifice (μm)
-500
0
500
Dis
tanc
e fro
m n
anop
ore a
xis (
nm)a b
27
After calculating the total forces acting on the nanoparticle, we used Stoke’s law [10] to calculate the
nanoparticle’s speed as a function of its position during translocation through the nanopore
(supplementary figure 3.b).
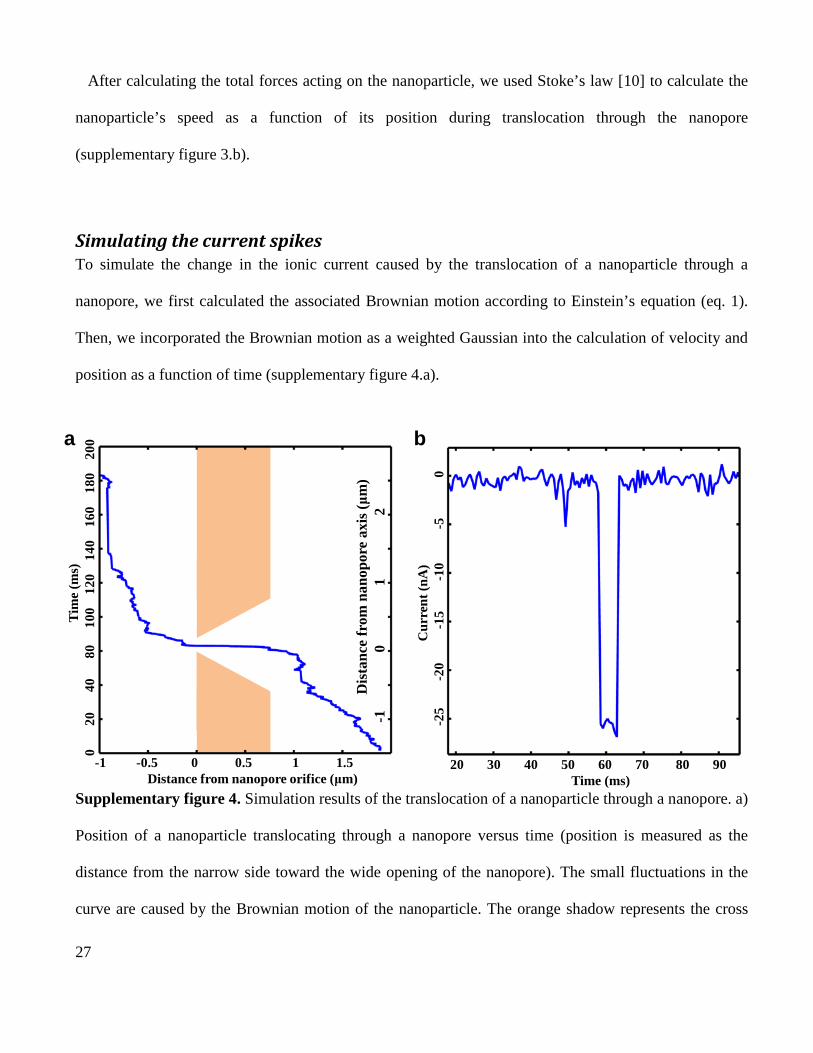
Simulating the current spikes To simulate the change in the ionic current caused by the translocation of a nanoparticle through a
nanopore, we first calculated the associated Brownian motion according to Einstein’s equation (eq. 1).
Then, we incorporated the Brownian motion as a weighted Gaussian into the calculation of velocity and
position as a function of time (supplementary figure 4.a).
Supplementary figure 4. Simulation results of the translocation of a nanoparticle through a nanopore. a)
Position of a nanoparticle translocating through a nanopore versus time (position is measured as the
distance from the narrow side toward the wide opening of the nanopore). The small fluctuations in the
curve are caused by the Brownian motion of the nanoparticle. The orange shadow represents the cross
-1 -0.5 0 0.5 1 1.5Distance from nanopore orifice (μm)
Tim
e (m
s)0
20
40
80
100
1
20
140
1
60
180
2
00
20 30 40 50 60 70 80 90Time (ms)
Cur
rent
(nA
)-2
5
-2
0
-15
-10
-5
0a b
Dis
tanc
e fr
om n
anop
ore
axis
(μm
)-1
0
1
2

28
section of the nanopore in order to show its position. b) Change in the ionic current caused by
translocation of a nanoparticle through the nanopore as a function of time. Calculations were performed
for a 40 nm citrated gold nanoparticle withζ=-40 mV that was translocated through a 120 nm pyramidal
nanopore covered with silicon dioxide and filled with a 30 mM KCl solution.
We calculated the ionic current that passes through the nanopore taking into account the conduction
current through the liquid, the conduction current through the electric double layers (EDL) of the
nanopore and the nanoparticle. We also calculated the electrical noise of the amplifier according to the
manufacturer’s specifications and our measurements and added it to the simulated current. Finally, the
simulated current was sampled to make the results more similar to the experimental setup
(supplementary figure 4.b). Because of the lack of precise knowledge about some of the parameters,
such as the conduction within EDLs and the approximations used, there is a difference between the
measurement and simulation results. However, the results are in agreement with the experimental
measurement within an order of magnitude precision. For instance, the calculated length of sensing zone,
l , is 1.15 µm while the measured length in similar conditions is 1 µm (the length of the sensing zone can
be measured by measuring the voltage dependence of translocation duration of a particle of known
charge, using equation 5 of the main text).
Mobility-diameter and mobility-zeta potential relations As predicted by theory and confirmed by the measurements (supplementary figure 5), no relation
between the translocation mobility and nanoparticle size has been found and the translocation mobility
varies linearly with the zeta potential (Supplementary figure 6).

29
Supplementary figure 5. The translocation mobilities measured by nanopore versus particle diameters
measured by DLS.
Supplementary figure 6. Translocation mobility as a function of the zeta potential. Different
nanoparticles measured by 120 x 120 nm nanopore devices. Solid blue line shows the translocation
mobility as predicted by the theory and dotted lines are showing the theoretically estimated dispersions
due to the dispersion in zeta potential of different particles. Error bars are representing standard
deviation of distributions of zeta potential and translocation mobility in the samples.
0 20 40 60 80 1000.0
0.5
1.0
1.5
2.0
2.5
3.0M
obilit
y (µ
m2 /m
V.se
c)
Diameter (nm)

30
References 1. Fraikin, J. L.; Teesalu, T.; McKenney, C. M.; Ruoslahti, E.; Cleland, A. N. A high-throughput label-
free nanoparticle analyser. Nature Nanotechnology 2011, 6, 308–313.
2. Smeeth, R. M. M.; Keyser, U. F.; Krapf, D.; Wu, M. Y.; Dekker, N. H.; Dekker, C. Salt dependence
of ion transport and DNA translocation through solid-state nanopore. Nano letters 2006, 6, 89-95.
3. Reiner, J. E.; Kasianowicz, J. J.; Nablo, B. J.; Robertson, J. W. F. Theory of polymer analysis using
nanopore-based single-molecule mass spectrometry. Proceedings of National Academy of Science 2010,
107, 12080-12085.
4. Ai Y.; Qian, S. Electrokinetic translocation through a nanopore. Phys Chem. Chem. Phys 2011, 13,
4060-4071.
5. Chang, C.; Venkatesan, B.M.; Iqbal, S.M.; Andreadakis, G.; Kosari, F.; Vasmatzis, G.; Peroulis, D.;
Bashir, R. DNA counterion current and saturation examined by a MEMS-based solid state nanopore
sensor, Biomed Microdevices 2006, 8, 263–269.
6. Dukhin, S. S.; Derjaguin, B. V. Electrokinetic Phenomena in Surface and Colloid Science. John
Wiley and sons: 1974.
7. Hosokawa, M.; Nogi, K.; Naito, M.; Yokoyama, T. Nanoparticle Technology Handbook. Elsevier:
2007.
8. Kox, R.; Deheryan, S.; Chen, C.; Arjmandi, N.; Lagae, L.; Borghs, G. Local solid-state modification
of nanopore surface charges. Nanotechnology 2010, 21, 335703- 115710.
9. Arjmandi, N.; Van Roy, W.; Lagae, L.; Borghs, G. Improved Methods for Nanopore Signal
Processing, to be published in Proc. Nanopore Conference, Lanzarote, Spain 2012.
31
10. Castellanos, A.; Ramos, A.; Gonz´alez, A.; Green N. G.; Morgan, H. Electrohydrodynamics and
dielectrophoresis in microsystems: scaling laws. J. Phys. D: Appl. Phys. 2003, 36, 2584–2597.
11. van Dorp, S.; Keyser, U. F.; Dekker, N. H.; Dekker C.; Lemay, S. G. Origin of the electrophoretic
force on DNA in solid-state nanopores. Nature Physics 2009, 5, 347-351.