measuring the economic success of florida 's graduates measuring the economic success of...
TRANSCRIPT

Prepared by Mark SchneiderPresident, College MeasuresVice President and Institute Fellow, American Institutes for Research
Economic Security Report 2017
Measuring the Economic Successof Florida's Graduates
December 2017

Measuring the Economic Success of Florida’s Graduatesii
CONTENTS
EXECUTIVE SUMMARY ��������������������������������������������������������������������������������������������������� 1
Florida College System and District Technical Centers ������������������������������������������������������2
State University System of Florida Degrees and Florida College System Bachelor’s Degrees �����3
Where the Jobs Are ���������������������������������������������������������������������������������������������������4
INTRODUCTION ������������������������������������������������������������������������������������������������������������ 6
FLORIDA COLLEGES AND DISTRICT TECHNICAL CENTERS ������������������������������������������������������ 7
VARIATION IN FIRST-YEAR EARNINGS OF GRADUATES WITH ASSOCIATE DEGREES �������������������10
Associate in Arts Degree ������������������������������������������������������������������������������������������ 10
Associate in Science Degree �������������������������������������������������������������������������������������� 12
Employment Outcomes of Graduates With A�S� Degrees ���������������������������������������������� 14
What Students Study Matters �������������������������������������������������������������������������������� 16
Associate in Applied Science Degree ��������������������������������������������������������������������������� 19
Debt Levels by College ��������������������������������������������������������������������������������������������� 24
CAREER CERTIFICATES AND COLLEGE CREDIT CERTIFICATES ������������������������������������������������26
Career Certificates �������������������������������������������������������������������������������������������������� 26
Career Certificates Awarded by District Technical Centers �������������������������������������������� 27
Career Certificates Awarded by the Florida College System ������������������������������������������ 32
College Credit Certificates ���������������������������������������������������������������������������������������� 33
LEVELS OF PUBLIC ASSISTANCE ������������������������������������������������������������������������������������36
Completers With Career Certificates Who Received Public Assistance �������������������������������� 37
Completers With College Credit Certificates Who Received Public Assistance ����������������������� 41

Economic Security Report 2017 iii
DEGREES AND FIRST-YEAR EARNINGS AMONG GRADUATES FROM FLORIDA’S UNIVERSITIES ������42
First-Year Earnings of Graduates With Bachelor’s Degrees ����������������������������������������������� 44
Variation by University ���������������������������������������������������������������������������������������� 44
Variation by Fields of Study ���������������������������������������������������������������������������������� 46
Variation Across Fields of Study in Different Universities ��������������������������������������������� 47
Enrollment Patterns in Continuing Education of Students With Bachelor’s Degrees �������������� 51
Debt Levels Among Students in Florida’s Universities����������������������������������������������������� 53
Bachelor’s Degrees Earned at Florida State Colleges ������������������������������������������������������ 54
First-Year Earnings of Graduates With Master’s Degrees �������������������������������������������������� 57
Specialist Degrees �������������������������������������������������������������������������������������������������� 60
Professional Degrees ����������������������������������������������������������������������������������������������� 63
Changes in First-Year Earnings Among Graduates From Universities ���������������������������������� 65
Where the Jobs Are ������������������������������������������������������������������������������������������������� 66
Growth in Occupations ����������������������������������������������������������������������������������������� 70
Where Is the Greatest Demand Relative to Supply? ���������������������������������������������������� 70
HIGHER EDUCATION PAYS BUT WAGES VARY ACROSS PROGRAMS ������������������������������������������72
APPENDIX������������������������������������������������������������������������������������������������������������������73
METHODOLOGY �����������������������������������������������������������������������������������������������������������80
Completers Cohort 2010–11 to 2014–15 ��������������������������������������������������������������������� 80
Key Concepts ��������������������������������������������������������������������������������������������������������� 80

Measuring the Economic Success of Florida’s Graduatesiv
Definitions ������������������������������������������������������������������������������������������������������������ 81
Area of Study ����������������������������������������������������������������������������������������������������� 81
Number of Completers ����������������������������������������������������������������������������������������� 81
Employment Records ������������������������������������������������������������������������������������������� 81
First-Year Full-Time Earnings �������������������������������������������������������������������������������� 81
Total Found Employed Percentage �������������������������������������������������������������������������� 81
Total Found Employed Full-Time Percentage ������������������������������������������������������������� 81
Median First-Year Earnings ����������������������������������������������������������������������������������� 81
Found Continuing Education Percentage ����������������������������������������������������������������� 82
Public Assistance Percentage �������������������������������������������������������������������������������� 82
Student Loan Debt ���������������������������������������������������������������������������������������������� 82
Data Disclosure ������������������������������������������������������������������������������������������������������ 82

Economic Security Report 2017 v
LIST OF FIGURES
Figure 1: Number of Postsecondary Academic Credentials Awarded and Median First-Year Earnings, Academic Years 2010–11 Through 2014–15 �������������������������������������������� 9
Figure 2: Median First-Year Earnings of Graduates With A�A� Degrees, by College ��������������������11
Figure 3: Median First-Year Earnings of Graduates With A�S� Degrees, by College ��������������������13
Figure 4: Employment Rates Among Graduates With A�S� Degrees, by College �������������������������15
Figure 5: Median First-Year Earnings of Graduates With A�S� Degrees From Popular Programs of Study Among Colleges in Florida �����������������������������������������������������16
Figure 6: Median First-Year Earnings of Graduates With A�S� Degrees From Three Popular Programs Among Colleges in Florida �����������������������������������������������������������������18
Figure 7: Median First-Year Earnings of Graduates With A�A�S� Degrees, by College �����������������20
Figure 8: Median First-Year Earnings of Graduates With A�A�S� Degrees, by Popular Areas of Study �������������������������������������������������������������������������������22
Figure 9: Median First-Year Earnings of Graduates With A�A�S� Degrees in Business Administration, by College �����������������������������������������������������������������23
Figure 10: Average Federal Loan Amount per Student, by College, 2014–15 ����������������������������25
Figure 11: Median First-Year Earnings of Completers With Career Certificates, by District Technical Center �����������������������������������������������������������������������������30
Figure 12: Median First-Year Earnings of Completers With Career Certificates Overall and Those With Career Certificates in Practical Nursing, by District Technical Center ���������31
Figure 13: Median First-Year Earnings of Completers With Career Certificates, by College ������������32
Figure 14: Median First-Year Earnings of Completers With College Credit Certificates in Popular Programs ��������������������������������������������������������������������������������������35
Figure 15: Median First-Year Earnings of Graduates With Academic Degrees From Universities, by Degree �����������������������������������������������������������������������������������43
Figure 16: Median First-Year Earnings of Graduates With Professional Degrees From Universities, by Degree �����������������������������������������������������������������������������������43

Measuring the Economic Success of Florida’s Graduatesvi
Figure 17: Median First-Year Earnings of Graduates With Bachelor’s Degrees, by University ��������45
Figure 18: Median First-Year Earnings of Graduates From Popular Bachelor’s Degree Programs, by Program ������������������������������������������������������������������������������������47
Figure 19: Median First-Year Earnings of Graduates With Bachelor’s Degrees in Psychology, by University ������������������������������������������������������������������������������������������������48
Figure 20: Median First-Year Earnings of Graduates With Bachelor’s Degrees in Business Administration and Management, by University ��������������������������������������������������49
Figure 21: Median First-Year Earnings of Graduates With Bachelor’s Degrees in Biology or Mathematics, by University �����������������������������������������������������������������������������50
Figure 22: Average Federal Loan Amount per Student, by University, 2014–15 �������������������������53
Figure 23: Median First-Year Earnings of Graduates With Bachelor’s Degrees, by College ������������57
Figure 24: Median First-Year Earnings of Graduates With Bachelor’s or Master’s Degrees, by Popular Fields of Study �������������������������������������������������������������������������������58
Figure 25: Median First-Year Earnings of Graduates With Bachelor’s or Master’s Degrees, by University ������������������������������������������������������������������������������������������������59
Figure 26: Median First-Year Earnings of Graduates With Specialist Degrees, by Program ������������60
Figure 27: Median First-Year Earnings of Graduates With Specialist Degrees, by University ���������61
Figure 28: Median First-Year Earnings of Graduates With Credentials in Educational Leadership and Administration, by Post-Baccalaureate Credential ��������������������������62
Figure 29: Median First-Year Earnings of Graduates With Credentials in Curriculum and Instruction, by Post-Baccalaureate Credential ����������������������������������������������������63
Figure 30: Median First-Year Earnings of Graduates From Universities, by Degree ����������������������65
Figure 31: Number of Jobs Gained in Florida From June 2016 to June 2017, by Industry (Seasonally Adjusted), Nonagricultural Sectors ��������������������������������������������������67

Economic Security Report 2017 vii
LIST OF TABLES
Table 1: Employment Outcomes for Graduates and Completers With A�S� Degrees in Popular Programs of Study Among Colleges in Florida ������������������������������������������������17
Table 2: Employment Outcomes for Graduates With A�A�S� Degrees, by College ���������������������������21
Table 3: Employment Outcomes of Completers With Career Certificates Awarded by FCS Institutions and District Technical Centers ���������������������������������������������������������26
Table 4: Employment Outcomes for Completers With Popular Career Certificates Awarded by District Technical Centers ���������������������������������������������������������������������������������27
Table 5: Employment Outcomes for Completers of Career Certificates, by District Technical Center ������������������������������������������������������������������������������������������������ 28
Table 6: Employment Outcomes for Completers With College Credit Certificates, by College��������������������������������������������������������������������������������������������������������� 34
Table 7: Level of Public Assistance, by Credential �����������������������������������������������������������������37
Table 8: Completers With Career Certificates Who Received Public Assistance, by District Technical Center ������������������������������������������������������������������������������������������������ 38
Table 9: Completers With Career Certificates Who Received Public Assistance, by College ������������� 40
Table 10: Graduates and Completers With College Credit Certificates Who Received Public Assistance, by College ������������������������������������������������������������������������������� 41
Table 11: Percentage of Students With Bachelor’s Degrees Who Were Enrolled in Continuing Education, by University�������������������������������������������������������������������������������������� 51
Table 12: Percentage of Students With Bachelor’s Degrees Who Were Enrolled in Continuing Education, by Popular Area of Study ���������������������������������������������������������������������� 52
Table 13: Bachelor’s Degrees Awarded by Colleges in Florida, by Area of Study ���������������������������� 54
Table 14: Median First-Year Earnings of Graduates With Bachelor’s Degrees Awarded by Colleges, by Area of Study ������������������������������������������������������������������������������������ 55
Table 15: Median First-Year Earnings of Graduates With Professional Degrees, by Degree and University ����������������������������������������������������������������������������������������� 64
Table 16: Nonagricultural Employment in Florida, by Industry, June 2017 (Seasonally Adjusted) ����������������������������������������������������������������������������������������� 66
Table 17: Forecast of the Fastest Growing Industries in Florida Through 2024 ����������������������������� 68
Table 18: Forecast of the Industries Gaining the Most New Jobs in Florida Through 2024 �������������� 69
Table 19: Forecast of the Fastest Growing Occupations in Florida Through 2024 �������������������������� 70
Table 20: Supply Gap in 10 Occupations Requiring a Bachelor’s Degree or More ��������������������������� 71
Table 21: Percent of Graduates Found in Earnings Database, by University ��������������������������������� 73
Table 22: Percent of College Graduates and Completers Found in Earnings Database, by Degree and Institution ���������������������������������������������������������������������������������������� 74
Table 23: Percent of Completers of Career Certificates Found in Earnings Database,by District Technical Center�������������������������������������������������������������������������������������� 78
Measuring the Economic Success of Florida’s Graduates1
EXECUTIVE SUMMARY
This report is the result of a partnership between the State of Florida and College Measures� It focuses on the median first-year earnings of recent graduates and completers1 from Florida’s public postsecondary educational institutions: the State University System of Florida (SUS), the Florida College System (FCS), and District Technical Centers (DTCs)�2
The report documents the variation in first-year earnings among completers who earned degrees or certificates from these three systems of postsecondary education� The report also presents data on the percentage of completers from various institutions who received public assistance, as well as the percentage enrolled in continuing education programs� Debt accumulated by all students (not just graduates) is also reported� The results show that what a student studies, what type of postsecondary credentials they earn, and where they earn them matter�
Information in this report comes from three main data sources: the Florida Education and Training Placement Information Program (FETPIP) from the Florida Department of Education, Wage Record Interchange System 2 (WRIS2),3 and the Florida Department of Education’s Office of Student Financial Assistance� The data discussed in this report reflect outcomes for graduates and completers in their first year after graduation for a five-year period from academic years 2010–11 to 2014–15� Although the data represent employment and earnings outcomes, the report does not include information about the occupations of completers and whether they are employed in their fields of study�
1 In this report, “graduates” is a term specifically used to identify any person who has earned a degree (e�g�, associate, bachelor’s, or master’s)� “Completers” is a more general term used to identify any person who has completed any level of postsecondary education (e�g�, certificates, diplomas, bachelor’s degrees, etc�)�
2 The SUS includes 12 public universities (http://www�flbog�edu/universities/)� The FCS comprises 28 public community colleges and state colleges, some of which now offer four-year bachelor’s degrees (http://www�fldoe�org/schools/higher-ed/fl-college-system/colleges/)� Fifty-two DTCs offer certifications in a variety of career and technical education program areas (http://fldoe�org/academics/career-adult-edu/dist-ps-instit�stml)� These three systems comprise Florida’s public postsecondary educational system�
3 The WRIS2 program is a voluntary system whereby states can share aggregate employment and wage outcomes with other states� This enables us to report on the employment and earnings data of graduates from the State of Florida who are employed in other states� The current membership of the WRIS2 exchange includes 43 states, the District of Columbia, and the Commonwealth of Puerto Rico� A map of participating states can be found at https://www�doleta�gov/performance/pfdocs/WRIS2_Status_Map�pdf� Although Florida’s neighbor, Georgia, is currently a member of WRIS2, Alabama is not�

Economic Security Report 2017 2
Florida College System and District Technical Centers• The bachelor’s degree and the associate in arts (A�A�) degree are the two most commonly
awarded degrees in Florida� The A�A� degree is designed as a pathway to the bachelor’s degree� The median first-year earnings of graduates with A�A� degrees are usually lower than those of graduates from many other degree and certificate programs� For example, the median first-year earnings of graduates with an associate in science (A�S�) degree were around $8,700 higher than graduates with bachelor’s degrees from SUS institutions and nearly $16,000 higher than graduates with A�A� degrees who were in the labor market�
• The field of study can greatly affect early career earnings� The median first-year earnings of a graduate with an A�S� degree in Business Administration was $31,824� A graduate with an A�S� degree in Nursing can earn an average of $50,000, and graduates with an A�S� degree in Emergency Medicine Technology–Paramedic can earn even more�
• The average federal debt level per student in 2014–15 across Florida’s colleges ranged from $2,041 (Seminole State College of Florida) to more than $3,500 (New College of Florida, Florida State College at Jacksonville, and Miami Dade College)�
• DTCs issued far more career certificates than colleges in the State of Florida� Career certificates issued by DTCs accounted for almost 60% of all certificates awarded in the state�
○ However, completers with certificates from Florida’s colleges were more successful at obtaining employment (78%) than completers with career certificates from DTCs (70%)�
○ In addition, across the five-year period of study, median first-year earnings of graduates and completers from the FCS were higher ($34,772) than the earnings of completers with certificates from DTCs ($28,024)� Several factors could be at play here� For example, colleges tend to enroll a much higher percentage of students in programs that traditionally have higher placement rates and earnings, such as Law Enforcement Officer, compared with other programs, such as Child Care Provider/Assistant�
• More than 20% of completers who earned career certificates from DTCs received public assistance, much higher than those who earned their certificates from institutions in the FCS�
• Students who earned associate degrees were less likely to have received public assistance than students who earned certificates�
Measuring the Economic Success of Florida’s Graduates3
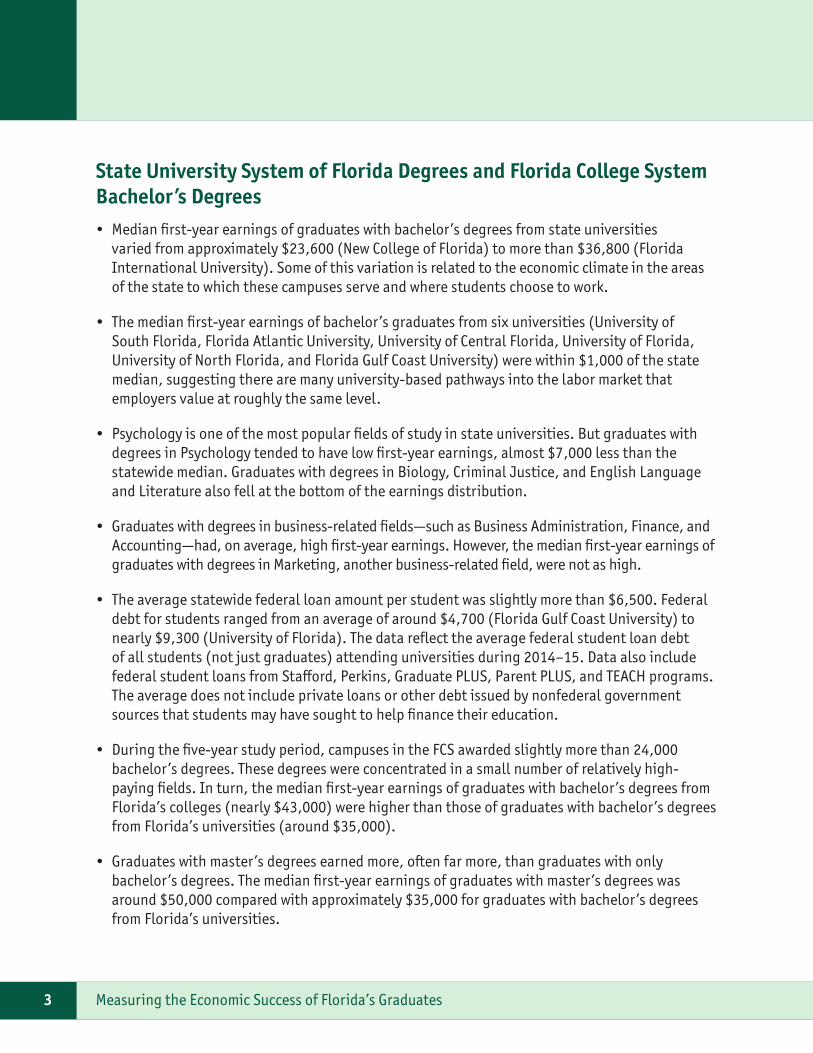
State University System of Florida Degrees and Florida College System Bachelor’s Degrees• Median first-year earnings of graduates with bachelor’s degrees from state universities
varied from approximately $23,600 (New College of Florida) to more than $36,800 (Florida International University)� Some of this variation is related to the economic climate in the areas of the state to which these campuses serve and where students choose to work�
• The median first-year earnings of bachelor’s graduates from six universities (University of South Florida, Florida Atlantic University, University of Central Florida, University of Florida, University of North Florida, and Florida Gulf Coast University) were within $1,000 of the state median, suggesting there are many university-based pathways into the labor market that employers value at roughly the same level�
• Psychology is one of the most popular fields of study in state universities� But graduates with degrees in Psychology tended to have low first-year earnings, almost $7,000 less than the statewide median� Graduates with degrees in Biology, Criminal Justice, and English Language and Literature also fell at the bottom of the earnings distribution�
• Graduates with degrees in business-related fields—such as Business Administration, Finance, and Accounting—had, on average, high first-year earnings� However, the median first-year earnings of graduates with degrees in Marketing, another business-related field, were not as high�
• The average statewide federal loan amount per student was slightly more than $6,500� Federal debt for students ranged from an average of around $4,700 (Florida Gulf Coast University) to nearly $9,300 (University of Florida)� The data reflect the average federal student loan debt of all students (not just graduates) attending universities during 2014–15� Data also include federal student loans from Stafford, Perkins, Graduate PLUS, Parent PLUS, and TEACH programs� The average does not include private loans or other debt issued by nonfederal government sources that students may have sought to help finance their education�
• During the five-year study period, campuses in the FCS awarded slightly more than 24,000 bachelor’s degrees� These degrees were concentrated in a small number of relatively high-paying fields� In turn, the median first-year earnings of graduates with bachelor’s degrees from Florida’s colleges (nearly $43,000) were higher than those of graduates with bachelor’s degrees from Florida’s universities (around $35,000)�
• Graduates with master’s degrees earned more, often far more, than graduates with only bachelor’s degrees� The median first-year earnings of graduates with master’s degrees was around $50,000 compared with approximately $35,000 for graduates with bachelor’s degrees from Florida’s universities�

Economic Security Report 2017 4
Where the Jobs AreThe report also presents data on the industries and occupations that are likely to be most in demand over the next 10 years�
• The health care industry is projected to expand rapidly due to population growth, an aging population, and improved medical technologies�
• Another way to look at where the jobs are is to see which industries will be creating the most new jobs, regardless of the growth rate� Some fast-growing industries employ only a relatively small number of people; others are much larger� For example, Ambulatory Health Care Services and Professional, Scientific, and Technical Services are expected to add many new jobs, and both have high rates of growth� In contrast, two industries, Food Services and Drinking Places and Administrative and Support Services, have lower rates of growth, but because they are such large industries, they will add many more jobs than most of the faster-growing industries�
• Some occupations will have a greater demand relative to supply, for example:
○ From 2016 to 2024, Florida’s postsecondary educational institutions will award approximately 10,000 academic credentials for registered nurses� However, the industry demand is estimated to be around 17,000 nurses during this time, leaving a shortage of almost 7,000 trained individuals�
○ Similarly, Florida’s colleges and universities will produce far fewer academic credentials for Securities and Financial Service Sales Agents than the projected industry demand, resulting in a shortage of some 1,900 trained graduates�

Measuring the Economic Success of Florida’s Graduates5
More findings are available at:
http://www�launchmycareerFL�org
In addition to http://www�launchmycareerFL�org, more information is also available at the following sites:
• What People Are Asking (http://www�whatpeopleareasking�com/index�shtm) contains job and wage data by area in Florida� It features fast growing jobs, what these jobs pay, and other information of interest to students and parents�
• Florida College Graduates Succeed (https://www�floridacollegesystem�com/data/florida_college_graduates_succeed�aspx) is an online business intelligence tool designed to provide access to employment and earnings information on FCS college graduates�
• Find My College Major (http://findmycollegemajor�org/) is a one-stop resource for students to explore the programs at colleges of interest, obtain information about the related occupation(s), and explore current career opportunities�
• Baccalaureate Follow-up Study (http://flbog�edu/forstudents/gfs/) offers a series of reports that provide students, parents, educators, and policymakers with information about the experiences of graduates after they complete a bachelor’s degree�

Economic Security Report 2017 6
This report results from a partnership between the State of Florida and College Measures� It focuses on the median first-year earnings of recent graduates and completers from Florida’s public postsecondary educational institutions: the State University System of Florida (SUS), the Florida College System (FCS), and District Technical Centers (DTCs)� The report documents the variation in first-year earnings for completers who earned degrees or certificates from these three postsecondary education systems� The report also presents data on other outcomes, such as the percentage of completers who enrolled in further education� The report presents these data for programs, not just institutions, and reflects that the type of postsecondary credential completers earn, what they study, and where they study matter� The report begins by examining Florida’s colleges and district technical centers and then focuses on bachelor’s degrees granted by Florida’s universities� The earnings of completers of Florida’s professional programs are also reported� The report concludes with a forecast of the occupations in which employment growth is most likely to occur�
INTRODUCTION

Measuring the Economic Success of Florida’s Graduates7
Florida’s public postsecondary system includes institutions in the FCS and DTCs, which are operated by school districts� FCS institutions offer a variety of programs, from bachelor’s degrees and associate in arts (A�A�) degrees to career and technical programs� DTCs offer only career and technical education (CTE) programs and do not offer college credit programs�
The A�A� is designed for students who intend to earn a bachelor’s degree later� CTE programs, such as the associate in applied science (A�A�S�) and associate in science (A�S�) degrees, are designed for students who are seeking employment immediately after graduation� These associate degree programs are designed as two-year courses of study, although students often take longer to successfully complete them�
Career certificate and college credit certificate programs are available in many specialties for students who want to spend less than two years in career preparation� Certificate programs fall into several categories:
• Career certificate� Career certificate programs are a series of vocational courses that prepare students for entry-level employment in specific career fields� The programs vary in length from 40 hours to more than 1,500 hours� Colleges and DTCs offer these certificate programs as non-college credit� Examples of career certificates include correctional probation officer, cosmetologist, culinary operator, firefighter, medical assistant, and practical nurse�
• Applied technology diploma� The applied technology diploma is a course of study that is part of an A�S� or A�A�S� degree program� The course of study is less than 60 credit hours and is designed to lead to employment in a specific occupation� Examples include dental assistant and emergency medical technician� An applied technology diploma may consist of career and technical education credit (clock hours) or college credit� When a student is seeking an applied technology diploma at a DTC or as a clock-hour program at a college, the clock hours are converted to semester hours when the student enters the A�S� or A�A�S� degree program�
• Apprenticeship� An apprenticeship is a combination of on-the-job training and related classroom instruction in which students learn the practical and theoretical aspects of a highly skilled occupation� Programs are sponsored by apprenticeship organizations in partnership with colleges and DTCs�
• College credit certificates� College credit certificate programs are a series of college credit courses that prepare students for entry-level employment in specific career fields or for career advancement� Generally, these certificates can be completed in one year or less� College credit certificate programs must be part of an A�S� or A�A�S� degree program� Examples include information technology technician, office specialist, computer programmer, and educational assistant� College credit certificates also may be called postsecondary vocational certificates�
FLORIDA COLLEGES AND DISTRICT TECHNICAL CENTERS

Economic Security Report 2017 8
The data discussed in this report reflect outcomes for graduates and completers in their first year after graduation for a five-year period from academic years 2010–11 to 2014–15� As noted in the following pages, postcompletion earnings vary among students who finish with different credentials� In addition, longer courses of study do not always lead to higher earnings�
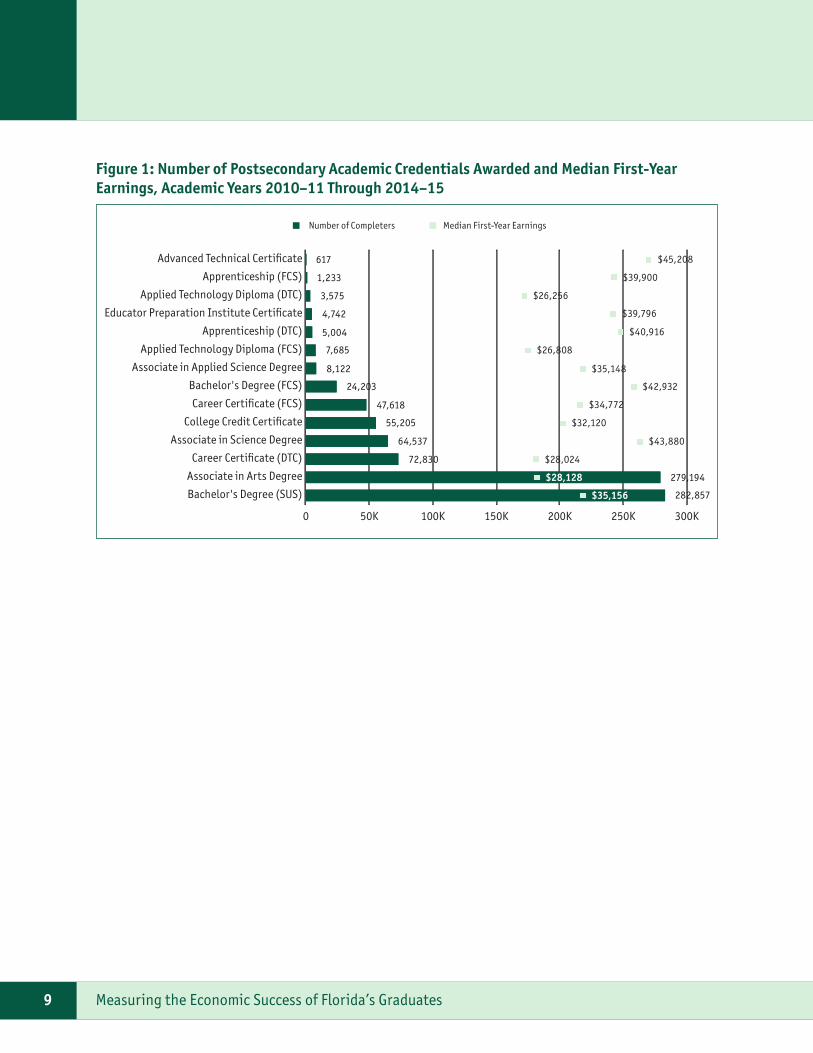
As Figure 1 shows, the A�A� degree is the second most commonly awarded postsecondary credential in Florida (second only to the bachelor’s degree)� The A�A� degree is designed as a pathway to a bachelor’s degree� Compared with the A�A� degree, far fewer students completed career- and technical-oriented programs of study� For example, nearly 280,000 A�A� degrees were awarded during the study period, compared with approximately 64,500 A�S� degrees and 8,100 A�A�S� degrees� Together, Florida’s colleges and DTCs awarded more than 120,000 career certificates, and colleges also awarded more than 55,000 college credit certificates�
Figure 1 also shows the median first-year earnings associated with each career- and technical-oriented credential� The lowest earnings were associated with completers of an applied technology diploma� Some of these completers may still be attending school while in the job market, thus lowering their earnings� With that in mind, the median first-year earnings of graduates with an A�S� degree were around $17,500 more than those of completers with an applied technology diploma and more than $8,500 higher than graduates with a bachelor’s degree from an institution in the SUS� The median first-year earnings of graduates with an A�S� degree were also higher than those of graduates who completed the far less common A�A�S� degree�
Completers of certificate programs, on average, had higher first-year earnings than graduates with A�A� degrees� The median first-year earnings of graduates with A�A� degrees ($28,128) were lower than those of completers with career certificates from Florida’s colleges ($34,772)� However, completers of certificate courses, on average, had lower median first-year earnings than graduates with A�S� degrees ($43,880) and A�A�S� degrees ($35,148)� The highest median first-year earnings ($45,208) were achieved by the 617 completers of advanced technical certificates� Advanced technical certificates are generally designed for individuals who have already completed a two-year A�S� or A�A�S� degree and are seeking advanced, specialized preparation in a particular career field to supplement their degree�
Measuring the Economic Success of Florida’s Graduates9
Figure 1: Number of Postsecondary Academic Credentials Awarded and Median First-Year Earnings, Academic Years 2010–11 Through 2014–15
0 50K 100K 150K 200K 250K 300K
617
1,233
3,575
4,742
5,004
7,685
8,122
24,203
47,618
55,205
64,537
72,830
279,194
282,857Bachelor's Degree (SUS)
Associate in Arts Degree
Career Certificate (DTC)
Associate in Science Degree
College Credit Certificate
Career Certificate (FCS)
Bachelor's Degree (FCS)
Associate in Applied Science Degree
Applied Technology Diploma (FCS)
Apprenticeship (DTC)
Educator Preparation Institute Certificate
Applied Technology Diploma (DTC)
Apprenticeship (FCS)
Advanced Technical Certificate
Median First-Year EarningsNumber of Completers
$45,208
$39,900
$26,256
$39,796
$40,916
$26,808
$35,148
$42,932
$34,772
$32,120
$43,880
$28,024
$28,128
$35,156
Economic Security Report 2017 10
Associate in Arts Degree After the bachelor’s degree, the most common degree granted in Florida is the A�A� degree� Almost 280,000 A�A� degrees were awarded during the five-year study period� The A�A� degree is designed for students who plan to attend a four-year institution as a junior and complete a bachelor’s degree program� The A�A� degree requires 36 credit hours of general education and 24 credit hours of electives�
As shown in Figure 1, the median first-year earnings of all graduates with A�A� degrees were slightly more than $28,000� Figure 2 displays the median first-year earnings of graduates with A�A� degrees from specific colleges in Florida� More than $7,000 separates the median first-year earnings of graduates from the college with the lowest (Chipola College, $25,304) and highest earning graduates with A�A� degrees (St� Petersburg College, $32,664)�
Although this report does not explain these differences, note that Chipola College, South Florida State College, and Northwest Florida State College, all of which have low median earnings, are located in rural areas of the state� In contrast, two of the top three colleges (Florida State College at Jacksonville and St� Petersburg College) from which graduates who completed A�A� degrees earned the most are located in large metropolitan areas� Graduates of schools in urban areas who stay in those urban areas may have higher earnings�
VARIATION IN FIRST-YEAR EARNINGS OF GRADUATES WITH ASSOCIATE DEGREES

Measuring the Economic Success of Florida’s Graduates11
Figure 2: Median First-Year Earnings of Graduates With A�A� Degrees, by College
$0 10K 20K 30K 40K 50K
Florida Statewide Median, A.S. Degree
St. Petersburg College
Florida Keys Community College
Florida State College at Jacksonville
Miami Dade College
Florida Gateway College
Hillsborough Community College
Broward College
Gulf Coast State College
Florida Statewide Median, A.A. Degree
Polk State College
Northwest Florida State College
Palm Beach State College
Florida SouthWestern State College
North Florida Community College
Seminole State College of Florida
Tallahassee Community College
Santa Fe College
St. Johns River State College
Daytona State College
Pasco-Hernando State College
Indian River State College
Pensacola State College
Eastern Florida State College
Valencia College
College of Central Florida
State College of Florida, Manatee-Sarasota
South Florida State College
Lake-Sumter State College
Chipola College $25,304
$25,420
$25,648
$25,684
$25,836
$25,976
$26,164
$26,224
$26,468
$26,620
$26,832
$26,904
$27,072
$27,316
$27,336
$27,476
$27,688
$27,856
$27,904
$28,060
$28,128
$28,364
$28,760
$28,824
$29,548
$29,776
$30,148
$30,248
$32,664
$43,880

Economic Security Report 2017 12
Associate in Science DegreeAfter the A�A� degree, the next most common two-year degree awarded in Florida is the A�S� degree� Over 64,000 A�S� degrees were awarded during the five-year study period� A�S� degree programs, like other CTE programs, are designed to prepare students who are planning to enter a specific occupation�
As shown in Figure 3, the median first-year earnings of graduates with A�S� degrees were far higher (nearly $43,900) than those earned by graduates with A�A� degrees (around $28,100)� The median first-year earnings of graduates with A�S� degrees varied substantially across colleges in Florida� At the high end, graduates with A�S� degrees from five colleges (Florida Keys Community College; Florida Gateway College; Polk State College; Pasco-Hernando State College; and State College of Florida, Manatee-Sarasota) had median first-year earnings above $48,000, with graduates of South Florida State College earning more than $55,000� In contrast, graduates with A�S� degrees from three colleges (Tallahassee Community College, Valencia College, and Northwest Florida State College) had median first-year earnings less than $40,000�

Measuring the Economic Success of Florida’s Graduates13
Figure 3: Median First-Year Earnings of Graduates With A�S� Degrees, by College
$0 10K 20K 30K 40K 50K 60K
South Florida State College
Florida Keys Community College
Florida Gateway College
Polk State College
Pasco-Hernando State College
State College of Florida, Manatee-Sarasota
North Florida Community College
Florida SouthWestern State College
Broward College
Santa Fe College
St. Petersburg College
St. Johns River State College
Lake-Sumter State College
Seminole State College of Florida
Miami Dade College
Florida Statewide Median, A.S. DegreePensacola State College
Florida State College at Jacksonville
Palm Beach State College
Daytona State College
Hillsborough Community College
Chipola College
Gulf Coast State College
Indian River State College
College of Central Florida
Eastern Florida State College
Northwest Florida State College
Valencia College
Tallahassee Community College
Florida Statewide Median, A.A. Degree $28,128
$37,960
$38,184
$39,240
$40,796
$40,864
$40,960
$42,720
$42,996
$43,032
$43,052
$43,132
$43,332
$43,632
$43,880
$43,968
$44,260
$44,664
$45,864
$45,972
$46,668
$47,116
$47,500
$47,828
$48,176
$48,404
$48,624
$48,908
$49,228
$55,428

Economic Security Report 2017 14
Employment Outcomes of Graduates With A.S. Degrees
Figure 4 shows the percentage of graduates with A�S� degrees who were employed one year after graduation, as reported in wage data from the Florida Unemployment Insurance (UI) and Wage Record Interchange System 2 (WRIS2) systems�4 Eighty percent of graduates with A�S� degrees were employed, but that percentage varied by institution, ranging from 74% to 93%� Overall, graduates with A�S� degrees were employed at higher rates than the statewide median rate for graduates with A�A� degrees� This is not surprising because A�S� degrees are designed for students who plan to enter employment, while A�A� degrees are designed for students who plan to earn a four-year bachelor’s degree from a college or university�
4 The WRIS2 program is a voluntary system whereby states can share aggregate employment and wage outcomes with other states� This enables us to report on the employment and earnings data of graduates from the State of Florida who are employed in other states� The current membership of the WRIS2 exchange includes 43 states, the District of Columbia, and the Commonwealth of Puerto Rico� A map of participating states can be found at https://www�doleta�gov/performance/pfdocs/WRIS2_Status_Map�pdf�

Measuring the Economic Success of Florida’s Graduates15
Figure 4: Employment Rates Among Graduates With A�S� Degrees, by College
0% 10 20 30 40 50 60 70 80 90 100
South Florida State CollegeLake-Sumter State College
Florida Gateway CollegePolk State College
Florida SouthWestern State CollegeGulf Coast State College
State College of Florida, Manatee-SarasotaBroward College
Pasco-Hernando State CollegeSeminole State College of Florida
Santa Fe CollegeSt. Petersburg College
Hillsborough Community CollegeIndian River State CollegePalm Beach State College
Florida Statewide Median, A.S. DegreeValencia College
Daytona State CollegeSt. Johns River State College
Florida State College at JacksonvilleTallahassee Community College
Florida Keys Community CollegeEastern Florida State College
Miami Dade CollegeNorth Florida Community College
Northwest Florida State CollegePensacola State College
Chipola CollegeCollege of Central Florida
Florida Statewide Median, A.A. Degree 65%74%
74%
75%
75%
75%
75%
76%
77%
78%
78%
79%
79%
80%
80%81%
82%
82%
82%
83%
83%
84%
84%
84%
85%
86%
88%
88%
89%
93%

Economic Security Report 2017 16
What Students Study Matters
Graduates with A�A� degrees are classified into a single program of study (Liberal Arts and Sciences/Liberal Studies5)� However, graduates with A�S� degrees are classified across a range of programs of study, and graduates from some programs earn far more than graduates from others� Figure 5 identifies the median first-year earnings of graduates with A�S� degrees in the most popular programs of study� Median first-year earnings ranged from a low of $24,948 (Early Childhood Education and Teaching) to nearly $53,000 (Emergency Medical Technology/Technician [EMT Paramedic])�
Figure 5: Median First-Year Earnings of Graduates With A�S� Degrees From Popular Programs of Study Among Colleges in Florida
$0 10K 20K 30K 40K 50K 60K
Emergency Medical Technology/Technician (EMT Paramedic)Registered Nursing/Registered Nurse
Respiratory Care Therapy/TherapistFlorida Statewide Median, A.S. Degree
Dental Hygiene/HygienistMedical Radiologic Technology/Science–Radiation Therapist
Computer Systems Networking and TelecommunicationsCriminal Justice/Law Enforcement Administration
Legal Assistant/ParalegalBusiness Administration and Management, General
Early Childhood Education and Teaching $24,948
$31,824
$31,876
$35,404
$36,372
$40,172
$40,780
$43,880
$45,488
$50,136
$52,880
Combining the data presented in Figure 5 with the data in Table 1 shows that first-year earnings and rates of employment differ among graduates with A�S� degrees across programs at FCS institutions� About 70% of graduates with A�S� degrees in Business Administration and Management, General and Early Childhood Education and Teaching were employed one year after graduation� In contrast, more than 80% of graduates in health care-related professions, such as Emergency Medical Technology/Technician (EMT Paramedic), were employed� These types of data are potentially powerful for students who are interested in the prospects of the earnings of graduates with A�S� degrees from specific programs from specific colleges�
5 This classification and information about all other fields of study used in this report are defined by the U�S� Department of Education’s Classification of Instructional Programs (CIP) Code�

Measuring the Economic Success of Florida’s Graduates17
Table 1: Employment Outcomes for Graduates and Completers With A�S� Degrees in Popular Programs of Study Among Colleges in Florida
A�S� Degree Program Number of Completers Number Employed Percent Employed
Business Administration and Management, General 2,169 1,528 70%
Early Childhood Education and Teaching 1,451 1,025 71%
Computer Systems Networking and Telecommunications 1,466 1,066 73%
Legal Assistant/Paralegal 2,681 2,027 76%
Criminal Justice/Law Enforcement Administration 2,758 2,141 78%
Florida Statewide Median, A�S� Degree 64,537 51,945 80%
Dental Hygiene/Hygienist 1,453 1,177 81%
Respiratory Care Therapy/Therapist 1,411 1,197 85%
Medical Radiologic Technology/Science–Radiation Therapist
1,808 1,548 86%
Registered Nursing/Registered Nurse 23,169 20,566 89%
Emergency Medical Technology/Technician (EMT Paramedic)
2,491 2,307 93%
Figure 6 displays the median first-year earnings of graduates with A�S� degrees from the three most popular programs in the state (Legal Assistant/Paralegal, Criminal Justice/Law Enforcement Administration, and Registered Nursing/Registered Nurse) across the 19 colleges in Florida with sufficient data to meet reporting requirements� The variation across programs shows why this level of analysis is important�
Apart from one college (Daytona State College), median first-year earnings of graduates with degrees in Criminal Justice/Law Enforcement Administration were lower, often significantly, than those of graduates with degrees in Registered Nursing/Registered Nurse� That said, median first-year earnings among graduates of Criminal Justice/Law Enforcement Administration programs varied considerably across colleges, from about $26,300 (Pasco-Hernando State College) to about $48,000 (Daytona State College)�
The range in first-year earnings was somewhat narrower among graduates of Registered Nursing/Registered Nurse and Legal Assistant/Paralegal� For nursing, earnings ranged from about $43,500 (Northwest Florida State College) to more than $55,700 (Santa Fe College)� For legal assistants, first-year earnings ranged from nearly $25,200 (Pasco-Hernando State College) to more than $35,600 (Broward College)�

Economic Security Report 2017 18
Figure 6: Median First-Year Earnings of Graduates With A�S� Degrees From Three Popular Programs Among Colleges* in Florida
$0 10K 20K 30K 40K 50K 60K
Broward College
College of Central Florida
Daytona State College
Eastern Florida State College
Florida SouthWestern State College
Florida State College at Jacksonville
Gulf Coast State College
Hillsborough Community College
Indian River State College
Miami Dade College
Northwest Florida State College
Palm Beach State College
Pasco-Hernando State College
Santa Fe College
Seminole State College of Florida
St. Petersburg College
State College of Florida, Manatee-Sarasota
Tallahassee Community College
Valencia College
Registered Nursing/Registered NurseCriminal Justice/Law Enforcement AdministrationLegal Assistant/Paralegal
$48,072$27,720
$30,680
$44,236$37,516
$34,276
$51,792$28,408
$33,256
$52,304$42,320
$32,384
$50,560$39,320
$29,496
$55,712$45,204
$29,080
$51,900$26,304
$25,192
$50,712$37,292
$33,572
$43,520$39,536
$31,712
$48,268$35,220
$29,984
$50,312$29,964
$33,928
$45,688$41,112
$28,160
$50,564$35,900
$33,160
$49,948$43,964
$33,352
$47,704$30,988
$26,000
$48,036$48,124
$28,512
$51,536$32,808
$35,648
$35,560$31,040
$50,104
$33,096$34,948
$51,120
* This figure includes only those colleges that could provide sufficient data for all three programs�

Measuring the Economic Success of Florida’s Graduates19
Associate in Applied Science DegreeMore than 8,000 students in Florida earned A�A�S� degrees from academic years 2010–11 to 2014–15� A�A�S� degrees focus on training students for direct entry into a specialized occupation in the workplace�
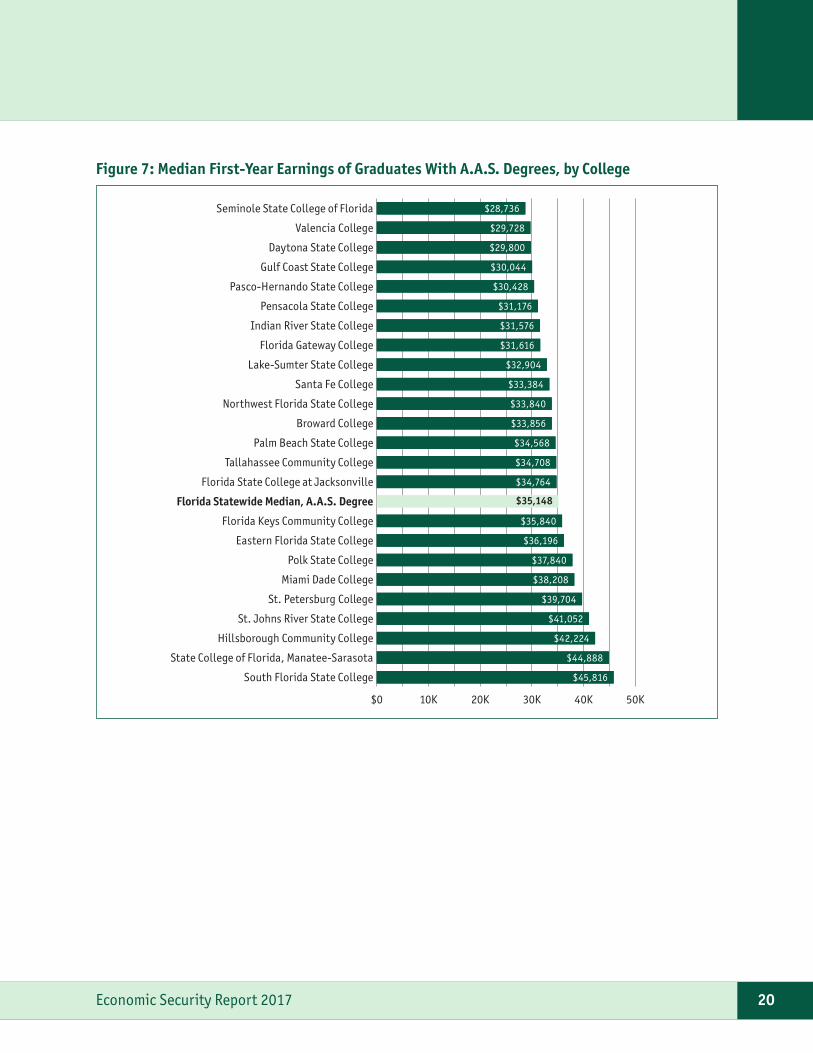
The median statewide earnings of graduates with A�A�S� degrees were $35,148, around $7,000 higher than those of graduates with A�A� degrees ($28,128) but more than $8,000 lower than those with A�S� degrees ($43,880)� The range in median first-year earnings among graduates with A�A�S� degrees varied substantially, from approximately $28,700 (Seminole State College of Florida) to nearly $46,000 (South Florida State College) (Figure 7)�
Graduates with A�A�S� degrees from three colleges (Daytona State College, Valencia College, and Seminole State College of Florida) had median first-year earnings of less than $30,000� In contrast, the median first-year earnings of graduates with A�A�S� degrees from two colleges (State College of Florida, Manatee-Sarasota and South Florida State College) were more than $44,000� Again, these differences are affected by the distribution of graduates across programs, where graduates earn high-paying versus low-paying wages in the labor market, and by the location of the college (e�g�, rural versus urban areas and those in the larger and higher paying regional economies in the state)�
Economic Security Report 2017 20
Figure 7: Median First-Year Earnings of Graduates With A�A�S� Degrees, by College
$0 10K 20K 30K 40K 50K
$28,736
$29,728
$29,800
$30,044
$30,428
$31,176
$31,576
$31,616
$32,904
$33,384
$33,840
$33,856
$34,568
$34,708
$34,764
$35,148
$35,840
$36,196
$37,840
$38,208
$39,704
$41,052
$42,224
$44,888
$45,816South Florida State College
State College of Florida, Manatee-Sarasota
Hillsborough Community College
St. Johns River State College
St. Petersburg College
Miami Dade College
Polk State College
Eastern Florida State College
Florida Keys Community College
Florida Statewide Median, A.A.S. Degree
Florida State College at Jacksonville
Tallahassee Community College
Palm Beach State College
Broward College
Northwest Florida State College
Santa Fe College
Lake-Sumter State College
Florida Gateway College
Indian River State College
Pensacola State College
Pasco-Hernando State College
Gulf Coast State College
Daytona State College
Valencia College
Seminole State College of Florida

Measuring the Economic Success of Florida’s Graduates21
Table 2 shows employment outcomes for graduates with A�A�S degrees from FCS institutions� In four of the colleges (Northwest Florida State College, Pensacola State College, Florida Gateway College, and St� Petersburg College), fewer than 70% of graduates with A�A�S� degrees were employed, according to the employment database� At the high end of the scale, 94% of graduates from Florida Keys Community College and 89% of graduates from Seminole State College of Florida were employed� Of note, Northwest Florida State College, Pensacola State College, and Florida Gateway College are all located near other states, so some graduates from these colleges may be employed in those states that do not currently participate in WRIS2�
Table 2: Employment Outcomes for Graduates With A�A�S� Degrees, by College*
Institution Number of Completers Number Employed Percent Employed
Northwest Florida State College 617 365 59%
Pensacola State College 1,243 825 66%
Florida Gateway College 18 12 67%
St� Petersburg College 19 13 68%
Pasco-Hernando State College 87 61 70%
Daytona State College 716 510 71%
Valencia College 201 146 73%
Lake-Sumter State College 143 104 73%
Florida State College at Jacksonville 385 283 74%
Gulf Coast State College 279 206 74%
Santa Fe College 211 156 74%
Indian River State College 626 465 74%
Tallahassee Community College 110 82 75%
Eastern Florida State College 169 126 75%
Palm Beach State College 266 200 75%
Broward College 851 674 79%
State College of Florida, Manatee-Sarasota 808 653 81%
Hillsborough Community College 570 466 82%
Polk State College 272 228 84%
Miami Dade College 154 130 84%
South Florida State College 251 219 87%
St� Johns River State College 33 29 88%
Seminole State College of Florida 66 59 89%
Florida Keys Community College 18 17 94%
* Only colleges with more than 10 completers or employed completers are included in this table�
Economic Security Report 2017 22
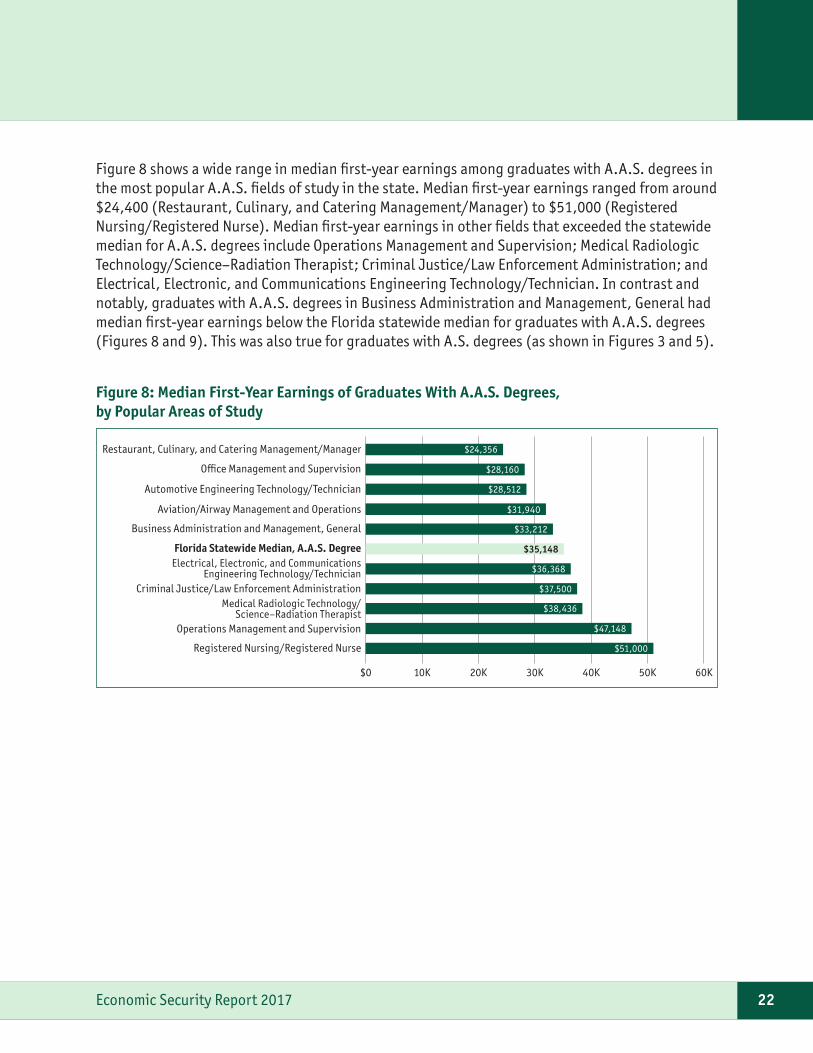
Figure 8 shows a wide range in median first-year earnings among graduates with A�A�S� degrees in the most popular A�A�S� fields of study in the state� Median first-year earnings ranged from around $24,400 (Restaurant, Culinary, and Catering Management/Manager) to $51,000 (Registered Nursing/Registered Nurse)� Median first-year earnings in other fields that exceeded the statewide median for A�A�S� degrees include Operations Management and Supervision; Medical Radiologic Technology/Science–Radiation Therapist; Criminal Justice/Law Enforcement Administration; and Electrical, Electronic, and Communications Engineering Technology/Technician� In contrast and notably, graduates with A�A�S� degrees in Business Administration and Management, General had median first-year earnings below the Florida statewide median for graduates with A�A�S� degrees (Figures 8 and 9)� This was also true for graduates with A�S� degrees (as shown in Figures 3 and 5)�
Figure 8: Median First-Year Earnings of Graduates With A�A�S� Degrees, by Popular Areas of Study
$0 10K 20K 30K 40K 50K 60K
$24,356
$28,160
$28,512
$31,940
$33,212
$35,148
$36,368
$37,500
$38,436
$47,148
$51,000Registered Nursing/Registered Nurse
Operations Management and Supervision
Medical Radiologic Technology/Science–Radiation Therapist
Criminal Justice/Law Enforcement Administration
Electrical, Electronic, and Communications Engineering Technology/Technician
Florida Statewide Median, A.A.S. Degree
Business Administration and Management, General
Aviation/Airway Management and Operations
Automotive Engineering Technology/Technician
O�ce Management and Supervision
Restaurant, Culinary, and Catering Management/Manager

Measuring the Economic Success of Florida’s Graduates23
Figure 9 reports the range of median first-year earnings of graduates with A�A�S� degrees in Business Administration across the colleges that met reporting requirements� An earnings difference of more than $20,000 separated Valencia College, whose graduates had the lowest median first-year earnings, from Broward College, whose graduates had the highest� The median first-year earnings of graduates with A�A�S� degrees in Business Administration from three colleges were less than $30,000 (Indian River State College, Pasco-Hernando State College, and Valencia College)� In contrast, graduates of Broward College had earnings of almost $50,000, and for four other colleges (Tallahassee Community College, State College of Florida, Manatee-Sarasota, Eastern Florida State College, and Lake-Sumter State College), median first-year earnings of graduates with A�A�S� degrees in Business Administration exceeded $35,000�
Figure 9: Median First-Year Earnings of Graduates With A�A�S� Degrees in Business Administration, by College
$0 10K 20K 30K 40K 50K
Broward College
Tallahassee Community College
State College of Florida, Manatee-Sarasota
Eastern Florida State College
Lake-Sumter State College
Palm Beach State College
Northwest Florida State College
Polk State College
Florida Statewide Median, A.A.S. Degree,Business Administration
Florida State College at Jacksonville
Daytona State College
Pensacola State College
Indian River State College
Pasco-Hernando State College
Valencia College $28,528
$28,980
$29,120
$31,284
$31,552
$31,752
$33,220
$33,212
$33,728
$34,436
$35,052
$35,896
$36,088
$36,712
$49,420

Economic Security Report 2017 24
Debt Levels by CollegeThe amount of student debt is a growing concern in Florida and across the nation� Compared with students who are pursuing bachelor’s or advanced degrees, debt is not always as large a concern for those enrolled in shorter degree programs� Nonetheless, many students in colleges in Florida take out loans to help pay for their education� Figure 10 shows the average federal debt level per student in 2014–15 at each college in Florida� The range varies from around $2,000 per student (Seminole State College of Florida) to more than $3,500 per student (New College of Florida, Florida State College at Jacksonville, and Miami Dade College)�
Each college self-reports data about debt to Florida’s Department of Education, Office of Student Financial Assistance� The data reflect the average federal student loan debt of all students (not just graduates) receiving federal loans in 2014–15� Data also include federal student loans from Stafford, Perkins, Graduate PLUS, Parent PLUS, and TEACH programs� The average student loan debt represents the total amount of student loans for 2014–15 at each college, divided by the number of students attending the college that academic year� The average does not include private loans or other debt issued by nonfederal government sources that students may have sought to help finance their education�

Measuring the Economic Success of Florida’s Graduates25
Figure 10: Average Federal Loan Amount per Student, by College, 2014–15
$0 1K 2K 3K 4K
$2,041
$2,554
$2,714
$2,743
$2,759
$2,837
$2,841
$2,891
$2,922
$2,956
$2,962
$2,983
$3,012
$3,038
$3,047
$3,107
$3,150
$3,158
$3,239
$3,330
$3,374
$3,391
$3,442
$3,496
$3,532
$3,578
$3,717New College of Florida
Florida State College at Jacksonville
Miami Dade College
St. Johns River State College
Florida Keys Community College
Eastern Florida State College
Polk State College
State College of Florida, Manatee-Sarasota
Indian River State College
Palm Beach State College
Santa Fe College
St. Petersburg College
Hillsborough Community College
Statewide Average Federal Loan Amountper Student, Florida Colleges
Broward College
Valencia College
South Florida State College
Northwest Florida State College
Lake-Sumter State College
Tallahassee Community College
College of Central Florida
Gulf Coast State College
Pensacola State College
Daytona State College
Pasco-Hernando State College
Florida Gateway College
Seminole State College of Florida

Economic Security Report 2017 26
Large numbers of students enroll in Florida’s public postsecondary institutions to earn certificates or diplomas� Two of the most popular programs are career certificates and college credit certificates�6
This section highlights key patterns in all certificates awarded to more than 175,000 students during the five-year study period� Details about all programs, including those not analyzed in this report, are available at http://www�launchmycareerFL�org�
Career CertificatesCareer certificate programs consist of a series of technical (non-college credit) courses that are designed to prepare students for entry-level employment in specific career fields (e�g�, cosmetology, law enforcement, practical nursing)� Institutions in the FCS and DTCs award these types of certificates� There are systemic differences in the fields in which these certificates are awarded, including type of school, median first-year earnings, and student outcomes�
As shown in Table 3, DTCs awarded more career certificates than Florida’s colleges (72,830 versus 47,618, respectively)� However, students who completed certificates from FCS institutions were more successful at finding employment in the labor market� For example, 78% of completers of career certificates from FCS institutions found employment, compared with 70% of those from DTCs�7 In addition, the median first-year earnings were higher for completers from colleges ($34,772) than the earnings of those with certificates from DTCs ($28,024)� This gap may be attributable to the mixture of programs offered by DTCs compared with those offered by FCS institutions� For example, FCS institutions enroll a much higher percentage of students in career certificate programs, such as Law Enforcement Officer, that traditionally have higher placement rates than other career certificate programs�
Table 3: Employment Outcomes of Completers With Career Certificates Awarded by FCS Institutions and District Technical Centers
Outcome Career Certificate (FCS) Career Certificate (DIST)
Median First-Year Earnings $34,772 $28,024
Total Completers 47,618 72,830
Total Employed 36,910 50,799
Total Employed Percent 78% 70%
6 Additionally, more than 6,200 students completed apprenticeships during the five-year study period� Outcomes for different apprentice programs can be found on http://www�launchmycareerFL�org�
7 Part of this gap may be a function of the coverage of the UI wage data� For example, many of the occupations for which career certificates are awarded can lead to self-employment, which may not be captured in the UI data�
CAREER CERTIFICATES AND COLLEGE CREDIT CERTIFICATES
Measuring the Economic Success of Florida’s Graduates27
Career Certificates Awarded by District Technical Centers
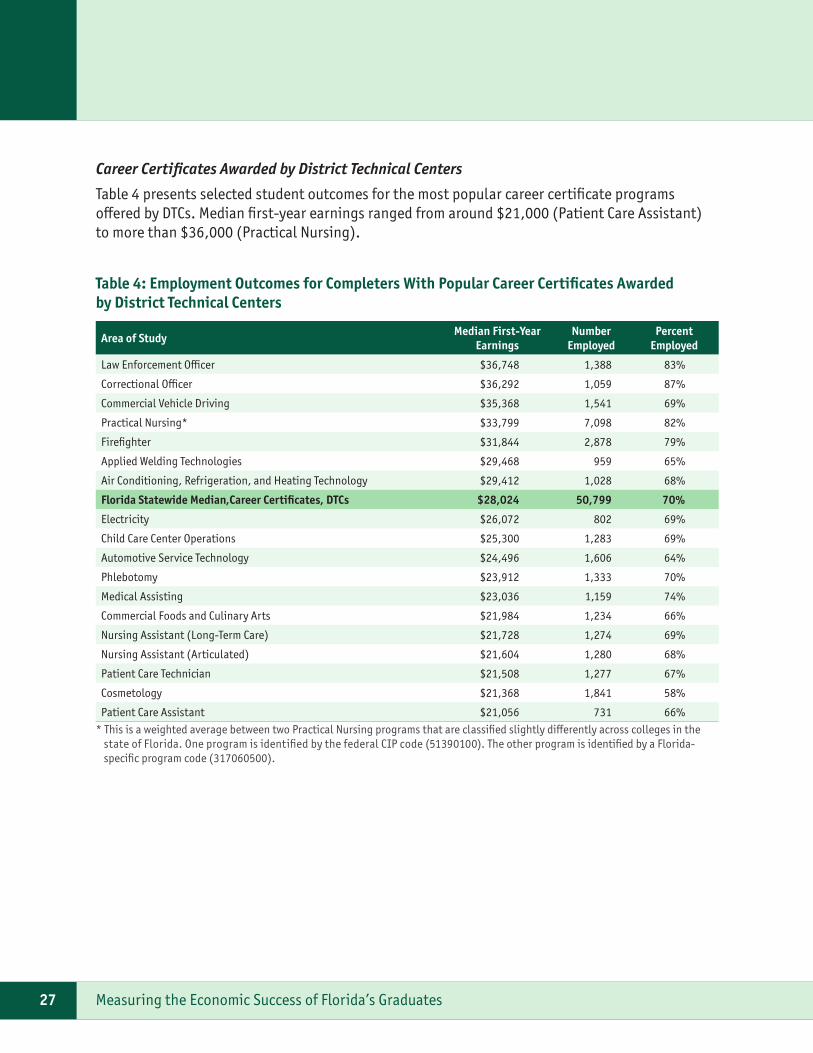
Table 4 presents selected student outcomes for the most popular career certificate programs offered by DTCs� Median first-year earnings ranged from around $21,000 (Patient Care Assistant) to more than $36,000 (Practical Nursing)�
Table 4: Employment Outcomes for Completers With Popular Career Certificates Awarded by District Technical Centers
Area of Study Median First-Year Earnings
Number Employed
Percent Employed
Law Enforcement Officer $36,748 1,388 83%
Correctional Officer $36,292 1,059 87%
Commercial Vehicle Driving $35,368 1,541 69%
Practical Nursing* $33,799 7,098 82%
Firefighter $31,844 2,878 79%
Applied Welding Technologies $29,468 959 65%
Air Conditioning, Refrigeration, and Heating Technology $29,412 1,028 68%
Florida Statewide Median,Career Certificates, DTCs $28,024 50,799 70%
Electricity $26,072 802 69%
Child Care Center Operations $25,300 1,283 69%
Automotive Service Technology $24,496 1,606 64%
Phlebotomy $23,912 1,333 70%
Medical Assisting $23,036 1,159 74%
Commercial Foods and Culinary Arts $21,984 1,234 66%
Nursing Assistant (Long-Term Care) $21,728 1,274 69%
Nursing Assistant (Articulated) $21,604 1,280 68%
Patient Care Technician $21,508 1,277 67%
Cosmetology $21,368 1,841 58%
Patient Care Assistant $21,056 731 66%
* This is a weighted average between two Practical Nursing programs that are classified slightly differently across colleges in the state of Florida� One program is identified by the federal CIP code (51390100)� The other program is identified by a Florida- specific program code (317060500)�

Economic Security Report 2017 28
Table 5 shows median first-year earnings and employment rates of completers of career certificates awarded by specific DTCs� Median first-year earnings varied widely across DTCs, from less than $21,500 (South Dade Technical College and Sumter County Adult Education) to over $35,000 (Fort Myers Technical College and George T� Baker Aviation Technical College)�
Table 5: Employment Outcomes for Completers of Career Certificates, by District Technical Center
District Technical Center Median First-Year Earnings
Number Employed
Percent Employed
South Dade Technical College $21,132 345 53%
Sumter County Adult Education $21,344 46 55%
D�A� Dorsey Technical College $22,208 135 67%
Wakulla County Adult and Community Education $22,264 70 65%
DeSoto County Adult Education Center $22,556 131 65%
Fred K� Marchman Technical College $22,968 302 62%
Technical Center for Career and Adult Education $23,108 675 65%
Orange Technical College–Westside Campus $23,380 901 65%
Brewster Technical College $24,016 559 67%
The English Center $24,240 478 54%
Aparicio-Levy Technical College $24,324 218 65%
Lively Technical Center $24,408 1,105 65%
Learey Technical College $24,532 771 72%
Cape Coral Technical College $25,328 762 73%
Lindsey Hopkins Technical College $25,460 1,112 62%
Tom P� Haney Technical Center $25,544 779 72%
Flagler Technical Institute $25,596 425 57%
Charlotte Technical College $25,756 742 74%
Radford M� Locklin Technical Center $26,040 302 59%
Orange Technical College–Orlando Campus $26,088 980 72%
Orange Technical College–Winter Park Campus $26,120 739 69%
Gadsden Technical Institute $26,392 64 67%
Traviss Technical College $27,012 1,060 74%
Ridge Technical College $27,028 1,400 74%
Robert Morgan Educational Center and Technical College $27,156 1,241 64%
Lorenzo Walker Technical College $27,348 1,254 76%
Marion Technical College $27,460 1,400 74%
Atlantic Technical College $27,508 1,848 68%
Riveroak Technical College $27,524 276 67%
Immokalee Technical College $27,912 435 69%
Manatee Technical College $27,912 2,283 75%

Measuring the Economic Success of Florida’s Graduates29
District Technical Center Median First-Year Earnings
Number Employed
Percent Employed
Pinellas Technical College–St� Petersburg Campus $27,996 1,921 72%
Florida Statewide Median, Career Certificates, DTCs $28,024 50,799 70%
Okaloosa Technical College and Choice High School $28,252 446 61%
Sheridan Technical College $28,464 3,313 64%
Technical Education Center of Osceola (TECO) $28,472 1,173 74%
Emerald Coast Technical College $28,552 276 73%
First Coast Technical College $28,708 1,788 72%
Lake Technical College $28,740 1,899 76%
William T� McFatter Technical College $28,796 2,452 69%
Erwin Technical College $28,800 1,908 73%
Withlacoochee Technical College $29,024 1,024 71%
Orange Technical College–Mid-Florida Campus $29,936 1,769 73%
Suncoast Technical College $30,008 1,328 77%
Pinellas Technical College–Clearwater Campus $30,112 1,507 69%
Florida Panhandle Technical College $30,976 1,012 67%
Big Bend Technical College $31,124 218 67%
George Stone Area Vocational Technical Center $31,304 1,165 69%
Miami Lakes Educational Center and Technical College $32,688 1,510 66%
Bradford-Union Technical Center $33,320 305 63%
Monroe County Adult and Community Education $34,636 17 49%
Fort Myers Technical College $35,388 2,475 80%
George T� Baker Aviation Technical College $36,924 517 78%
As noted previously, the gap in earnings could be driven in part by the labor market served by the different DTCs� The mix of program offerings will also affect overall earnings outcomes� DTCs that focus on higher-paying occupations and industries will have graduates with higher median first-year earnings than DTCs that graduate more students in lower earning occupations and professions�
Figure 11 shows the median first-year earnings of graduates with career certificates awarded by DTCs� Earnings outcomes varied considerably, ranging from $21,132 (South Dade Technical College) to $36,924 (George T� Baker Aviation Technical College)�
Figure 12 shows the range of median first-year earnings of graduates from DTCs who completed a career certificate in Practical Nursing, compared with the overall median first-year earnings of completers among all career certificates awarded by that DTC� With the exception of Miami Lakes Educational Center and Technical College, the median first-year earnings for graduates with a career certificate in Practical Nursing exceeded the overall median first-year earnings among all completers from that DTC�
Table 5: Continued

Economic Security Report 2017 30
Figure 11: Median First-Year Earnings of Completers With Career Certificates, by District Technical Center
$0 5K 10K 15K 20K 25K 30K 35K 40K
$21,132$21,344
$22,208$22,264$22,556
$22,968$23,108
$23,380$24,016
$24,240$24,324
$24,408$24,532
$25,328$25,460$25,544$25,596
$25,756$26,040$26,088$26,120$26,392
$27,012$27,028
$27,156$27,348$27,460$27,508$27,524$27,912$27,912$27,996
$28,024$28,252$28,464$28,472
$28,552$28,708$28,740
$28,796$28,800$29,024
$29,936$30,008
$30,112$30,976$31,124$31,304
$32,688
$33,320
$34,636$35,388
$36,924George T. Baker Aviation Technical CollegeFort Myers Technical College
Monroe County Adult and Community EducationBradford-Union Technical Center
Miami Lakes Educational Center and Technical CollegeGeorge Stone Area Vocational Technical Center
Big Bend Technical CollegeFlorida Panhandle Technical College
Pinellas Technical College–Clearwater CampusSuncoast Technical College
Orange Technical College–Mid-Florida CampusWithlacoochee Technical College
Erwin Technical CollegeWilliam T. McFatter Technical College
Lake Technical CollegeFirst Coast Technical College
Emerald Coast Technical CollegeTechnical Education Center of Osceola (TECO)
Sheridan Technical CollegeOkaloosa Technical College and Choice High School
Florida Statewide Median, Career Certificates, DTCsPinellas Technical College–St. Petersburg Campus
Manatee Technical CollegeImmokalee Technical College
Riveroak Technical CollegeAtlantic Technical College
Marion Technical CollegeLorenzo Walker Technical College
Robert Morgan Educational Center and Technical CollegeRidge Technical College
Traviss Technical CollegeGadsden Technical Institute
Orange Technical College–Winter Park CampusOrange Technical College–Orlando Campus
Radford M. Locklin Technical CenterCharlotte Technical CollegeFlagler Technical Institute
Tom P. Haney Technical CenterLindsey Hopkins Technical College
Cape Coral Technical CollegeLearey Technical College
Lively Technical CenterAparicio-Levy Technical College
The English CenterBrewster Technical College
Orange Technical College–Westside CampusTechnical Center for Career and Adult Education
Fred K. Marchman Technical CollegeDeSoto County Adult Education Center
Wakulla County Adult and Community EducationD.A. Dorsey Technical College
Sumter County Adult EducationSouth Dade Technical College

Measuring the Economic Success of Florida’s Graduates31
Figure 12: Median First-Year Earnings of Completers With Career Certificates Overall and Those With Career Certificates in Practical Nursing, by District Technical Center
$0 5K 10K 15K 20K 25K 30K 35K 40K 45K
Median First-Year Earnings—Practical Nursing Median First-Year Earnings—Overall
Gadsden Technical Institute
Bradford-Union Technical Center
Withlacoochee Technical College
Cape Coral Technical College
First Coast Technical College
Riveroak Technical College
Fort Myers Technical College
Pinellas Technical College–Clearwater Campus
Ridge Technical College
Lake Technical College
Charlotte Technical College
Manatee Technical College
Technical Center for Career and Adult Education
Orange Technical College–Orlando Campus
Florida Statewide Median,Career Certificates, DTCs
Erwin Technical College
Lively Technical Center
Lorenzo Walker Technical College
Atlantic Technical College
Traviss Technical College
Florida Panhandle Technical College
Pinellas Technical College–St. Petersburg Campus
Radford M. Locklin Technical Center
Immokalee Technical College
Suncoast Technical College
William T. McFatter Technical College
Technical Education Center of Osceola (TECO)
Brewster Technical College
Sheridan Technical College
Miami Lakes Educational Center and Technical College
Tom P. Haney Technical Center
Emerald Coast Technical College
Lindsey Hopkins Technical College
Okaloosa Technical College and Choice High School $28,252
$25,460
$28,552
$25,544
$32,688
$28,464
$24,016
$28,472
$28,796
$30,008
$27,912
$26,040
$27,996
$30,976
$27,012
$27,508
$27,348
$24,408
$28,800
$28,024
$26,088
$23,108
$27,912
$25,756
$28,740
$27,028
$30,112
$35,388
$27,524
$28,708
$25,328
$29,024
$33,320
$26,392
$28,820
$29,052
$29,940
$30,040
$30,276
$30,472
$30,564
$30,792
$31,212
$31,740
$31,820
$32,016
$32,824
$32,868
$32,900
$32,900
$32,908
$32,980
$33,144
$33,160
$33,600
$33,708
$33,776
$33,800
$34,244
$34,560
$35,092
$35,884
$35,976
$36,496
$36,600
$38,384
$38,448
$38,984

Economic Security Report 2017 32
Career Certificates Awarded by the Florida College System
Colleges in Florida also award career certificates, but not as many as awarded by DTCs� Colleges in Florida also produce career certificates in somewhat different areas than DTCs� As noted in Figure 13, the statewide median first-year earnings of completers with career certificates from FCS institutions were more than $34,700� Only completers of career certificates from Pensacola State College had median first-year earnings of less than $30,000� At the other end of the distribution, completers from six colleges (Florida Keys Community College, Hillsborough Community College, Polk State College, Valencia College, St� Petersburg College, and Broward College) had median first-year earnings of more than $42,000� Of those, the median first-year earnings of completers from Broward College exceeded $51,000� This broad range again shows why detailed program-level analysis is essential�
Figure 13: Median First-Year Earnings of Completers With Career Certificates, by College
$0 10K 20K 30K 40K 50K 60K
$26,600
$30,596
$31,192
$31,292
$31,668
$31,960
$32,516
$32,604
$32,672
$32,800
$33,032
$33,228
$33,488
$33,824
$33,824
$33,824
$33,880
$34,256
$34,772
$36,408
$36,516
$42,532
$43,284
$43,816
$44,580
$46,824
$51,476Broward College
St. Petersburg College
Valencia College
Polk State College
Hillsborough Community College
Florida Keys Community College
Miami Dade College
Tallahassee Community College
Florida Statewide Median, Career Certificates (FCS)St. Johns River State College
Gulf Coast State College
South Florida State College
Seminole State College of Florida
College of Central Florida
Santa Fe College
North Florida Community College
Florida Gateway College
Florida State College at Jacksonville
Palm Beach State College
Indian River State College
Northwest Florida State College
Eastern Florida State College
Florida SouthWestern State College
Chipola College
Pasco-Hernando State College
Daytona State College
Pensacola State College

Measuring the Economic Success of Florida’s Graduates33
College Credit CertificatesCollege credit certificate programs are a series of college credit courses (typically less than 60 credits) that prepare students for entry-level employment in specific career fields or for career advancement� The length of these programs varies, but generally they can be completed in one year or less, and they are part of an A�S� degree or an A�A�S� degree program� Programs are available in a wide range of vocations, from Information Technology Technician to Computer Programming� Florida’s colleges awarded more than 55,000 college credit certificates during the five-year study period�
With statewide median first-year earnings around $32,000, completers with college credit certificates had, on average, higher median first-year earnings than graduates with A�A� degrees and those who completed career certificates from DTCs� Completers from St� Johns River State College had the lowest median earnings, just over $28,000� In contrast, completers with college credit certificates from South Florida State College, North Florida Community College, and Chipola College had median first-year earnings that exceeded $41,000�
Table 6 shows that the percentage of completers found employed in the state also varies widely, ranging from 61% of completers from Eastern Florida State College to 84% from Chipola College�

Economic Security Report 2017 34
Table 6: Employment Outcomes for Completers With College Credit Certificates, by College
College Number of Completers
Median First-Year Earnings
Number Employed
Percent Employed
Eastern Florida State College 2,120 $30,308 1,303 61%
St� Johns River State College 420 $28,292 267 64%
Daytona State College 2,175 $30,708 1,407 65%
Pensacola State College 686 $29,124 449 65%
Northwest Florida State College 683 $30,016 471 69%
Florida Gateway College 330 $31,224 230 70%
Florida Keys Community College 97 $30,240 68 70%
Florida State College at Jacksonville 3,644 $32,816 2,562 70%
Seminole State College of Florida 6,821 $31,756 4,887 72%
State College of Florida, Manatee-Sarasota 110 $32,088 79 72%
Indian River State College 1,509 $30,728 1,089 72%
Miami Dade College 5,064 $31,744 3,672 73%
Florida Statewide Median, College Credit Certificate 55,205 $32,120 40,052 73%
Valencia College 12,089 $29,740 8,788 73%
Polk State College 469 $28,648 341 73%
Lake-Sumter State College 150 $32,388 110 73%
Santa Fe College 1,029 $33,692 763 74%
Broward College 5,597 $34,332 4,180 75%
College of Central Florida 1,428 $32,816 1,070 75%
Tallahassee Community College 352 $38,508 265 75%
Palm Beach State College 2,210 $30,760 1,664 75%
Pasco-Hernando State College 472 $37,336 359 76%
St� Petersburg College 1,979 $39,676 1,508 76%
Hillsborough Community College 3,864 $33,720 2,964 77%
Gulf Coast State College 321 $34,092 252 79%
North Florida Community College 195 $42,976 156 80%
Florida SouthWestern State College 1,147 $33,348 945 82%
South Florida State College 140 $43,508 116 83%
Chipola College 118 $41,180 99 84%

Measuring the Economic Success of Florida’s Graduates35
Figure 14 identifies the median first-year earnings of completers with the most popular college credit certificates� Completers of college credit certificates in Child Care Provider/Assistant had the lowest median first-year earnings ($25,284), followed by Office Management and Supervision ($27,104)� At the high end of the scale, completers of college credit certificates in Emergency Medical Technology/Technician (EMT Paramedic) had median first-year earnings around $35,000, followed by Information Technology ($33,524)�
Figure 14: Median First-Year Earnings of Completers With College Credit Certificates in Popular Programs
$0 5K 10K 15K 20K 25K 30K 35K 40K
$25,284
$27,104
$27,580
$27,772
$29,612
$31,576
$31,728
$32,120
$32,220
$33,524
$35,100Emergency Medical Technology/Technician (EMT Paramedic)
Information Technology
Accounting Technology/Technician and Bookkeeping
Florida Statewide Median
Business Administration and Management, General
Entrepreneurship/Entrepreneurial Studies
Health Information/Medical Records Technology/Technician
Business/O�ce Automation/Technology/Data Entry
Computer Graphics
O�ce Management and Supervision
Child Care Provider/Assistant

Economic Security Report 2017 36
Higher education is often viewed as one of the most productive forms of human capital investment that individuals and taxpayers make� Up to this point, this report has focused primarily on earnings that are associated with the completion of the most common degrees and certificates awarded in Florida� This section examines public assistance8—another indicator of the financial well-being of students who complete different programs�
Table 7 reports the percentage of completers found in the wage database receiving public assistance� Of note, the levels reported are not adjusted for differences in the skill level or income level of students who enrolled in these different programs—that is, these outcome measures are unadjusted for such factors known to affect student success�
The range in the percentage of completers receiving public assistance is large, usually falling substantially with more advanced credentials�
Twenty-three percent of students with career certificates from DTCs received public assistance, which is far higher than the percentage of students earning the same credential at Florida colleges� Similarly, the percentage of students completing apprenticeships at DTCs and receiving public assistance was higher than that of students who completed apprenticeships at Florida colleges�
8 For purposes of this report, public assistance includes a unique count of graduates and completers who received support or services from the Temporary Assistance for Needy Families program and/or the Supplemental Nutrition Assistance Program�
LEVELS OF PUBLIC ASSISTANCE

Measuring the Economic Success of Florida’s Graduates37
Table 7: Level of Public Assistance, by Credential
Credential Number of Completers
Number Who Received Public
Assistance
Percent Public Assistance
Career Certificate (DTC) 72,830 16,789 23%
Apprenticeship (DTC) 5,004 723 14%
Applied Technology Diploma (DTC) 3,575 473 13%
Career Certificate (FCS) 47,618 6,141 13%
College Credit Certificate 55,205 6,288 11%
Associate in Applied Science Degree 8,122 878 11%
Apprenticeship (FCS) 1,233 110 9%
Associate in Arts Degree 279,194 23,966 9%
Applied Technology Diploma (FCS) 7,685 636 8%
Associate in Science Degree 64,537 5,244 8%
Bachelor's Degree (FCS) 24,203 1,735 7%
Certificate of Professional Preparation 201 11 5%
Advanced Technical Certificate 617 32 5%
Bachelor's Degree (SUS) 282,857 11,899 4%
Educator Preparation Institute Certificate 4,742 179 4%
Law, LLB or JD 4,724 131 3%
Master's Degree 80,937 1,384 2%
Pharmacy 2,858 47 2%
Specialist 1,268 19 2%
Doctorate Degree 12,138 65 1%
Completers With Career Certificates Who Received Public Assistance Table 8 shows the percentage of completers of career certificates who received public assistance by DTC� More than 30% of graduates and completers from these DTCs received public assistance: South Dade Technical College, D�A� Dorsey Technical College, Sumter County Adult Education, Gadsden Technical Institute, Brewster Technical College, Wakulla County Adult and Community Education, Lindsey Hopkins Technical College, Riveroak Technical College, DeSoto County Adult Education Center, Lively Technical Center, Immokalee Technical College, The English Center, and Aparicio-Levy Technical College� Of these, more than 40% of completers from five (South Dade Technical College, D�A� Dorsey Technical College, Sumter County Adult Education, Gadsden Technical Institute, and Brewster Technical College) received public assistance�

Economic Security Report 2017 38
Table 8: Completers With Career Certificates Who Received Public Assistance, by District Technical Center
District Technical Center Number of Completers
Number Who Received Public
Assistance
Percent Public Assistance
South Dade Technical College 645 320 50%
D�A� Dorsey Technical College 201 94 47%
Sumter County Adult Education 84 39 46%
Gadsden Technical Institute 95 44 46%
Brewster Technical College 840 366 44%
Wakulla County Adult and Community Education 107 41 38%
Lindsey Hopkins Technical College 1,806 640 35%
Riveroak Technical College 414 145 35%
DeSoto County Adult Education Center 203 69 34%
Lively Technical Center 1,704 566 33%
Immokalee Technical College 634 208 33%
The English Center 885 271 31%
Aparicio-Levy Technical College 338 102 30%
Big Bend Technical College 324 92 28%
Traviss Technical College 1,439 395 27%
Bradford-Union Technical Center 484 131 27%
Miami Lakes Educational Center and Technical College 2,303 619 27%
Learey Technical College 1,073 288 27%
Technical Center for Career and Adult Education 1,035 273 26%
Ridge Technical College 1,904 493 26%
Erwin Technical College 2,605 668 26%
Cape Coral Technical College 1,045 267 26%
Fred K� Marchman Technical College 489 123 25%
Orange Technical College–Westside Campus 1,388 345 25%
Robert Morgan Educational Center and Technical College 1,944 483 25%
Withlacoochee Technical College 1,445 352 24%
Pinellas Technical College–St� Petersburg Campus 2,675 650 24%
Florida Panhandle Technical College 1,504 362 24%
George Stone Area Vocational Technical Center 1,687 405 24%
Flagler Technical Institute 744 176 24%
Radford M� Locklin Technical Center 512 118 23%
Emerald Coast Technical College 378 87 23%
Tom P� Haney Technical Center 1,083 248 23%
Marion Technical College 1,891 429 23%
Sheridan Technical College 5,194 1,156 22%
Orange Technical College–Winter Park Campus 1,069 238 22%

Measuring the Economic Success of Florida’s Graduates39
District Technical Center Number of Completers
Number Who Received Public
Assistance
Percent Public Assistance
Technical Education Center of Osceola (TECO) 1,582 341 22%
Charlotte Technical College 1,007 216 21%
Orange Technical College–Orlando Campus 1,357 280 21%
Manatee Technical College 3,052 629 21%
Atlantic Technical College 2,710 528 19%
Okaloosa Technical College and Choice High School 727 138 19%
Pinellas Technical College–Clearwater Campus 2,178 408 19%
Lake Technical College 2,502 467 19%
First Coast Technical College 2,476 462 19%
Orange Technical College–Mid-Florida Campus 2,428 421 17%
Lorenzo Walker Technical College 1,651 284 17%
Fort Myers Technical College 3,106 522 17%
William T� McFatter Technical College 3,545 523 15%
Suncoast Technical College 1,734 214 12%
George T� Baker Aviation Technical College 666 61 9%
Table 8: Continued
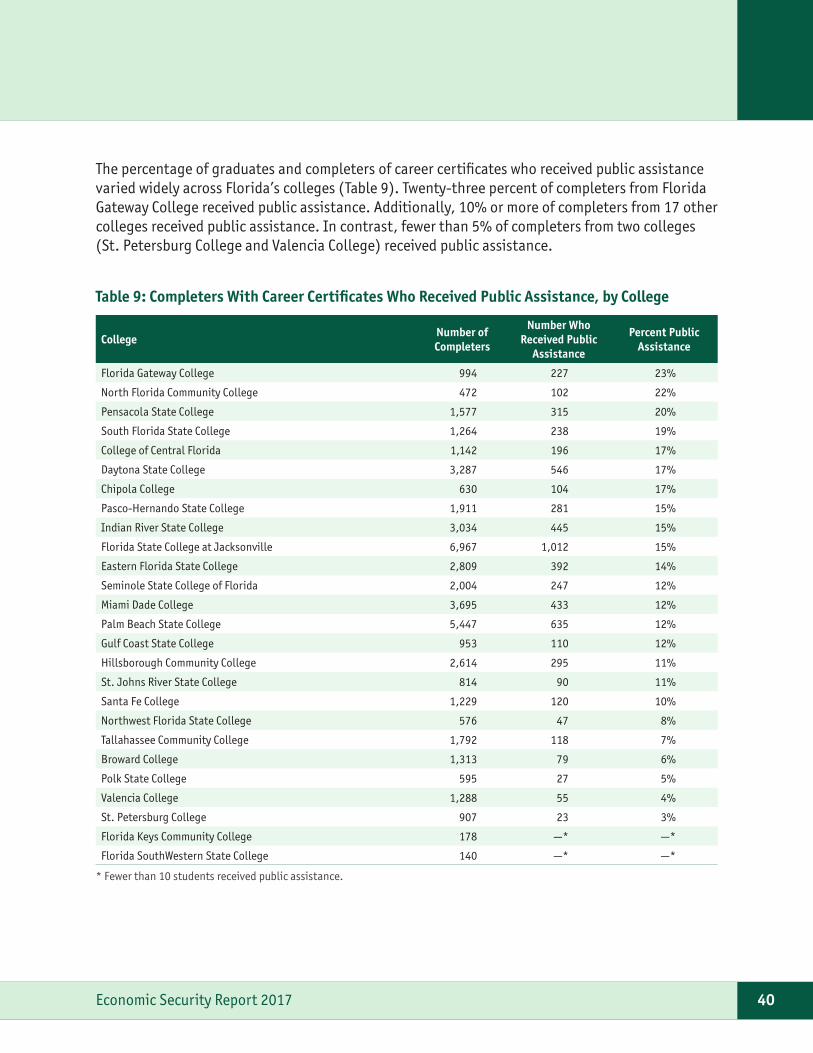
Economic Security Report 2017 40
The percentage of graduates and completers of career certificates who received public assistance varied widely across Florida’s colleges (Table 9)� Twenty-three percent of completers from Florida Gateway College received public assistance� Additionally, 10% or more of completers from 17 other colleges received public assistance� In contrast, fewer than 5% of completers from two colleges (St� Petersburg College and Valencia College) received public assistance�
Table 9: Completers With Career Certificates Who Received Public Assistance, by College
College Number of Completers
Number Who Received Public
Assistance
Percent Public Assistance
Florida Gateway College 994 227 23%
North Florida Community College 472 102 22%
Pensacola State College 1,577 315 20%
South Florida State College 1,264 238 19%
College of Central Florida 1,142 196 17%
Daytona State College 3,287 546 17%
Chipola College 630 104 17%
Pasco-Hernando State College 1,911 281 15%
Indian River State College 3,034 445 15%
Florida State College at Jacksonville 6,967 1,012 15%
Eastern Florida State College 2,809 392 14%
Seminole State College of Florida 2,004 247 12%
Miami Dade College 3,695 433 12%
Palm Beach State College 5,447 635 12%
Gulf Coast State College 953 110 12%
Hillsborough Community College 2,614 295 11%
St� Johns River State College 814 90 11%
Santa Fe College 1,229 120 10%
Northwest Florida State College 576 47 8%
Tallahassee Community College 1,792 118 7%
Broward College 1,313 79 6%
Polk State College 595 27 5%
Valencia College 1,288 55 4%
St� Petersburg College 907 23 3%
Florida Keys Community College 178 —* —*
Florida SouthWestern State College 140 —* —*
* Fewer than 10 students received public assistance�

Measuring the Economic Success of Florida’s Graduates41
Completers With College Credit Certificates Who Received Public AssistanceThe percentage of graduates and completers of college credit certificates who received public assistance varied considerably� As shown in Table 10, more than 10% of graduates and completers from 17 colleges received public assistance�
Table 10: Graduates and Completers With College Credit Certificates Who Received Public Assistance, by College
College Number of Completers
Number Who Received Public
Assistance
Percent Public Assistance
St� Johns River State College 420 84 20%
Daytona State College 2,175 399 18%
State College of Florida, Manatee-Sarasota 110 19 17%
College of Central Florida 1,428 243 17%
Indian River State College 1,509 241 16%
Pasco-Hernando State College 472 74 16%
Polk State College 469 69 15%
Pensacola State College 686 95 14%
Lake-Sumter State College 150 18 12%
Eastern Florida State College 2,120 254 12%
Florida Gateway College 330 39 12%
Miami Dade College 5,064 596 12%
Valencia College 12,089 1,399 12%
Gulf Coast State College 321 37 12%
Tallahassee Community College 352 40 11%
Florida State College at Jacksonville 3,644 408 11%
Seminole State College of Florida 6,821 758 11%
Hillsborough Community College 3,864 375 10%
Palm Beach State College 2,210 213 10%
Chipola College 118 11 9%
South Florida State College 140 13 9%
Santa Fe College 1,029 91 9%
Broward College 5,597 484 9%
St� Petersburg College 1,979 169 9%
North Florida Community College 195 15 8%
Florida SouthWestern State College 1,147 88 8%
Northwest Florida State College 683 52 8%
Florida Keys Community College 97 —* —*
* Fewer than 10 students received public assistance�

Economic Security Report 2017 42
Figure 15 displays median first-year earnings of graduates with academic degrees (bachelor’s, master’s, specialist, and doctorate), and Figure 16 shows median first-year earnings of graduates with professional degrees9 awarded by Florida’s universities� The three most common professional degrees are awarded in the fields of law, medicine, and pharmacy�
Figure 15 shows that earnings increase with every level of academic degree� For example, around $15,000 separated the median first-year earnings of graduates with doctorate degrees from those with master’s degrees� Similarly, around $15,000 separated the median first-year earnings of graduates with master’s degrees from those with bachelor’s degrees from Florida’s universities�
In addition to these well-known academic degrees, Florida offers several specialist degree programs that are designed for individuals who want to develop advanced knowledge and skills beyond the master’s degree but who do not want to pursue a doctorate� Median first-year earnings of graduates with specialist degrees fell closer to the earnings of those with master’s graduates than they did to the earnings of graduates with doctorate degrees� More information about the earnings associated with these degrees is presented later in this report�
Figure 16 shows the median first-year earnings of graduates with professional degrees� Law school graduates, after passing the bar exam, are fully licensed to practice law� Median first-year earnings ($46,748) of law school graduates are about $3,300 less than the median first-year earnings of all graduates with master’s degrees in the state� The median first-year earnings of graduates with medical degrees are higher, at $51,792� However, medical school graduates are not fully licensed as physicians until they complete their internship requirements� Because of these factors, graduates of other professional programs tend to earn far more than medical school graduates during their early years of employment�
9 These are post-baccalaureate programs of study that are designed to provide the training necessary for completers to enter into a profession�
DEGREES AND FIRST-YEAR EARNINGS AMONG GRADUATES FROM FLORIDA’S UNIVERSITIES

Measuring the Economic Success of Florida’s Graduates43
Figure 15: Median First-Year Earnings of Graduates With Academic Degrees From Universities, by Degree
$0 10K 20K 30K 40K 50K 60K 70K
$35,156
$50,072
$52,872
$66,204Doctorate Degree
Specialist
Master's Degree
Bachelor's Degree
Figure 16: Median First-Year Earnings of Graduates With Professional Degrees From Universities, by Degree
$0 20K 40K 60K 80K 100K 120K
$46,748
$51,792
$67,304
$105,992
$106,348Dentistry
Pharmacy
Veterinary Medicine
Medicine
Law, LLB or JD

Economic Security Report 2017 44
First-Year Earnings of Graduates With Bachelor’s DegreesThe bachelor’s degree is the most common degree awarded in the United States� Historically, a bachelor’s degree has been a good investment� According to data from the U�S� Department of Labor, Bureau of Labor Statistics, graduates with bachelor’s degrees nationwide earn on average approximately 65% per year more than high school graduates, and graduates with bachelor’s degrees are far less likely to be unemployed�10
However, these national data mask differences in the labor market outcomes of graduates with bachelor’s degrees� As is evident in the figures in this section, the return on investment among graduates from universities varies widely by institution and by major� In short, graduates do not earn just a bachelor’s degree; they earn a degree from a specific college or university and in a specific program� These choices have consequences for graduates when they enter the labor market� The data in this report and on the College Measures Launch My Career website enable readers to delve deeper into this variation�
Variation by University
Figure 17 shows the median first-year earnings of graduates with bachelor’s degrees by university�11 Median first-year earnings of such graduates varied substantially, ranging from $23,608 (New College of Florida) to more than $35,200 (Florida International University, University of South Florida, Florida Atlantic University, University of Central Florida, University of Florida, and University of North Florida)� Of note, universities serve different economic areas of the state, and both Florida Atlantic and Florida International universities are located in one of the highest earnings areas in Florida�
10 http://www�bls�gov/emp/ep_chart_001�htm
11 Data for Florida Polytechnic University are not included in this report, because the university was established by law in 2012� Data for New College of Florida are not included in several tables in this report because it does not use the same classification of instructional programs as other public universities in the state that allow their data to be reported at the program level�
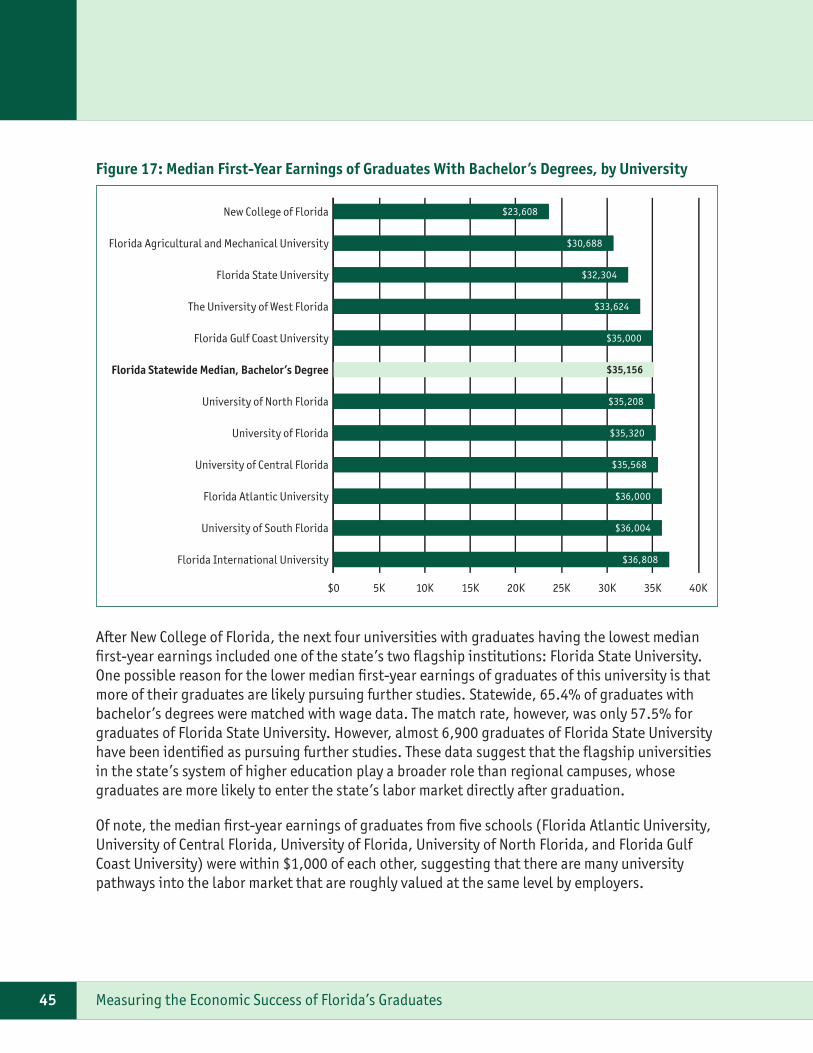
Measuring the Economic Success of Florida’s Graduates45
Figure 17: Median First-Year Earnings of Graduates With Bachelor’s Degrees, by University
$0 5K 10K 15K 20K 25K 30K 35K 40K
$23,608
$30,688
$32,304
$33,624
$35,000
$35,156
$35,208
$35,320
$35,568
$36,000
$36,004
$36,808Florida International University
University of South Florida
Florida Atlantic University
University of Central Florida
University of Florida
University of North Florida
Florida Statewide Median, Bachelor’s Degree
Florida Gulf Coast University
The University of West Florida
Florida State University
Florida Agricultural and Mechanical University
New College of Florida
After New College of Florida, the next four universities with graduates having the lowest median first-year earnings included one of the state’s two flagship institutions: Florida State University� One possible reason for the lower median first-year earnings of graduates of this university is that more of their graduates are likely pursuing further studies� Statewide, 65�4% of graduates with bachelor’s degrees were matched with wage data� The match rate, however, was only 57�5% for graduates of Florida State University� However, almost 6,900 graduates of Florida State University have been identified as pursuing further studies� These data suggest that the flagship universities in the state’s system of higher education play a broader role than regional campuses, whose graduates are more likely to enter the state’s labor market directly after graduation�
Of note, the median first-year earnings of graduates from five schools (Florida Atlantic University, University of Central Florida, University of Florida, University of North Florida, and Florida Gulf Coast University) were within $1,000 of each other, suggesting that there are many university pathways into the labor market that are roughly valued at the same level by employers�
Economic Security Report 2017 46
Variation by Fields of Study
Figure 18 displays the median first-year earnings of graduates from the most popular fields of study in Florida� The median first-year earnings varied considerably between the lowest and highest paying fields� Graduates with degrees in Biology/Biological Sciences General had the lowest first-year earnings, around $8,000 less than the statewide median�12 Graduates with degrees in four other fields (Psychology, General; English Language and Literature, General; Criminal Justice/Safety Studies; and Political Science and Government, General) also fell at the bottom of the earnings distribution�
Graduates who majored in business-related fields (Business Administration and Management, General; Finance, General; and Accounting) were among the highest first-year earners� Graduates with degrees in Accounting were the highest paid among these popular programs� However, graduates with degrees in Marketing/Marketing Management, General another business-related field, had first-year earnings barely above the statewide median�
Graduates with degrees in Registered Nursing had average first-year earnings that were over $19,000 higher than the statewide median, which places them among the highest paid graduates in the state�
12 Graduates with degrees in Biology had low median first-year earnings, but they often experienced high rates of growth in earnings� Several years after graduation, the average earnings of graduates with degrees in Biology are often higher than the earnings of graduates in other fields who may have earned more immediately after graduation�

Measuring the Economic Success of Florida’s Graduates47
Figure 18: Median First-Year Earnings of Graduates From Popular Bachelor’s Degree Programs, by Program
$0 10K 20K 30K 40K 50K 60K
$26,876
$28,060
$29,384
$30,536
$30,964
$35,156
$35,508
$37,244
$39,744
$41,796
$54,472Registered Nursing/Registered Nurse
Accounting
Finance, General
Business Administration and Management, General
Marketing/Marketing Management, General
Florida Statewide Median, Bachelor’s Degree (SUS)
Political Science and Government, General
Criminal Justice/Safety Studies
English Language and Literature, General
Psychology, General
Biology/Biological Sciences, General
Variation Across Fields of Study in Different Universities
The median first-year earnings in the same fields varied substantially across universities� Figures 19–21 show the earnings of graduates from two of the most popular undergraduate programs in the state, Psychology and Business, plus data on the earnings of graduates in two important STEM (Science, Technology, Engineering, and Mathematics) fields: Biology and Mathematics�
These figures display the median first-year earnings for each area of study and the statewide median first-year earnings for all bachelor’s degrees� This allows a comparison of the relative performance of each area of study and offers a sense of how well graduates from that area of study fare in the labor market relative to all graduates with bachelor’s degrees from state universities� Again, differences in the size and strength of regional economies across the state affect some of the outcomes�

Economic Security Report 2017 48
Psychology is the most popular major on many campuses� The median first-year earnings of graduates with bachelor’s degrees in Psychology were lower than the statewide median for all recipients of bachelor’s degrees (Figure 19)� More than $5,200 separated the lowest median first-year earnings of graduates with bachelor’s degrees in Psychology (The University of West Florida) from the highest median first-year earnings (Florida International University)�13
Figure 19: Median First-Year Earnings of Graduates With Bachelor’s Degrees in Psychology, by University
$0 5K 10K 15K 20K 25K 30K 35K 40K
$25,068
$26,356
$26,412
$26,800
$27,172
$27,648
$28,060
$28,172
$28,260
$29,172
$30,316
$35,156Florida Statewide Median, Bachelor’s Degree
Florida International University
University of South Florida
University of North Florida
Florida Atlantic University
Florida Statewide Median, Bachelor’s Degree, Psychology
Florida Gulf Coast University
University of Central Florida
Florida Agricultural and Mechanical University
University of Florida
Florida State University
The University of West Florida
13 When considering the wage data from the state’s flagship universities, remember that many of their graduates may pursue additional advanced training or seek work out of state in an area not covered by WRIS2�
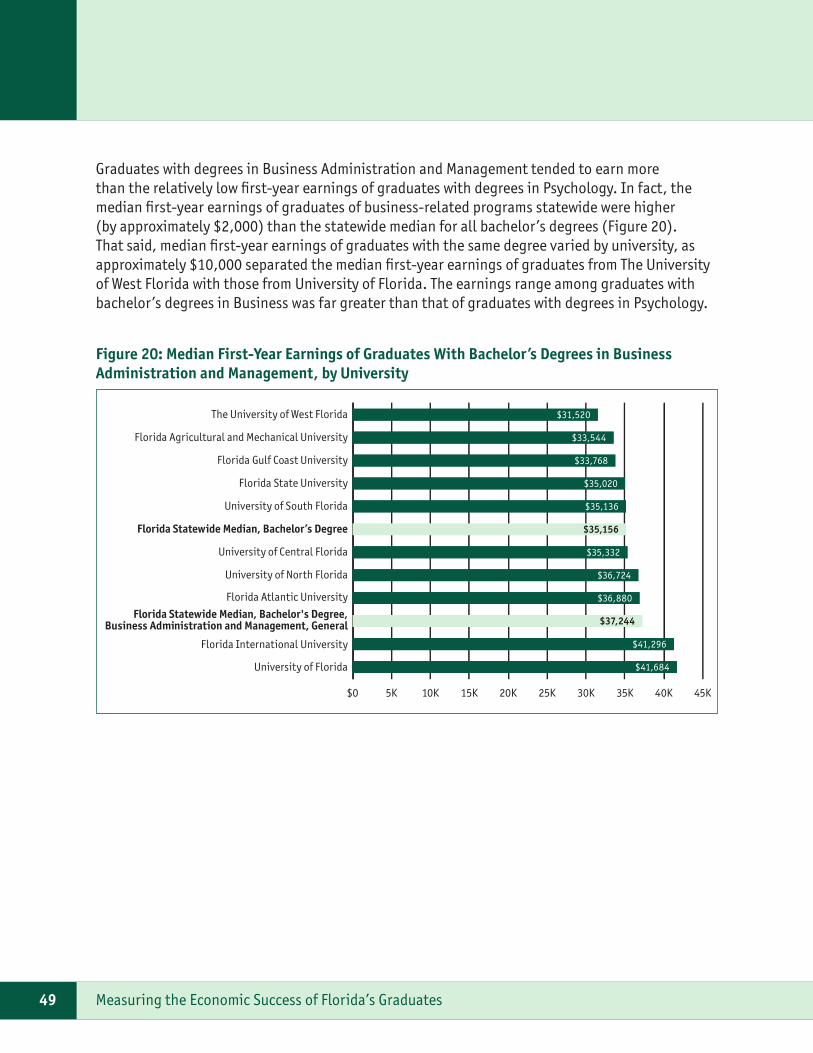
Measuring the Economic Success of Florida’s Graduates49
Graduates with degrees in Business Administration and Management tended to earn more than the relatively low first-year earnings of graduates with degrees in Psychology� In fact, the median first-year earnings of graduates of business-related programs statewide were higher (by approximately $2,000) than the statewide median for all bachelor’s degrees (Figure 20)� That said, median first-year earnings of graduates with the same degree varied by university, as approximately $10,000 separated the median first-year earnings of graduates from The University of West Florida with those from University of Florida� The earnings range among graduates with bachelor’s degrees in Business was far greater than that of graduates with degrees in Psychology�
Figure 20: Median First-Year Earnings of Graduates With Bachelor’s Degrees in Business Administration and Management, by University
$0 5K 10K 15K 20K 25K 30K 35K 40K 45K
$31,520
$33,544
$33,768
$35,020
$35,136
$35,156
$35,332
$36,724
$36,880
$37,244
$41,296
$41,684University of Florida
Florida International University
Florida Statewide Median, Bachelor's Degree,Business Administration and Management, General
Florida Atlantic University
University of North Florida
University of Central Florida
Florida Statewide Median, Bachelor’s Degree
University of South Florida
Florida State University
Florida Gulf Coast University
Florida Agricultural and Mechanical University
The University of West Florida

Economic Security Report 2017 50
Like most states, Florida is interested in increasing the number of graduates with degrees in the STEM fields� Note in Figure 21, that the median first-year earnings of graduates with degrees in Biology were lower than those of graduates with degrees in Mathematics from the same university� In the case of the University of North Florida, the difference is small, but the difference in earnings between the two majors is more than $10,000 for graduates from several other universities� Based on median first-year earnings, the labor market clearly rewards recent graduates with degrees in Mathematics more so than most graduates with other degrees, including Biology�
Remember, these patterns reflect earnings of graduates in their first year after graduation� Patterns may change over time� Data for longer term outcomes are available at the Launch My Career website: http://www�launchmycareerFL�org�
Figure 21: Median First-Year Earnings of Graduates With Bachelor’s Degrees in Biology or Mathematics, by University
$0 5K 10K 15K 20K 25K 30K 35K 40K 45K
$28,000
$31,752
$33,600
$34,764
$35,816
$36,312
$37,320
$38,184
$40,744
$41,488
$41,692
$26,552
$27,876
$23,340
$27,328
$27,088
$29,520
$26,876
$25,452
$27,208
$24,512
$26,772University of Central Florida
University of Florida
Florida Gulf Coast University
Florida State University
Florida Statewide Median
Florida Atlantic University
Florida Agricultural and Mechanical University
University of South Florida
The University of West Florida
Florida International University
University of North Florida
Mathematics, GeneralBiology/Biological Sciences, General

Measuring the Economic Success of Florida’s Graduates51
Enrollment Patterns in Continuing Education of Students With Bachelor’s DegreesAs is the case nationwide, the bachelor’s degree is the highest degree that most students in Florida’s universities will attain� Statewide, about 17% of graduates with bachelor’s degrees continue their education in Florida one year after graduation�14 Table 11 shows the rate of continuing enrollment was within 2 percentage points of the state median for eight of the 11 universities� Only three universities fell outside this tight cluster� At the high end, about 23% of graduates with bachelor’s degrees from the University of Florida were enrolled in continuing education� In contrast, graduates with bachelor’s degrees from New College of Florida were 10 percentage points below the state median—only 7% of its graduates were enrolled in continuing education in the state� Similarly, only 13% of graduates from the University of North Florida were enrolled in continuing education�
Table 11: Percentage of Students With Bachelor’s Degrees Who Were Enrolled in Continuing Education, by University
Institution Percent Continuing Education
New College of Florida 7%
University of North Florida 13%
University of Central Florida 15%
Florida Gulf Coast University 16%
Florida Atlantic University 16%
The University of West Florida 17%
University of South Florida 17%
Florida Statewide Median, Bachelor’s Degree (SUS) 17%
Florida State University 18%
Florida International University 18%
Florida Agricultural and Mechanical University 18%
University of Florida 23%
14 This can be full time or part time� Data show only whether students were enrolled, not whether they completed an advanced degree or certificate� These enrollment data are for students enrolled within the state of Florida and do not include students who may be studying in other states�

Economic Security Report 2017 52
Table 12 shows the percentage of students continuing their education among the most popular fields of study�15 Despite the tight clustering of universities around enrollment in continuing education, there is substantial variation across fields� For example, among all of the fields listed in Table 12, graduates with bachelor’s degrees in Business Administration and Management and Finance were less likely to be enrolled in continuing education in the state� But note that graduates with bachelor’s degrees in Accounting, another popular business-related program, had high rates of enrollment in continuing education� Around 30% of graduates with degrees in Accounting were enrolled in continuing education� Graduates with bachelor’s degrees in Health Services/Allied Health/Health Sciences, General were also more likely than graduates from most other programs to be continuing their education� And 38% of graduates with a bachelor’s degree in Social Work were doing so—the highest percentage from these popular fields of study� Much of this variation is likely associated with occupations where a graduate degree or post-baccalaureate certification is typically required for professional practice�
Table 12: Percentage of Students With Bachelor’s Degrees Who Were Enrolled in Continuing Education, by Popular Area of Study
Program Percent Continuing Education
Business Administration and Management, General 10%
Finance, General 12%
Registered Nursing/Registered Nurse 12%
Elementary Education and Teaching 12%
English Language and Literature, General 15%
Political Science and Government, General 18%
Criminal Justice/Safety Studies 20%
History, General 20%
Psychology, General 22%
Biology/Biological Sciences, General 27%
Accounting 30%
Health Services/Allied Health/Health Sciences, General 33%
Social Work 38%
15 Each program had more than 1,000 students in continuing education�

Measuring the Economic Success of Florida’s Graduates53
Debt Levels Among Students in Florida’s UniversitiesStudent debt is a growing concern nationwide� Totaling more than $1 trillion, student debt now surpasses outstanding credit card debt and automobile loans and is second only to home mortgages�16 Many students default on their loans, and because student loans cannot be discharged in bankruptcy, the consequences of accumulating debt that cannot be paid off can be long term and financially devastating�
Similar to the debt levels reported previously for Florida’s colleges, data on debt are reported by each public university� The data reflect the average federal student loan debt of all students (not just graduates) attending universities during 2014–15� Data also include federal student loans from Stafford, Perkins, Graduate PLUS, Parent PLUS, and TEACH programs� The average student loan debt represents the total amount of student loans for 2014–15 at each university, divided by the number of students attending the university that academic year� The average does not include private loans or other debt issued by nonfederal government sources that students may have sought to help finance their education�
As shown in Figure 22, the average statewide federal loan amount per student was slightly more than $6,500� However, the range varied among universities, from approximately $4,750 (Florida Gulf Coast University) to more than $9,250 (University of Florida)� Because this disbursement amount includes loans to both graduate and undergraduate students, there may be some upward bias on the amount reported in research universities, such as Florida State University and the University of Florida�
Figure 22: Average Federal Loan Amount per Student, by University, 2014–15
$0 1K 2K 3K 4K 5K 6K 7K 8K 9K 10K
$4,747
$5,254
$5,412
$5,431
$5,687
$6,184
$6,461
$6,567
$6,809
$7,632
$9,263University of Florida
Florida International University
University of South Florida
Statewide Average Federal Loan Amount per Student,Public Universities
Florida State University
Florida Agricultural and Mechanical University
Florida Atlantic University
University of Central Florida
University of West Florida
University of North Florida
Florida Gulf Coast University
16 The Federal Reserve Bank of New York issues periodic reports on the level of student debt� See for example, http://www�newyorkfed�org/newsevents/news/research/2015/rp150217�html�

Economic Security Report 2017 54
Bachelor’s Degrees Earned at Florida State CollegesIn many states, including Florida, two-year colleges have been awarding bachelor’s degrees� The authority to award bachelor’s degrees is usually limited to more technical areas that are aligned with the career orientation of certificates and associate degrees that are core to the mission of two-year colleges�
During the five-year study period, colleges in the state of Florida awarded over 24,000 bachelor’s degrees� This was less than 10% of the number of bachelor’s degrees granted by the Florida university system� Moreover, these degrees were concentrated in a small number of areas of study (Table 13)�
Table 13: Bachelor’s Degrees Awarded by Colleges in Florida, by Area of Study
Area of StudyNumber of Bachelor's
Degrees
Percent of Bachelor's
Degrees
Communication, Journalism, and Related Programs 32 0%
Natural Resources and Conservation —* —*
Communications Technologies/Technicians and Support Services —* —*
Legal Professions and Studies 172 1%
Visual and Performing Arts 218 1%
Biological and Biomedical Sciences 265 1%
Engineering Technologies and Engineering-Related Fields 271 1%
Public Administration and Social Service Professions 327 1%
Computer and Information Sciences and Support Services 1,265 5%
Homeland Security, Law Enforcement, Firefighting, and Related Protective Services 1,586 7%
Education 3,817 16%
Health Professions and Related Programs 5,774 24%
Business, Management, Marketing, and Related Support Services 10,231 42%
Total 24,211 100%
* Numbers suppressed for privacy reasons�

Measuring the Economic Success of Florida’s Graduates55
Table 14 shows the median first-year earnings of graduates with bachelor’s degrees awarded by Florida’s colleges by area of study� The areas of study listed in Table 14 are relatively high-paying� Not surprising then, the median first-year earnings of graduates with bachelor’s degrees from Florida’s colleges (about $42,900) were higher than those of graduates with bachelor’s degrees from Florida’s universities (about $35,150, as shown in Figure 19), which offer bachelor’s degrees in more areas of study, including many in traditional arts and humanities�
Earning outcomes varied across areas of study� The median first-year earnings for graduates with bachelor’s degrees in Registered Nursing/Registered Nurse17 were about $65,000, which exceeded the statewide median for bachelor’s degrees from colleges by more than $22,000� The median first-year earnings for graduates with bachelor’s degrees in Business Administration, Management and Operations, Other were approximately $37,600, which fell below the statewide median for bachelor’s degrees from colleges by approximately $5,000�
Table 14: Median First-Year Earnings of Graduates With Bachelor’s Degrees Awarded by Colleges, by Area of Study18
Area of Study Number of Completers
Median First-Year Earnings
Health Services/Allied Health/Health Sciences, General 42 $106,928Registered Nursing/Registered Nurse 4,320 $65,252Respiratory Care Therapy/Therapist 30 $58,688Dental Hygiene/Hygienist 271 $53,192Medical Radiologic Technology/Science–Radiation Therapist 31 $53,100Clinical Laboratory Science/Medical Technology/Technologist 30 $52,768Electrical, Electronic and Communications Engineering Technology/Technician 42 $52,140Construction Engineering Technology/Technician 34 $49,928Computer/Information Technology Services Administration and Management, Other 684 $48,784Fire Services Administration 21 $46,564Computer Systems Networking and Telecommunications 229 $46,172
17 In 2010, the U�S� Department of Education reclassified Nursing/Registered Nurse (CIP code 51�1601) to Registered Nursing/Registered Nurse (CIP code 51�3801)� Some institutions granted both degrees during the transition� This represents the weighted average of those two CIP codes�
18 Note: A bachelor’s in Applied Science degree in Allied Health from Miami Dade College includes a Physician’s Assistant pathway� The Accreditation Review Commission on Education for the Physician Assistant requires all Physician Assistant Programs by 2020 to award a graduate degree� Also, during the years covered by this report, the nursing programs that offered a bachelor’s degree in Nursing (B�S�N�) through the FCS were considered post-licensure programs, meaning that students entering these programs already had a Registered Nurse license and were completing additional coursework to receive a B�S�N� These two cases should serve as a reminder that the data reported here reflect a specific timeframe and that, given the dynamic nature of Florida’s postsecondary system, readers are encouraged to go to the websites of colleges and universities to review any program changes that may have taken place since these data were collected�

Economic Security Report 2017 56
Area of Study Number of Completers
Median First-Year Earnings
Information Technology 352 $45,188Engineering Technologies and Engineering-Related Fields, Other 169 $44,180Logistics, Materials, and Supply Chain Management 15 $43,224Florida Statewide Median, Bachelor’s Degrees, FCS 24,203 $42,932Architectural Engineering Technology/Technician 16 $41,492Special Education and Teaching, General 1,196 $40,176Homeland Security, Law Enforcement, Firefighting, and Related Protective Services, Other 1,451 $40,100Biology Teacher Education 72 $39,796Health Services Administration 494 $39,776Veterinary/Animal Health Technology/Technician and Veterinary Assistant 125 $39,164Purchasing, Procurement/Acquisitions and Contracts Management 522 $39,108Mathematics Teacher Education 287 $39,052Management Information Systems, General 184 $39,032Business Administration and Management, General 577 $39,000Elementary Education and Teaching 1,354 $38,448Early Childhood Education and Teaching 670 $37,996English/Language Arts Teacher Education 37 $37,716Business Administration, Management and Operations, Other 8,727 $37,672Science Teacher Education/General Science Teacher Education 70 $37,548International Business/Trade/Commerce 165 $36,716Public Administration 65 $36,480Health/Health Care Administration/Management 332 $35,588Natural Resources Management and Policy, Other 111 $35,328Legal Assistant/Paralegal 172 $34,924Orthotist/Prosthetist 99 $34,156Animation, Interactive Technology, Video Graphics, and Special Effects 142 $33,784Finance, General 41 $33,748Criminal Justice/Safety Studies 114 $33,368Interior Design 94 $33,308Energy Management and Systems Technology/Technician 10 $31,676Cinematography and Film/Video Production 124 $30,916Human Services, General 262 $30,704Biology/Biological Sciences, General 210 $30,528Education, Other 131 $30,364Biomedical Sciences, General 55 $30,060Mass Communication/Media Studies 32 $29,760
Table 14: Continued
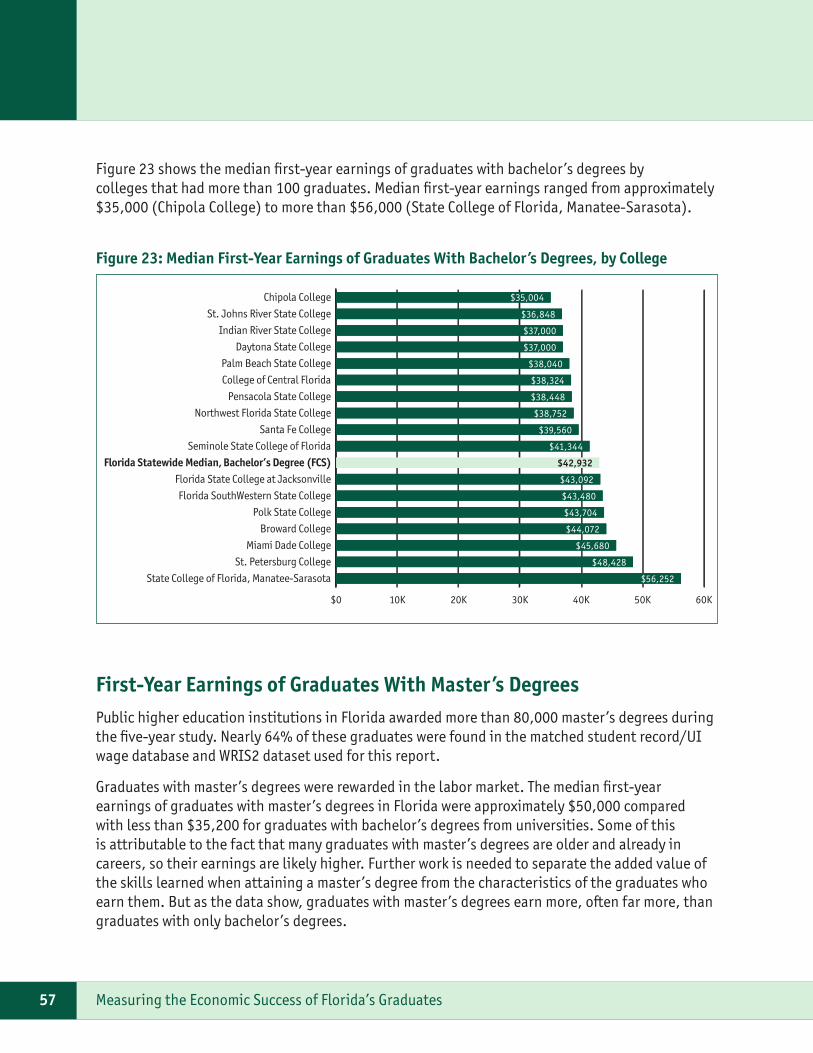
Measuring the Economic Success of Florida’s Graduates57
Figure 23 shows the median first-year earnings of graduates with bachelor’s degrees by colleges that had more than 100 graduates� Median first-year earnings ranged from approximately $35,000 (Chipola College) to more than $56,000 (State College of Florida, Manatee-Sarasota)�
Figure 23: Median First-Year Earnings of Graduates With Bachelor’s Degrees, by College
$0 10K 20K 30K 40K 50K 60K
$35,004
$36,848
$37,000
$37,000
$38,040
$38,324
$38,448
$38,752
$39,560
$41,344
$42,932
$43,092
$43,480
$43,704
$44,072
$45,680
$48,428
$56,252State College of Florida, Manatee-Sarasota
St. Petersburg College
Miami Dade College
Broward College
Polk State College
Florida SouthWestern State College
Florida State College at Jacksonville
Florida Statewide Median, Bachelor’s Degree (FCS)Seminole State College of Florida
Santa Fe College
Northwest Florida State College
Pensacola State College
College of Central Florida
Palm Beach State College
Daytona State College
Indian River State College
St. Johns River State College
Chipola College
First-Year Earnings of Graduates With Master’s DegreesPublic higher education institutions in Florida awarded more than 80,000 master’s degrees during the five-year study� Nearly 64% of these graduates were found in the matched student record/UI wage database and WRIS2 dataset used for this report�
Graduates with master’s degrees were rewarded in the labor market� The median first-year earnings of graduates with master’s degrees in Florida were approximately $50,000 compared with less than $35,200 for graduates with bachelor’s degrees from universities� Some of this is attributable to the fact that many graduates with master’s degrees are older and already in careers, so their earnings are likely higher� Further work is needed to separate the added value of the skills learned when attaining a master’s degree from the characteristics of the graduates who earn them� But as the data show, graduates with master’s degrees earn more, often far more, than graduates with only bachelor’s degrees�

Economic Security Report 2017 58
Like the first-year earnings of graduates with bachelor’s degrees, the first-year earnings of graduates with master’s degrees varied considerably by area of study and institution� For area of study, the earnings gained for having a master’s degree, not just a bachelor’s degree, ranged from approximately $7,000 (Social Work) to approximately $26,000 (Business Administration and Management, General and Registered Nursing/Registered Nurse)� Clearly, the extent of the benefit of earning a master’s degree is associated with area of study (Figure 24)�
Figure 24: Median First-Year Earnings of Graduates With Bachelor’s or Master’s Degrees, by Popular Fields of Study
$0 10K 20K 30K 40K 50K 60K 70K 80K 90K
$37,880
$44,152
$54,384
$60,688
$63,672
$81,428
$30,832
$29,364
$41,796
$35,436
$37,244
$54,472Registered Nursing/Registered Nurse
Business Administration and Management, General
Business/Commerce, General
Accounting
Public Health, General
Social Work
Master’s Degree (SUS)Bachelor’s Degree (SUS)
Figure 25 shows that the median first-year earnings of graduates with master’s degrees differ across institutions� Graduates with master’s degrees from Florida Agricultural and Mechanical (A&M) University had median first-year earnings of less than $40,000, and those from The University of West Florida and Florida State University were less than $45,000� In contrast, graduates with master’s degrees from four universities (University of Florida, Florida International University, Florida Atlantic University, and University of South Florida) had median first-year earnings of more than $50,000�
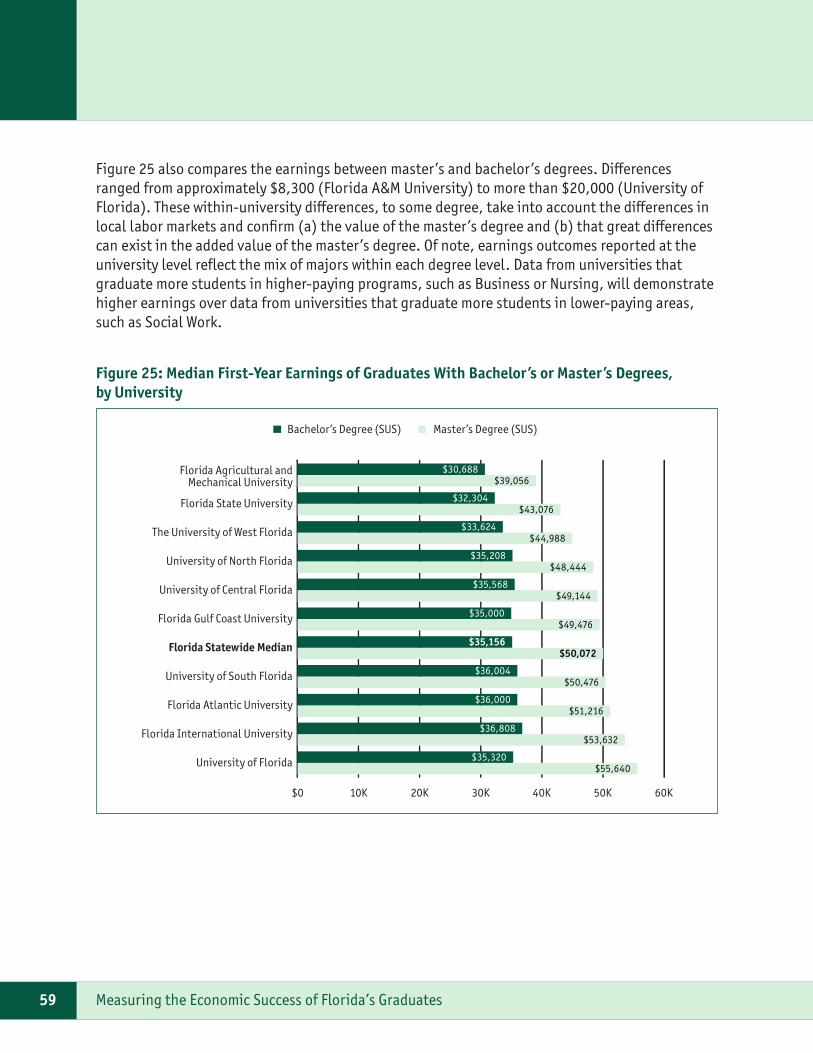
Measuring the Economic Success of Florida’s Graduates59
Figure 25 also compares the earnings between master’s and bachelor’s degrees� Differences ranged from approximately $8,300 (Florida A&M University) to more than $20,000 (University of Florida)� These within-university differences, to some degree, take into account the differences in local labor markets and confirm (a) the value of the master’s degree and (b) that great differences can exist in the added value of the master’s degree� Of note, earnings outcomes reported at the university level reflect the mix of majors within each degree level� Data from universities that graduate more students in higher-paying programs, such as Business or Nursing, will demonstrate higher earnings over data from universities that graduate more students in lower-paying areas, such as Social Work�
Figure 25: Median First-Year Earnings of Graduates With Bachelor’s or Master’s Degrees, by University
$0 10K 20K 30K 40K 50K 60K
$39,056
$43,076
$44,988
$48,444
$49,144
$49,476
$50,072
$50,476
$51,216
$53,632
$55,640
$30,688
$32,304
$33,624
$35,208
$35,568
$35,000
$35,156
$36,004
$36,000
$36,808
$35,320University of Florida
Florida International University
Florida Atlantic University
University of South Florida
Florida Statewide Median
Florida Gulf Coast University
University of Central Florida
University of North Florida
The University of West Florida
Florida State University
Florida Agricultural andMechanical University
Master’s Degree (SUS)Bachelor’s Degree (SUS)

Economic Security Report 2017 60
Specialist DegreesDuring the five-year study, Florida’s universities awarded more than 1,000 specialist degrees� As noted previously, the specialist degree is an advanced degree designed for people who want to develop skills beyond the master’s level but who are not interested in pursuing a doctorate degree� Most specialist degrees awarded were concentrated in education-based professions, such as Curriculum and Instruction, and Educational Leadership and Administration�
Figure 26 displays the median first-year earnings of graduates with specialist degrees for all programs in Florida� Median first-year earnings varied widely: Approximately $25,000 separated the lowest median first-year earnings (Marriage and Family Therapy/Counseling) from the highest median first-year earnings (Education, General)� Clearly, choosing the right specialty for this type of degree can have a significant impact on earnings�
Figure 26: Median First-Year Earnings of Graduates With Specialist Degrees, by Program
$0 10K 20K 30K 40K 50K 60K 70K
$35,296
$37,972
$43,256
$45,432
$54,584
$55,924
$56,000
$56,472
$60,416Education, General
Educational Leadership and Administration, General
Special Education and Teaching, General
Curriculum and Instruction
School Psychology
Library and Information Science
Counselor Education/School Counselingand Guidance Services
Mental Health Counseling/Counselor
Marriage and Family Therapy/Counseling

Measuring the Economic Success of Florida’s Graduates61
Figure 27 displays the median first-year earnings of graduates with specialist degrees by university� Here again, median first-year earnings varied considerably, ranging from less than $50,000 (Florida State University and University of Florida) to more than $65,000 (Florida Gulf Coast University)� Graduates tended to experience greater earnings if they attended universities in larger metropolitan areas�
Figure 27: Median First-Year Earnings of Graduates With Specialist Degrees, by University
$0 10K 20K 30K 40K 50K 60K 70K
$48,024
$49,924
$51,320
$52,844
$52,872
$56,932
$57,732
$60,964
$62,180
$66,136Florida Gulf Coast University
University of South Florida
Florida Agricultural and Mechanical University
Florida International University
Florida Atlantic University
Florida Statewide Median, Specialist Degree
University of Central Florida
The University of West Florida
University of Florida
Florida State University
As noted previously, one of the main values of the data used in this report is that they are built around the earnings of graduates from specific programs offered by specific universities� This allows a more detailed analysis than the area of study or the institutional-level analysis presented in Figures 26 and 27�
Figures 28 and 29 report data on the earnings of graduates at all three levels of post-baccalaureate degrees (master’s, specialist, and doctorate) for two popular specialties: Educational Leadership and Administration (2,331 master’s, 393 specialist, and 361 doctorate degrees) and Curriculum and Instruction (1,895 master’s, 298 specialist, and 517 doctorate degrees)�
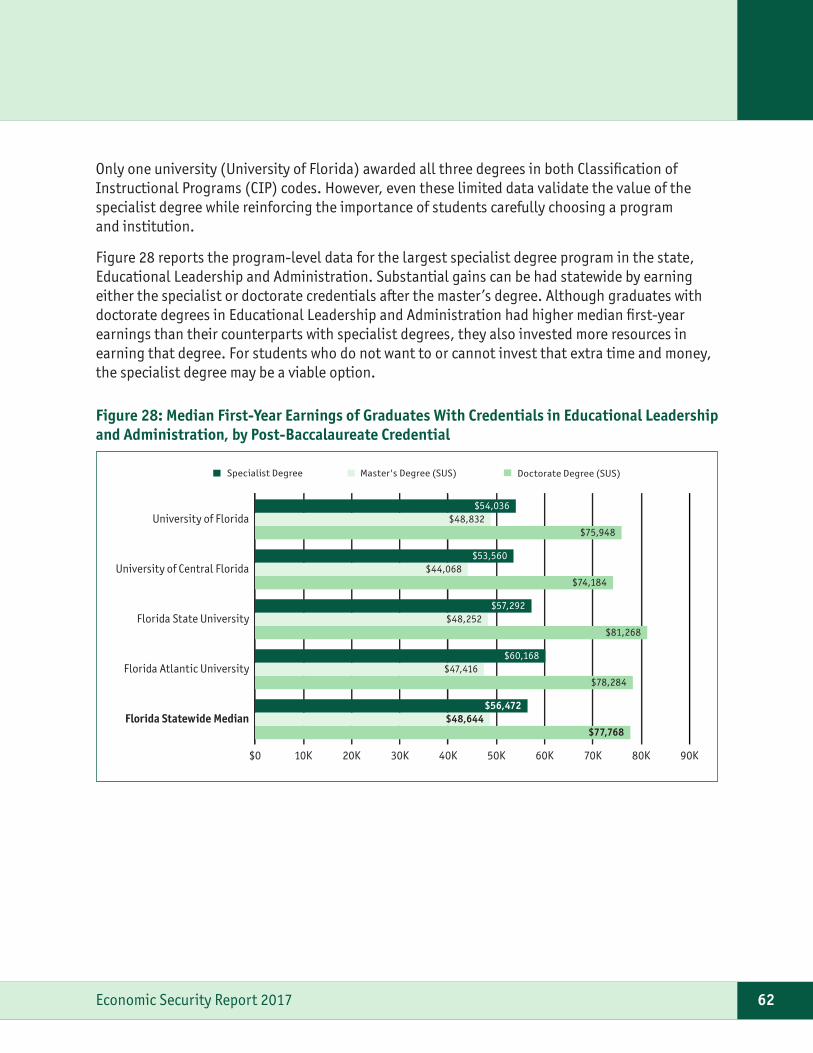
Economic Security Report 2017 62
Only one university (University of Florida) awarded all three degrees in both Classification of Instructional Programs (CIP) codes� However, even these limited data validate the value of the specialist degree while reinforcing the importance of students carefully choosing a program and institution�
Figure 28 reports the program-level data for the largest specialist degree program in the state, Educational Leadership and Administration� Substantial gains can be had statewide by earning either the specialist or doctorate credentials after the master’s degree� Although graduates with doctorate degrees in Educational Leadership and Administration had higher median first-year earnings than their counterparts with specialist degrees, they also invested more resources in earning that degree� For students who do not want to or cannot invest that extra time and money, the specialist degree may be a viable option�
Figure 28: Median First-Year Earnings of Graduates With Credentials in Educational Leadership and Administration, by Post-Baccalaureate Credential
$0 10K 20K 30K 40K 50K 60K 70K 80K 90K
$75,948
$74,184
$81,268
$78,284
$77,768
$48,832
$44,068
$48,252
$47,416
$48,644
$54,036
$53,560
$57,292
$60,168
$56,472
Doctorate Degree (SUS)Master's Degree (SUS)Specialist Degree
Florida Statewide Median
Florida Atlantic University
Florida State University
University of Central Florida
University of Florida

Measuring the Economic Success of Florida’s Graduates63
Figure 29 displays the median first-year earnings of graduates at each of the three levels of post-baccalaureate credentials for the field of Curriculum and Instruction� Statewide, graduates with doctorate and specialist degrees in this field earned more than graduates with master’s degrees� This is also true for programs at each of the universities�
Figure 29: Median First-Year Earnings of Graduates With Credentials in Curriculum and Instruction, by Post-Baccalaureate Credential
$0 10K 20K 30K 40K 50K 60K 70K 80K
$70,148
$73,372
$72,564
$66,364
$69,824
$46,732
$50,492
$42,652
$51,784
$47,600
$61,232
$55,924
$50,336
Doctorate Degree (SUS)Master's Degree (SUS)Specialist Degree
$61,784
$55,924Florida Statewide Median
Florida International University
The University of West Florida
University of Florida
University of South Florida
Professional DegreesTable 15 reports the median first-year earnings of graduates of three professional doctorate degrees in Florida: Medicine, Law, and Pharmacy�
Graduates with professional degrees in Medicine made almost the same in their first year after graduation, regardless of the institution from which they graduated19; median first-year earnings were approximately $52,000� But as noted previously, this is likely the result of the structure of the profession, whereby the majority of medical school graduates first serve as interns, which is an essential step to gaining a license to practice medicine unsupervised�
19 This is based on data from three medical schools in Florida� Data for graduates of Florida Atlantic University, Florida International University, and University of Central Florida were not included in the database�

Economic Security Report 2017 64
Far more variation was found among graduates with professional degrees in Law� Given the time and money spent earning a law degree, the return on investment, at least in the short term, seems to be low� Graduates of Florida A&M University Law School had median first-year earnings of more than $41,300, approximately $4,000 less than graduates from Florida State University and approximately $5,000 less than graduates from Florida International University� Law graduates from University of Florida had the highest median first-year earnings, more than $53,800�
Florida’s three pharmacy programs met reporting requirements, and although over $6,000 separated the first-year earnings of graduates from University of South Florida from graduates of University of Florida, the median first-year earnings of graduates from all programs topped $100,000—almost twice the earnings of law graduates in most cases�
Table 15: Median First-Year Earnings of Graduates With Professional Degrees, by Degree and University
Institution Median First-Year Earnings
Medicine Degrees
Florida State University $50,584
University of Central Florida $51,520
University of South Florida $51,520
Florida International University $52,408
University of Florida $52,428
Florida Atlantic University $53,924
Law Degrees (Law, Bachelor of Law, or Juris Doctor)
Florida Agricultural and Mechanical University $41,324
Florida State University $45,696
Florida International University $46,380
University of Florida $53,816
Pharmacy Degrees
University of South Florida $100,896
Florida Agricultural and Mechanical University $105,068
University of Florida $106,484

Measuring the Economic Success of Florida’s Graduates65
Changes in First-Year Earnings Among Graduates From UniversitiesThe median first-year earnings of graduates during the five-year study period can be compared in isolation with those from 2014–15� Although many programs will not have a sufficient number of graduates to enable reporting consistent with confidentiality constraints, reporting at higher levels of aggregation is possible (Figure 30)� A minimum of 10 graduates is required to allow reporting for this project� Results are suppressed when fewer graduates appear on any specific project�
Figure 30: Median First-Year Earnings of Graduates From Universities, by Degree
$0 20K 40K 60K 80K 100K 120K
$35,156
$46,748
$50,072
$51,792
$52,872
$66,204
$67,304
$106,348
$ 105,992
$38,524
$51,960
$53,372
$53,924
$54,920
$69,004
$69,632
$106,728
$107,960
First-Year Outcomes After Graduation (2014–15 Graduates)
First-Year Outcomes for Five Graduating Classes (2010–11 Through 2014–15)
Pharmacy
Dentistry
Veterinary Medicine
Doctorate Degree
Specialist
Medicine
Master's Degree
Law, LLB, or JD
Bachelor's Degree

Economic Security Report 2017 66
Where the Jobs AreAlthough this report primarily focuses on the first-year earnings of graduates for academic years 2010–11 through 2014–15, clearly the earnings that graduates command are not only a function of the programs from which they graduate but also of the strength of the labor market into which they enter� The following section provides information about the demand for jobs, including information on the fastest-growing industries and occupations forecast through 2024� This section also provides information on the top 10 jobs statewide that require a postsecondary credential, where the demand for workers is projected to surpass the supply of workers� This section aims to supplement the earnings data presented throughout this report to help students anticipate where the demand for workers may be strongest across Florida in the coming years�
As students consider their educational options, two factors are important: the size and growth rates of the industries into which they might find employment� Table 16 shows that in June 2017, the largest industry sectors in Florida were Trade, Transportation, and Utilities (20�4% of total employment); Professional and Business Services (15�5%); Education and Health Services (14�9%); Leisure and Hospitality (14�0%); and Government (12�8%)� Together, these five industries accounted for nearly 78% of Florida’s total nonagricultural employment�
Table 16: Nonagricultural Employment in Florida, by Industry, June 2017 (Seasonally Adjusted)20
Industry Jobs % of Total
Total 8,601,600
Trade, Transportation, and Utilities 1,753,600 20�4%
Professional and Business Services 1,329,200 15�5%
Education and Health Services 1,277,500 14�9%
Leisure and Hospitality 1,200,500 14�0%
Total Government 1,105,300 12�8%
Financial Activities 556,300 6�5%
Construction 506,400 5�9%
Manufacturing 365,900 4�3%
Other Services 365,100 4�2%
Information 136,100 1�6%
20 Source: U�S� Department of Labor, Bureau of Labor Statistics, Current Employment Statistics Program, released June 21, 2017� Prepared by Florida Department of Economic Opportunity, Bureau of Labor Market Statistics�

Measuring the Economic Success of Florida’s Graduates67
Figure 31 presents the number of jobs gained by industry between 2016 and 2017� Fewer than 11,000 jobs were added in the Financial Activities, Total Government, and Manufacturing sectors; and two sectors experienced growth of more than 40,000 jobs� The largest gain was in the Professional and Business Services sector, which added more than 48,000 jobs�
Figure 31: Number of Jobs Gained in Florida From June 2016 to June 2017, by Industry (Seasonally Adjusted), Nonagricultural Sectors21
$0 10K 20K 30K 40K 50K 60K
10,300
10,700
10,900
16,800
31,400
33,700
35,600
40,700
48,300Professional and Business Services
Education and Health Services
Trade, Transportation, and Utilities
Construction
Leisure and Hospitality
Other Services
Manufacturing
Total Government
Financial Activities
Long-term projections of growth by industry and occupation may be more important than short-term growth trends� Clearly, finding employment in a rapidly expanding industry or occupation is easier than finding one in a slow-growth industry� Table 17 shows the industries in which growth is most likely to occur through 2024� The two fastest-growing industries are related to health and education� With growth of 25�3% between 2016 and 2024, Ambulatory Health Care Services is projected to be the fastest growing field� Health care industries are also projected to grow rapidly due to population gains, the aging population, and improved medical technologies� Similarly, the rapid growth in educational services may reflect the continued growth in the number of families moving to Florida�
21 Source: http://www�floridajobs�org/labor-market-information/data-center/statistical-programs/current-employment-statistics
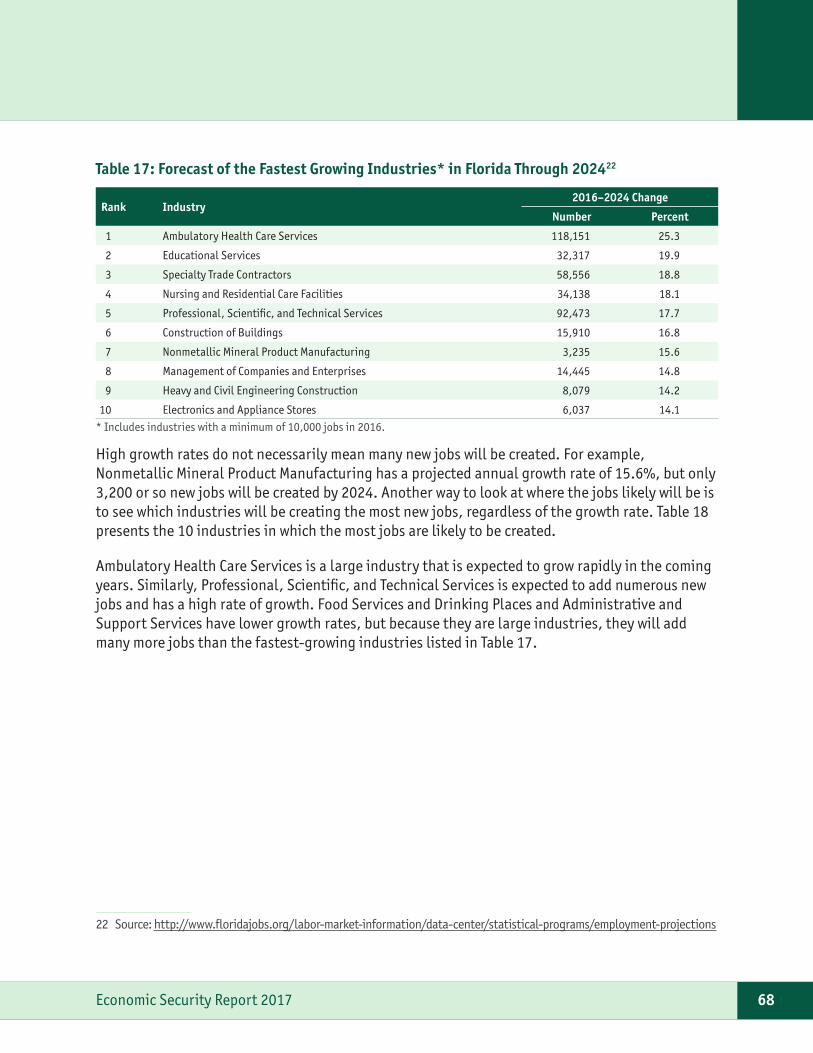
Economic Security Report 2017 68
Table 17: Forecast of the Fastest Growing Industries* in Florida Through 202422
Rank Industry2016–2024 Change
Number Percent
1 Ambulatory Health Care Services 118,151 25�3
2 Educational Services 32,317 19�9
3 Specialty Trade Contractors 58,556 18�8
4 Nursing and Residential Care Facilities 34,138 18�1
5 Professional, Scientific, and Technical Services 92,473 17�7
6 Construction of Buildings 15,910 16�8
7 Nonmetallic Mineral Product Manufacturing 3,235 15�6
8 Management of Companies and Enterprises 14,445 14�8
9 Heavy and Civil Engineering Construction 8,079 14�2
10 Electronics and Appliance Stores 6,037 14�1
* Includes industries with a minimum of 10,000 jobs in 2016�
High growth rates do not necessarily mean many new jobs will be created� For example, Nonmetallic Mineral Product Manufacturing has a projected annual growth rate of 15�6%, but only 3,200 or so new jobs will be created by 2024� Another way to look at where the jobs likely will be is to see which industries will be creating the most new jobs, regardless of the growth rate� Table 18 presents the 10 industries in which the most jobs are likely to be created�
Ambulatory Health Care Services is a large industry that is expected to grow rapidly in the coming years� Similarly, Professional, Scientific, and Technical Services is expected to add numerous new jobs and has a high rate of growth� Food Services and Drinking Places and Administrative and Support Services have lower growth rates, but because they are large industries, they will add many more jobs than the fastest-growing industries listed in Table 17�
22 Source: http://www�floridajobs�org/labor-market-information/data-center/statistical-programs/employment-projections

Measuring the Economic Success of Florida’s Graduates69
Table 18: Forecast of the Industries* Gaining the Most New Jobs in Florida Through 202423
Rank Industry2016–2024 Change
Number Percent
1 Ambulatory Health Care Services 118,151 25�30
2 Food Services and Drinking Places 100,898 13�40
3 Professional, Scientific, and Technical Services 92,473 17�70
4 Administrative and Support Services 80,856 13�10
5 Local Government 67,868 9�20
6 Specialty Trade Contractors 58,556 18�80
7 Nursing and Residential Care Facilities 34,138 18�10
8 Educational Services 32,317 19�90
9 Hospitals 29,779 10�20
10 Amusement, Gambling, and Recreation Industries 22,592 12�90
* Includes industries with a minimum of 10,000 jobs in 2016�
23 Source: http://www�floridajobs�org/labor-market-information/data-center/statistical-programs/employment-projections

Economic Security Report 2017 70
Growth in Occupations
Considering growth in occupations is also important� Table 19 shows the 10 occupations projected to grow fastest through 2024� Half of these require only a college credit certificate of the sort awarded by FCS institutions and DTCs�
Table 19: Forecast of the Fastest Growing Occupations* in Florida Through 202424
Rank Occupation 2016–2024 Change Median Hourly Wage, 2016
Florida Education Level
BLS Education LevelPercent Number
1 Nurse Practitioners 34�20 4,623 $45�53Master's or
Higher DegreeMaster’s Degree
2 Physician Assistants 32�80 2,726 $47�73 Bachelor's Degree Master’s Degree
3 Physical Therapist Assistants 29�70 2,417 $30�03 Associate Degree Associate Degree
4 Home Health Aides 28�60 12,551 $10�92 College CreditNo Formal
Requirement
5 Diagnostic Medical Sonographers 26�60 2,093 $30�30 College Credit Associate Degree
6 Brickmasons and Blockmasons 25�80 1,446 $17�16 College Credit High School
7 Operations Research Analysts 25�60 2,533 $28�52Master's or
Higher DegreeBachelor’s Degree
8 Web Developers 25�10 3,314 $27�82 College Credit Associate Degree
9 Physical Therapists 24�50 5,836 $40�96Master's or
Higher DegreeDoctorate Degree
10 Medical Assistants 23�90 19,606 $14�62 College Credit College Credit
* Includes industries with a minimum of 10,000 jobs in 2016�
Where Is the Greatest Demand Relative to Supply?
Table 20 is based on Florida’s Occupational Supply/Demand report that compares total supply (education/training graduates by occupation) against short-term demand (employer-posted Internet job ads by occupation)�
The supply gap is the difference between occupational demand and supply� These are occupations in which students will likely experience higher probabilities of finding employment� Entry, median, and experienced earnings for each occupation are also shown, so students can determine likely earnings for the occupation�
24 Source: http://www�floridajobs�org/labor-market-information/data-center/statistical-programs/employment-projections

Measuring the Economic Success of Florida’s Graduates71
Table 20: Supply Gap in 10 Occupations Requiring a Bachelor’s Degree or More25
Occupation Total Supply
Long-Term
Demand
Supply Gap or
Overage
Ratio of Supply to Demand
Current Year
Employed
Entry Level Hourly Wage
Median Hourly Wage
Experienced Hourly Wage
Florida Education
Level
BLS Education
Level
Securities, Commodities, and Financial Services Sales Agents
8 685 -677 0�01 22,836 $17�51 $29�05 $56�29Bachelor’s
DegreeBachelor’s
Degree
Directors, Religious Activities and Education
62 450 -388 0�14 11,082 $12�35 $18�42 $23�57Bachelor’s
DegreeBachelor’s
Degree
Physical Therapists
525 730 -205 0�72 12,872 $29�24 $40�96 $47�94Master’s
Degree or Higher
Doctorate Degree
Business Teachers, Postsecondary
0 163 -163 N/A* 4,537 $25�78 $47�63 $73�20Bachelor’s
DegreeDoctorate
Degree
Librarians 63 183 -120 0�34 6,168 $19�55 $27�14 $32�85Master’s
Degree or Higher
Master’s Degree
Surveyors 8 125 -117 0�06 3,133 $17�12 $27�11 $37�10Bachelor’s
DegreeBachelor’s
Degree
Career/Technical Education Teachers, Secondary School
161 234 -73 0�69 7,392 $21�44 $30�06 $36�08Bachelor’s
DegreeBachelor’s
Degree
Accountants and Auditors
3,815 3,864 -49 0�99 84,892 $20�96 $29�98 $40�33Bachelor’s
DegreeBachelor’s
Degree
Rehabilitation Counselors
43 92 -49 0�47 2,864 $12�75 $17�11 $20�42Bachelor’s
DegreeMaster’s Degree
Veterinarians 116 144 -28 0�81 4,693 $30�10 $45�47 $55�55Master’s
Degree or Higher
Doctorate Degree
* Not applicable�
Securities, Commodities, and Financial Services Sales Agents, with a short-term supply gap of over 1,000 qualified people and earnings of more than $55 per hour for experienced agents, presents the largest numerical shortfall for one of the highest-paying fields� Florida projects a shortage of over 600 qualified people to fill jobs as Industrial Engineers� Projected short-term shortfalls for Speech-Language Pathologists and Physical Therapists are also quite large�
25 Source: http://www�floridajobs�org/labor-market-information/products-and-services/indicators-of-jobs-in-demand-requiring-a-bachelor-degree

Economic Security Report 2017 72
The U�S� Department of Labor’s Bureau of Labor Statistics and the U�S� Census Bureau have documented the “big payoff” for higher education,26 but this report shows that the payoff varies considerably from program to program and from institution to institution� The bottom line: The type of postsecondary credentials that completers earn, and where they earn them, matter�
Most notably, the labor market clearly places a high value on technical associate degrees� And for many students, some certificates may represent an efficient pathway into the labor market� At the bachelor’s degree level, the data show that graduates from many campuses in the state, not just the state’s best-known ones, earn, on average, roughly the same first-year wages�
In short, many pathways to good earnings are available to students in Florida, and the data made available in this report and on Florida’s Launch My Career website (http://www�launchmycareerFL�org) can help students find such earnings�
As students and others consider these data, some of the cautions put forward earlier in this report should be reiterated� Although the report documents wide variations in the first-year earnings of graduates from different programs, these variations have not been explained, leaving this issue open to further analysis� For example, the credentials of incoming students vary across institutions; missions vary across institutions; and many schools serve regional labor markets where earnings vary� And the data reported here are all short-term results from the labor market� In the long term, graduates with bachelor’s degrees tend to increase their earnings faster than those with associate degrees, so the short-term differences documented here may erode over time� Indeed, prospective students are encouraged to look at the longer term earnings data on Florida’s Launch My Career website: http://www�launchmycareerFL�org�
Furthermore, postsecondary education has many rewards in addition to boosting earnings� However, if a student borrows $50,000 and is earning $25,000, he or she likely will be so consumed by trying to pay off the loans as to have little time to enjoy the other rewards�
To reiterate, knowing about variations in the economic payoff of degrees and programs of study is important—and further analysis may be needed to better understand specific institutional and program implications and nuances� The data reported here, however, should be made widely accessible to the public and should inform students, their families, taxpayers, and their representatives about the labor market outcomes of programs, degrees, and colleges�
26 http://www�census�gov/prod/2002pubs/p23-210�pdf and more recently http://www�census�gov/prod/2011pubs/acs-14�pdf�
HIGHER EDUCATION PAYS BUT WAGES VARY ACROSS PROGRAMS

Measuring the Economic Success of Florida’s Graduates73
Table 21: Percent of Graduates Found in Earnings Database, by University
InstitutionPercent of Completers of Bachelor’s Degrees
With Earnings Data
Percent of Completers of Master’s Degrees With Earnings Data
Florida Agricultural and Mechanical University 66% 63%
Florida Atlantic University 72% 74%
Florida Gulf Coast University 72% 80%
Florida International University 68% 70%
Florida State University 57% 51%
Florida Statewide Median 65% 64%
New College of Florida 39% —
The University of West Florida 65% 64%
University of Central Florida 70% 72%
University of Florida 51% 51%
University of North Florida 75% 77%
University of South Florida 70% 68%
APPENDIX

Economic Security Report 2017 74
Table 22: Percent of College Graduates and Completers Found in Earnings Database, by Degree and Institution
Institution Percent of Graduates/ Completers With Wage Data
Associate in Applied Sciences Degree (FCS)
Broward College 79%
College of Central Florida 100%
Daytona State College 71%
Eastern Florida State College 75%
Florida Statewide Median, A�A�S� Degree 74%
Florida Gateway College 67%
Florida Keys Community College 94%
Florida State College at Jacksonville 74%
Gulf Coast State College 74%
Hillsborough Community College 82%
Indian River State College 74%
Lake-Sumter State College 73%
Miami Dade College 84%
North Florida Community College 100%
Northwest Florida State College 59%
Palm Beach State College 75%
Pasco-Hernando State College 70%
Pensacola State College 66%
Polk State College 84%
Santa Fe College 74%
Seminole State College of Florida 89%
South Florida State College 87%
St� Johns River State College 88%
St� Petersburg College 68%
State College of Florida, Manatee-Sarasota 81%
Tallahassee Community College 75%
Valencia College 73%
Associate in Arts Degree (FCS)
Broward College 65%
Chipola College 57%
College of Central Florida 63%
Daytona State College 64%
Eastern Florida State College 60%

Measuring the Economic Success of Florida’s Graduates75
Institution Percent of Graduates/ Completers With Wage Data
Florida Statewide Median, A�A� Degree 65%
Florida Gateway College 64%
Florida Keys Community College 60%
Florida SouthWestern State College 70%
Florida State College at Jacksonville 65%
Gulf Coast State College 60%
Hillsborough Community College 67%
Indian River State College 63%
Lake-Sumter State College 66%
Miami Dade College 64%
North Florida Community College 57%
Northwest Florida State College 56%
Palm Beach State College 68%
Pasco-Hernando State College 68%
Pensacola State College 59%
Polk State College 67%
Santa Fe College 58%
Seminole State College of Florida 67%
South Florida State College 61%
St� Johns River State College 64%
St� Petersburg College 67%
State College of Florida, Manatee-Sarasota 65%
Tallahassee Community College 62%
Valencia College 70%
Associate in Science Degree (FCS)Broward College 84%
Chipola College 74%
College of Central Florida 74%
Daytona State College 79%
Eastern Florida State College 76%
Florida Statewide Median, A�S� Degree 80%Florida Gateway College 88%
Florida Keys Community College 77%
Florida SouthWestern State College 86%
Florida State College at Jacksonville 78%
Gulf Coast State College 85%
Table 22: Continued
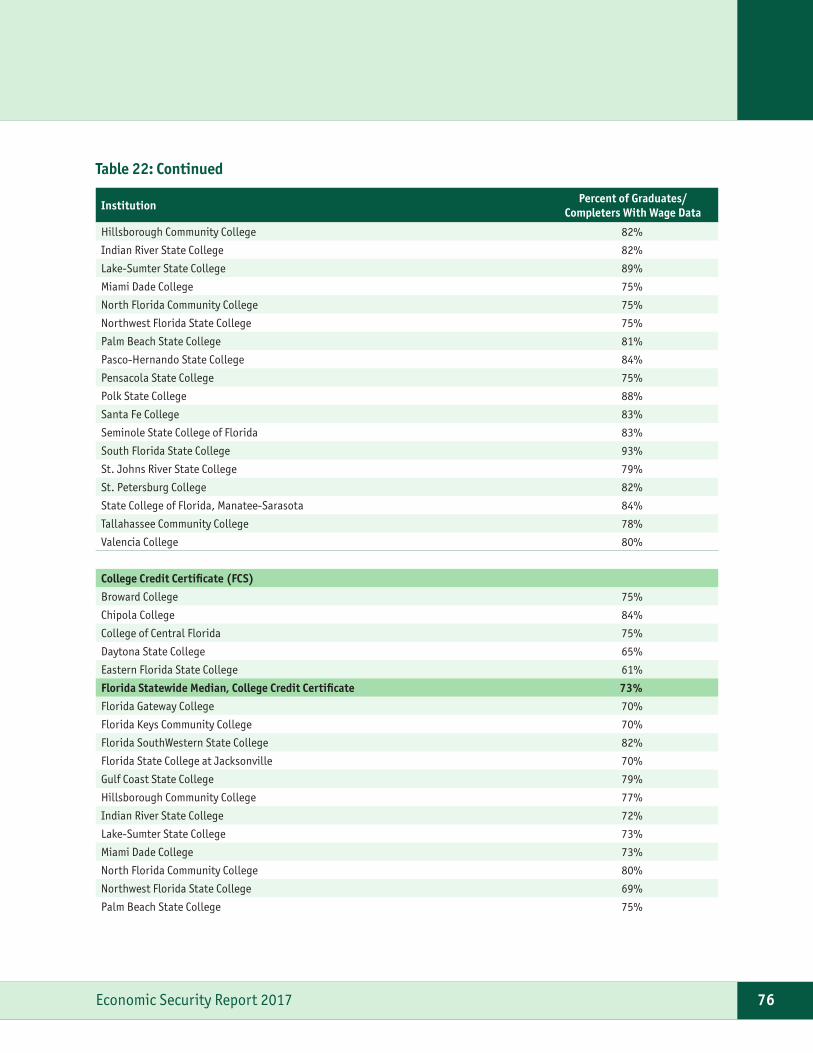
Economic Security Report 2017 76
Institution Percent of Graduates/ Completers With Wage Data
Hillsborough Community College 82%
Indian River State College 82%
Lake-Sumter State College 89%
Miami Dade College 75%
North Florida Community College 75%
Northwest Florida State College 75%
Palm Beach State College 81%
Pasco-Hernando State College 84%
Pensacola State College 75%
Polk State College 88%
Santa Fe College 83%
Seminole State College of Florida 83%
South Florida State College 93%
St� Johns River State College 79%
St� Petersburg College 82%
State College of Florida, Manatee-Sarasota 84%
Tallahassee Community College 78%
Valencia College 80%
College Credit Certificate (FCS)Broward College 75%
Chipola College 84%
College of Central Florida 75%
Daytona State College 65%
Eastern Florida State College 61%
Florida Statewide Median, College Credit Certificate 73%Florida Gateway College 70%
Florida Keys Community College 70%
Florida SouthWestern State College 82%
Florida State College at Jacksonville 70%
Gulf Coast State College 79%
Hillsborough Community College 77%
Indian River State College 72%
Lake-Sumter State College 73%
Miami Dade College 73%
North Florida Community College 80%
Northwest Florida State College 69%
Palm Beach State College 75%
Table 22: Continued
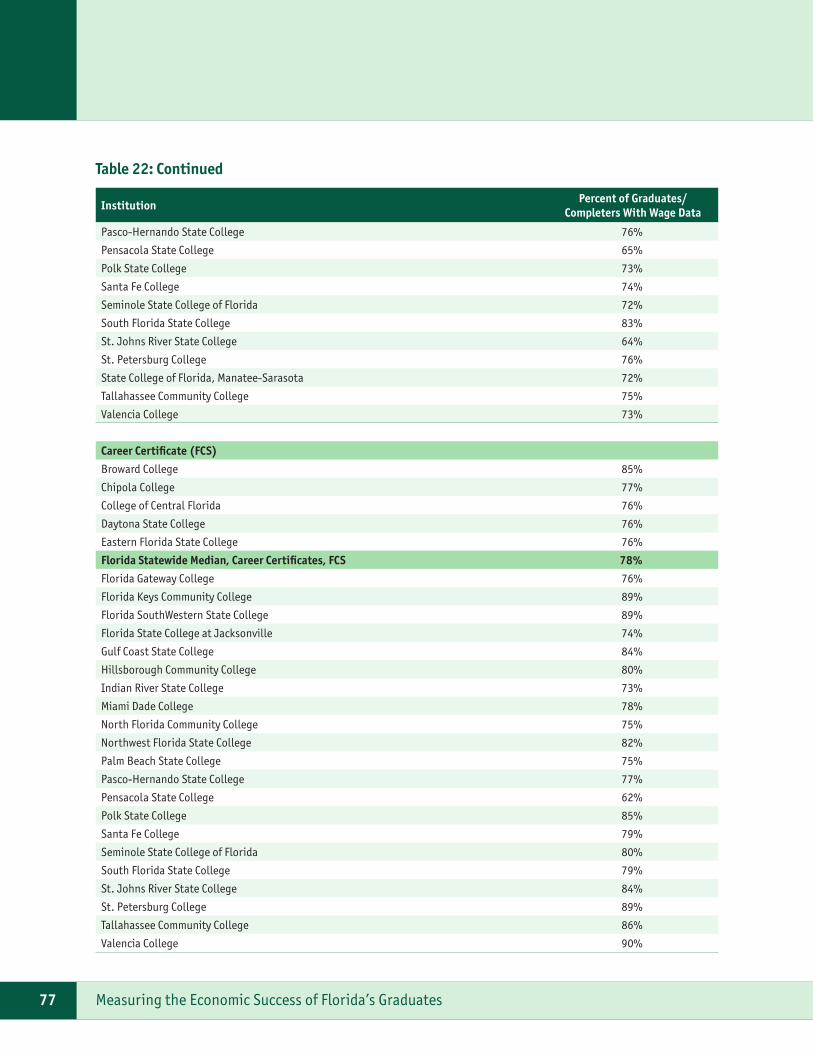
Measuring the Economic Success of Florida’s Graduates77
Institution Percent of Graduates/ Completers With Wage Data
Pasco-Hernando State College 76%
Pensacola State College 65%
Polk State College 73%
Santa Fe College 74%
Seminole State College of Florida 72%
South Florida State College 83%
St� Johns River State College 64%
St� Petersburg College 76%
State College of Florida, Manatee-Sarasota 72%
Tallahassee Community College 75%
Valencia College 73%
Career Certificate (FCS)Broward College 85%
Chipola College 77%
College of Central Florida 76%
Daytona State College 76%
Eastern Florida State College 76%
Florida Statewide Median, Career Certificates, FCS 78%Florida Gateway College 76%
Florida Keys Community College 89%
Florida SouthWestern State College 89%
Florida State College at Jacksonville 74%
Gulf Coast State College 84%
Hillsborough Community College 80%
Indian River State College 73%
Miami Dade College 78%
North Florida Community College 75%
Northwest Florida State College 82%
Palm Beach State College 75%
Pasco-Hernando State College 77%
Pensacola State College 62%
Polk State College 85%
Santa Fe College 79%
Seminole State College of Florida 80%
South Florida State College 79%
St� Johns River State College 84%
St� Petersburg College 89%
Tallahassee Community College 86%
Valencia College 90%
Table 22: Continued
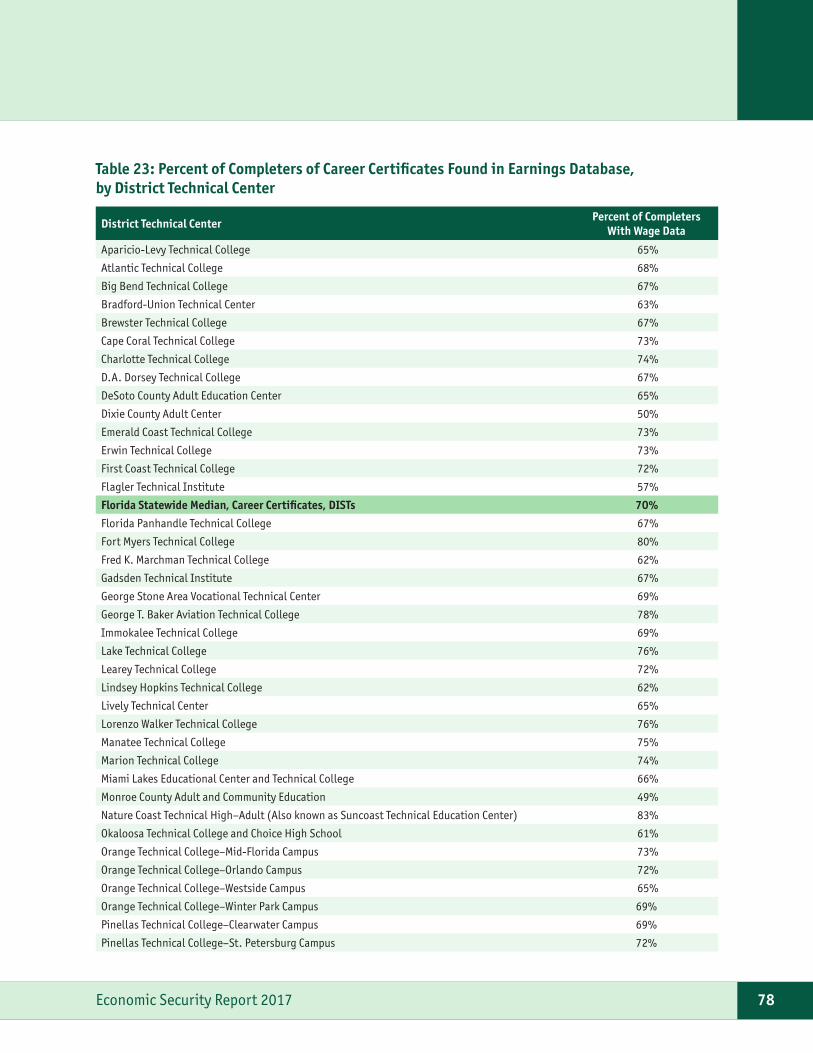
Economic Security Report 2017 78
Table 23: Percent of Completers of Career Certificates Found in Earnings Database, by District Technical Center
District Technical Center Percent of Completers With Wage Data
Aparicio-Levy Technical College 65%
Atlantic Technical College 68%
Big Bend Technical College 67%
Bradford-Union Technical Center 63%
Brewster Technical College 67%
Cape Coral Technical College 73%
Charlotte Technical College 74%
D�A� Dorsey Technical College 67%
DeSoto County Adult Education Center 65%
Dixie County Adult Center 50%
Emerald Coast Technical College 73%
Erwin Technical College 73%
First Coast Technical College 72%
Flagler Technical Institute 57%
Florida Statewide Median, Career Certificates, DISTs 70%Florida Panhandle Technical College 67%
Fort Myers Technical College 80%
Fred K� Marchman Technical College 62%
Gadsden Technical Institute 67%
George Stone Area Vocational Technical Center 69%
George T� Baker Aviation Technical College 78%
Immokalee Technical College 69%
Lake Technical College 76%
Learey Technical College 72%
Lindsey Hopkins Technical College 62%
Lively Technical Center 65%
Lorenzo Walker Technical College 76%
Manatee Technical College 75%
Marion Technical College 74%
Miami Lakes Educational Center and Technical College 66%
Monroe County Adult and Community Education 49%
Nature Coast Technical High–Adult (Also known as Suncoast Technical Education Center) 83%
Okaloosa Technical College and Choice High School 61%
Orange Technical College–Mid-Florida Campus 73%
Orange Technical College–Orlando Campus 72%
Orange Technical College–Westside Campus 65%
Orange Technical College–Winter Park Campus 69%
Pinellas Technical College–Clearwater Campus 69%
Pinellas Technical College–St� Petersburg Campus 72%

Measuring the Economic Success of Florida’s Graduates79
District Technical Center Percent of Completers With Wage Data
Radford M� Locklin Technical Center 59%
Ridge Technical College 74%
Riveroak Technical College 67%
Robert Morgan Educational Center and Technical College 64%
Sheridan Technical College 64%
South Dade Technical College 53%
Sumter County Adult Education 55%
Suncoast Technical College 77%
Technical Center for Career and Adult Education 65%
Technical Education Center of Osceola (TECO) 74%
The English Center 54%
Tom P� Haney Technical Center 72%
Traviss Technical College 74%
Wakulla County Adult and Community Education 65%
William T� McFatter Technical College 69%
Withlacoochee Technical College 71%
Table 23: Continued

Economic Security Report 2017 80
Completers Cohort 2010–11 to 2014–15The cohort includes graduates and completers during their first year after graduation from public postsecondary educational institutions for each academic year 2010–11 to 2014–15� Florida’s public postsecondary educational institutions include the State University System of Florida, the Florida College System, and District Technical Centers� The data for this cohort reflect employment, earnings, continuing education, and public assistance for the fall following graduation� In general, completers appear only once in the database� However, it is possible for completers to appear across multiple tables� For example, students in Emergency Medical Technology A�S� programs may be awarded EMT certificates as part of their A�S� degrees, which would allow them to work while continuing with their degrees and therefore would influence the median wages of their degrees�
Key ConceptsMedian first-year earnings and continuing education are key concepts related to the employment and continuing education outcomes used throughout this report� The rates reported are combined five-year rates for graduates in 2011, 2012, 2013, 2014, and 2015� This approach provides sufficient data at the local program level to enable students, parents, and other stakeholders to view more complete results� The minimum number of graduates to allow reporting for this project is 10� Results are suppressed when fewer graduates appear on any specific topic�
The median is the middle score in a distribution, and the first-year earnings of graduates reported here reflect the five-year median� Annualized calendar year fourth quarter (October–December) earnings of graduates for each year were arranged by institution from lowest to highest, and the middle value was selected for each institution and from a combined sorted statewide list� Wage data from the Florida Unemployment Insurance (UI) and the Wage Record Interchange System 2 (WRIS2) are the underlying sources of the employment and earnings data� Some information, such as wages for sole proprietorships and federal employees, may not be included in the data�
UI wage records provide information about employment and earnings only� The records do not provide data about the occupations in which graduates are employed; therefore, it is not possible to know whether graduates are employed in their fields of study or other fields�
The continuing education data reflect a five-year average� The number of students enrolled in higher education in the academic year following graduation for academic years 2010–11 to 2014–15 was summed and divided by the total number of graduates across the five years� Out-of- state continuing education is not included in this report�
Outcome data related to graduates and completers and continuing education are provided by the Florida Education and Training Placement Information Program (FETPIP)� FETPIP, located in the Florida Department of Education, is a data collection and consumer reporting system established by Florida law to provide follow-up data on former students and program participants who have graduated, exited, or completed a public education or training program in the state of Florida�
METHODOLOGY

Measuring the Economic Success of Florida’s Graduates81
DefinitionsArea of Study
The Area (or Field) of Study Code and Program refer to the Classification of Instructional Program (CIP)� CIP was developed and is maintained by the U�S� Department of Education’s National Center for Education Statistics (NCES)� According to NCES, “The [CIP] provides a taxonomic scheme that supports the accurate tracking and reporting of fields of study and program completions activity� CIP was originally developed by the U�S� Department of Education’s [NCES] in 1980, with revisions in 1985, 1990, 2000, and 2010�”27 For more information about CIP codes, visit NCES’s website: http://nces�ed�gov/ipeds/cipcode/�
Number of Completers
The total number of students who completed or graduated from a program in the cohort�
Employment Records
Employment data obtained from the Unemployment Insurance (UI) wage records, as provided by the Florida Department of Revenue and the Wage Record Interchange System 2 (WRIS2)�
First-Year Full-Time Earnings
The earnings of completers during the fourth quarter (October–December) following graduation� The earnings are equal to or exceed the full-time threshold� The full-time threshold equals the hourly minimum wage, multiplied by 40 hours per week, multiplied by 13 weeks� Earnings are annualized by multiplying by four�
Total Found Employed Percentage
The number of completers with earnings divided by the total number of completers�
Total Found Employed Full-Time Percentage
The number of completers with earnings at or exceeding the full-time threshold divided by the total number of completers�
Median First-Year Earnings
The median is the middle score in a distribution, and the first-year earnings of graduates reported here reflect the five-year median� Annualized calendar year fourth quarter (October–December) earnings of graduates for each year were arranged by institution from lowest to highest, and the middle value was selected for each institution and from a combined sorted statewide list�
27 http://nces�ed�gov/ipeds/cipcode/Default�aspx?y=55

Economic Security Report 2017 82
Found Continuing Education Percentage
The number of completers who were enrolled at a State University System of Florida institution or Florida College System institution in the fall and spring semesters following graduation or completion of an educational program divided by the total number of completers�
Public Assistance Percentage
The number of completers who received public assistance from the Temporary Assistance for Needy Families program or the Supplemental Nutrition Assistance Program during the fourth quarter of the year divided by the total number of completers�
Student Loan Debt
The total average amount of student loans for 2014–15 at a public postsecondary educational institution, divided by the number of students attending the school for that same period�
Data DisclosureThe data provided for the cohorts include only completers with valid Social Security numbers, and the earnings represent completers who met the full-time threshold� The full-time threshold equals the hourly minimum wage, multiplied by 40 hours per week, multiplied by 13 weeks� Earnings and public assistance data reflect the fourth quarter of the year (October–December)� The earnings are annualized by multiplying by four� Finally, the records are unduplicated between years; therefore, students are represented only once per year� Data on student loan debt are self-reported by each public educational institution at the institution level� The data reflect the average student loan debt of all students (i�e�, those who were enrolled and those who graduated) at that public postsecondary educational institution in 2014–15, divided by the number of students who were enrolled� The data include federal student loans from Stafford, Perkins, Graduate PLUS, Parent PLUS, and TEACH programs�

Prepared by Mark SchneiderPresident, College MeasuresVice President and Institute Fellow, American Institutes for Research