measuring the benefits of ridesharing services to urban
TRANSCRIPT

O c t o b e r 2 0 2 0
_______________________________________________________________________
Hutchins Center Working Paper # 70
THIS PAPER IS ONLINE AT
https://www.brookings.edu/research/measuring-the-benefits-of-ridesharing-services-to-urban-travelers/
Measuring the Benefits of Ridesharing Services to Urban Travelers: The Case of The San Francisco Bay Area
Hyeonjun Hwang
Washington State University
A B S T R A C T
We measure the benefits of ridesharing services to travelers in the San Francisco Bay Area by estimating a mixed-logit model of mode choice. We include Uber as a representative ridesharing service and we quantify the welfare gain that it provides to travelers by estimating the difference in total benefits with and without its service. Consumers gain roughly $1 billion annually from Uber’s non-fare attributes, which they value but taxis have not provided. Annual benefits to travelers in major U.S. cities are likely to amount to several billions of dollars. Regulations that limit the expansion of ridesharing services are not justified and are likely to reduce travelers’ welfare without addressing the problems of the modes that they seek to protect.
This paper is published as part of the Hutchins Center on Fiscal and Monetary Policy’s Productivity Measurement Initiative.
The authors can be reached at: [email protected]; [email protected]; and [email protected]. The authors did not
receive financial support from any firm or person with a financial or political interest in this article. None are currently an
officer, director, or board member of any organization with an interest in this article.
Jia Yan
Washington State University
Clifford Winston
The Brookings Institution

_________________________________________________________________________________________________________
Measuring the Ben efits of Ride sharing Ser vices to Urban Trav eler s 2
HUT C HI NS CE NT E R ON F IS C A L & M ON E T A R Y P O LI CY A T B RO OK IN GS
1. Introduction
Ridesharing consists of drivers who provide private trips with their own car without intervention from a
regulatory authority; passengers who use their smart phone to request transportation to various
destinations; and transportation network companies (TNCs), such as Uber Technologies, Inc. (hereafter
Uber) or Lyft, which match passengers’ demand for trips and drivers’ supply of vehicles with a smart
phone application.
Ridesharing services have grown rapidly since 2010 when Uber launched its first on-demand car
service, ‘UberCab,’ in San Francisco. In 2019, Uber completed some 14 million trips per day, serving more
than 600 cities in 65 countries around the world, and its main competitor, Lyft, launched in 2012,
completed more than one million trips per day, serving 300 U.S. and two Canadian cities. Since 2017, the
share of trips by ridesharing exceeded taxi’s share of trips. By January 2019, daily travel in New York City,
for example, consisted of 462,113 trips by Uber, 149,142 by Lyft, and 271,135 by taxi.1 Ridesharing services
are also widely used in other countries as indicated by the growth of ‘Didi’ in China and ‘Ola Cabs’ in
India.
The dramatic growth of ridesharing drivers’ labor supply has been aided by the absence of medallion
permits or occupational licensing requirements that apply to taxi drivers (Cramer and Krueger, 2016;
Angrist, Caldwell, and Hall, 2017). In addition, ridesharing drivers have flexible hours, which enable them
to smooth income fluctuations (Hall and Krueger, 2018). Finally, capacity utilization, measured by the
fraction of business hours or miles that a fare-paying passenger occupies a shared vehicle, is much greater
for UberX drivers than for taxi drivers in, for example, New York City and Boston (Cramer and Krueger,
2016).2
The growth of ridesharing services has not been welcomed by all segments of society. Ridesharing has
significantly threatened the financial viability of the taxi industry by causing significant declines in its
revenue and in the value of operating medallions (for example, the recent value of a medallion in New
York City has dropped 80 percent from its all-time high). A backlash from taxi drivers has led
policymakers in various countries to limit Uber operations.3 In the United States, actions include limiting
New York City drivers’ access to the Uber app and forcing Uber and Lyft to treat California drivers as
employees, who are eligible for various benefits, instead of as independent contractors. Critics of
ridesharing also claim that by creating more automobile travel, it is increasing the associated negative
externalities of congestion, emissions, and traffic accidents, while reducing the use of public transit.
Despite the growing popularity of ridesharing, there has been little empirical assessment of its
benefits to travelers. Conceptually, the benefits reflect the value that travelers place on the ridesharing
alternative compared with the value that they place on their next best transportation alternative, such as
driving their personal vehicle or taking public transit. Cohen et al. (2016) estimate that the benefits
. . .
1. Taxi & Limousine Commission, New York City, NY, https://www1.nyc.gov.
2. UberX, the most frequently used Uber service, provides comfortable sedans for up to four people. See https://www.uber.com.
3. Al Goodman, Elwyn Lopez, and Laura Smith-Spark, “Spanish Judge Imposes Temporary Ban on Uber Taxi Service,” CNN,
December 9, 2014 report on efforts to limit Uber operations in Spain, and Hope King; “Uber Suspends UberX Service in South
Korea,” CNN Business, March 6, 2015 reports on efforts to limit Uber operations in South Korea.

_________________________________________________________________________________________________________
Measuring the Ben efits of Ride sharing Ser vices to Urban Trav eler s 3
HUT C HI NS CE NT E R ON F IS C A L & M ON E T A R Y P O LI CY A T B RO OK IN GS
generated by UberX in San Francisco, Los Angeles, New York City, and Chicago amounted to nearly $3
billion in 2015; however, their estimated gains do not account for the benefits provided by alternative
modes, which causes the estimated benefits from UberX to be biased upward. In addition, they do not
include certain non-price benefits provided by UberX, which causes a downward bias in their estimates.
In this paper, we estimate a mixed-logit model of mode choice to measure the benefits of ridesharing
services provided by Uber to travelers in the San Francisco Bay Area. Ordinarily, the benefits of a mode
are obtained from a discrete choice model by deleting the modal alternative from the choice set, including
its alternative specific constant and attributes, and calculating the loss in consumer surplus. However, we
cannot use that procedure here because our data set from the 2017 National Highway Travel Survey
(NHTS) includes a car hire alternative that combines Uber and Lyft with taxi.4 Thus, deleting the Uber
alternative from the choice set would yield a biased estimate of travelers’ value of Uber because taxi’s
alternative specific constant would be inflated. Accordingly, we calibrate the alternative specific constant
for car hire such that it equals the value of the alternative specific constant for taxi based on the 2009
NHTS when Uber was not available. We then compare travelers’ total welfare when Uber service was
available with travelers’ total welfare when Uber service was not available to obtain a welfare difference
that is not biased downward by an inflated alternative specific constant for taxi.
Based on this procedure, we find that travelers gain $0.815 per day in non-fare benefits from higher
service quality and personalized pricing, which traditional taxi services have not provided, but that they
lose $0.005 per day in slightly higher fares. The $0.81 in daily benefits amount to roughly $1 billion
annually for all travelers who have access to Uber; the annual benefits for all U.S. cities with ridesharing
services are likely to exceed several billion dollars. We argue that ridesharing does not create social costs
that offset those benefits and that policies exist that could reduce the social costs of any form of
automobile travel efficiently. Thus, regulations that limit entry and operations by TNCs are reducing
travelers’ welfare.
2. Transportation Markets and Modes
The geographic transportation market in this study consists of nine counties in the San Francisco Bay
Area: Alameda, Contra Costa, Marin, Napa, San Mateo, Santa Clara, Solano, Sonoma, and San Francisco,
which are depicted in light-gray shapes along with latitudes and longitudes on the axes in Figure 1. We
define transportation markets as (exclusive) origin-destination pairs of grids of approximately one mile by
one mile within the nine counties. There are a total of 6,530 grids.5
. . .
4. As discussed below, we were able to obtain data from Uber to conduct our analysis, but we could not obtain separate data on
Lyft’s operations. However, Uber and Lyft offer very similar services and fares and, according to several marketing consulting
firms, Uber accounts for nearly three-quarters of the ride-sharing market in the San Francisco Bay Area. We therefore use
data based on Uber’s operations and fares to construct attributes of ride-sharing services in Bay Area markets.
5. We drew a rectangle covering the nine counties and then formed the grids, but we could not include the northwest part of
Sonoma County. Data obtained from Uber for this study did not include information about this area, so it is omitted from the
analysis.

_________________________________________________________________________________________________________
Measuring the Ben efits of Ride sharing Ser vices to Urban Trav eler s 4
HUT C HI NS CE NT E R ON F IS C A L & M ON E T A R Y P O LI CY A T B RO OK IN GS
Figure 1: San Francisco Bay Area Counties (Light-gray)
Compared with traditional disaggregate analyses of urban mode choice, our analysis is complicated by
the availability of disaggregated data on mode choices that includes TNCs that do not distinguish between
travelers’ choice of Uber or Lyft from their choice of taxi service. We therefore employ the following
procedure to determine the benefits of Uber.6
We use the 2017 National Household Travel Survey (NHTS), a national household survey conducted
by the Federal Highway Administration, to estimate San Francisco travelers’ mode choice in the 2016-
2017 environments where Uber is an available option. The NHTS contains information on daily trips
made by household members, including time of day, the location of the origin and destination based on
coordinates, trip purpose, mode of transportation, and vehicle occupancy. The five alternative modes that
we include are walking, bicycling, driving, public transit (bus and rail), and car hire services (Uber, Lyft
and taxi).
The trip data are linked with socio-demographic characteristics of both the household and individual
household members who make the trips. Travelers can face different choice sets if they cannot access a
mode (for example, respondents that do not use smartphones cannot use Uber or Lyft, so the car hire
services for those respondents include only taxis), and if a mode does not serve an origin-destination pair.
We form an origin-destination pair for each trip based on its latitude and longitude, and we match the trip
with the appropriate grids that we constructed for the nine Bay Area counties. San Francisco County
contains a large share of trips in our sample. We obtain additional data to construct attributes for all the
modes that provide trips over the O-D pairs in our sample.
Because we cannot distinguish travelers’ choices of car hire services between Uber and taxi, we use
the 2009 NHTS to calibrate the estimated choice model to replicate the mode choice outcomes that
occurred in the 2008-2009 environment before the existence of Uber services. We then conduct
counterfactual simulations that estimate travelers’ benefits without Uber service and compare those
. . .
6. As noted, we obtained data for Uber but not for Lyft.

_________________________________________________________________________________________________________
Measuring the Ben efits of Ride sharing Ser vices to Urban Trav eler s 5
HUT C HI NS CE NT E R ON F IS C A L & M ON E T A R Y P O LI CY A T B RO OK IN GS
benefits with the estimated benefits when Uber service was available to determine the benefits generated
by Uber.
The 2017 NHTS, conducted during April 2016 and April 2017, contains 3,498 households and 24,585
trips within the geographical market area of analysis, while the 2009 NHTS, conducted during March
2008 and March 2009, contains 3,460 households and 28,916 trips within the geographical market area
of analysis. Table 1 presents the five modes in our analysis and their components, the modal shares for
both samples, and previews some possible effects of the introduction of TNCs; namely, the share of
driving decreased from 81 percent to 73 percent, while the share of car hire services increased more than
ten-fold from 0.07 percent to 0.9 percent. Although it is not possible to determine directly how many of
the 221 trips are by a TNC, we use a travel survey, which we discuss later, conducted in the Bay Area by
the San Francisco Municipal Transportation Agency to infer that taxi has not increased its number of
trips, 20, during the period. This indicates that approximately 200 trips were taken on a TNC. Mode
shares in the San Francisco Agency study are also quite similar to the ones in the 2017 NHTS, suggesting
that the NHTS does not underrepresent ridesharing.
Table 1: Mode Shares in the 2009 and 2017 NHTS
Mode
Number of trips in
2009
Share in
2009
Number of trips
in 2017
Share in 2017
Driving 23,477 81.19 18,055 73.43
Car hire servicesa 20 0.07 221 0.9
Public transport 591 2.04 1,071 4.35
Bicycling 431 1.49 480 1.95
Walking 3,932 13.6 4,448 18.09
Other 465 1.6 310 1.26
Total 28,916 100 24,585 100
aAs noted, Uber accounts for the vast majority of TNC trips in the Bay Area and we use its attributes for TNC
service and fares.
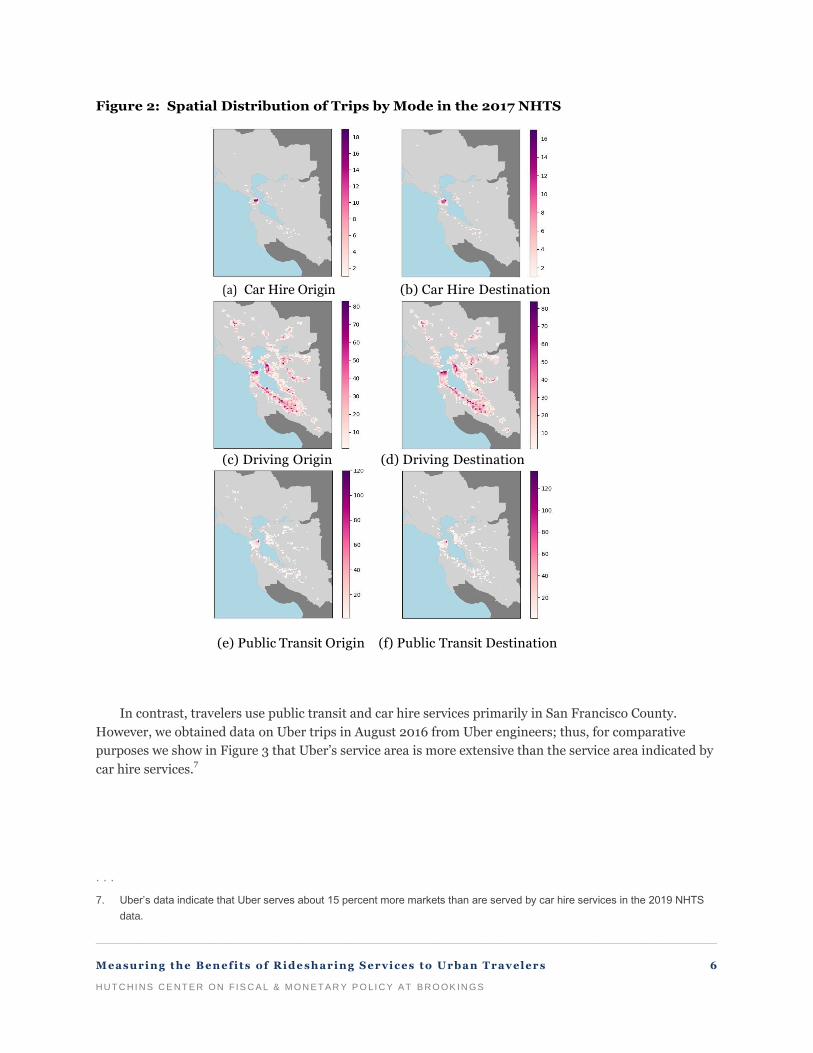
There are differences in the spatial coverage of Uber and taxi service. Figure 2 uses the 2017 NHTS
data to show, as expected, that travelers drive their own vehicle throughout the nine Bay Area counties.
_________________________________________________________________________________________________________
Measuring the Ben efits of Ride sharing Ser vices to Urban Trav eler s 6
HUT C HI NS CE NT E R ON F IS C A L & M ON E T A R Y P O LI CY A T B RO OK IN GS
Figure 2: Spatial Distribution of Trips by Mode in the 2017 NHTS
(a) Car Hire Origin (b) Car Hire Destination
(c) Driving Origin (d) Driving Destination
(e) Public Transit Origin (f) Public Transit Destination
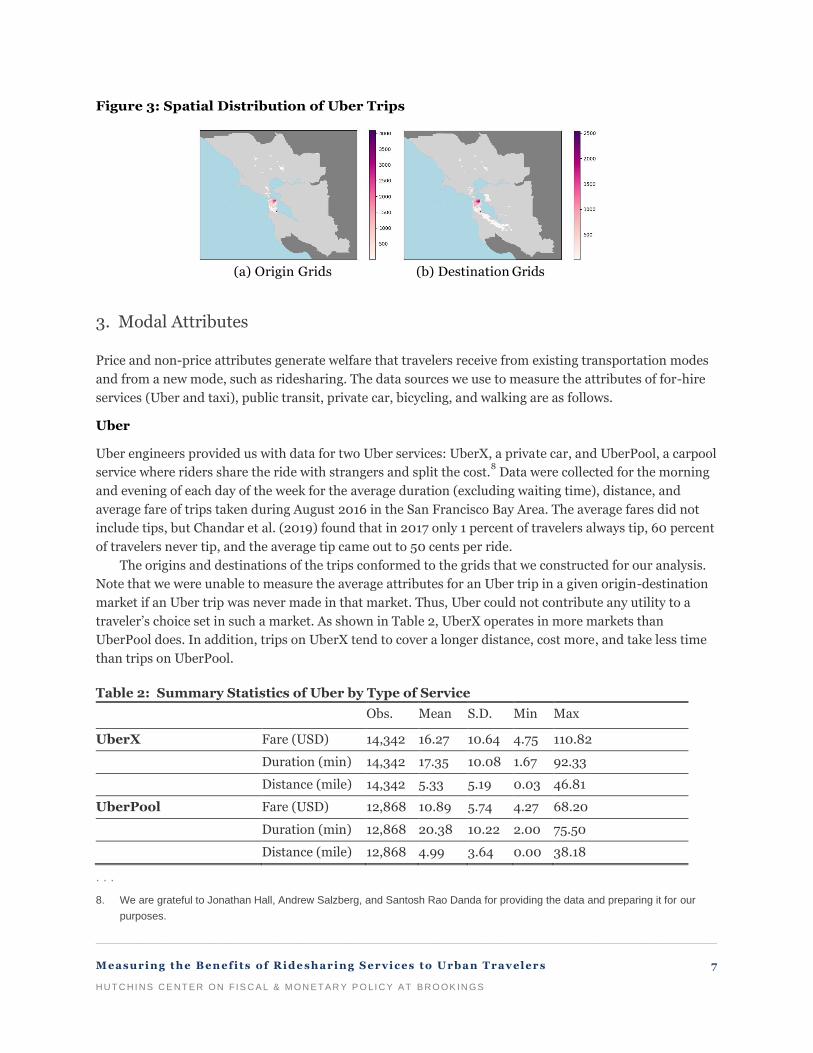
In contrast, travelers use public transit and car hire services primarily in San Francisco County.
However, we obtained data on Uber trips in August 2016 from Uber engineers; thus, for comparative
purposes we show in Figure 3 that Uber’s service area is more extensive than the service area indicated by
car hire services.7
. . .
7. Uber’s data indicate that Uber serves about 15 percent more markets than are served by car hire services in the 2019 NHTS
data.
_________________________________________________________________________________________________________
Measuring the Ben efits of Ride sharing Ser vices to Urban Trav eler s 7
HUT C HI NS CE NT E R ON F IS C A L & M ON E T A R Y P O LI CY A T B RO OK IN GS
Figure 3: Spatial Distribution of Uber Trips
(a) Origin Grids (b) Destination Grids
3. Modal Attributes
Price and non-price attributes generate welfare that travelers receive from existing transportation modes
and from a new mode, such as ridesharing. The data sources we use to measure the attributes of for-hire
services (Uber and taxi), public transit, private car, bicycling, and walking are as follows.
Uber
Uber engineers provided us with data for two Uber services: UberX, a private car, and UberPool, a carpool
service where riders share the ride with strangers and split the cost.8 Data were collected for the morning
and evening of each day of the week for the average duration (excluding waiting time), distance, and
average fare of trips taken during August 2016 in the San Francisco Bay Area. The average fares did not
include tips, but Chandar et al. (2019) found that in 2017 only 1 percent of travelers always tip, 60 percent
of travelers never tip, and the average tip came out to 50 cents per ride.
The origins and destinations of the trips conformed to the grids that we constructed for our analysis.
Note that we were unable to measure the average attributes for an Uber trip in a given origin-destination
market if an Uber trip was never made in that market. Thus, Uber could not contribute any utility to a
traveler’s choice set in such a market. As shown in Table 2, UberX operates in more markets than
UberPool does. In addition, trips on UberX tend to cover a longer distance, cost more, and take less time
than trips on UberPool.
Table 2: Summary Statistics of Uber by Type of Service
Obs. Mean S.D. Min Max
UberX Fare (USD) 14,342 16.27 10.64 4.75 110.82
Duration (min) 14,342 17.35 10.08 1.67 92.33
Distance (mile) 14,342 5.33 5.19 0.03 46.81
UberPool Fare (USD) 12,868 10.89 5.74 4.27 68.20
Duration (min) 12,868 20.38 10.22 2.00 75.50
Distance (mile) 12,868 4.99 3.64 0.00 38.18
. . .
8. We are grateful to Jonathan Hall, Andrew Salzberg, and Santosh Rao Danda for providing the data and preparing it for our
purposes.

_________________________________________________________________________________________________________
Measuring the Ben efits of Ride sharing Ser vices to Urban Trav eler s 8
HUT C HI NS CE NT E R ON F IS C A L & M ON E T A R Y P O LI CY A T B RO OK IN GS
Modal Attributes from Google Maps API
The 2017 NHTS provides information on the distance of each trip, which we use to calculate the cost of
certain modes, and the duration of the trip for the chosen mode, but it does not provide information on
the duration of the trips for the non-chosen modes and on transit fares for both the chosen and non-
chosen modes. We use Google Maps API to fill those gaps.
Using the departure times in the NHTS and the centroids of the latitudes and longitudes of the origins
and destinations of the trips, we use Google Maps API to identify the available transportation alternatives
and their attributes. Data were collected in 2017 for the distance and travel duration of trips by private
auto, bicycling, and walking. We collected the same variables and fares for the public transit options, bus,
subway (BART), and the combination of the two.9 We assume that people who walk or ride a bicycle to
their destinations do not incur out-of-pocket costs.
Travel Decision Survey
The 2017 Travel Decision Survey (TDS) that is conducted by the San Francisco Municipal Transportation
Agency summarizes travel behavior in the Bay Area and provides data that we use to help distinguish taxi
from TNC operations. According to the TDS, taxis account for roughly 9 percent of all trips using car hire
services based on a modest sample of trips between zip codes and based on a larger sample of trips in the
Bay Area.10
That share is consistent with the increase in the car hire alternative from the 2009 to 2017
NHTS that came solely from the growth of ridesharing. The data’s spatial patterns are also consistent with
patterns that we discussed previously, which indicate that TNCs provide more extensive transportation
coverage than taxis do.
Constructing Monetary Costs for Private and For-Hire Cars
The monetary cost per mile of driving a private car in 2017 is from the American Automobile
Association.11 We assume vehicles accumulate 15,000 miles per year and we use operating and ownership
costs for the vehicle classification that matches the vehicle that a traveler uses.
Within for-hire services, we distinguish between the monetary cost of TNCs and taxi. Because we have
two different Uber services, we use the weighted average fare of UberX and UberPool, where the weights
are 80 percent and 20 percent, respectively.12
Note the fares are actually paid by Uber passengers, so they
include any increase caused by surge-pricing adopted by Uber. The taxi fare is calculated based on the
common pricing policy adopted by the major taxicab firms in San Francisco as reported by the San
. . .
9. The Google Maps API transit fare is the aggregated fare of using bus and/or subway. Our measure of the duration of transit
trips does not include the transfer time between buses and subways because it is generally short. Similarly, wait time at the
origin tends to be short during peak periods, although it can be long during off-peak periods, such as late in the evening.
However, only a small fraction of the trips in our sample occurred during that time.
10. See https://www.sfcta.org/projects/tncs-today.
11. American Automobile Association, Your Driving Costs: How Much Are You Paying To Drive?, 2017 edition.
12. The percentage of Uber drivers working for UberX was nearly 75 percent in 2018; no official statistic for UberPool was
reported. See https://www.ridester.com/2018-survey.

_________________________________________________________________________________________________________
Measuring the Ben efits of Ride sharing Ser vices to Urban Trav eler s 9
HUT C HI NS CE NT E R ON F IS C A L & M ON E T A R Y P O LI CY A T B RO OK IN GS
Francisco Municipal Transportation Agency.13
Regulated taxi fares are, in general, based on distance and
location, and regulatory authorities have not adjusted them to respond to competition from TNCs. We use
the weighted fare of Uber service and the fare of taxi service as the monetary cost of car hire services for
markets that are served by both taxi and Uber; otherwise, we use the taxi or Uber fare, as appropriate,
when only one of them serves a market.
Summary of Modal Attributes
We summarize the mean and standard deviation of the fare and travel time duration of each mode in
Table 3. Taxi cab and Uber are assumed to have the same duration on an OD pair, which is plausible,
although they have different fares. We also include the average distance of trips that travelers take on each
mode. As expected, driving is far less costly on a per-mile basis than are car hire services and faster on a
per-mile basis than are the other modes, which greatly contributes to its dominant share of urban travel.
Table 3. Means of Modal Attributes (Standard Deviation)
Attributes Car hire services Driving Public
transport
Bicycling Walking
Uber Taxi
Fare ($) 24.24
(27.14)
25.32 (27.15) 4.12
(5.98)
4.50
(3.02)
0 0
Duration (Min.) 16.31
(10.17)
13.24
(11.68)
50.04
(33.96)
14.08
(13.26)
8.86
(29.96)
Distance (Miles) 6.18
(7.96)
7.18
(10.35)
12.88
(13.46)
2.35
(2.35)
0.43
(1.49)
4. Empirical Methodology
We quantify the welfare gain to travelers from the introduction of Uber by first using the 2017 NHTS data
and the data on the modal attributes to estimate travelers’ mode choices when ridesharing services were
available in San Francisco Bay Area markets. This is the base case scenario subject to the car hire option
including Uber and taxi. We then construct a counterfactual scenario where ridesharing services do not
exist by using the 2009 NHTS data to calibrate the estimated choice model in the base case. We then
calculate consumer benefits in the base and counterfactual scenarios and compare the difference to obtain
the welfare gain to travelers from Uber services.
. . .
13. See https://www.sfmta.com/getting-around/taxi/taxi-fares. The fares for a trip of a given distance are based on charging
travelers $3.50 for the first 1/5 mile and $0.55 for each additional 1/5th mile. We also add $0.55 for each minute of wait time
and traffic delay. Out-of-town trips from San Francisco that exceed 15 miles are charged a fare that is 150 percent of the
metered rate. The same fare calculation is applied for trips originating outside of San Francisco because taxis operating in the
San Francisco Bay Area generally have the same pricing policy.

_________________________________________________________________________________________________________
Measuring the Ben efits of Ride sharing Ser vices to Urban Trav eler s 10
HUT C HI NS CE NT E R ON F IS C A L & M ON E T A R Y P O LI CY A T B RO OK IN GS
Panel Data Mixed Logit Mode Choice Model
Assume households indexed by 1,2,...,h H= are composed of individuals 1, 2,..., Ihi = . The
transportation mode for a trip is denoted by j , where is the choice set in a market:
Non Vehicle Nest
Walking, Bicycling , Public Transport, Driving, Car hire services
=
Define ( )I A as an indicator function, which equals 1 if A holds and 0 otherwise. We specify the indirect
utility function of individual i choosing mode j in trip t as:
( ) ( )
( )
( )
( )
2
2
2
I Non Vehicle Nest I and Driving
~ ,
~ ,
~ 0,
ijt ijt ijt
i jt i jt i ik ijk
k
ik i k
i i
i i
i
u v
p d j k k
N
N
N
= +
= + + + +
=
Z λ
Z θ
Z δ
(1)
and jtp is the fare for alternative j on trip t , jtd is the travel duration, and iZ is a vector of ones and
sociodemographic variables of the individual and household, such as age, education, household income, and the like. Preference heterogeneity for fare and travel duration is captured by a vector of random
parameters, ( ),i i , while ( ),θ δ and ( )2 2, are the associated vectors of means and standard
deviations, respectively, to be estimated; the random coefficient i captures the correlation between the
two non-vehicle alternatives. This specification mimics the nested-logit specification in which the two
nonvehicle alternatives are grouped into one nest. We choose driving as the base alternative and ik
represents alternative-specific effects that vary across individuals with different sociodemographic
characteristics. Finally, ijt is assumed to be distributed . . .i i d extreme value for trips, individuals, and
alternatives.
Let ijty denote individual 'i s mode choice for trip t and let iT denote the number of trips made
by individual i ; thus, the joint mode choice probability conditional on the random parameters,
( ), ,i i i i , is:
( )( )( )1 2
1
expPr , ,...,
exp
i
i
Tijt
ij ij ijT i
t ij t
j
uy y y
u=
=
. (2)
The unconditional joint choice probability is :

_________________________________________________________________________________________________________
Measuring the Ben efits of Ride sharing Ser vices to Urban Trav eler s 11
HUT C HI NS CE NT E R ON F IS C A L & M ON E T A R Y P O LI CY A T B RO OK IN GS
( ) ( ) ( ) ( )1 2 1 2, Pr , ,..., Pr , ,..., ;i i
i
i ij ij ijT ij ij ijT i i iL y y y y y y d
= (3)
where k k = denotes a vector of non-random parameters; ( )2 2 2, , , , = θ δ denotes the
parameters of the random components; and ( ) indicates the distribution of the coefficients in the
population.
Estimates of the parameters ( ), , of the panel mixed logit probabilities are obtained by
maximizing the simulated data log-likelihood (Train, 2009). Note that the random parameters account for
error correlation for travelers who take multiple trips.
Calibrated Model
As noted, the 2017 NHTS combined taxi and Uber in the car hire alternative; thus, we cannot conduct a
counterfactual that simply eliminates Uber from the travelers’ choice set because the alternative specific
constant for the taxi alternative that remains is inflated given that its value was determined when Uber
services were available. We use the 2009 NHTS data to calibrate a model for the counterfactual scenario
in which Uber services do not exist. To do so, we first replace Uber fares, which are the fares of “car hire
services,” with taxi fares in the 2017 NHTS data. Given those fares, we calibrate the intercepts in
ik =ι κ
Ζ λ , which are specified in equation (1), to replicate the mode shares in the 2009 NHTS data.14
Travelers’ Welfare
Travelers’ welfare is calculated by the log-sum rule in Choi and Moon (1997):
( )( ) ( )1 1
1ln exp ;
i
i
TI
ijt i i i
i t ji
CS v d= =
= (4)
where i is the individual’s marginal utility of income derived from Roy’s identity.15
We decompose the
benefits of Uber services to travelers into non-fare and fare benefits. Non-fare benefits come from sources
such as higher service quality, more transparent fares, personalized pricing and services, expanded taxi
service into new markets in response to Uber’s competition, and the like.16 We quantify those benefits by
using the estimated and calibrated model to calculate travelers’ welfare using equation (4) on the adjusted
data, in which fares of car hire services in all markets are cab fares. We measure non-fare benefits as the
difference in welfare from the two models on the adjusted data. We quantify the fare benefits by redoing
the calculations on the original 2017 NHTS data in which the fares of car hire services in markets served
by Uber are based only on Uber fares.
. . .
14. The share of taxi cab (or car hire services) was only 0.09 in the 2009 NHTS data.
15. The marginal utility of income is computed using the coefficients of all of the fare variables.
16. The benefit of expanded taxi service is reflected in the alternative specific dummy for car hire services, which includes both
Uber and taxi.

_________________________________________________________________________________________________________
Measuring the Ben efits of Ride sharing Ser vices to Urban Trav eler s 12
HUT C HI NS CE NT E R ON F IS C A L & M ON E T A R Y P O LI CY A T B RO OK IN GS
5. Empirical Findings
The specification of travelers’ utility in their choice of mode included the modal attributes, fares and trip
duration, which were specified alone, interacted with the purpose of the trip, work or shopping, and
interacted with socioeconomic variables, household size, income, professional, managerial, or technical
job occupation, young child in the household, and frequent smartphone user. We include random
parameters, assumed to be log normally distributed, for fares and trip duration and for the non-vehicle
dummy variable. Bicycling is the base mode in the non-vehicle nest and driving is the base alternative of
the mode choice model. Finally, we control for the possible endogeneity of fares by including alternative
specific dummy variables, which capture omitted modal attributes, including attributes that may be
correlated with fares.17
We present the mixed-logit parameter estimates in Table 4. The coefficients of the mean random
parameters have the expected negative sign, and they along with the standard deviations of the random
parameters are statistically significant. All else constant, walking is preferred to bicycling, and non-vehicle
modes are less preferred to driving. Transit and car hire services are also less preferred to driving,
although the alternative-specific dummy for transit is not statistically significant.
Table 4. Mode Choice Parameter Estimates
Variable Coefficients (standard errors)
Fare -0.526 (0.071)
Fare × Work trips -0.005 (0.013)
Fare × Shopping trips -0.109 (0.024)
Fare × Household size -0.055 (0.021)
Fare × High income -0.104 (0.072)
Fare × Household size × High income 0.034 (0.022)
Fare × Frequent smartphone -0.031 (0.052)
Std. dev. of Fare coefficient 0.370 (0.017)
Duration -0.372 (0.014)
Duration × Professional 0.042 (0.006)
Duration × Work trip 0.004 (0.004)
Duration × Shopping trip -0.070 (0.007)
Duration × Household size -0.015 (0.002)
Duration × Young child -0.011 (0.012)
Std. dev. of Duration coefficient 0.178 (0.007)
Non-vehicle -3.449 (0.897)
Std. dev. of Non-vehicle coefficient 2.635 (0.115)
Walking 7.227 (0.742)
Public transport -0.317 (0.723)
Car hire services -9.081 (2.430)
Interactions between constants and
sociodemographic variables included?
YES
Number of observations 87,386
. . .
17. Using alternative specific dummy variables for this purpose has been common practice in disaggregate choice modeling since
the 1970s.
_________________________________________________________________________________________________________
Measuring the Ben efits of Ride sharing Ser vices to Urban Trav eler s 13
HUT C HI NS CE NT E R ON F IS C A L & M ON E T A R Y P O LI CY A T B RO OK IN GS
The average value of time, VoT, based on the fare and duration mean coefficients, is $42.42 per hour,
which exceeds the average hourly wage in the San Francisco Bay Area in 2018 of $34.81,18
but is still
plausible given the high incomes in the area.
The estimates of the interaction terms indicate that the disutility of a higher fare is increased for
shopping trips because it reduces the availability of money that could be spent on goods and services, and
it is also increased for larger households because such households have a tighter budget constraint per
household member. Similarly, the disutility of a longer duration of a trip, increasing time costs, is greater
for shopping trips and larger households.
Sensitivity by Trip Distance
Travelers’ heterogeneity arises from sorting based on their residential locations. Generally, travelers with
the highest value of travel time live closest to their workplaces, while travelers with the lowest value of
travel time live farthest from their workplaces (Calfee and Winston, 1998). The non-motor vehicle modes,
bicycling and walking, are unlikely to be chosen by travelers for long-distance work or shopping trips.
Descriptive information in the NHTS indicates that the shares of bicycling and walking declined
dramatically for trips greater than or equal to two miles, so we re-estimated the mode choice model with a
sample that included only trips with a distance that was less than two miles.
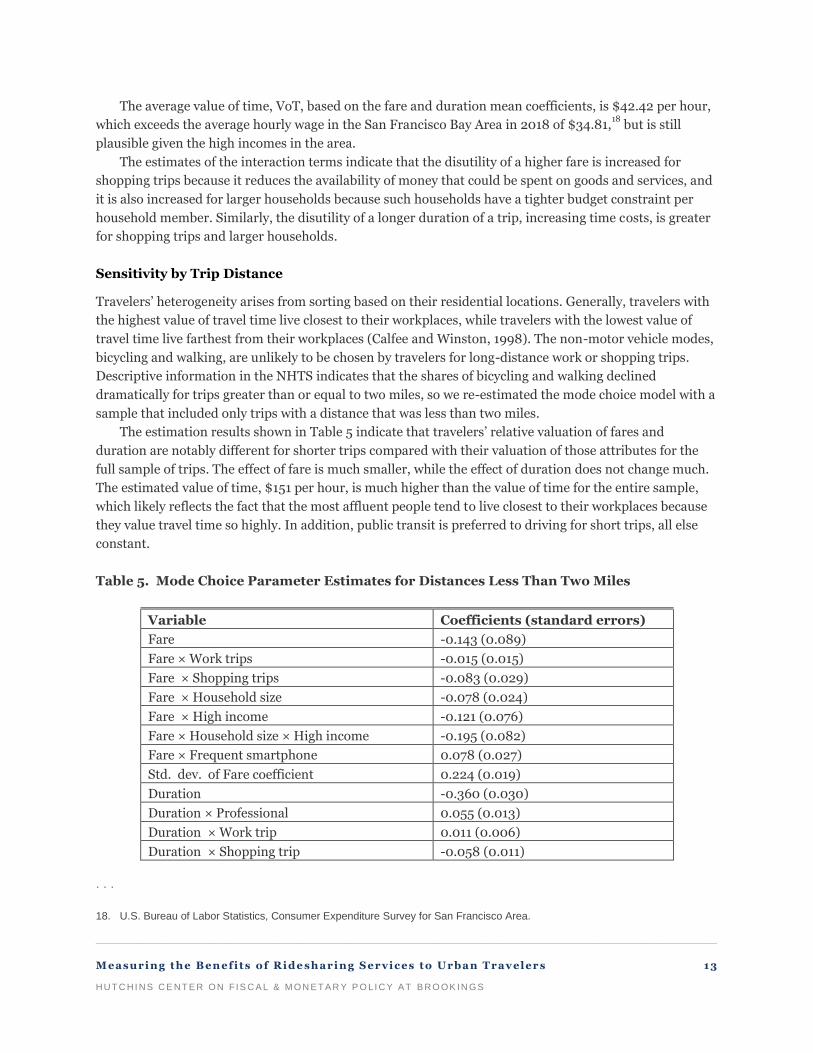
The estimation results shown in Table 5 indicate that travelers’ relative valuation of fares and
duration are notably different for shorter trips compared with their valuation of those attributes for the
full sample of trips. The effect of fare is much smaller, while the effect of duration does not change much.
The estimated value of time, $151 per hour, is much higher than the value of time for the entire sample,
which likely reflects the fact that the most affluent people tend to live closest to their workplaces because
they value travel time so highly. In addition, public transit is preferred to driving for short trips, all else
constant.
Table 5. Mode Choice Parameter Estimates for Distances Less Than Two Miles
Variable Coefficients (standard errors)
Fare -0.143 (0.089)
Fare × Work trips -0.015 (0.015)
Fare × Shopping trips -0.083 (0.029)
Fare × Household size -0.078 (0.024)
Fare × High income -0.121 (0.076)
Fare × Household size × High income -0.195 (0.082)
Fare × Frequent smartphone 0.078 (0.027)
Std. dev. of Fare coefficient 0.224 (0.019)
Duration -0.360 (0.030)
Duration × Professional 0.055 (0.013)
Duration × Work trip 0.011 (0.006)
Duration × Shopping trip -0.058 (0.011)
. . .
18. U.S. Bureau of Labor Statistics, Consumer Expenditure Survey for San Francisco Area.

_________________________________________________________________________________________________________
Measuring the Ben efits of Ride sharing Ser vices to Urban Trav eler s 14
HUT C HI NS CE NT E R ON F IS C A L & M ON E T A R Y P O LI CY A T B RO OK IN GS
Duration × Household size -0.003 (0.004)
Duration × Young child 0.007 (0.022)
Std. dev. of Duration coefficient 0.163 (0.013)
Non-vehicle -11.362 (7.250)
Std. dev. of Non-vehicle coefficient 21.491 (3.363)
Walking 14.404 (6.813)
Public transport 5.120 (1.454)
Car hire services -22.800 (7.383)
Interactions between constants and
sociodemographic variables included?
YES
Number of observations 39,647
Estimated Benefits
We measure the benefits that Uber provides to consumers by first removing Uber as an alternative in 2017
Bay Area markets. To do so, we replace Uber fares, which are included in the fares of car hire services,
with taxi fares, and we calibrate the constant for car hire services so that its market share drops from 0.9
percent to 0.07 percent.19
We then calculate the total benefits that travelers obtain from the
transportation choice set in the counterfactual scenario where Uber is not an available option, and we
compare it to their total benefits from the transportation choice set in the base case scenario where they
can choose to use Uber.
We find that Bay Area travelers in the NHTS sample, not just Uber passengers, gain $4,446 per day,
which, given 5,471 travelers, amounts to an average gain per traveler of $0.81. Making the conservative
assumption that only half of the Bay Area population has access to Uber,20
we estimate that the daily
benefits to the Bay Area are roughly $2.8 million ($0.81×3,484,823)21 for an annual gain of $1.02 billion.
Extrapolating the gain to all U.S. cities suggests that an estimate of the annual benefits from Uber services
would amount to several billions of dollars.
We offer three useful checks on the plausibility of the magnitude of the estimated benefits. First,
Cohen et al.’s (2016) estimate of the average daily gain per traveler generated by Uber of $1.60 is roughly
twice our estimate; however, as noted, their estimate is inflated because they do not account for the
benefits provided by alternative transportation modes. Second, our estimate of the average daily gain per
traveler is a modest share, roughly 5 percent, of Bay Area travelers’ average daily expenditures on
transportation. Given that our estimate is conservative, as noted previously and discussed further below,
and given the high cost of driving in the Bay Area, this relationship is plausible.
The estimated benefits can be decomposed into non-fare benefits of $0.815 and very slight fare losses
of -$0.005. Travelers incur a loss from fares because although Uber fares are roughly $2 less than taxi
fares for the car hire trips that were actually taken, Uber fares are higher than taxi fares for the large
. . .
19. The constant for car hire services changed from -9.08, as reported in table 4, to -23.
20. The assumption is conservative because Uber tends to serve the most densely populated areas in an urban metropolis.
21. State of California, Department of Finance.

_________________________________________________________________________________________________________
Measuring the Ben efits of Ride sharing Ser vices to Urban Trav eler s 15
HUT C HI NS CE NT E R ON F IS C A L & M ON E T A R Y P O LI CY A T B RO OK IN GS
remainder of trips that were taken on other modes. Because there is a positive probability, even if small,
that Uber could have been chosen for those trips, its relatively higher fares reduce travelers’ welfare.
The non-fare benefits reflect Uber’s departure times and differentiated services, which, as captured by
the alternative specific constant, are more closely aligned with travelers’ preferences than are taxi’s
offerings. Uber also benefits travelers by causing taxi to increase its geographic coverage to compete more
effectively with Uber.22
Generally, we underestimate the gains provided by Uber because we hold the size of the travel market
constant when it is likely that Uber’s entry has attracted additional travelers within the San Francisco Bay
Area who benefit from the service. In addition, we do not account for trips by travelers outside of the Bay
Area, which include new trips generated by Uber to, for example, San Francisco and possibly San Jose
airports.23 Finally, we do not account for any changes in spatial economic activity. Gorback (2020) finds
that UberX’s entry has caused New York City house prices to increase 4 percent by improving residents’
accessibility and the area’s amenities.
Given the evidence available, we suggest that a full social welfare analysis of Uber, which would go
beyond its effect on travelers and account for its effect on automobile-related externalities, including
safety, congestion, and emissions, and on other modes, would not raise doubts about its social
desirability. Uber is likely to improve safety by providing trips during the evening to travelers who have
been drinking or who have been working late and are too tired to drive. Unfortunately, empirical research
has yet to produce strong evidence of this possibility.24
Uber’s effect on congestion is controversial because, on the one hand, it reduces congestion caused by
taxis that cruise for passengers in dense urban areas, but it could also cause congestion if it generates
more trips during peak travel periods. In any case, the efficient policy is not to limit Uber operations, but
for policymakers to set an efficient congestion toll for all motor vehicles. Similarly, Leard and Xing (2020)
conclude that the availability of ridesharing has led to modest increases in total vehicle miles traveled and
greenhouse gas emissions, but efficiency calls for setting emission charges on all motor vehicles to reduce
the social costs of pollution. Ridesharing has also been criticized for plunging the taxi industry into a
financial crisis and for displacing a significant portion of public transit trips in some large cities (Leard
and Xing, 2020). Taxi’s financial problems reflect outdated regulations that limit its operations and its
inability to cater effectively to travelers’ preferences. Indeed, taxis have yet to develop an effective
platform using a smartphone application in most major U.S. cities. Public bus and rail transit is highly
inefficient and requires large taxpayer-funded subsidies that are likely to exceed its benefits to users
. . .
22. The geographic coverage of car hire service in the 2017 NHTS data is greater than it is in the 2009 NHTS data, suggesting the
competition from TNCs has caused car hire services to expand their coverage.
23. We possibly overstate the gains because people must choose their next best alternative mode instead of choosing not to
travel. But this upward bias is undoubtedly much smaller than the downward bias from holding the size of the travel market
constant.
24. A fundamental challenge to this research is that Uber’s entry into a market is endogenous and likely to be correlated with
unobserved influences on automobile accidents. Those unobserved influences are also likely to be correlated with any
potential instruments for Uber’s entry.

_________________________________________________________________________________________________________
Measuring the Ben efits of Ride sharing Ser vices to Urban Trav eler s 16
HUT C HI NS CE NT E R ON F IS C A L & M ON E T A R Y P O LI CY A T B RO OK IN GS
(Winston, 2013). Thus, ridesharing may be increasing, not reducing, social welfare by capturing some of
transit’s mode share.25
6. Conclusion
The rapid growth of ridesharing services, which has caused the contraction of the taxi industry and
reduced transit’s share of passengers, suggests that utility-maximizing travelers have improved their
welfare by shifting to a new mode. We quantified those benefits in San Francisco Bay Area markets,
accounting for travelers’ complete set of transportation options. We found that travelers have gained
roughly $1 billion annually from Uber’s service, and we argued that a full welfare analysis is more likely to
reinforce instead of challenge the conclusion that Uber has provided positive social benefits.
Nonetheless, ridesharing faces opposition from special interests that is aided and abetted by some
policymakers in the United States and in other countries, who have introduced regulatory policies to limit
ridesharing operations. Our findings suggest that such actions are at variance with the public interest and
that they should be resisted by the public because they unnecessarily interfere with their informed, self-
interested transportation choices in a highly competitive environment. After decades of inefficiency and
technological stagnation in urban transportation, ridesharing is a welcome innovation that may be
followed by other transportation innovations. It would be unwise to discourage the innovative efforts of
entrepreneurs by trying to protect the less efficient modes that are being displaced.
. . .
25. Ridesharing’s producer surplus potentially offsets its effect on the financial condition of the taxi industry and public transit. Uber
has yet to be consistently profitable, but its market valuation of $50 billion before COVID-19 suggested that investors believe
that it would be highly profitable in the long run.
_________________________________________________________________________________________________________
Measuring the Ben efits of Ride sharing Ser vices to Urban Trav eler s 17
HUT C HI NS CE NT E R ON F IS C A L & M ON E T A R Y P O LI CY A T B RO OK IN GS
REFERENCES
Angrist, Joshua D., Sydnee Caldwell, and Jonathan V. Hall. 2017. “Uber vs. Taxi: A Driver’s Eye View.” Working Paper 23891,
National Bureau of Economic Research.
Calfee, John and Clifford Winston. 1998. “The Value of Automobile Travel Time: Implications for Congestion Policy,” Journal of
Public Economics 69 (1): 83-102.
Chandar, Bharat, Uri Gneezy, John A. List, and Ian Muir. 2019. “The Drivers of Social Preferences: Evidence from a Nationwide
Tipping Field Experiment,” NBER working paper 26380, October.
Choi, Ki-Hong and Choon-Geol Moon. 1997. “Generalized Extreme Value Model and Additively Separable Generator Function.”
Journal of Econometrics 76 (1): 129- 140.
Cohen, Peter, Robert Hahn, Jonathan V. Hall, Steven D. Levitt, and Robert D. Metcalfe. 2016. “Using Big Data to Estimate
Consumer Surplus: The Case of Uber.” Working Paper 22627, National Bureau of Economic Research.
Cramer, Judd and Alan B. Krueger. 2016. “Disruptive Change in the Taxi Business: The Case of Uber.” American Economic Review:
Papers & Proceedings 106 (5):177–82.
Gorback, Caitlin. 2020. “Ridesharing and the Redistribution of Economic Activity,” unpublished working paper.
Hall, Jonathan V. and Alan B. Krueger. 2018. “An Analysis of the Labor Market for Uber’s Driver-Partners in the United States.”
Industrial and Labor Relations Review 71 (3):705–732.
Leard, Benjamin and Jianwei Xing. 2020. “What Does Ridesharing Re- place?,” Resources for the Future working paper 20-03,
February.
Train, Kenneth E. 2009. Discrete Choice Methods with Simulation. Cambridge University Press, 2nd edition.
Winston, Clifford. 2013. “On the Performance of the U.S. Transportation System: Caution Ahead,” Journal of Economic Literature
51 (3): 773-824.
The mission of the Hutchins Center on Fiscal and Monetary Policy is to improve the quality and efficacy of fiscal and monetary policies and public understanding of them.
Questions about the research? Email [email protected]. Be sure to include the title of this paper in your inquiry.
© 2020 The Brookings Institution | 1775 Massachusetts Ave., NW, Washington, DC 20036 | 202.797.6000