measuring student achievement presentation at the 2005 howard university utep alliance for graduate...
TRANSCRIPT

Measuring Student Achievement
Presentation at the 2005 Howard University UTEP Alliance for Graduate Education
and the Professoriate (AGEP)PFF STEM Summer Institute
UTEPEl Paso, Tx
June 25, 2005
Michael T. Nettles Policy Evaluation & Research Center
Copyrighted (C) 2004 by Educational Testing Service. All rights reserved. The ETS logo is a registered trademark of Educational Testing Service (ETS).

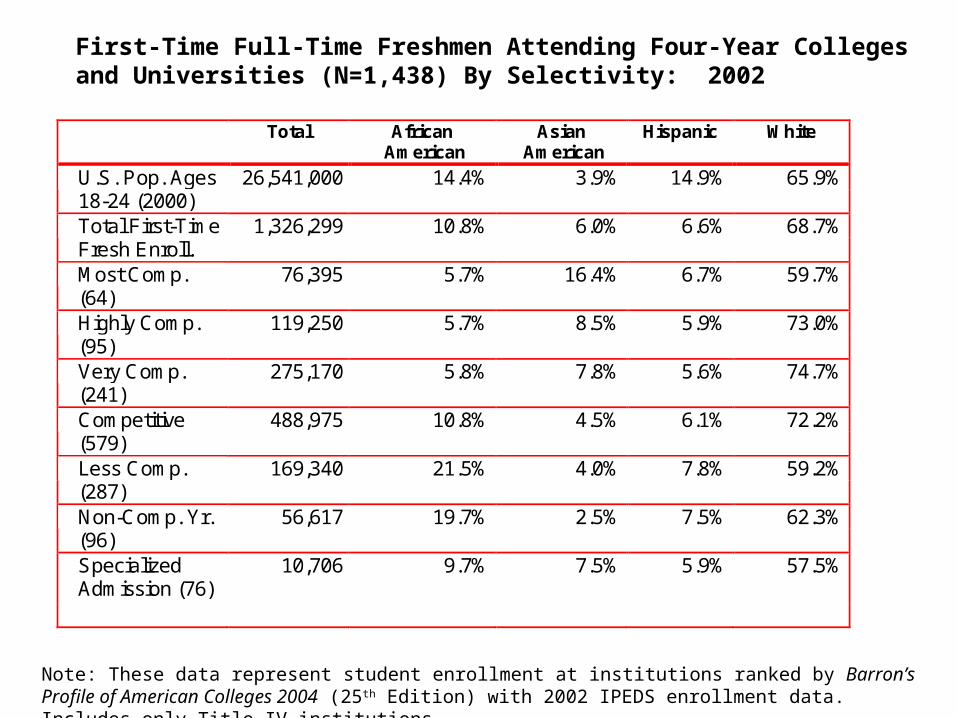
First-Time Full-Time Freshmen Attending Four-Year Colleges and Universities (N=1,438) By Selectivity: 2002
Total African American
Asian American
Hispanic White
26,541,000 3,810,000 1,038,000 3,956,000 17,496,000 U.S. Pop. Ages 18-24 (2000) 14.4% 3.9% 14.9% 65.9%
1,326,299 143,130 79,488 86,883 910,723 Total First-Time Fresh Enroll. 10.8% 6.0% 6.6% 68.7%
76,395 4,334 12,520 5,118 45,614 Most Comp. (64) 5.7% 16.4% 6.7% 59.7%
119,250 6,777 10,089 7,083 87,001 Highly Comp. (95) 5.7% 8.5% 5.9% 73.0%
275,170 15,871 21,348 15,376 205,454 Very Comp. (241) 5.8% 7.8% 5.6% 74.7%
488,975 52,599 22,181 29,645 353,045 Competitive (579) 10.8% 4.5% 6.1% 72.2%
169,340 36,333 6,799 13,244 100,193 Less Comp. (287) 21.5% 4.0% 7.8% 59.2%
56,617 11,159 1,435 4,220 35,289 Non-Comp. Yr. (96) 19.7% 2.5% 7.5% 62.3% Specialized Admission (76)
10,706 1,043 803 637 6,153
9.7% 7.5% 5.9% 57.5% Note: These data represent student enrollment at institutions ranked by Barron’s Profile of American
Colleges 2004 (25th Edition) with 2002 IPEDS enrollment data. Includes only Title IV institutions.

First-Time Full-Time Freshmen Attending Four-Year Colleges and Universities (N=1,438) By Selectivity: 2002
Total African American
Asian American
Hispanic White
26,541,000 14.4% 3.9% 14.9% 65.9% U.S. Pop. Ages 18-24 (2000)
1,326,299 10.8% 6.0% 6.6% 68.7% Total First-Time Fresh Enroll.
76,395 5.7% 16.4% 6.7% 59.7% Most Comp. (64)
119,250 5.7% 8.5% 5.9% 73.0% Highly Comp. (95)
275,170 5.8% 7.8% 5.6% 74.7% Very Comp. (241)
488,975 10.8% 4.5% 6.1% 72.2% Competitive (579)
169,340 21.5% 4.0% 7.8% 59.2% Less Comp. (287)
56,617 19.7% 2.5% 7.5% 62.3% Non-Comp. Yr. (96) Specialized Admission (76)
10,706 9.7% 7.5% 5.9% 57.5%
Note: These data represent student enrollment at institutions ranked by Barron’s Profile of American Colleges 2004 (25th Edition) with 2002 IPEDS enrollment data. Includes only Title IV institutions.

African American and Hispanic Students are Underrepresented in Top 158 Colleges & Universities
15%
4%
14%
7%6%
11%
7%
16%
6% 6%
9%
6%
0%
5%
10%
15%
20%
25%
African Amer. Asian Amer. Hispanic
U.S. Pop. Ages 18-24 (2000) Total First-Time, Full-Time at 4-yr.
Most Comp. (64) Highly Comp. (95)
Note: Selectivity is from the Barron’s Profiles of American Colleges, 2004 and enrollment data are from the IPEDS Fall 2002 enrollment survey. Institutions that received Title IV funds.

Three Magic Letters:Getting to Ph.D.
Michael T. Nettles & Catherine M. Millett
Johns Hopkins University Press

Czars of Persistence Research
• Astin (1962)
• Lavin (1964)
• Spady (1970, 1971)
• Tinto (1975)
• Bean (1980)
• Pascarella & Terenzini (1976)
• Braxton (1988)
• St. John (1989)
• Brazziel (1977)
• Nettles (1985)
• Rendon (1995)
• Nora (1987)
• Cabrera (1988)
• Clewell & Ficklen (1986)
• Stage (1989)

Stephan & Abigail ThernstromHowever benevolent the motives of such progressive thinkers, their muddled thinking has had unfortunate consequences, as we saw with the University of Illinois example. The risk in taking in a “high risk” student like Fred Abernathy is that of academic failure. When it does not work out, the loser is not the institution but the individual student, who suffers a crushing, humiliating personal defeat that may have lasting results. That should be of special concern when the student (who might be fine at a less competitive school) has already been scarred by encounters with racial prejudice.
Source: America in Black & White: One Nation Indivisible, pg. 395

1992 Entering Cohort 6 Year Graduation Rate1992 Entering Cohort 6 Year Graduation RateInstitution Total White African Amer. Hispanic Bryn Mawr College 78% 83% 67% 47% Cornell University 89% 92% 76% 83% Lehigh University 81% 82% 73% 69% Macalester College 78% 80% 54% 77% Northwestern University 91% 91% 82% 79% Princeton University 95% 96% 86% 91% Rice University 92% 93% 76% 92% Smith College 83% 82% 80% 74% Tulane University 72% 72% 66% 80% University of Michigan 83% 87% 63% 74% UNC - Chapel Hill 82% 84% 64% 86% Univ. of Pennsylvania 88% 91% 74% 75% Vanderbilt University 81% 82% 80% 70% Wellesley College 94% 96% 86% 88% Wesleyan University 86% 88% 84% 78% Williams College 93% 95% 84% 81%
Source: Institutional data reported to Nettles and Millett for six-year graduation rates in 1998.

Addressing Three Questions About Student Persistence
1. Is there a race and social class difference?
2. What distinguishes persisters from stopouts and transfers from stopouts?
3. For persisters, what distinguishes the quality of their performance and experience?

Terminology
1. Persister – a student who is enrolled or graduates from the institution where she enrolled as a first-time, full-time freshman
2. Stopouts – a student who is not continuously enrolled at the institution where she enrolled as a first-time, full-time freshman
3. Transfer – a student who self-reported that she had left her original college and enrolled at a different one.

The Research
• Study conducted from 1999-present
• Survey of College Choices, Experience, and Retention (SOCCER)
– Persisters
– Stopouts
– Transfers
• Interviews of sub-samples in each category

Selecting a Stratified Sample
1. College or University first enrolled – 24 institutions
2. Entering cohort year - 1996, 1997, 1998, 2001
3. At least 18 but not older than 25
4. U.S. Citizens by Race/Ethnicity
– African American
– Asian American
– Hispanic
– White
5. Enrollment status
– Enrolled or not enrolled

Participating Institutions (N=24)
• Bryn Mawr College *
• Cornell University
• Howard University
• Lehigh University
• Macalester College
• New Mexico Highlands Univ.
• Northwestern Univ.*
• Oberlin College *
• Princeton Univ. *
• Rice University *
• Smith College *
• Swarthmore College
• Tulane University *
• Univ. of CA, Berkeley
• Univ. of CA, Los Angeles
• Univ. of Michigan *
• Univ. of N. Carolina-Chapel Hill *
• Univ. of Pennsylvania *
• Vanderbilt University *
• Wellesley College *
• Wesleyan University *
• Williams College *
• Xavier University
• University of Texas, El Paso
* College and Beyond InstitutionsNote: Institutions in blue and green are not in the analyses

SOCCER Surveys – 6 Surveys
• Persistence 1999 Survey of College Choices, Experiences, and Retention (SOCCER) 28 pages
• Stopout 1999 Survey of College Choices, Experiences, and Retention (SOCCER) 28 pages
• Freshman 2000 Survey of College Choices, Experiences, and Retention (SOCCER) 20 pages
• Persistence 2001 Survey of College Choices, Experiences, and Retention (SOCCER) 32 pages
• Stopout 2001 Survey of College Choices, Experiences, and Retention (SOCCER) 40 pages
• Graduate 2001 Survey of College Choices, Experiences, and Retention (SOCCER) 32 pages

Survey of College Choices, Experiences and Retention - SOCCER
Persisters (28 pages)/Freshman (20)
• Student Application, Acceptance & Enrollment
• Experiences
– Attitudes
– Behaviors
• Student Background
Non-Persisters (28 Pages)
• After departing
– Attitudes
– Behaviors
• Experiences at Orig. Inst.
– Attitudes
– Behaviors
• Student Application, Acceptance & Enrollment
• Student Background

Fall 1999 Response Rates (N=15)
Institution Persisters Non-Persisters Total Bryn Mawr College 72% 79% 74% Cornell University 58% 31% 49% Lehigh University 46% 25% 41% Northwestern 55% 42% 51% Macalester College 70% 55% 65% Oberlin College 48% 52% 49% Rice University 65% 46% 60% Tulane University 45% 42% 44% Univ. of CA at Los Angeles 33% 21% 28% Univ of Michigan 61% 36% 51% Univ. of N. Carolina, CH 51% 43% 48% Univ. of Pennsylvania 44% 47% 45% Wellesley College 71% 65% 69% Wesleyan Univ. 42% 40% 41% Williams College 66% 47% 62% Total 52% 38% 47%
Source: Nettles and Millett Survey of College Choices, Experiences and Retention

Racial Distribution of the Sample
Race/Ethnicity % within Cohort
African American 7.2
Asian American 17.7
Hispanic/Latino 6.0
White 69.0
Total 100.0
Source: Nettles and Millett Survey of College Choices, Experiences and Retention

Bowen, Kurzweil and Tobin
Cutting through all of this analysis, there is one major take-away: for those applicants who took the SAT, did well on it, and applied to one of these selective institutions, family income and parental education, in and of themselves, had surprisingly little effect on admissions probabilities, on matriculation decisions, on choices of majors, on subsequent academic performance and graduation rates, and even on later-life outcomes such as earnings and civic participation.
Source: Equity and Excellence in American Higher Education, pg. 135
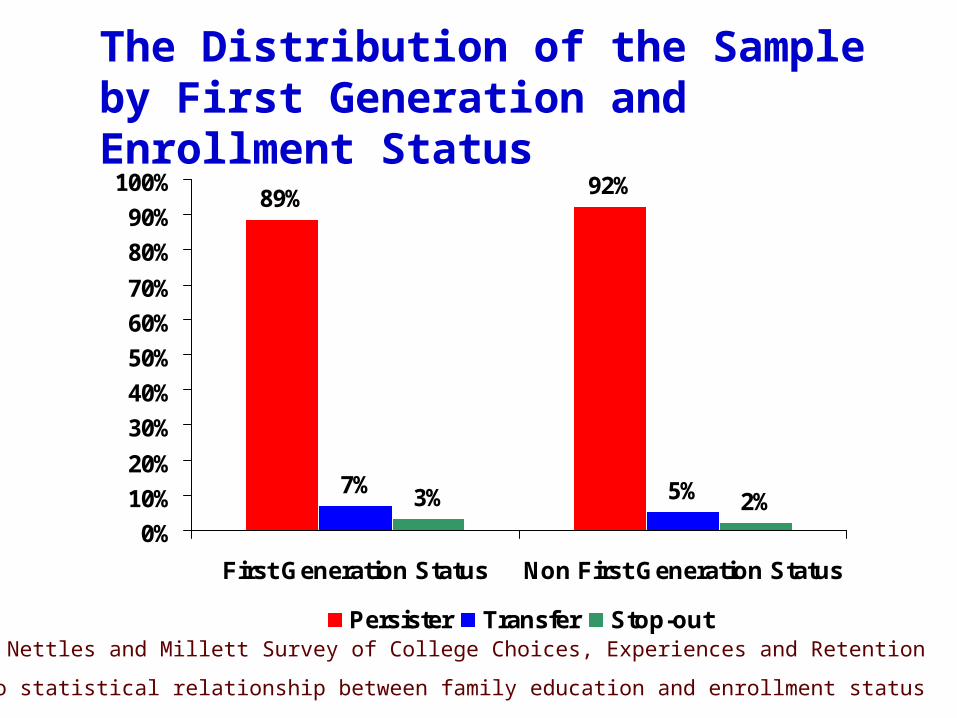
The Distribution of the Sample by First Generation and Enrollment Status
89% 92%
7% 5%3% 2%0%
10%
20%
30%
40%
50%
60%
70%
80%
90%
100%
First Generation Status Non First Generation Status
Persister Transfer Stop-outSource: Nettles and Millett Survey of College Choices, Experiences and Retention
Note: No statistical relationship between family education and enrollment status

The Distribution of the Sample by Family Income and Enrollment Status
89% 92% 93% 92%
8% 6% 5% 5%3% 2% 2% 3%0%
10%20%30%40%50%60%70%80%90%
100%
Less than$50,000
$50,000 to$149,999
$150,000 to$299,999
Greater than$300,000
Persister Transfer Stop-outSource: Nettles and Millett Survey of College Choices, Experiences and Retention
Note: No statistical relationship between family income and enrollment status

The Distribution of the Sample by Enrollment Status and Race/Ethnicity
89%94%
90% 92%
6% 4% 8% 6%5% 2% 3% 2%0%
10%
20%
30%
40%
50%
60%
70%
80%
90%
100%
Afr. Amer. Asian Hisp. White
Persister Transfer Stop-out
Source: Nettles and Millett Survey of College Choices, Experiences and Retention
Note: Statistical difference between race/ethnicity and enrollment status

Predictors of Persisting vs. Stopping Out
-1.284
1.587
1.578
1.826
-1.315
-1.478
2.031
-3 -2.5 -2 -1.5 -1 -0.5 0 0.5 1 1.5 2 2.5 3
Acad Time Mgt.
AcadCompatiatibllity
Faculty Interaction
InstitutionalCommitment
Financial Concerns
Inst. Satisfaction
UGPA
Source: Nettles and Millett Survey of College Choices, Experiences and Retention

Predictors of Transferring vs. Stopping Out
-1.83
-1.379
2.124
1.312
-2.5 -2 -1.5 -1 -0.5 0 0.5 1 1.5 2 2.5
InstitutionalCommitment
Faculty Interaction
Academic TimeMgmt.
AcademicCompatability
Source: Nettles and Millett Survey of College Choices, Experiences and Retention
Note: Financial Concerns, institutional satisfaction and UGPA were not significant predictors of transferring vs. stopping out

First-time, Full-time
Freshman at C/U #1
(4,159)
Leave C/U #1at 1999 (232)
Persister/Graduate from C/U #1 (3,822)
Enrolled at C/U #2, which is more prestigious than C/U #1
(24/227) 11%
Stopout of C/U #1 (104)
Enrolled at C/U #2, which is equally as prestigious as C/U #1
(32/227) 14%
Enrolled at C/U #2, which is less prestigious than C/U #1
(167/227) 73%
Enrolled at special programs (4/227) 2%
First-time, Full-time
Freshman at C/U #1
(4,159)
First-time, Full-time
Freshman at C/U #1
(4,159)
Student’s Educational Paths
6%
92%
3%

Demographic and Background Characteristics Predicting UGPA
0.372
-0.052
-0.043
-0.119
0.045
-0.08
-0.116
-0.4 -0.3 -0.2 -0.1 0 0.1 0.2 0.3 0.4
SAT
African American
Asian American
Hispanic
Male
Family Education
Family Income
Standardized Coefficients
Source: Nettles and Millett Survey of College Choices, Experiences and Retention

Demographic, Background and Experience Characteristics Predicting UGPA
0.312
0.09
-0.081
-0.043
0.068
0.098
-0.084
-0.088
0.384
-0.089
0.001
-0.034
-0.1
-0.3 -0.2 -0.1 0 0.1 0.2 0.3 0.4 0.5
Academic Time Mgmt.
Faculty Interaction
Faculty Support
Racial Climate
Institutional Commitment
Instructional Quality
Social Compatibility
Family Income
SAT
African American
Asian American
Hispanic
Male
Source: Nettles and Millett Survey of College Choices, Experiences and Retention
Note: African Americans are the only race/ethnic group who differ from Whites
Standardized Coefficients

SAT Scores are related to Standardized UGPA
-3.50
-3.00
-2.50
-2.00
-1.50
-1.00
-0.50
0.00
0.50
1.00
Lessthan900
900-949
950-999
1000-1049
1050-1099
1100-1149
1150-1199
1200-1249
1250-1299
1300-1349
1350-1399
1400-1449
1450-1499
1500-1549
1550-1600
Standardized Test Score
Sta
nd
ard
ized
wit
hin
In
stit
uti
on U
nd
ergr
adu
ate
GP
A
African Americans (r = 0.27)Asian Americans (r = 0.27)Hispanic/Latino (r = 0.23)European Americans (r = 0.26)

Factors• Self Concept
• Social Compatibility
• Academic Time Management
• Faculty Support
• Faculty Interaction
• Academic Compatibility
• Instructional Quality
• Supportive Environment
• College Belonging
• Institutional Satisfaction
• Racial Climate
• Experienced Discrimination
• Financial Concerns
• Institutional Commitment
Note: All factors have a Cronbach alpha of .67 or higher

The Student Interviews
Copyrighted (C) 2004 by Educational Testing Service. All rights reserved. The ETS logo is a registered trademark of Educational Testing Service (ETS).

Goal of the Interviews
• To understand the meaning of events and actions as expressed by the students in their own words about their experiences in college.
– To explain the participants point of view
– How the participants think
– How the participants interpret and explain their behavior in a given setting.

Interviewee DataEnrollment Status by Institution (N=15)
Institution Persister Stopout Transfer Total Bryn Mawr College 4 4 Cornell University 6 6 Lehigh University 2 2 Macalester College 4 4 Northwestern University 6 3 9 Oberlin College 2 1 3 Rice University 10 3 3 16 Tulane University 6 2 4 12 University of California at Los
Angeles 9 5 6 20
University of Michigan 16 8 5 29 University of North Carolina at
Chapel Hill 10 2 1 13
University of Pennsylvania 8 2 4 14 Wellesley College 6 10 16 Wesleyan University 4 2 1 7 Williams College 4 1 3 8 Total 79 27 57 163
Source: Nettles & Millett The High Achieving College Student Persistence Study

Interviewee DataEnrollment Status by Race (n=163)
21
7 8
18
912
4
22
12
18
7
25
0
5
10
15
20
25
30
Persister Stopout Transfer
African Amer. Asian Amer. Hispanic/Latino White
Source: Nettles & Millett The High Achieving College Student Persistence StudyNote: CB_15 institutions only

Brendan
•Persister
•African American
•Male
•First Generation
•Low Family SES
•Low SAT score

“I took the SAT once. My plan was not to go to college. I did not think about college first. Because of my SAT score (1050) and because of all these issues especially since that year affirmative action was kicked out here so I didn’t think I had too much of a chance to get into college.”
“I wasn’t going to apply to college but my science teacher encouraged me to apply to college. I couldn’t do it on my own because I couldn’t afford it.”
- Brendan

“It was difficult. It was very, very difficult. I felt so many feelings of inadequacy before I even came here because the school I came from already watered down grades. I was like … I don’t think I’m prepared. In fact, I wasn’t. … One of my first papers I got a D on. That was really discouraging. I had to push through. I had to adjust because I didn’t know anybody. It was hard because I had people prodding me about not going. Like, “You’ll flunk out.”
Transition from High School
- Brendan

“I worked really, really hard. I studied a lot… I thought I was doing pretty well in that class and then come back to find out I got a D+. After I got a D+ I think that was when my perception changed. I was focused on making sure I’d never get another D or anything like that. That’s when I really began to question (my ability) and really come to terms with the reasons for being here. I had to definitely define some reasons for being here. After all, if I’m going to think to myself, “Why am I here? What do I really want to get out of the school? Am I here just because everyone said I could go to college?” It took me about a year to figure it out. When I figured it out it was revelation.”
- Brendan

“There’s such a high standard in the class and I got an A-. That was my first quarter. That set the tone for me. That let me know that I can make it here, that I’m actually capable. My high school counselors would say, “If you made into CalSouth than obviously you must be CalSouth material.” I didn’t feel like CalSouth material. When I got my A- in my political science class I said, “Hey, that’s great for me.” I wrote my papers. I got a lot of help. I got tutoring to help out. I went to speak with my professors who were really cool.”
- Brendan

Matt
•Persister
•Hispanic
•Male
•First Generation
•Low Family SES
•High SAT score

“Success in college? I think college is definitely, for a lot of people, a big change in their life from high school to college. Just by thinking for yourself and feeling comfortable in college is successful because there are times when all you want to do is go home. It gets to the point where there’s so much work and there’s so much stress and there’s no one there to help you. At high school you had your mom and your family but here there’s kind of no one. I think success in college is just being able to handle it and learn from it.”
- Matt

Just a few surprises– While no race differences in
transferring/stopping out, race is a factor in grades.
– Grades are the biggest predictor of persisting versus stopping out.
– All things being equal, Asian Americans like African Americans and Hispanics have lower grade point averages than Whites.
– All things being equal, students from low SES status backgrounds have higher grades.

Surprises (continued)
– While background characteristics play a major role in predicting grades, they have little effect on persistence.
– Persisters are less satisfied, have lower academic time management skills but are academically compatible with the institution, have high faculty interaction and are concerned about finances.

Mantra
• To equalize the quality of preparation for college as well as the collegiate experience for all students

Policy Evaluation & Research Center
http://www.ets.org/research/perc/index.html

Factors

Self Concept(0.81)
I am usually confident that others will have a favorable impression of me
0.91
I feel that I am a person of worth, at least on an equal plane with others
0.85
I am concerned with others’ opinion of me 0.57
Source: Nettles & Millett The High Achieving College Student Persistence Study

Social Compatibility (0.84)
I feel as if I have much in common with other students 0.90
Most students have values and attitudes similar to my own
0.88
I have found a group of friends with whom I feel comfortable
0.85
Source: Nettles & Millett The High Achieving College Student Persistence Study

Academic Time Management(0.73)
Got behind in school work 0.73
Failed to complete course work on time 0.68
Missed class 0.58
How difficult is managing my time effectively?
0.55
Source: Nettles & Millett The High Achieving College Student Persistence Study

Faculty Support(0.78)
Faculty are generally concerned about me 0.83
When I see professors outside of class, they recognize and greet me
0.74
I feel comfortable talking about my personal life with my academic advisor
0.64
Source: Nettles & Millett The High Achieving College Student Persistence Study

Faculty Interaction(0.71)
Talked with a faculty member about your career plans
0.77
Received feedback about your academic progress (in addition to course grades) from a faculty member
0.68
Socialized informally with a faculty member 0.53
Met with faculty during their office hours 0.48
Source: Nettles & Millett The High Achieving College Student Persistence Study

Academic Compatibility(0.86)
My courses provide a high degree of academic challenge
0.84
My academic performance is an important factor for determining whether I fit in at my college
0.82
I worry about getting good grades 0.73
I feel that my high school prepared me well for college 0.68
I am performing academically well as I thought I would 0.66
Source: Nettles & Millett The High Achieving College Student Persistence Study

Instructional Quality(0.87)
Instructors make good use of examples and illustrations to get across difficult points
0.79
Instructors give clear explanations 0.79
Instructors interpret abstract ideas and theories clearly 0.76
Instructors effectively review and summarize the material 0.70
Instructors are well prepared for class 0.61
Course requirements are clearly explained 0.59
Instructors make the course exciting 0.59
Instructors give homework assignments that are useful for learning the course material
0.57
Source: Nettles & Millett The High Achieving College Student Persistence Study

Supportive Environment(0.95)
Instructors are available to discuss coursework and assignments outside of class
0.92
If I needed it, tutorial help and other academic assistance is readily available to me
0.91
The institution creates a positive experience for students
0.90
The institution provides an intellectually challenging learning environment
0.89
I would feel comfortable asking faculty for help if I were having difficulty in a class
0.87
There is administrative support of minority group organizations and programs
0.86
Source: Nettles & Millett The High Achieving College Student Persistence Study

College Belonging (0.70)
If asked, I would recommend the university to others 0.90
I feel that I am a member of the university community 0.90
Not feeling a part of the institution 0.36
Source: Nettles & Millett The High Achieving College Student Persistence Study

Institutional Satisfaction(0.94)
Number of student extracurricular activities 0.86
Size of campus 0.86
Types of student extracurricular activities 0.84
Quality of teaching 0.84
I am satisfied with my intellectual development since enrolling 0.80
Location of campus 0.79
Response to the interests and concerns of students 0.78
A sense of community for students 0.78
Students’ physical safety on campus 0.76
The cost of tuition and fees charged to students 0.51
Source: Nettles & Millett The High Achieving College Student Persistence Study

Racial Climate(0.83)
Students from different racial/ethnic groups communicate well with each other
0.84
There are open discussions of racial issues 0.84
There is little or no racial discrimination 0.71
I feel more comfortable with people of my own race 0.66
I am concerned about fairness of grading 0.44
Source: Nettles & Millett The High Achieving College Student Persistence Study

Experienced Discrimination(0.73)
Witnessed an incident on campus in which racial bias was present
0.78
Heard disparaging comments on campus related to your race or ethnicity
0.78
Experienced discriminatory practices on campus
0.76
Heard disparaging remarks about your sex 0.66
Source: Nettles & Millett The High Achieving College Student Persistence Study
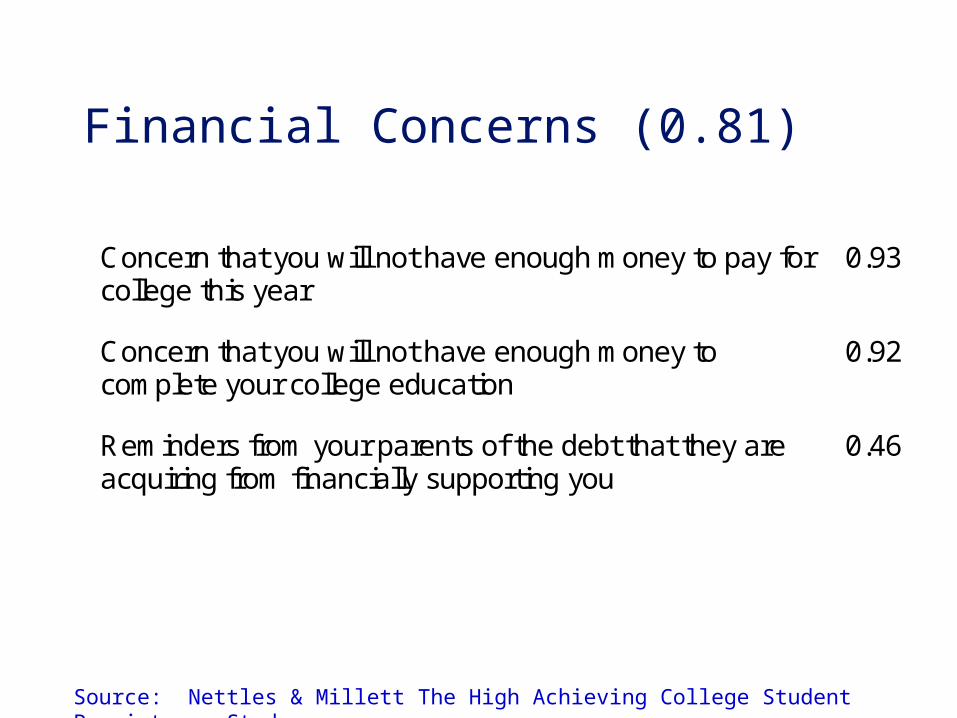
Financial Concerns (0.81)
Concern that you will not have enough money to pay for college this year
0.93
Concern that you will not have enough money to complete your college education
0.92
Reminders from your parents of the debt that they are acquiring from financially supporting you
0.46
Source: Nettles & Millett The High Achieving College Student Persistence Study

Institutional Commitment(0.75)
I frequently consider transferring to another College or University
0.89
I frequently consider dropping out of my College or University
0.75
Reconsidered my decision to attend 0.69
I am confident that I made the right choice when I decided to attend
0.42
Source: Nettles & Millett The High Achieving College Student Persistence Study

The Student Interviews
Copyrighted (C) 2004 by Educational Testing Service. All rights reserved. The ETS logo is a registered trademark of Educational Testing Service (ETS).

Joanne
•Persister
•African American
•Female
•Middle Class
•Low SAT

Dealing with a difficult class-
“Putting in extra study hours before tests, studying a week in advance, trying to get the concepts down and make sense of the material because he was teaching at a fast rate.”
- Joanne

Feelings about grades and motivation -
“Good. I also think that I could be doing better too so again I am working. I have one year and a half left so I feel strong, I am at a stable point, I have 3.57 now. It is a bit above average. I would like to be 3.7, 3.75, before I leave.”
“I want to do well because I want to reach my maximum potential.”

Issues of preparation and success

Jose
•Persister
•Hispanic
•Male
•First Generation
•Low Family SES
•Low SAT score
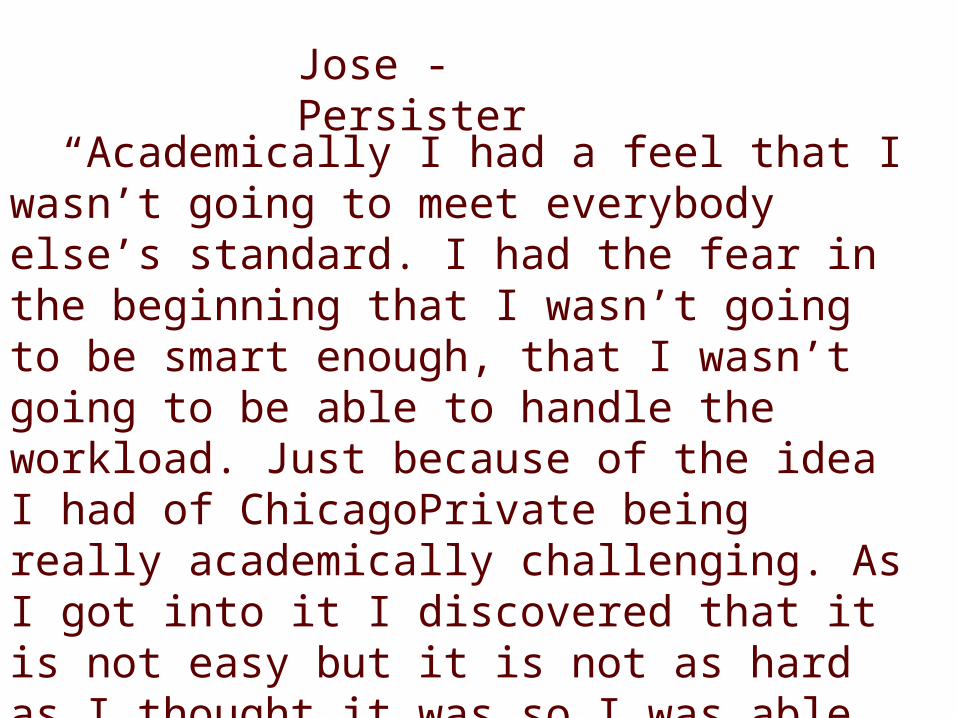
“Academically I had a feel that I wasn’t going to meet everybody else’s standard. I had the fear in the beginning that I wasn’t going to be smart enough, that I wasn’t going to be able to handle the workload. Just because of the idea I had of ChicagoPrivate being really academically challenging. As I got into it I discovered that it is not easy but it is not as hard as I thought it was so I was able to manage the workload, the topic that I was looking at in my classes.”
Jose - Persister

Kimberly
•Stop out
•African American
•Female
•Low Family SES
•Low SAT score

“I was getting like B’s and C’s and everyone is like oh that is what I am getting so you are doing fine. But I wanted A’s you know. I wanted to strive and I felt I could do more but it just wasn’t coming… So I really felt like that I wasn’t applying myself like I should be. But I didn’t know what to do. I was seeing my teachers and I had tutors, spending extra time studying and I wasn’t getting the grades that I wanted to. So I kind of felt like I wasn’t smart enough. And I know it sounds silly now but I felt that it wasn’t clicking.”
Kimberly – Stop out

Ramon
•Persister
•Hispanic
•Male
•Low Family SES
•First Generation
•Relatively high SAT score

“I think it’s a really good thing that I know my professors and they know me by name and that I know I can go talk to them about anything, it doesn’t have to do with academics. We can just talk about what’s going on lately and stuff like that. I think that’s very positive for me academically because it keeps me motivated to do my work and everything. I know that these people know me. One professor…I got a B on a test that I had been getting A’s on. It was like a B-. He wrote a little note on it that said, not your finest effort. That greatly affected me. It was a huge motivating factor to get me back into working even harder to do better.”
Ramon - Persister

Cody
•Persister
•African American
•Male
•First Generation
•Low ACT score

“I took the very hardest classes, I received a 4.0 throughout my high school. I came here and I struggled…I was the valedictorian, (I am) supposed to represent our community as best I can… I wouldn’t even say I was valedictorian anymore… I mean it’s not something that I am ashamed of, but it doesn’t say anything about where I’m at now.”
Cody - Persister

The transition from high school…
“was very, very hard. Very hard because I am used to receiving A’s and the work not being so hard, and it normally comes so naturally to me that I didn’t have to do homework. Once getting here and giving my best at the time, it wasn’t a 4.0 status it was more like 2.7, 3.0 status and it was very hard for me to adjust, I had only received A’s and now I was receiving C’s and B’s, so I found that gap, it was definitely a gap that needed to be bridged.”
- Cody

“I find that my African-American professors have been more supportive of me succeeding because in their eyes we’re like an African-American male, we’re like an endangered species to succeed in this world, there’s not too many things you can get into. So they have pushed me, along with my mother and my family, have pushed me to want to succeed in life.”
- Cody

JUNK!!!!

SAT Scores are related to Adjusted UGPA
-3.00
-2.50
-2.00
-1.50
-1.00
-0.50
0.00
0.50
1.00
Lessthan900
900-949
950-999
1000-1049
1050-1099
1100-1149
1150-1199
1200-1249
1250-1299
1300-1349
1350-1399
1400-1449
1450-1499
1500-1549
1550-1600
Standardized Test Score
Ad
just
ed U
nd
ergr
adu
ate
GP
A
African AmericanAsian AmericanHispanic/LatinoEuropean American

Reasons for Discontinuing Enrollment - Lack of Social Fit with Students
33%
63%
25% 23%20%
4%
22%
10%
0%
10%
20%
30%
40%
50%
60%
70%
Not Important SomewhatImportant
Important ExtremelyImportant
Transfer Stopout

Reasons for Discontinuing Enrollment - Wanted to Attend Different College
31%
73%
21%
11%
22%
7%
26%
9%
0%
10%
20%
30%
40%
50%
60%
70%
80%
Not Important SomewhatImportant
Important ExtremelyImportant
Transfer Stopout

Reasons for Discontinuing Enrollment - Gain Work Experience
86%
72%
9% 12%3%
9%3%
8%
0%
10%
20%
30%
40%
50%
60%
70%
80%
90%
100%
Not Important SomewhatImportant
Important ExtremelyImportant
Transfer Stopout

Reasons for Discontinuing Enrollment - Could Earn More Money Now
97%92%
1% 5%0% 2% 2% 1%
0%
10%
20%
30%
40%
50%
60%
70%
80%
90%
100%
Not Important SomewhatImportant
Important ExtremelyImportant
Transfer Stopout

Reasons for Discontinuing Enrollment - Work to Save Money and Return
92%
71%
4%14%
1%7%
4%8%
0%
10%
20%
30%
40%
50%
60%
70%
80%
90%
100%
Not Important SomewhatImportant
Important ExtremelyImportant
Transfer Stopout

Reasons for Discontinuing Enrollment - Travel
88%
67%
7%
16%
2%8%
4%10%
0%
10%
20%
30%
40%
50%
60%
70%
80%
90%
100%
Not Important SomewhatImportant
Important ExtremelyImportant
Transfer Stopout

Fall 1999 Respondent DataEnrollment Status by Institution (N=20)
Institution Persister Stopout Total
Bryn Mawr College 75 26 101 Cornell University 195 52 247 Lehigh University 93 13 106 Macalester College 84 36 120 Northwestern University 108 31 139 Oberlin College 134 50 184 Princeton University 98 37 135 Rice University 119 26 145 Smith College 128 114 242 Swarthmore College 113 34 147 Tulane University 107 42 149 University of California at Berkeley 300 114 414 University of California at Los Angeles 202 89 291 University of Michigan 388 152 540 University of North Carolina at Chapel Hill 180 96 276 University of Pennsylvania 93 32 125 Vanderbilt University 111 41 152 Wellesley College 170 71 241 Wesleyan University 82 29 111 Williams College 111 20 131 Total 2,891 1,105 3,996 Source: Nettles & Millett The High Achieving College Student Persistence Study

Fall 1999 Response Rates (N=20)
Institution Persisters Stopouts Total
Bryn Mawr College 72% 79% 74% Cornell University 58% 31% 49% Lehigh University 46% 25% 41% Northwestern 55% 42% 51% Macalester College 70% 55% 65% Oberlin College 48% 52% 49% Princeton University 46% 64% 50% Rice University 65% 46% 60% Smith College 59% 61% 60% Swarthmore College 62% 48% 58% Tulane University 45% 42% 44% Univ. of CA at Berkeley 59% 36% 50% Univ. of CA at Los Angeles 33% 21% 28% Univ of Michigan 61% 36% 51% Univ. of N. Carolina, CH 51% 43% 48% Univ. of Pennsylvania 44% 47% 45% Vanderbilt Univ. 51% 51% 51% Wellesley College 71% 65% 69% Wesleyan Univ. 42% 40% 41% Williams College 66% 47% 62% Total 53% 41% 49%

Fall 1999 Respondent DataEnrollment Status by Institution (N=20)
Institution Persister Stopout Total
Bryn Mawr College 75 26 101 Cornell University 195 52 247 Lehigh University 93 13 106 Macalester College 84 36 120 Northwestern University 108 31 139 Oberlin College 134 50 184 Princeton University 98 37 135 Rice University 119 26 145 Smith College 128 114 242 Swarthmore College 113 34 147 Tulane University 107 42 149 University of California at Berkeley 300 114 414 University of California at Los Angeles 202 89 291 University of Michigan 388 152 540 University of North Carolina at Chapel Hill 180 96 276 University of Pennsylvania 93 32 125 Vanderbilt University 111 41 152 Wellesley College 170 71 241 Wesleyan University 82 29 111 Williams College 111 20 131 Total 2,891 1,105 3,996 Source: Nettles & Millett The High Achieving College Student Persistence Study

First-Time Full-Time Freshmen Attending Four-Year Colleges and Universities (N=1,438) By Selectivity: 2002
Total African American
Asian American
Hispanic White
26,541,000 3,810,000 1,038,000 3,956,000 17,496,000 U.S. Pop. Ages 18-24 (2000) 14.4% 3.9% 14.9% 65.9%
1,326,299 143,130 79,488 86,883 910,723 Total First-Time Fresh Enroll. 10.8% 6.0% 6.6% 68.7%
76,395 4,334 12,520 5,118 45,614 Most Comp. (64) 5.7% 16.4% 6.7% 59.7%
119,250 6,777 10,089 7,083 87,001 Highly Comp. (95) 5.7% 8.5% 5.9% 73.0%
275,170 15,871 21,348 15,376 205,454 Very Comp. (241) 5.8% 7.8% 5.6% 74.7%
488,975 52,599 22,181 29,645 353,045 Competitive (579) 10.8% 4.5% 6.1% 72.2%
169,340 36,333 6,799 13,244 100,193 Less Comp. (287) 21.5% 4.0% 7.8% 59.2%
56,617 11,159 1,435 4,220 35,289 Non-Comp. Yr. (96) 19.7% 2.5% 7.5% 62.3% Specialized Admission (76)
10,706 1,043 803 637 6,153
9.7% 7.5% 5.9% 57.5% Note: These data represent student enrollment at institutions ranked by Barron’s Profile of American
Colleges 2004 (25th Edition) with 2002 IPEDS enrollment data. Includes only Title IV institutions.

First-Time Full-Time Freshmen Attending Four-Year Colleges and Universities (N=1,438) By Selectivity: 2002
Total African American
Asian American
Hispanic White
26,541,000 14.4% 3.9% 14.9% 65.9% U.S. Pop. Ages 18-24 (2000)
1,326,299 10.8% 6.0% 6.6% 68.7% Total First-Time Fresh Enroll.
76,395 5.7% 16.4% 6.7% 59.7% Most Comp. (64)
119,250 5.7% 8.5% 5.9% 73.0% Highly Comp. (95)
275,170 5.8% 7.8% 5.6% 74.7% Very Comp. (241)
488,975 10.8% 4.5% 6.1% 72.2% Competitive (579)
169,340 21.5% 4.0% 7.8% 59.2% Less Comp. (287)
56,617 19.7% 2.5% 7.5% 62.3% Non-Comp. Yr. (96) Specialized Admission (76)
10,706 9.7% 7.5% 5.9% 57.5%
Note: These data represent student enrollment at institutions ranked by Barron’s Profile of American Colleges 2004 (25th Edition) with 2002 IPEDS enrollment data. Includes only Title IV institutions.

Barron’s Selectivity
Admissions Competitiveness High School Rank
High School GPA
(recentered) SAT 1 ACT
10 = Most Comp Top 10% to 20% A to B+ 655 to 800 29 and above
9 = Highly Comp+ Top 20% to 35% B+ to B 645 and above 28 and above
8 = Highly Comp Top 20% to 35% B+ to B 620 to 654 27 or 28
7 = Very Comp+ Top 35% to 50% No less than B- 610 and above 26 and above
6 = Very Comp Top 35% to 50% No less than B- 573 to 619 24 to 26
5 = Competitive+ Top 50% to 65% B- or better 563 and above 24 and above
4 = Competitive Top 50% to 65% Min. of C+ or C 500 to 572 21 to 23
3 = Less Comp Top 65% C or below Below 500 Below 21
2 = Non Comp 4 yr
1 = 2 yr college
Evidence of high school graduation
Median Freshman Test Scores
Barron's Profile of American Colleges 1997 Edition

NCAA Six-Year Graduation Rates
0%10%20%30%40%50%60%70%80%90%
100%
Bryn M
awr
Cornel
l
Lehig
h
Mac
ales
ter
Northwes
tern
Oberlin
Prince
ton
Rice
Smith
Swarth
more
Afri. Amer. Asian/PI Hispanic White OverallSource: http:/www.ncaa.org/grad_rates/2002

NCAA Six-Year Graduation Rates
0%
10%
20%
30%
40%
50%
60%
70%
80%
90%
100%
Tulane
Berke
ley
UCLA
Mic
higan
UNC - CH
UPENN
Vande
rbilt
Wel
lesl
ey
Wes
leya
n
Will
iam
s
Afri. Amer. Asian/PI Hispanic White OverallSource: http:/www.ncaa.org/grad_rates/2002

Persister, Transfer, Stopout Status by Race/Ethnicity
89%
6% 6%
94%
4% 2%
90%
8%3%
92%
6% 2%
92%
6%3%0%
20%
40%
60%
80%
100%
Afr. Am. Asian Am. Hisp./Latino White Total
Persister Transfer Stopout
Source: Nettles & Millett The High Achieving College Student Persistence Study

Change in Institutional Selectivity for Transfer Students
94%
65%
81%
72%
6%
19%
10%15%
0%
13%
5%12%
0% 3%5%
1%0%
10%
20%
30%
40%
50%
60%
70%
80%
90%
100%
Less selective Equally selective More selective Special Programs
Afr. Am. Asian Am. Hisp. White

SOCCER Surveys – 6 Surveys• Persistence 1999 Survey of College Choices, Experiences, and
Retention (SOCCER) 28 pages
• Stopout 1999 Survey of College Choices, Experiences, and Retention (SOCCER) 28 pages
• Freshman 2000 Survey of College Choices, Experiences, and Retention (SOCCER) 20 pages
• Persistence 2001 Survey of College Choices, Experiences, and Retention (SOCCER) 28 pages
• Stopout 2001 Survey of College Choices, Experiences, and Retention (SOCCER) 28 pages
• Graduate 2001 Survey of College Choices, Experiences, and Retention (SOCCER) 28 pages
Institutional Requests for Data – Sample selection file and institutional request for admissions, academic performance and financial aid data.
•Catherine M. Millett:
•Get an institutional request letter for Michael
•Catherine M. Millett:
•Get an institutional request letter for Michael

Importance of Reasons for Enrolling at Transfer Institution
19%
67%
52%
36%40%
39%
20% 18% 18% 15%
8%
23% 20% 22%
14% 6%
22% 21% 21% 19%
0%
10%
20%
30%
40%
50%
60%
70%
80%
Better social fit Betteracademic fit
Closer to home Cost moresuitable
Field of studynot available
Not Important Somewhat Important Important Extremely Important

First-time, Full-Time Freshman at C/U #1
First-time, Full-TimeFreshman at C/U #1
First-time, Full-TimeFreshman at C/U #1
First-time, Full-TimeFreshman atC/U #1
Stopout of C/U #1
Leave C/U #1
LeaveC/U #1
Graduate from C/U #1
Graduate from C/U #1
Graduate from C/U #2, which is more prestigious than C/U #1
Graduate from C/U #2, which is less prestigious than C/U #1
Do not re-enroll in higher education
Student’s Options
Graduate from C/U #2,which is equally as prestigious as C/U #1
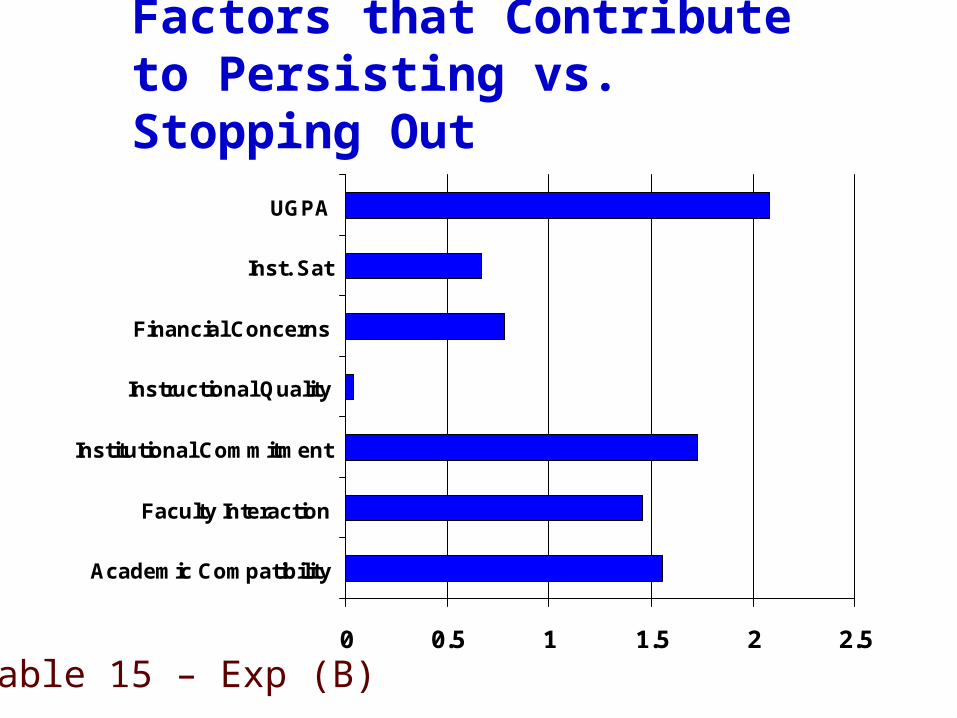
Factors that Contribute to Persisting vs. Stopping Out
0 0.5 1 1.5 2 2.5
Academic Compatibility
Faculty Interaction
Institutional Commitment
Instructional Quality
Financial Concerns
Inst. Sat
UGPA
Table 15 – Exp (B)

Factors that Contribute to Persisting vs. Stopping Out
-2 -1 0 1 2 3
Acad Compatiatibllity
Faculty Interaction
Institutional Commitment
Instructional Quality
Financial Concerns
Inst. Sat
UGPA
Table 15 – Using Inverse Odds

Table 1: Persistence Study Wave 1 Sample Disaggregated by Race/Ethnicity and Cohort (N=3,273)
Race/Ethnicity
Cohort
Total1996 1997 1998
African American
Count 75 57 104 236
% within Race/Ethnicity 31.8 24.2 44.1 100.0
% within Cohort 8.2 7.7 6.4 7.2
Asian American
Count 173 135 272 580
% within Race/Ethnicity 29.8 23.3 46.9 100.0
% within Cohort 18.9 18.1 16.8 17.7
Hispanic/Latino
Count 65 47 86 198
% within Race/Ethnicity 32.8 23.7 43.4 100.0
% within Cohort 7.1 6.3 5.3 6.0
European American
Count 601 505 1,154 2,260
% within Race/Ethnicity 26.6 22.3 51.1 100.0
% within Cohort 65.8 67.9 71.4 69.0
Total
Count 914 744 1,616 3,274
% within Race/Ethnicity 27.9 22.7 49.4 100.0
% within Cohort 100.0 100.0 100.0 100.0
Note: There is no statistical relationship between cohort and race (Pearson χ2 = 10.46, d.f. = 6, and p-value = 0.107).

Dependent Variable
Independent Variables
Standardized Test Scores
Family Education
Family Income
Race/ Ethnicity
GenderRace/Ethnicity*Gender
Academic Compatibility +++ +++ **
Academic Time Management - ++ *** *
College Belonging + +++ +++ ***
Experienced Discrimination --- +++ ***
Faculty Interaction -- +++ + *** *
Faculty Support +++ ++ **
Financial Concerns ++ --- --- *** ***
Institutional Commitment +++ + *
Institutional Satisfaction ++ + *** **
Instructional Quality +++ +++ *** * *
Racial Climate -- * *
Self Concept +++ *** ***
Social Compatibility --- +++ +++
Social Integration --- +++ ++ *** ***
Supportive Environment + +++ ** *
Undergraduate GPA +++ + -- *** *** ***
Table 10: Persistence Study, Multivariate Analysis of Covariance Statistical Significance Summary (N=3,273)

First-Time Full-Time Freshmen Attending Non Specialized 4-Yr C/U (N=1,395) By Selectivity: 1997
14%
4%
14%11%
6% 6%6%
13%
6%5%
12%
6%
0%
5%
10%
15%
20%
25%
Afri Am. Asian Hispanic
U.S. Pop. Ages 18-24 First-Time Fr
Most Comp. (52) Highly Comp. (90)
Note: Includes non-specialized institutions with a Barron’s rank and 1997 IPEDS enrollment data.
First-Time Full-Time Freshmen Attending Four-Year Colleges and Universities (N=1,438) By Selectivity: 2002
Total African American
Asian American
Hispanic White
26,541,000 14.4% 3.9% 14.9% 65.9% U.S. Pop. Ages 18-24 (2000)
1,326,299 10.8% 6.0% 6.6% 68.7% Total First-Time Fresh Enroll.
76,395 5.7% 16.4% 6.7% 59.7% Most Comp. (64)
119,250 5.7% 8.5% 5.9% 73.0% Highly Comp. (95)
275,170 5.8% 7.8% 5.6% 74.7% Very Comp. (241)
488,975 10.8% 4.5% 6.1% 72.2% Competitive (579)
169,340 21.5% 4.0% 7.8% 59.2% Less Comp. (287)
56,617 19.7% 2.5% 7.5% 62.3% Non-Comp. Yr. (96) Specialized Admission (76)
10,706 9.7% 7.5% 5.9% 57.5%
Note: These data represent student enrollment at institutions ranked by Barron’s Profile of American Colleges 2004 (25th Edition) with 2002 IPEDS enrollment data. Includes only Title IV institutions.


Fall 1999 Response Rates (N=24)
Institution Persisters Non-Persisters Total Bryn Mawr College 72% 79% 74% Cornell University 58% 31% 49% Lehigh University 46% 25% 41% Northwestern 55% 42% 51% Macalester College 70% 55% 65% Oberlin College 48% 52% 49% Rice University 65% 46% 60% Tulane University 45% 42% 44% Univ. of CA at Los Angeles 33% 21% 28% Univ of Michigan 61% 36% 51% Univ. of N. Carolina, CH 51% 43% 48% Univ. of Pennsylvania 44% 47% 45% Wellesley College 71% 65% 69% Wesleyan Univ. 42% 40% 41% Williams College 66% 47% 62% Total 52% 38% 47%
•Catherine M. Millett:
•Need to do for all 24 institutions all 4 years
•Catherine M. Millett:
•Need to do for all 24 institutions all 4 years

Methods of Analysis
• Quantitative
– Factor Analysis
– Regressions
• Qualitative
– NVivo

Demographic and Background Characteristics Predicting UGPA
0.178
-0.06
-0.088
0.106
0.02
-0.04
-0.265
-0.4 -0.2 0 0.2 0.4
SAT
African American
Asian American
Hispanic
Female
Family Education
Family Income
Unstandardized co-efficient
Source: Nettles and Millett Survey of College Choices, Experiences and Retention

Demographic and Background Characteristics Do Not Predict Persisting vs. Stopping Out
1.078
1.312
-1.059
-1.832
1.455
1.101
1.288
-3 -2.5 -2 -1.5 -1 -0.5 0 0.5 1 1.5 2 2.5 3
SAT
Family Educ.
Family Income
Afr. Amer.
Asian Amer.
Hisp.
Female
Source: Nettles and Millett Survey of College Choices, Experiences and Retention
Note: Family education is the only significant predictor (p<.05)

Factors that Contribute to Transfer vs. Stopping Out
0 0.5 1 1.5 2 2.5
Academic TimeMgmt.
Faculty Interaction
InstitutionalCommitment
FinancialConcerns

Table 17: Factors that Contribute to Persisting vs. Stopping Out
0 0.5 1 1.5 2 2.5
U-GPA
Institutional Satisfaction
Financial Concerns
Institutional Commitment
Faculty Interaction
Academic Time Mgmt.
Academic Compability

Factors that Contribute to Transfer vs. Stopping Out
-3 -2 -1 0 1 2 3
Academic TimeMgmt.
Faculty Interaction
InstitutionalCommitment
FinancialConcerns

Predictors of Persisting vs. Transferring
1.556
1.210
-2.726
2.175
3.340
-1.046
-1.458
1.916
-4 -3 -2 -1 0 1 2 3 4
Acad Compatiatibllity
Academic Compatibility
Academic Time Management
Faculty Interaction
Institutional Commitment
Financial Concerns
Institutional Satisfaction
Undergraduate GPA
Source: Nettles and Millett Survey of College Choices, Experiences and Retention

Sampling continued
• Total Population – all students at selective colleges and universities – CMM add info on all 24 schools and all 4 years.
• Sampling frame – 24 participating institutions
• Sample = 2,906
– students from the 1996, 1997, 1998 entering cohorts from 15 institutions
– 24 Weighted Total 1996, 1997, 1998, 2000=
– 24 Unweighted Total 1996, 1997, 1998, 2000=
– 15 Weighted Total 1996, 1997, 1998 =
– 15 Unweighted Total 1996, 1997, 1998 =
•Catherine M. Millett:
•CMM needs to look up
•Catherine M. Millett:
•CMM needs to look up

Conceptual Model of Factors Related to Student Persistence
PersistStopoutTransfer
Background Characteristics:- Gender- Race- Family Income-Parents’ educ. (BA or BA+)
College Admissions:- SAT Scores- First Choice
College Academic:
- Grades in college
- Major
- Academic preparation
- Academic motivation
- Faculty interaction
- Instructional Quality
- Have an advisor
Educational Commitment:- Degree aspirations- Commitment to their C/U
- Social Integration
- Living on-campus
Perceived Discrimination:
- Aspiration Discouragement
- Campus experiences
Family influence:
- Family relations
- Family pressure
Self Concept - self worth
- Worry about paying for college
- Have educ. debt

Selecting Participants
• Registration status as of Fall 1999
• Student’s willingness to participate in student interview from 1999 survey
• Lived in or enrolled in a college or university in our geographical outreach area

Persistence StudyStates Where Interviews Were Conducted
AK
AL
ARAZ
CO
DC DE
FL
GA
HI
IA
ID
IN
KSKY
MD
MEMN
MO
MS
MTND
NE
NH
NM
NV
NY
OH
OK
OR
RI
SC
SD
TN
UT
VA
VT
WA
WI
WV
WY
CA
CT
IL
LA
MA
MI
NC
NJPA
TX
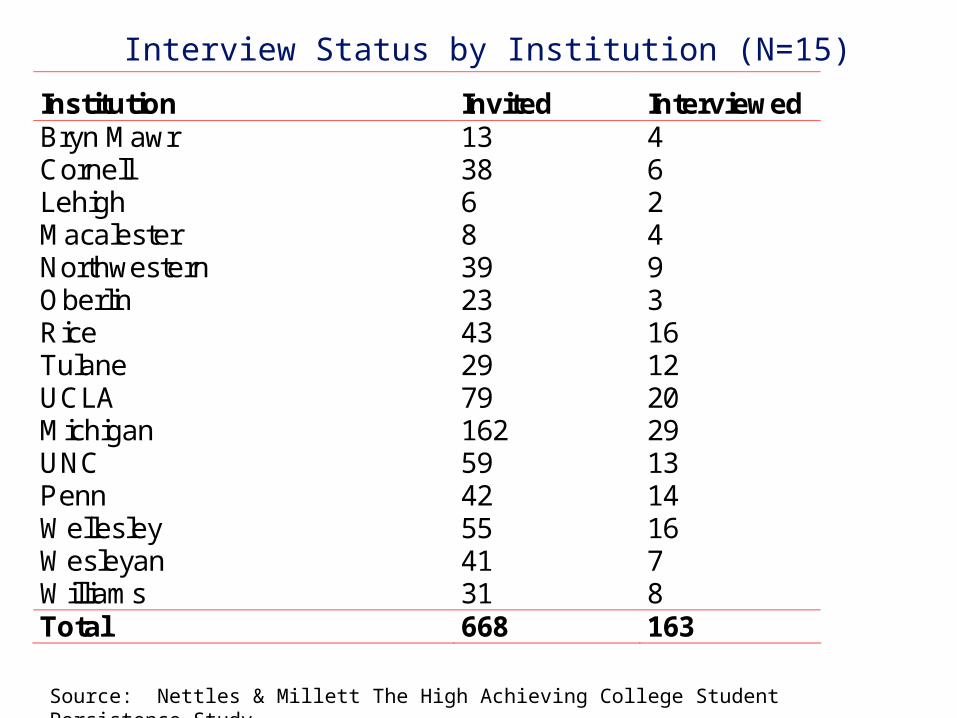
Interview Status by Institution (N=15)
Institution Invited Interviewed Bryn Mawr 13 4 Cornell 38 6 Lehigh 6 2 Macalester 8 4 Northwestern 39 9 Oberlin 23 3 Rice 43 16 Tulane 29 12 UCLA 79 20 Michigan 162 29 UNC 59 13 Penn 42 14 Wellesley 55 16 Wesleyan 41 7 Williams 31 8 Total 668 163
Source: Nettles & Millett The High Achieving College Student Persistence Study

Interviewee DataEnrollment Status by Freshman Term (N=163)
17
18
29
33
1511
45
405
101520253035404550
Persister Stopout Transfer
1996 1997 1998
Source: Nettles & Millett The High Achieving College Student Persistence Study
Note: CB_15 institutions only

Persister Interview Topics
• College admissions
• Academic experiences
– Grade motivation
– Challenging courses
– Faculty Support
• Significant college experiences
• Success in college
• Family involvement
• Enrollment challenges
• Support systems

Non-Persister Interview Topics
• College admissions
• Academic experiences– Grade motivation
– Faculty Support
• Significant college experiences
• Success in college
• Family involvement
• Support systems
• Factors that lead to non-enrollment
• Current activities

Respondent Data by Enrollment Status by Institution (N=15)
Institution Persister Non-Persister Total Bryn Mawr College 75 26 101 Cornell University 195 52 247 Lehigh University 93 13 106 Macalester College 84 36 120 Northwestern University 108 31 139 Oberlin College 134 50 184 Rice University 119 26 145 Tulane University 107 42 149 University of California at Los Angeles 202 89 291 University of Michigan 388 152 540 University of North Carolina at Chapel Hill
180 96 276 University of Pennsylvania 93 32 125 Wellesley College 170 71 241 Wesleyan University 82 29 111 Williams College 111 20 131 Total 2,141 765 2,906
Source: Nettles and Millett Survey of College Choices, Experiences and Retention
Note: for students in 1996, 1997 and 1998 entering cohorts

The Distribution of the Sample by Enrollment Year and Race/Ethnicity
32% 30% 33%27%24% 23% 24% 22%
44% 47%43%
51%
0%
10%
20%
30%
40%
50%
60%
70%
80%
90%
100%
Afr. Amer. Asian Hisp. White
1996 1997 1998Source: Nettles and Millett Survey of College Choices, Experiences and Retention
Note: Statistical difference between race/ethnicity and cohort

The Influence of Family Income on Persistence Does Not Vary by Race/Ethnicity
0102030405060708090
100
Low Middle High
Income
Per
sist
ence
Afr. Amer. Asian Hisp. WhiteSource: Nettles and Millett Survey of College Choices, Experiences and Retention

African American and Hispanic Students are Underrepresented in Top 158 Colleges & Universities
15%
4%
14%
7%6%
11%
7%
16%
6% 6%
9%
6%
0%
5%
10%
15%
20%
25%
African Amer. Asian Amer. Hispanic
U.S. Pop. Ages 18-24 (2000) Total First-Time, Full-Time at 4-yr.
Most Comp. (64) Highly Comp. (95)
Note: Selectivity is from the Barron’s Profiles of American Colleges, 2004 and enrollment data are from the IPEDS Fall 2002 enrollment survey. Institutions that received Title IV funds.