measuring social privilege attitudes using a situational judgment … · 2012-12-04 · the big...
TRANSCRIPT

Measuring Social Privilege Attitudes using a Situational Judgment Test:
Validation of the Diversity Engagement Test (DivET)
DEFENSE EQUAL OPPORTUNITY MANAGEMENT INSTITUTE
DIRECTORATE OF RESEARCH DEVELOPMENT AND STRATEGIC INITIATIVES
Dr. Richard Oliver Hope Human Relations Research Center
Directed by Dr. Daniel P. McDonald, Executive Director
366 Tuskegee Airmen Drive Patrick AFB, FL 32925
321-494-2747
Prepared by Neil M. A. Hauenstein
Virginia Tech Department of Psychology
July 28, 2012
Technical Report No. 18-12
Report Documentation Page Form ApprovedOMB No. 0704-0188
Public reporting burden for the collection of information is estimated to average 1 hour per response, including the time for reviewing instructions, searching existing data sources, gathering andmaintaining the data needed, and completing and reviewing the collection of information. Send comments regarding this burden estimate or any other aspect of this collection of information,including suggestions for reducing this burden, to Washington Headquarters Services, Directorate for Information Operations and Reports, 1215 Jefferson Davis Highway, Suite 1204, ArlingtonVA 22202-4302. Respondents should be aware that notwithstanding any other provision of law, no person shall be subject to a penalty for failing to comply with a collection of information if itdoes not display a currently valid OMB control number.
1. REPORT DATE 28 JUL 2012 2. REPORT TYPE
3. DATES COVERED 00-00-2012 to 00-00-2012
4. TITLE AND SUBTITLE Measuring Social Privilege Attitudes using a Situational Judgment Test:Validation of the Diversity Engagement Test (DivET)
5a. CONTRACT NUMBER
5b. GRANT NUMBER
5c. PROGRAM ELEMENT NUMBER
6. AUTHOR(S) 5d. PROJECT NUMBER
5e. TASK NUMBER
5f. WORK UNIT NUMBER
7. PERFORMING ORGANIZATION NAME(S) AND ADDRESS(ES) Virginia Tech Department of Psychology,Blacksburg,VA,24061
8. PERFORMING ORGANIZATIONREPORT NUMBER
9. SPONSORING/MONITORING AGENCY NAME(S) AND ADDRESS(ES) 10. SPONSOR/MONITOR’S ACRONYM(S)
11. SPONSOR/MONITOR’S REPORT NUMBER(S)
12. DISTRIBUTION/AVAILABILITY STATEMENT Approved for public release; distribution unlimited
13. SUPPLEMENTARY NOTES
14. ABSTRACT
15. SUBJECT TERMS
16. SECURITY CLASSIFICATION OF: 17. LIMITATION OF ABSTRACT Same as
Report (SAR)
18. NUMBEROF PAGES
41
19a. NAME OFRESPONSIBLE PERSON
a. REPORT unclassified
b. ABSTRACT unclassified
c. THIS PAGE unclassified
Standard Form 298 (Rev. 8-98) Prescribed by ANSI Std Z39-18

Measuring Social Privilege, 2
Abstract
White privilege is a popular social inequality research topic. However, current attitudinal
questionnaires of White privilege are problematic given the definition of White privilege
presumes that the majority of Whites are unaware of their privileged status. The current study
proposes that situational judgment tests offer an alternative assessment strategy. The Diversity
Engagement Test (DivET) was based on the fact that rationalizations are ubiquitous when
defending social privilege, and the argument reactions to White privilege rationalizations are
better indicators of attitudes about White privilege. The DivET was administered to both a
student sample and a military sample, and initial results suggested DivET scores generated
acceptable evidence of reliability and validity, including internal structure, convergent validity,
divergent validity, and criterion-related validity.
The findings in this report are not to be construed as an official DEOMI, U.S. military services,
or Department of Defense position, unless designated by other authorized documents.
Measuring Social Privilege, 3
Measuring Social Privilege Attitudes using a Situational Judgment Test: Validation of the
Diversity Engagement Test (DivET)
Research on social inequality has evolved from the study of strong negative stereotypes
and overt discriminatory acts to more subtle and nuanced aspects of prejudice and
discrimination. In particular, the issue of social privilege has emerged as a central theme in
research on social inequality. Social privileges are unearned advantages based on social group
membership that simultaneously disadvantage members outside that social group; furthermore,
members of dominant social groups typically are unaware of their social privileges, whereas
members of non-dominant social groups typically are sensitized to the disadvantages of social
privilege (Black & Stone, 2005). Although social privilege refers to the advantages afforded any
dominant social group, most social privilege research focuses on White privilege.
A social privilege research theme has been the development of traditionally designed
White privilege attitude scales. For example, Spanierman and Heppner (2004) developed the
Psychosocial Costs of Racism to Whites Scale (PCRW) that was found to measure White
empathetic reactions toward racism, White guilt, and White fear of others. Recently, Sifford, Ng,
and Wang (2009) replicated the three-factor structure of the PCRW. More recently, Pinterits,
Poteat, & Spanierman (2009) developed the White Privilege Attitudes Scale (WPAS) that was
found to measure willingness to confront White privilege, anticipated costs of addressing White
privilege, White privilege awareness, and White privilege remorse. Although ample construct
validity is provided for such White privilege attitude scales, there is a conundrum about
measuring White privilege that is not adequately addressed in this research. A key aspect of the
nature of social privilege is that members of dominant social groups do not recognize the
systemic nature of afforded privileges; rather, the benefits of social privilege are the norm.
Measuring Social Privilege, 4
This raises a fundamental issue of the trustworthiness of resultant validity evidence given
that attitudes about White privilege likely did not exist prior to individuals being asked about
White privilege. For example, using the WPAS dimensions, how does a White individual feel
remorse about White privilege when he/she was likely unaware of White privilege prior to
answering the survey? Feldman and Lynch (1988) coined the term “self-generated validity” to
describe situations in which attitudes are spontaneously generated as a function of questions that
the respondent has never considered:
A serious question is whether each construct exists (or is spontaneously
generated) in any form in the absence of the researcher’s query. If not, the
act of measurement changes the phenomenon under study, producing the
thought processes predicted by the theory being tested and quite possibly
influencing behavior (p. 422).
When respondents can’t access existing attitudes, responses to early questions in an attitude
survey become the basis for answering later questions in the survey, thereby creating spurious
evidence of both construct validity and criterion-related validity. The reality is that the self-
generated validity problem is a matter of degrees. Even if the cognitive, affective, and behavioral
components of an attitude exist in a respondent’s memory, his/her responses to survey items are
also affected by context (Woehr & Feldman, 1993). However, assessing White privilege is the
worst case scenario for self-generated validity because, by definition, members of dominant
social groups are typically unaware of social privilege.
The current study attempts to overcome this inherent limitation of attitudinal measures of
White privilege by utilizing a situational judgment test strategy. Situational judgment tests

Measuring Social Privilege, 5
(SJTs) are scenario-based assessments designed to simulate judgment processes and behavioral
intentions. Traditionally, each scenario describes a situation; a question at the end of the scenario
(e.g., “How would you handle this situation?”) prompts the respondent to choose the best
response from a set of alternative actions or to rate the effectiveness of each alternative action.
SJTs are common in the context of selecting employees. SJTs have been found to be consistently
reliable and valid predictors of job performance (Lievens, Peeters, & Schollaert, 2008).
In essence, the SJT measurement strategy is opposite the traditional attitudinal scale
measurement strategy. Traditional attitudinal scales are intended to measure existing cognitions,
affective reactions, and behavioral tendencies independent of the assessment context. In contrast,
the SJT strategy presumes that all responses are context dependent (as created by the situation),
but that consistencies can be detected by examining responses across different contexts. For
example, Motowidlo, Hooper, and Jackson (2006) measured implicit trait policies modeled after
the Big Five using SJTs. In Motowidlo et. al.’s measure, each scenario was followed by response
options designed to measure Big Five traits (e.g., agreeableness). The proposed advantage of the
SJT measure of personality was that it is more resistant to faking than the traditional self-report
approach. In the current study, a social privilege SJT called the Diversity Engagement Test
(DivET) was developed along the lines of similar logic used by Motowidlo et. al.
DivET Scale Development
The DivET was specifically designed for use in research related to training military Equal
Opportunity Advisors (EOAs). EOAs inform and counsel unit commanders and Service
members regarding issues of equal opportunity and diversity awareness. This position exists in
all five branches of the U.S. Armed Forces. EOA training is conducted at the Defense Equal
Opportunity Management Institute (DEOMI), located on Patrick Air Force Base in Cocoa Beach,
Measuring Social Privilege, 6
Florida. The current EOA training program is 12 weeks long. Three-quarters of the training
curriculum covers equal opportunity and diversity awareness, and utilizes lectures, talks by
outside speakers, videos, and small-group experiential learning exercises. During the final
quarter of training, EOA trainees are segregated by their military branch affiliation, and policies
and procedures unique to their respective branches are covered. Upon completion of training,
EOAs return to their units stationed around the world.
In the DivET, overarching scenarios were used to reflect situations that potentially evoke
racial tensions. Each overarching scenario was written from the perspective of the SJT
respondent interacting with an individual reacting in a racially insensitive manner. Each SJT item
stem was based on rationalizations commonly used to justify White privilege, for example,
rationalizations for a colorblind world, reverse racism against Whites, etc. Defensive
rationalizations among Whites are ubiquitous in the process of justifying White privilege
(Pinterits et. al., 2009). For each SJT item (i.e., rationalization), four possible responses were
provided the respondent, and the respondent was asked to rate the likelihood that he/she would
respond in a manner similar to that conveyed by each response item.
The four overarching DivET scenarios were labeled “Equal Opportunity” (a person’s
description of a minority being promoted over him), “Minority Admission” (a person’s
description of a Hispanic person being admitted to a university with a minority scholarship),
“Hip-Hop Party” (a person’s description of staging a party with a racially insensitive Hip-Hop
theme), and “Drive-by Shooting” (a person’s reaction to a news report of Black-on-Black
violence). Due to time restrictions for survey administration with EOAs, seven SJT item stems
were created for each overarching scenario, for a total of 28 SJT items. Each SJT item was
accompanied by four potential responses. The respondent was asked to rate the likelihood that

Measuring Social Privilege, 7
he/she would make a similar response to each of the four provided options (i.e., each respondent
provided 112 ratings) using a 5-point Likert scale (1 = “Almost Certainly Not” to 5 = “Almost
Certainly”).
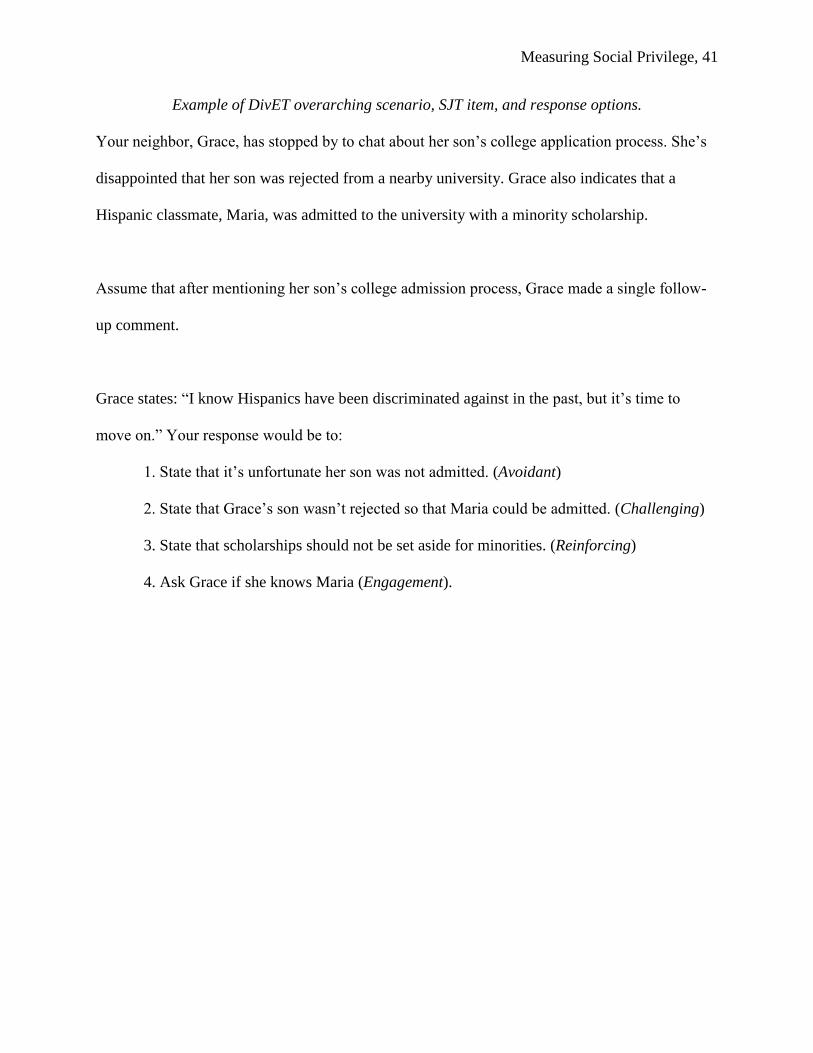
Figure 1 exemplifies the structure of the DivET SJT. The overarching scenario concerns
minority scholarships where a mother (Grace) is complaining that her son was denied admission
to a university, whereas a Hispanic female from the community was admitted with a minority
scholarship. In the SJT item stem, Grace rationalizes that discrimination is in the past and it is
“time to move on.” The respondent is provided four possible responses to the rationalization and
rates the likelihood he/she would respond in a manner similar to each of the four response
options. Each response option was designed to reflect three different manners of responding. The
first category, social justice response, was based on the assumption that individuals with social
justice awareness and sensitivity would attempt to dissuade the person uttering the rationalization
of its validity. This social justice category was split into two subcategories. Responses in the first
social justice subcategory were designed to reflect aggressive challenges to validity of the
rationalization, in the example item, the challenging response: “State that Grace’s son wasn’t
rejected so that Maria could be admitted.” Responses in the second subcategory were designed to
reflect constructive engagement of the source that leads the source to question the validity of the
rationalization, in the example item, the engaging response: “Ask Grace if she knows Maria.”
The second category, avoidant, was based on the fact that individuals often simply avoid
responding to manifestations of social privilege, in the example item, the avoidant response:
“State that it’s unfortunate her son was not admitted.” Avoidant responses are a de-facto strategy
for maintaining social privilege (i.e., the failure to address social privilege allows for the
continued advantages). Finally, the third, micro-aggression category was predicated on the
Measuring Social Privilege, 8
assumption of privileged individuals supporting the rationalization of White privilege, in the
example item, the reinforcing response: “State that scholarships should not be set aside for
minorities.”
Due to logistics, there was no pilot study of the response options prior to the
administration of the DivET to the first sample of EOAs. A pilot study was conducted after the
first DivET administration whereby eight graduate students in industrial-organizational
psychology were asked to allocate each response option for each SJT item to the response option
dimensions. For each graduate student, incorrect allocations of response options were collapsed
into one category, and Cohen’s kappa agreement statistic was computed for each response
dimension. Agreement for Avoidant (kappa = .88) and Reinforcing (kappa = .96) were strong,
but agreement for the Challenging (kappa = .64) and Engagement (kappa = .58) were much
weaker. Closer examination indicated that the graduate student raters could not reliably agree on
the identification of Challenging and Engagement responses. However, because the DivET had
already been administered to the first cohort of EOAs prior to the graduate student pilot study, it
was decided not to modify the DivET based on these agreement findings.
To summarize, the four response options for each SJT item were designed to measure
two positive dimensions of addressing social privilege, Challenging and Engagement, and two
negative dimensions of failing to address social privilege, Avoidant and Reinforcing. A key
advantage of the DivET is the amelioration of self-generated validity concerns. The DivET does
not elicit direct assessments of White privilege; rather respondents are simply asked the
likelihood of responding to rationalizations of social privilege in a certain manner. A secondary
advantage of the DivET is that administration is not limited to only White respondents.
Attitudinal measures of White privilege only make sense to White respondents; for example,

Measuring Social Privilege, 9
“I’m glad to explore my White Privilege” is an item on the WPAS. However, non-Whites are
often confronted with contexts in which social privilege rationalizations are proffered as
explanations of differential distribution of resources, and the DivET allows minority group
members to indicate their behavioral tendencies in such contexts.
Due to time required to collect data from a large sample of EOAs, data were also
collected from a large student sample. Internal structure and convergent validity of the DivET
were examined using the student sample. Divergent validity and criterion-related validity were
evaluated using the EOA sample. The research also afforded the opportunity to examine an
important issue in scoring SJTs. When SJTs require each subject to rate all response options, the
response style of the individual becomes a major issue. Individuals tend to endorse response
options in a systematic manner that can be unique to an individual or unique to a subset of
individuals in the sample. These differences are often characterized as differences in elevation,
as reflected by an individual’s mean rating across all items, and individual differences in scatter,
as reflected by an individual’s standard deviation across all ratings. These variations in response
tendencies can produce undesirable psychometric problems. Most notably for the DivET, due to
bias attributable to elevation and scatter, it is likely that the raw ratings of positive dimensions of
rectifying social privilege will be positively correlated with negative dimensions of not rectifying
social privilege. Such positive correlations between positive and negative dimensions do not
make sense. Rather, ratings of Challenging or Engaging social privilege should be negatively
related to ratings of Avoidant and Reinforcing ratings of social privilege.
Recently, McDaniel, Psotka, Legree, Yost, and Weekly (2011) have recommended that
SJT be scored by standardizing responses within subject. The conversion to standard scores (z-
scores) within subjects eliminates all between-person variation in terms of elevation and scatter.
Measuring Social Privilege, 10
That is, all individuals have the same mean overall rating of zero and the same overall rating
standard deviation of one. McDaniel et al. provided evidence that standardizing within subjects
increases the validity of SJT items. However, it should be recognized that standardizing within
subjects is a debatable practice. By definition, standardizing within subjects presumes zero
percent of the between-subject differences in elevation and scatter is due to differences in the
strength of behavioral intentions; rather, standardizing within subjects presumes that 100 percent
of the between-person variance is attributable to response bias. As part of the psychometric
analyses, the validity of the DivET raw score ratings were compared to the validity of the within-
person standardized scores wherever possible.
Student Sample Methods
Participants
Participants were undergraduate students at a large mid-Atlantic state university, and 382
participants completed the DivET survey. The breakdown on self-identified race was 308
Whites, 37 Asians, 11 Blacks, 12 Hispanics, 8 other, and 6 multiracial. There were 276 female
and 106 male participants. Each subject received extra course credit for completing the survey.
Procedure
Subjects signed up for participation using an online research management protocol, and
they were directed to the survey link. All IRB signatures, demographic data, and survey
responses were collected online. When completing the DivET, each overarching scenario was
presented along with the seven SJT items and four response options to each scenario. The next
overarching scenario and items were presented upon completion of the prior scenarios/items.
Measuring Social Privilege, 11
Upon completion of the DivET, White subjects were also asked to complete the WPAS. Most
subjects completed the entire survey within one hour, and all subjects were debriefed after
completion of the survey.
WPAS. The WPAS (Pinterits, et. al., 2009) is an 81-item survey using a 6-point Likert
scale in which subjects rate each statement from 1 (strongly agree) to 6 (strongly disagree). The
WPAS measures four social privilege constructs: willingness to confront White privilege
(confWP), anticipated costs of White privilege (costWP), White privilege awareness (awareWP),
and White privilege remorse (remorseWP). Only 12 WPAS total items were used in the current
study. For each White privilege scale, the three items with the highest factor loading were
included (Pinterits et. al., Table 1, p. 421). Furthermore, the number of agreement categories was
changed from six to five, i.e., 1 = strongly agree to 5 = strongly disagree. Internal consistency
reliabilities of these abbreviated scales were greater than .70 for all four scales. WPAS ratings
were also collected anonymously from the White participants. Higher WPAS scores reflected
greater endorsement of the underlying dimensions.
Student Sample Results
Exploratory Factor Analyses of DivET
Each of the 28 ratings for each of the four social privilege dimensions were factor
analyzed using maximum likelihood estimation with quartimax rotation. The initial solutions
clearly indicated problems with the items under the Hip-Hop scenario; responses to the Hip-Hop
scenario items were deleted, and exploratory factor analyses were repeated. Based on the
criterion of interpreting factors with eigenvalues greater than one, each factor analysis produced
multiple factors. This is not an unusual finding for SJTs (Lievens et al., 2008). For the
Challenging items, the general factor accounted for 31% of the common variance, and all 28
Measuring Social Privilege, 12
Challenging items had factor loadings greater than 0.30. The second and third extracted factors
for the Challenging dimension had eigenvalues greater than one; items from the drive-by
shooting scenario loaded weakly on the second factor, and no clear pattern emerged for the third
factor. For the Engagement dimension, the general factor accounted for 32% of the common
variance and 25 of the 28 Engagement items had factor loadings greater than 0.30. Three other
extracted factors had eigenvalues greater than one for Engagement scores; the second factor
weakly captured the EO scenario, and the third and fourth factors were driven by specific items.
There was weak evidence of an Avoidant dimension; the general factor accounted for only 20%
of the common variance, only 13 of the 28 items had factor loadings greater than .30, and seven
other extracted factors had eigenvalues greater than one. One additional factor weakly reflected
the drive-by shooting scenario, but the other additional factors were each driven by one or two
items. Finally, the Reinforcing dimension accounted for 30% of the common variance, and all 28
items had factor loadings greater than 0.30 for the first factor. Three other factors had
eigenvalues greater than one for Reinforcing scores; the second factor weakly captured the
college admission scenario, and the third and fourth factors were driven by specific items.
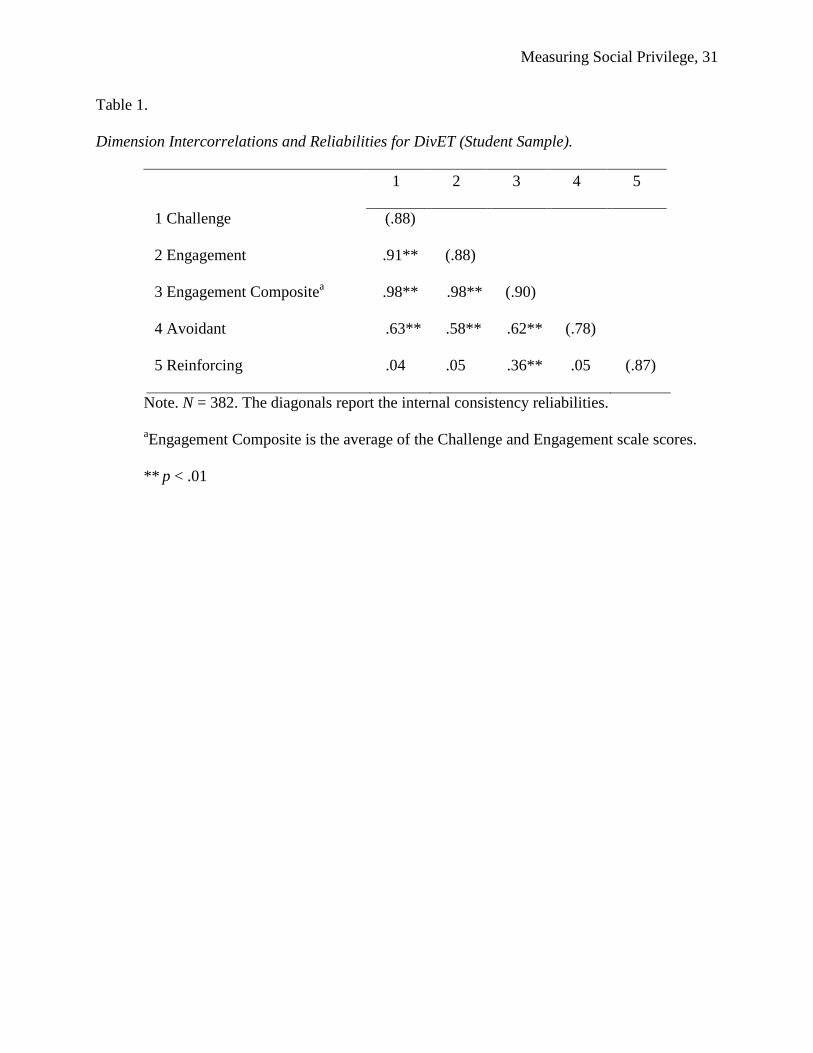
DivET Reliabilities and Intercorrelations
Missing data on the DivET resulted in a reduction in sample data from N = 445 to N =
382, as described in Table 1, and Table 1 presents the reliabilities and intercorrelations for the
DivET scales. Cronbach’s alpha was acceptable for all four DivET dimensions. The Challenge
and Engagement dimensions were strongly correlated (r = 0.91), indicating that respondents did
not differentiate between the two dimensions. This finding was not surprising given that graduate
student raters in the pilot study could not reliably distinguish between Challenge and
Engagement items. Therefore, a new variable was created based on the composite of the ratings

Measuring Social Privilege, 13
for the Challenge and Engagement dimensions, and it was given the label of “Engagement
Composite.” The reliability of the Engagement Composite scores, along with the correlations
among the Engagement Composite scores, Avoidant scores, and Reinforcing scores also appear
in Table 1. Avoidant scores were correlated with both the Engagement Composite scores (r =
0.62) and Reinforcing scores (r = 0.36). Finally, Reinforcing scores were independent of the
Engagement Composite scores (r = 0.05).
Within Subjects Scoring
The DivET scores were also standardized within subjects to control for individual
differences in elevation and scatter. The correlations between DivET raw scores and DivET z-
scores were Engagement Composite r = 0.72, Avoidant r = 0.35, Reinforcing r = 0.69. The
intercorrelations among the three standardized DivET scales were Engagement Composite-
Avoidant r = -0.48, Engagement Composite-Reinforcing r = -0.87, and Avoidant-Reinforcing r =
-0.02.
Race Differences
Due to profound sample size differences for racial subgroups, the 90% confidence
intervals were explored among only White, Black, Hispanic, and Asian respondents. For
Engagement Composite raw scores and z-scores, the confidence interval for White respondents
(Mraw = 3.17, Mz = 0.12) did not overlap with the confidence interval for Black respondents (Mraw
= 3.74, Mz = 0.28). For Avoidant z-scores, the confidence interval for White respondents (M =
.26) did not overlap with the confidence interval of either Black respondents (M = .05) or
Hispanic respondents (M = .09).
DivET Convergent Validity
Using only the White respondent sample, the DivET’s convergent validity was examined
Measuring Social Privilege, 14
using the WPAS. Table 2 presents correlations between the DivET scores, both raw scores and z-
scores, and the WPAS dimensions. The correlations for costWP were unusual in that all raw
scale correlations were positive and significant, but none of the corresponding z-score
correlations were significant. The relationships between Engagement Composite scores and
WPAS scores did not meaningfully change as a function of using z-scores, except the correlation
with costWP was not significant. The Avoidant dimension correlations were all affected by
scoring strategy. Raw Avoidant scores were positively correlated with costWP (r = 0.20),
awareWP (r = 0.15), and remorseWP (r = 0.16), but Avoidant z-scores were negatively
correlated with confWP (r = -0.19) and remorseWP (r = -0.25). Finally, all the Reinforcing
dimension correlations also were affected by scoring strategy. Raw Reinforcing scores were
positively related to costWP (r = 0.20), but negatively related to awareWP (r = -0.11). In
contrast, Reinforcing z-scores were negatively related to confWP (r = -0.22), awareWP (r = -
0.34), and remorseWP (r = -0.26).
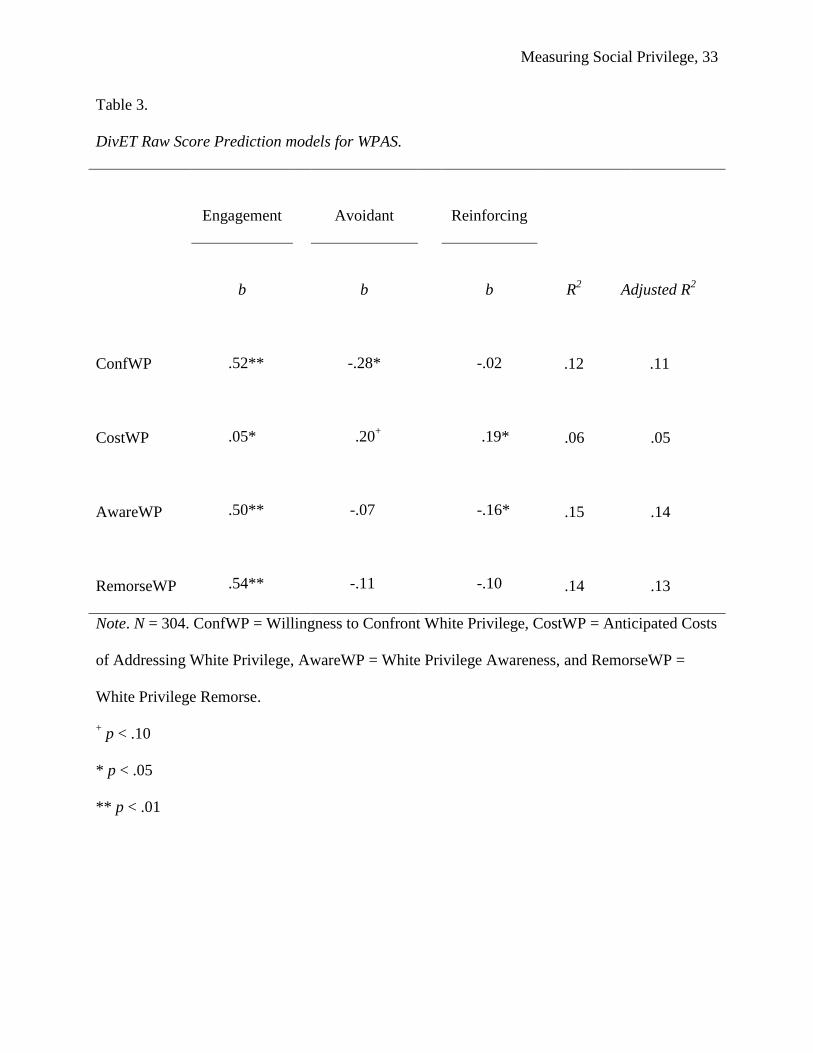
Regression analyses were used to further examine these relationships. The four raw scale
scores for DivET scores were regressed on each WPAS dimension (see Table 3). For
Engagement Composite raw scores, regression weights were significant for confWP, awareWP,
and remorseWP. For Avoidant raw scores, the regression weight for confWP was negative, and
the regression weight was positive and approached significance for costWP. Finally, for
Reinforcing scores, the regression weight was positive for costWP, and the regression weight
was negative for awareWP.
One of the limitations of standardizing scores within subjects is that z-scores for the three
DivET dimensions are linearly dependent. As such, only two of the three standardized DivET
scores could be simultaneously regressed on to WPAS scores. Given the strong negative

Measuring Social Privilege, 15
correlation between Engagement Composite z-scores and Reinforcing z-scores, two sets of
regression analyses were conducted. In the first set of models, WPAS scores were regressed on
Engagement Composite z-scores and Avoidant z-scores. In the second set of models, WPAS
scores were regressed onto Avoidant z-scores and Reinforcing z-scores. Due to the linear
dependencies, the total amount of variance accounted for in each WPAS dimension was equal
across the two sets of regression analyses. Table 4 presents the results of these two sets of
regression analyses.
In the first set of models, none of the regression weights for Avoidant z-scores were
significant. Similar to the raw scale score results, the Engagement Composite z-scores were
significant predictors of confWP, awareWP, and remorseWP. In the second set of analyses, the
Avoidant z-score regression weights were significant for confWP, awareWP, and remorseWP.
The Reinforcing regression weights were significant for confWP, awareWP, and remorseWP.
Finally, unlike the regression results for the raw scores, neither of the z-score regression models
accounted for significant variance in costWP.
Discussion of Student Sample
The initial psychometric evidence suggests that the situational judgment strategy is a
viable assessment strategy for responding to White privilege. Although scenario factors emerged
for each of the DivET dimensions, there was never more than one additional factor weakly
reflecting specific scenario ratings. Different scenarios emerged for different DivET dimensions,
and the amount of common variance accounted for by each scenario factor was relatively small.
Analysis of the internal structure of DivET raw scores indicated a dimension representing
reactions against defensive rationalizations justifying social privilege and reactions that support
rationalizations of social privilege. Although internal consistency reliability for the Avoidant
Measuring Social Privilege, 16
dimension was strong, an Avoidant factor was not reliably captured in the factor analyses.
Regardless of the DivET scoring strategy, there was convergent validity evidence for the
Engagement Composite and Reinforcing scores when predicting WPAS dimensions. In spite of
the weak factor analysis for an Avoidant dimension, Avoidant scores predicted WPAS scores,
especially when WPAS scores were regressed on Avoidant z-scores and Reinforcing z-scores.
Finally, the issue of standardizing DivET scores within subjects produced mixed results.
It was clear that the DivET z-scores produced a more logical pattern of intercorrelations among
DivET dimensions than DivET raw scores. The most salient example was the correlation
between Engagement Composite and Reinforcing scores. Logically, Engagement Composite
scores should be negatively related to Reinforcing scores. Using raw scale scores, the
Engagement Composite-Reinforcing r = 0.05, whereas, when using z-scores, r = -0.87. The lack
of a relationship for the raw scale scores reflects the elevation and scatter problems. Using z-
scores produced the expected negative correlation; in fact, the relationship between Engagement
Composite z-scores and Reinforcing z-scores was so strong as to suggest that Engagement and
Reinforcing are opposite poles on a single dimension of reactions to social privilege
rationalizations.
Although z-scores produced a logical pattern of relationships among the DivET
dimensions, the advantages of converting to z-scores was debatable. Generally speaking, a clear
disadvantage of using z-scores is that linear dependencies allow a maximum of n-1 dimensions
in any regression analysis. The n-1 limitation raises the issue of which dimension to exclude. The
answer was not straightforward, as evidenced by the results for the z-score regression analyses
(see Table 4). Excluding results for costWP scores, when WPAS scores were regressed onto
Engagement Composite and Avoidant z-scores, only regression weights for Engagement
Measuring Social Privilege, 17
Composite z-scores were significant. In contrast, when WPAS scores were regressed onto
Avoidant and Reinforcing z-scores, regression weights were significant for both DivET scales.
These differing z-score regression results were driven by the relationships between Avoidant z-
scores and the other two DivET dimensions; i.e., Avoidant z-scores were correlated with
Engagement Composite z-scores (r = -0.48), but independent of Reinforcing z-scores (r = -0.02).
In terms of results specific to the DivET, it is difficult to interpret the changes in sign of
the correlations between Avoidant z-scores/Reinforcing z-scores and WPAS dimensions as a
function of scoring strategy. Furthermore, the raw DivET scores predicted all four WPAS
dimensions, but the DivET z-scores only predicted three WPAS dimensions (z-scores did not
predict costWP). Finally the amount of variance DivET z-scores accounted for in WPAS scores
never exceeded the amount of variance that DivET raw scores accounted for in WPAS scores.
Obviously, the DivET z-scores with two predictors were disadvantaged in comparison to using
three DivET raw score predictors. Nonetheless, the argument for standardizing z-scores within
subject is that controlling for elevation and scatter meaningfully increases item validity, but this
advantage did not clearly manifest in the convergent validity analyses of the DivET.
In conclusion, there was strong evidence of the reliability and validity of two dimensions
emerging from the DivET: engaging against social privilege and reinforcing social privilege.
Although the strength of the Engagement Composite-Reinforcing z-score correlation suggested a
single dimension, other evidence does not support unidimensionality. Engagement Composite
scores were significantly related to Avoidant scores, but Reinforcing scores were not related to
Avoidant scores. Also, when predicting WPAS scores, the regression weights for Avoidant z-
scores were not significant when entered with Engagement Composite z-scores, but the
regression weights for Avoidant z-scores were significant when entered with Reinforcing z-
Measuring Social Privilege, 18
scores. Based on the factor analysis results, evidence for the existence of an Avoidant dimension
was weak. However, Avoidant scores predicted WPAS scales, especially when using Avoidant
z-scores paired with Reinforcing z-scores. Given the multifaceted nature of SJTs, it would be
premature to reject avoidance as a meaningful dimension of reactions to social privilege.
Finally, the evidence for the benefits of standardizing scores within subjects was
equivocal. Although the scale intercorrelations among DivET z-scores fit logical expectations,
the z-scores performed slightly worse than the raw scores when predicting WPAS dimensions.
Furthermore, the aforementioned changing signs of the correlations between Avoidant z-
scores/Reinforcing z-scores and WPAS dimensions are difficult to interpret because there are no
external criteria from which to judge whether the relationships are positive or negative.
The purpose of the second study was to examine the divergent and criterion-related
validity of DivET scores in an applied sample. Divergent validity of the DivET scores was
examined in relation to a general attitudinal measure of diversity and a measure of social
desirability responding. Criterion-related validity of DivET scores was assessed using both
cognitive and behavioral criteria used to evaluate military EOAs.
EOA Sample Methods
Participants
Participants were two cohorts of EOA trainees, the fall 2010 cohort and the Spring 2012
cohort. Forty-nine EOA trainees completed useable DivET data from the fall 2010 cohort. The
2010 sample consisted of 38 males and 11 females. Self-reports of race collapsed into the major
demographic groups were 23 African-Americans, 12 Whites, 8 Hispanic-Americans, 4 Asian-
Americans, and 2 others. Eighty-Five EOA trainees from the Spring 2012 cohort

Measuring Social Privilege, 19
completed useable DivET data. The sample consisted of 53 males and 32 females. Self-reports of
race were 31 African-Americans, 29 Whites, 15 Hispanic-Americans, four Asian-American, and
six other.
Procedure
The research directorate at DEOMI supervises all research involving EOAs. Surveys and
questionnaires from different studies are collected in each EOA class. EOA students are asked to
provide their student identification number when responding to any survey. However, students
are not required to provide their student identification number. Surveys routinely change from
cohort to cohort, and survey completion is broken down into different sessions for each cohort.
Participation in research is voluntary, frequently resulting in incomplete data in terms of different
surveys being completed. The other surveys accompanying the DivET were different in the two
cohorts. The analyses of the EOA sample primarily relied on data from the 2012 cohort because
the 2012 cohort was larger than the 2010 cohort, and the other measures collected from the 2012
cohort were more relevant to testing divergent validity and incremental validity than the other
measures collected in the 2010 cohort.
DivET. The mode of DivET administration changed between cohorts. The DivET was
administered as a paper-and-pencil survey in the 2010 cohort and as an online survey in the 2012
cohort. The online survey protocol was exactly the same protocol used with the 2010 student
sample. DivET scale scores were tested for mean differences and homogeneity of variance
between the two cohorts; cohort differences were absent, suggesting that mode of administration
did not affect DivET scores.
Measuring Social Privilege, 20
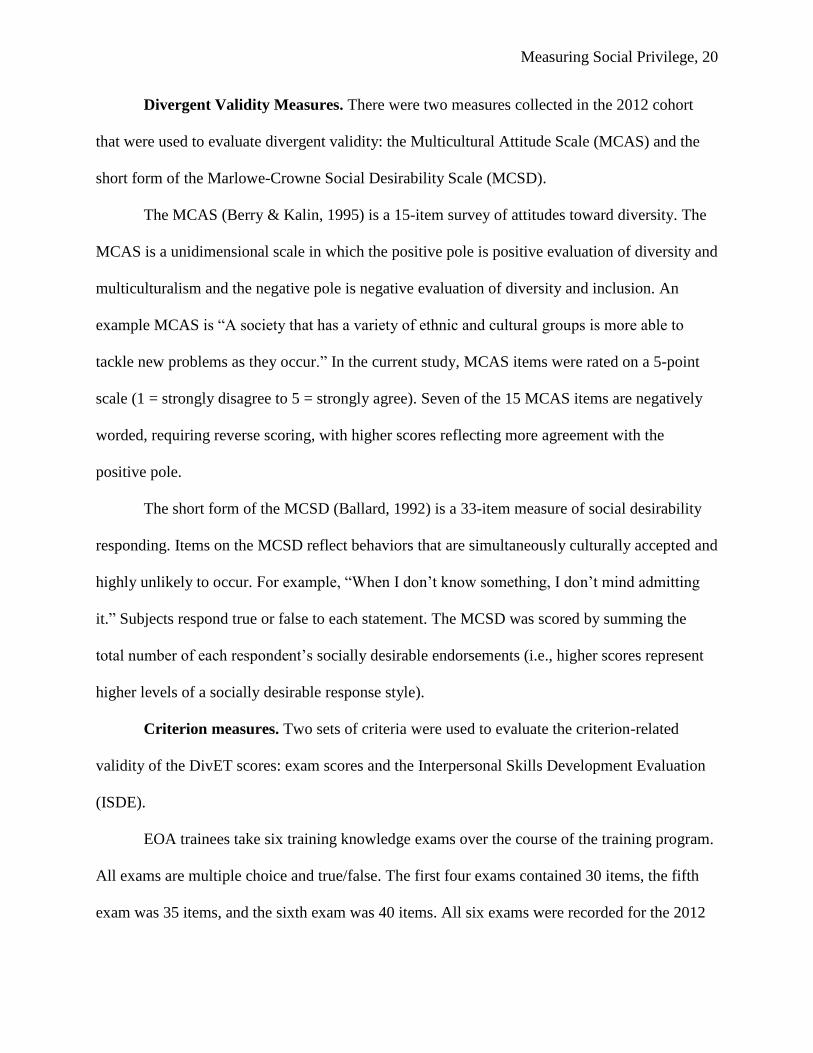
Divergent Validity Measures. There were two measures collected in the 2012 cohort
that were used to evaluate divergent validity: the Multicultural Attitude Scale (MCAS) and the
short form of the Marlowe-Crowne Social Desirability Scale (MCSD).
The MCAS (Berry & Kalin, 1995) is a 15-item survey of attitudes toward diversity. The
MCAS is a unidimensional scale in which the positive pole is positive evaluation of diversity and
multiculturalism and the negative pole is negative evaluation of diversity and inclusion. An
example MCAS is “A society that has a variety of ethnic and cultural groups is more able to
tackle new problems as they occur.” In the current study, MCAS items were rated on a 5-point
scale (1 = strongly disagree to 5 = strongly agree). Seven of the 15 MCAS items are negatively
worded, requiring reverse scoring, with higher scores reflecting more agreement with the
positive pole.
The short form of the MCSD (Ballard, 1992) is a 33-item measure of social desirability
responding. Items on the MCSD reflect behaviors that are simultaneously culturally accepted and
highly unlikely to occur. For example, “When I don’t know something, I don’t mind admitting
it.” Subjects respond true or false to each statement. The MCSD was scored by summing the
total number of each respondent’s socially desirable endorsements (i.e., higher scores represent
higher levels of a socially desirable response style).
Criterion measures. Two sets of criteria were used to evaluate the criterion-related
validity of the DivET scores: exam scores and the Interpersonal Skills Development Evaluation
(ISDE).
EOA trainees take six training knowledge exams over the course of the training program.
All exams are multiple choice and true/false. The first four exams contained 30 items, the fifth
exam was 35 items, and the sixth exam was 40 items. All six exams were recorded for the 2012

Measuring Social Privilege, 21
cohort, but only exam one scores were recorded for the 2010 cohort. Exams are not identical in
content across cohorts; rather, parallel forms of the exams are created by drawing items from a
large item pool. An exam score composite from the 2012 cohort was used as to evaluate
criterion-related validity of the DivET. For the 2012 cohort, the bivariate correlations among
exam scores ranged from 0.30 to 0.60, with a mean correlation of 0.48.
The ISDE (McGuire, 2012) is a DEOMI internal assessment designed to measure the
development of EOA interpersonal skills as related to dealing with diversity issues. Each EOA
trainee is assigned to a small group (typically eight to twelve trainees) with a facilitator; the
group remains intact over the first eight weeks of training. ISDE ratings are provided by the
group facilitator at two-week intervals. At each assessment point, the facilitator evaluates each
EOA trainee on five facets of interpersonal skills, communication processes, feedback skills,
self-centered functions (refers to withdrawal behaviors, disrupting the team, etc.), self-
awareness, and standards of conduct (refers to treating others with respect, use of inclusive
language, facilitating group morale, etc). For each assessment, evaluations of the five sub-facets
are used to form a composite score with a maximum score of one hundred. Initial examination of
the ISDE rating indicated that within group variance was frequently zero (i.e., all EOA trainees
received the same ISDE composite score at Time 1). Given this problem, the first set of ISDE
ratings were excluded. The analyzed ISDE ratings were labeled ISDE1 (ratings at time 2) to
ISDE3 (ratings at time 4).
Results for EOA Sample
The results for the student sample were used to guide DivET scoring for the EOA sample.
The ratings from the Hip-Hop scales were not used, and the Challenge and Engagement ratings
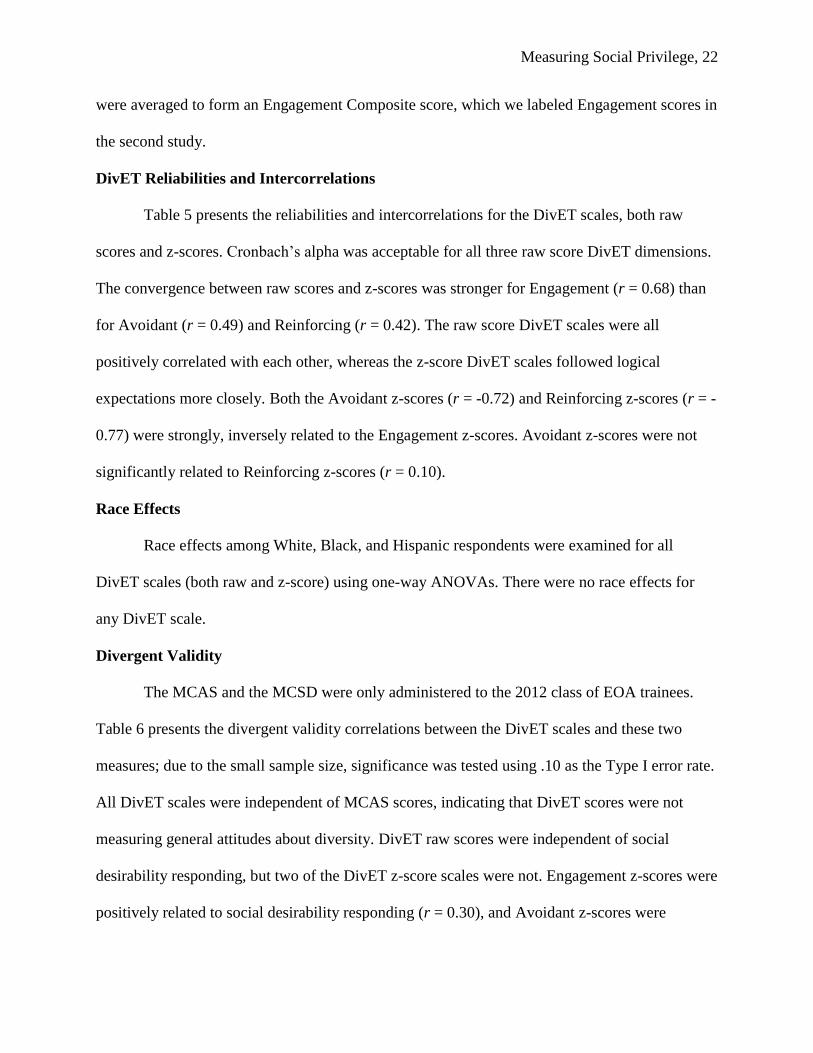
Measuring Social Privilege, 22
were averaged to form an Engagement Composite score, which we labeled Engagement scores in
the second study.
DivET Reliabilities and Intercorrelations
Table 5 presents the reliabilities and intercorrelations for the DivET scales, both raw
scores and z-scores. Cronbach’s alpha was acceptable for all three raw score DivET dimensions.
The convergence between raw scores and z-scores was stronger for Engagement (r = 0.68) than
for Avoidant (r = 0.49) and Reinforcing (r = 0.42). The raw score DivET scales were all
positively correlated with each other, whereas the z-score DivET scales followed logical
expectations more closely. Both the Avoidant z-scores (r = -0.72) and Reinforcing z-scores (r = -
0.77) were strongly, inversely related to the Engagement z-scores. Avoidant z-scores were not
significantly related to Reinforcing z-scores (r = 0.10).
Race Effects
Race effects among White, Black, and Hispanic respondents were examined for all
DivET scales (both raw and z-score) using one-way ANOVAs. There were no race effects for
any DivET scale.
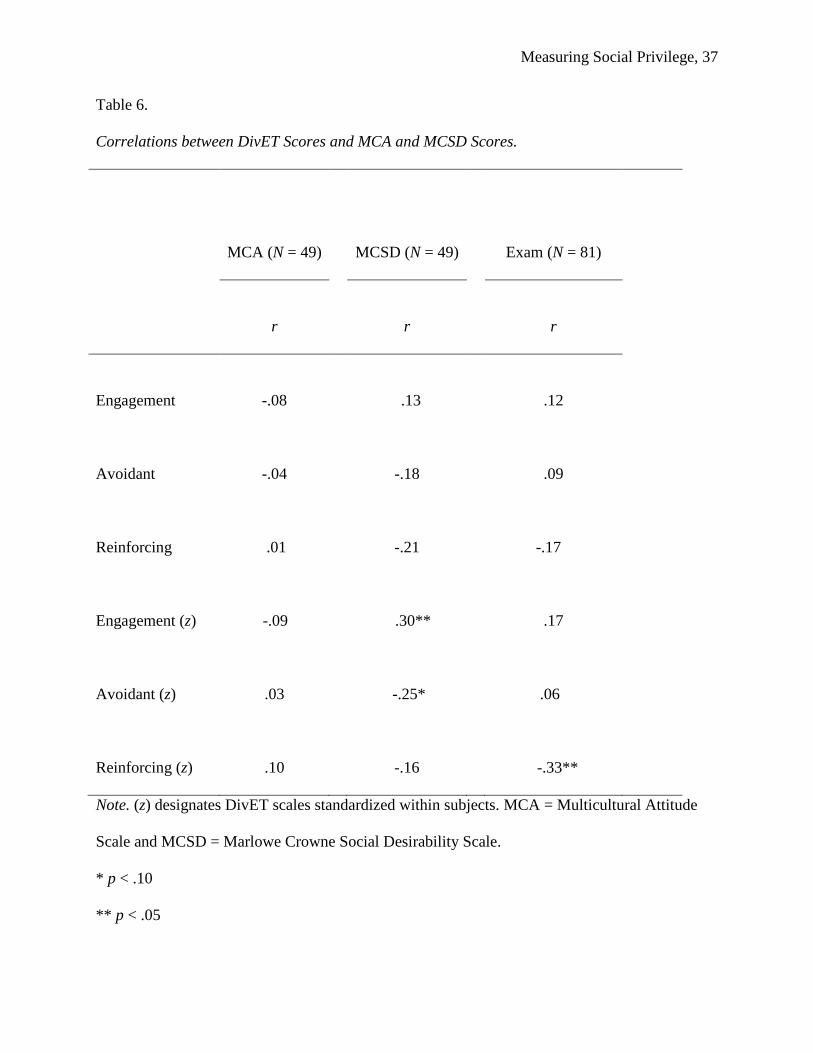
Divergent Validity
The MCAS and the MCSD were only administered to the 2012 class of EOA trainees.
Table 6 presents the divergent validity correlations between the DivET scales and these two
measures; due to the small sample size, significance was tested using .10 as the Type I error rate.
All DivET scales were independent of MCAS scores, indicating that DivET scores were not
measuring general attitudes about diversity. DivET raw scores were independent of social
desirability responding, but two of the DivET z-score scales were not. Engagement z-scores were
positively related to social desirability responding (r = 0.30), and Avoidant z-scores were

Measuring Social Privilege, 23
negatively related to social desirability responding (r = -0.25). Although the relationships were
significant for Engagement and Avoidant z-scores, the relatively small magnitude of the
relationships suggest social desirability responding was a minor concern.
Criterion-Related Validity
Exam Scores. Table 6 also includes the criterion-related validity coefficients between
DivET scores and the exam Composite scores. Reinforcing z-scores produced the only
significant bivariate validity coefficient, (r = -.33), with higher Reinforcing z-scores associated
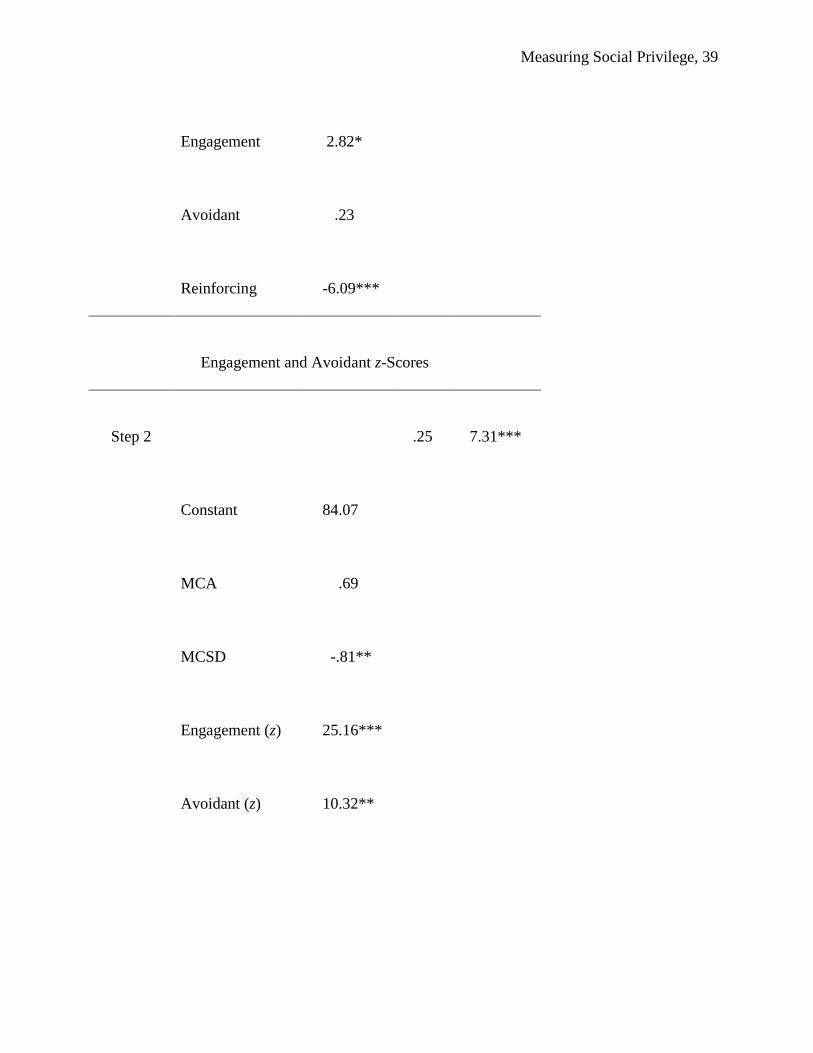
with lower exam scores. Three separate, stepwise regression analyses were conducted using
exam scores as the criterion (see Table 7). Due to the small sample size, .10 was set as the Type I
error rate. In all three analyses, MCA scores and MCSD were entered in the first step, and DivET
scores were entered in the second step. DivET raw scores were used in the first analysis, and
DivET z-scores were used in the second and third analyses. As with the student sample, two
models were used for the DivET z-scores; Engagement and Avoidant z-scores were used in the
second regression analysis, and Avoidant and Reinforcing z-scores were used in the third
regression analysis. Again, in both z-score regression analyses, the total variance accounted for
in exam scores is equal.
The first step in the regression models did not account for significant variance in exam
scores. In both the DivET raw score and z-score analyses, step two produced large amounts of
incremental variance, 20% for the raw score analysis and 25% for the z-score analyses.
Interestingly, the regression weights for MCSD scores were significant in both sets of analyses;
higher social desirability responding was associated with lower exam scores. The regression
weights for Engagement and Reinforcing raw scores were significant. In the z-score analyses,
when Engagement and Avoidant z-scores were entered at step two, both regression weights were

Measuring Social Privilege, 24
significant. When Avoidant and Reinforcing z-scores were entered at Step two, only the
Reinforcing regression weight was significant.
Finally, the extent to which the DivET scores predicted exam1 performance across both
cohorts was compared to the exam composite results. Again, MCA scores and Social Desirability
scores were not available for the 2011 class. For the DivET, the z-score results were identical to
the composite exam results. For the raw scores, the regression weights for Avoidant and
Reinforcing scores were significant when predicting first exam scores, in contrast to the exam
composite criterion, where the regression weights for Engagement and Reinforcing were
significant.
ISDE Scores. There were eight teams formed in the 2012 cohort. The DivET data
available from each team ranged from 7 to 13 team members. Unfortunately, fewer team
members completed the MCA and MCSD scales. Two teams were completely missing MCA and
MCSD scores, and six other teams had up to 50% fewer respondents on MCA and MCSD scores.
Therefore, it was decided to examine only the DivET scores in relation to the IDSE ratings using
random coefficient modeling (RCM). RCM analysis allows for the estimation of validity while
controlling the group-level differences on the ISDE ratings. The initial test of the null model
indicated that teams accounted for a large amount of variance in ISDE ratings. Infraclass
correlations estimating the amount of variance accounted for by the random effects of team
membership were 0.71, 0.51, and 0.56 for ISDE1 to ISDE3. Three separate, second models were
tested: 1.) All three raw score DivET scales were entered as fixed effects, 2.) Engagement and
Avoidant z-scores were entered as fixed effects, and 3.) Avoidant and Reinforcing z-scores were
entered as fixed effects. The Reinforcing raw score coefficients were significant and negative for
all three sets of ISDE ratings. No other DivET dimension was significant.
Measuring Social Privilege, 25
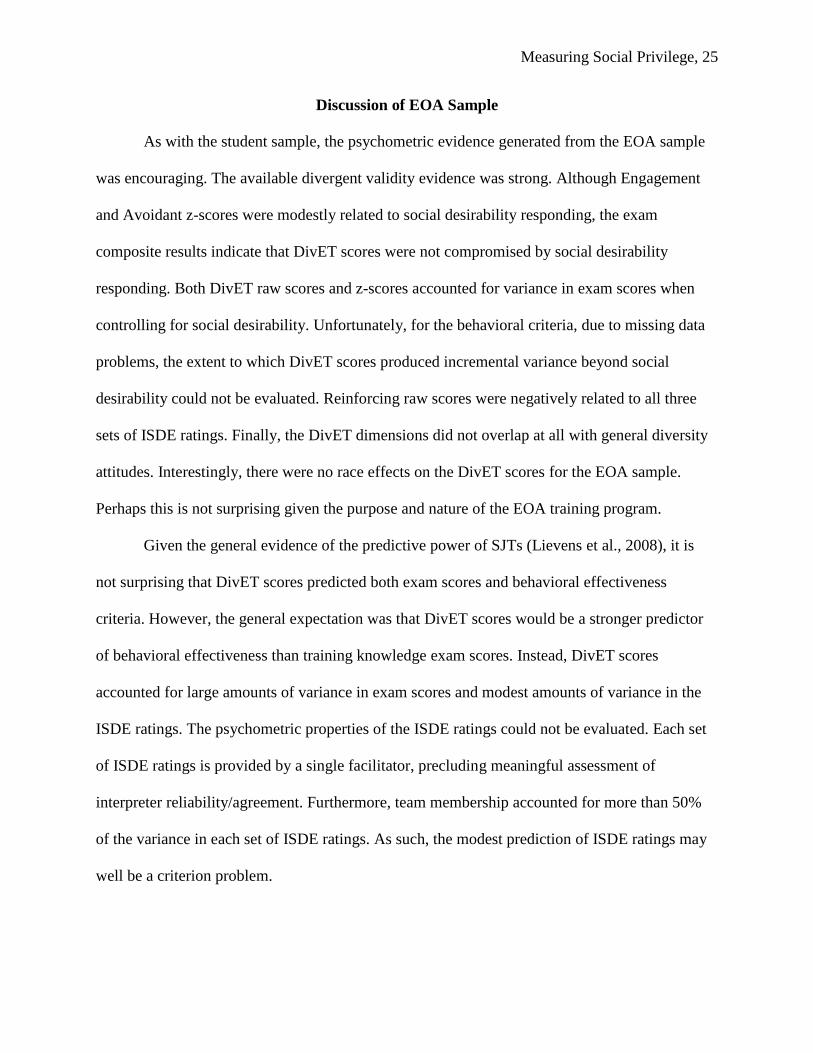
Discussion of EOA Sample
As with the student sample, the psychometric evidence generated from the EOA sample
was encouraging. The available divergent validity evidence was strong. Although Engagement
and Avoidant z-scores were modestly related to social desirability responding, the exam
composite results indicate that DivET scores were not compromised by social desirability
responding. Both DivET raw scores and z-scores accounted for variance in exam scores when
controlling for social desirability. Unfortunately, for the behavioral criteria, due to missing data
problems, the extent to which DivET scores produced incremental variance beyond social
desirability could not be evaluated. Reinforcing raw scores were negatively related to all three
sets of ISDE ratings. Finally, the DivET dimensions did not overlap at all with general diversity
attitudes. Interestingly, there were no race effects on the DivET scores for the EOA sample.
Perhaps this is not surprising given the purpose and nature of the EOA training program.
Given the general evidence of the predictive power of SJTs (Lievens et al., 2008), it is
not surprising that DivET scores predicted both exam scores and behavioral effectiveness
criteria. However, the general expectation was that DivET scores would be a stronger predictor
of behavioral effectiveness than training knowledge exam scores. Instead, DivET scores
accounted for large amounts of variance in exam scores and modest amounts of variance in the
ISDE ratings. The psychometric properties of the ISDE ratings could not be evaluated. Each set
of ISDE ratings is provided by a single facilitator, precluding meaningful assessment of
interpreter reliability/agreement. Furthermore, team membership accounted for more than 50%
of the variance in each set of ISDE ratings. As such, the modest prediction of ISDE ratings may
well be a criterion problem.
Measuring Social Privilege, 26
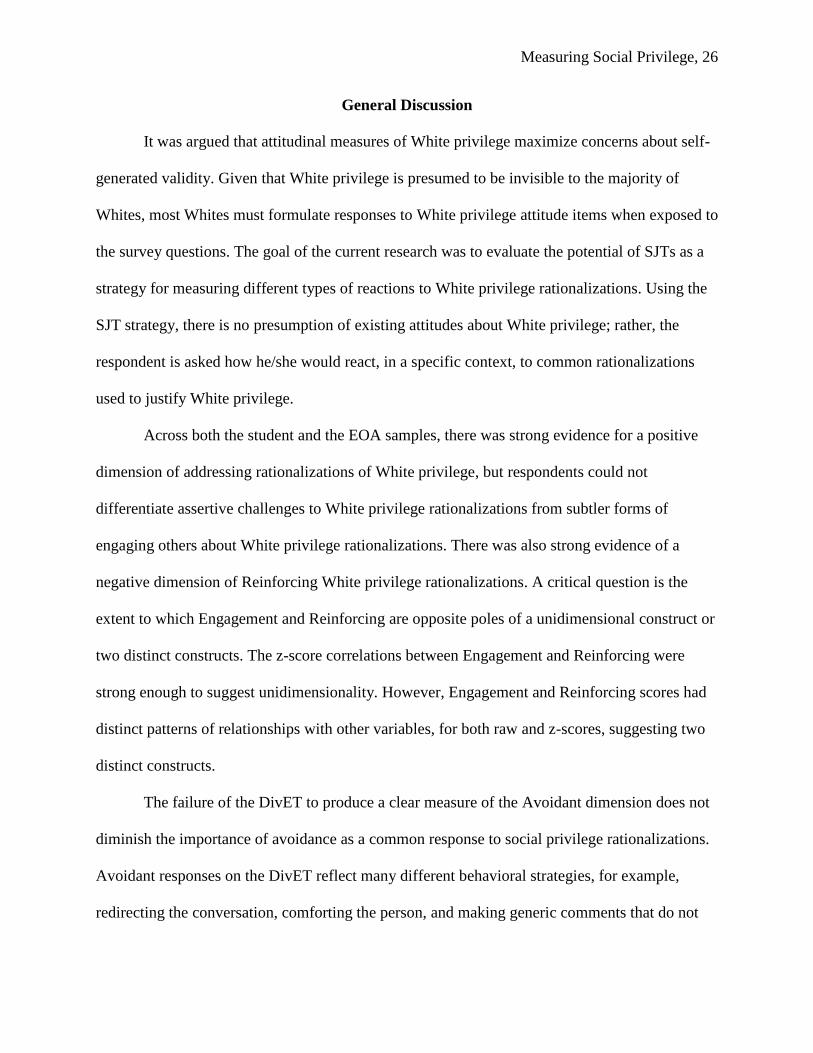
General Discussion
It was argued that attitudinal measures of White privilege maximize concerns about self-
generated validity. Given that White privilege is presumed to be invisible to the majority of
Whites, most Whites must formulate responses to White privilege attitude items when exposed to
the survey questions. The goal of the current research was to evaluate the potential of SJTs as a
strategy for measuring different types of reactions to White privilege rationalizations. Using the
SJT strategy, there is no presumption of existing attitudes about White privilege; rather, the
respondent is asked how he/she would react, in a specific context, to common rationalizations
used to justify White privilege.
Across both the student and the EOA samples, there was strong evidence for a positive
dimension of addressing rationalizations of White privilege, but respondents could not
differentiate assertive challenges to White privilege rationalizations from subtler forms of
engaging others about White privilege rationalizations. There was also strong evidence of a
negative dimension of Reinforcing White privilege rationalizations. A critical question is the
extent to which Engagement and Reinforcing are opposite poles of a unidimensional construct or
two distinct constructs. The z-score correlations between Engagement and Reinforcing were
strong enough to suggest unidimensionality. However, Engagement and Reinforcing scores had
distinct patterns of relationships with other variables, for both raw and z-scores, suggesting two
distinct constructs.
The failure of the DivET to produce a clear measure of the Avoidant dimension does not
diminish the importance of avoidance as a common response to social privilege rationalizations.
Avoidant responses on the DivET reflect many different behavioral strategies, for example,
redirecting the conversation, comforting the person, and making generic comments that do not
Measuring Social Privilege, 27
address the rationalization. Given that there are multiple behavioral strategies that effectively
avoid addressing White privilege rationalizations, an Avoidant factor may never clearly emerge
using the SJT strategy. Alternatively, ambivalence may be a better construct to use as the
passive, negative response to White privilege rationalizations. Ambivalent responses reflect a
general sense of hopelessness that nothing can be done to change White privilege.
Although the initial psychometric evidence of the DivET was generally positive, there are
issues that could not be fully addressed. There is a need for confirmatory factor analyses that
simultaneously model DivET dimensions and scenario factors. The exploratory factor analysis
results suggest that the DivET ratings were weak reflective indicators of the specific scenarios,
but more definitive analyses are needed. Also, measurement invariance should be evaluated as a
function of race, and evidence of divergent validity with a broader array of attitudinal surveys is
needed, as is further evaluation of divergent validity from social desirability responding. Some of
the strongest supporting evidence for the DivET was the prediction of test scores of EOA
trainees’ diversity/equal opportunity knowledge. However, general aptitude was unaccounted for
in the prediction of knowledge test scores. It is unlikely that DivET scores are proxies for general
aptitude, but it is always better to control general aptitude when validating knowledge criteria.
Finally, more research is needed using behavior criteria; the weak psychometric properties of the
ISDE ratings likely attenuated the predictive accuracy of DivET scores.
Situational Judgment Tests and Social Privilege
It is argued the SJT strategy overcomes the self-generated validity limitation of White
privilege scales and has the added advantage that individuals of all racial and ethnic backgrounds
can respond. Given that all socially dominant groups use rationalizations to justify social
privilege, the SJT strategy can be applied to any aspect of social privilege (e.g., male social
Measuring Social Privilege, 28
privilege, heterosexual social privilege, physically healthy social privilege, etc.). However, the
SJT strategy is not without challenges. SJTs are noisy measures of latent constructs; the nature
and wording of the scenarios, item prompts, and response options always has some affect on the
estimation of standing on any latent construct. The controversy about within-subject
standardization of scores is difficult to evaluate based on the DivET results. In the current study,
the intercorrelations among the DivET z-scores fit logical expectations, but the validity evidence
was mixed in that DivET z-scores did not consistently outperform DivET raw scores. Finally,
development of SJTs is more labor intensive than the development of traditional attitudinal
measures.
Conclusion
Social privilege is fundamentally a sociological construct because the accrued benefits
are referenced to the average benefits received by group members. However, not all dominant
group members benefit equally from privilege. Although understanding social privilege at the
psychological level is important, the sociological nature of social privilege raises complexities
for psychological measurement. It is my contention that individuals cannot be directly asked
about social privilege attitudes because most dominant group members are unaware of the
accrued privileges, raising serious questions about the validity of direct questions about
privilege. In contrast, the SJT strategy affords a more valid, indirect method by assessing how
people react to rationalizations of privilege. The current study provides initial evidence of the
validity of the SJT approach, but much more research is needed.
Measuring Social Privilege, 29
References
Ballard, R. (1992). The short forms of the Marlowe-Crowne Social Desirability Scale.
Psychological Reports, 71, 1155–1160.
Berry, J. W., & Kalin, R. (1995). Multicultural and ethnic attitudes in Canada: An overview of
the 1991 national survey. Canadian Journal of Behavioral Science, 27(3), 301–320.
Black, L. L., & Stone, D. (2005). Expanding the definition of privilege: The concept of social
privilege. Journal of Multicultural Counseling and Development, 33, 243–255.
Feldman, J. M., & Lynch, J. G. (1988). Self-generated validity and other effects of measurement
on belief, attitude, intention, and behavior. Journal of Applied Psychology, 73, 421–435.
Lievens, F., Peeters, H., & Schollaert, E. (2008). Situational judgment tests: A review of recent
research. Personnel Review, 37, 426–440.
McDaniel, M. A., Psotka, J., Legree, P. J., Yost, A. P., & Weekley, J. A. (2011). Toward an
understanding of situational judgment item validity and group differences. Journal of
Applied Psychology, 96, 327–336.
McGuire, W. G. (2012). Interpersonal Skills Development Evaluation (ISDE). Unpublished
manuscript.
Motowidlo, S. J., Hooper, A. C., & Jackson, H. L. (2006). Implicit policies about relations
between personality traits and behavioral effectiveness in situational judgment items.
Journal of Applied Psychology, 91, 749–761.
Pinterits, E. J., Poteat, V. P., & Spanierman, L. B. (2009). The White Privilege Attitude Scale:
Development and initial validation. Journal of Counseling Psychology, 56, 417–429.

Measuring Social Privilege, 30
Sifford, A., Ng, K., & Wang, C. (2009). Further validation of the psychosocial costs of racism to
Whites scale on a sample of university students in the Southeastern United States.
Journal of Counseling Psychology, 56, 585–589.
Spanierman, L. B., & Heppner, M. J. (2004). Psychosocial costs of racism to Whites scale
(PCRW): Construction and initial validation. Journal of Counseling Psychology, 51,
249–262.
Woehr, D. J., & Feldman, J. (1993). Processing objective and question order effects on the causal
relation between memory and judgment in performance appraisal: The tip of the iceberg.
Journal of Applied Psychology, 78, 232–241.
Measuring Social Privilege, 31
Table 1.
Dimension Intercorrelations and Reliabilities for DivET (Student Sample).
1 2 3 4 5
1 Challenge (.88)
2 Engagement .91** (.88)
3 Engagement Compositea
.98** .98** (.90)
4 Avoidant .63** .58** .62** (.78)
5 Reinforcing .04 .05 .36** .05 (.87)
Note. N = 382. The diagonals report the internal consistency reliabilities.
aEngagement Composite is the average of the Challenge and Engagement scale scores.
** p < .01

Measuring Social Privilege, 32
Table 2.
Convergent Validity Coefficients between DivET Scores (Raw and z-Scores) and WPAS.
Engagement
Avoidant
Reinforcing
Raw
z
Raw
z
Raw
z
ConfWP
.31**
.29**
.07
-.19*
-.05
-.22*
CostWP
.13*
-.04
.20**
.04
.20**
.02
AwareWP
.36**
.35**
.15*
-.10
-.11
-.34**
RemorseWP
.35**
.31**
.16*
-.15*
-.06
-.26**
Note. N = 304. ConfWP = Willingness to Confront White Privilege, CostWP = Anticipated Costs
of Addressing White Privilege, AwareWP = White Privilege Awareness, and RemorseWP =
White Privilege Remorse
* p < .05
** p < .01
Measuring Social Privilege, 33
Table 3.
DivET Raw Score Prediction models for WPAS.
Engagement
Avoidant
Reinforcing
b
.52**
.05*
.50**
.54**
b
-.28*
.20+
-.07
-.11
b
-.02
.19*
-.16*
-.10
R2
Adjusted R2
ConfWP
.12
.11
CostWP
.06
.05
AwareWP
.15
.14
RemorseWP
.14
.13
Note. N = 304. ConfWP = Willingness to Confront White Privilege, CostWP = Anticipated Costs
of Addressing White Privilege, AwareWP = White Privilege Awareness, and RemorseWP =
White Privilege Remorse.
+ p < .10
* p < .05
** p < .01

Measuring Social Privilege, 34
Table 4.
DivET z-Score Prediction Models for WPAS.
Engagement
Avoidant
Avoidant
Reinforcing
b
b
b
b
R2
Adjusted R2
Model 1
Model 2
ConfWP
.82**
-.19
-.59*
-.41**
.09
.08
CostWP
-.01
.08
.08
.03
.00
.00
AwareWP
1.25**
.22
-.40*
-.62**
.14
.14

Measuring Social Privilege, 35
RemorseWP 1.04** -.09 -.60** -.52** .10 .10
Note. N = 304. ConfWP = Willingness to Confront White Privilege, CostWP = Anticipated Costs of Addressing White Privilege,
AwareWP = White Privilege Awareness, and RemorseWP = White Privilege Remorse. Due to the linear dependencies for the DivET
z-scores, the variance accounted for in WPAS scores in Model 1 = the variance accounted for in WPAS scores in Model 2.
+ p < .10
* p < .05
** p < .01

Measuring Social Privilege, 36
Table 5.
Dimension Intercorrelations and Reliabilities for DivET (Military Sample).
1
2
3
4
5
6
1 Engagement
(.88)
2 Avoidant
.55**
(.79)
3 Reinforcing
.29**
.52**
(.82)
4 Engagement z-scores
.68**
-.14
-.33**
NA
5 Avoidant z-scores
-.41**
.49**
.04
- .72**
NA
6 Reinforcing z-scores
-.59**
-.26**
.42**
-.77**
.10
NA
Note. N = 149. NA = Not Applicable.
** p < .01
Measuring Social Privilege, 37
Table 6.
Correlations between DivET Scores and MCA and MCSD Scores.
MCA (N = 49)
MCSD (N = 49)
Exam (N = 81)
r
r
r
Engagement
-.08
.13
.12
Avoidant
-.04
-.18
.09
Reinforcing
.01
-.21
-.17
Engagement (z)
-.09
.30**
.17
Avoidant (z)
.03
-.25*
.06
Reinforcing (z)
.10
-.16
-.33**
Note. (z) designates DivET scales standardized within subjects. MCA = Multicultural Attitude
Scale and MCSD = Marlowe Crowne Social Desirability Scale.
* p < .10
** p < .05

Measuring Social Privilege, 38
Table 7.
DivET Score Prediction Models of Exam Composite Scores.
Step
Predictor
b
R2
F-Change
Step 1
.06
.29
Constant
100.66
MCA
-2.38
MCSD
-.60
DivET Raw Scores
Step 2
.20
3.56**
Constant
95.27
MCA
.76
MCSD
-.89**
Measuring Social Privilege, 39
Engagement
2.82*
Avoidant
.23
Reinforcing
-6.09***
Engagement and Avoidant z-Scores
Step 2
.25
7.31***
Constant
84.07
MCA
.69
MCSD
-.81**
Engagement (z)
25.16***
Avoidant (z)
10.32**

Measuring Social Privilege, 40
Table 7. Continued.
Avoidant and Reinforcing z-Scores
Step 2
.25
7.31***
Constant
84.07
MCA
.69
MCSD
-.81
Avoidant (z)
-2.26
Reinforcing (z)
-12.58***
Note. N = 49. (z) designates DivET scales standardized within subjects. MCA = Multicultural
Attitude Scale and MCSD = Marlowe Crowne Social Desirability Scale.
* p < .10
** p < .05
*** p < .01
Measuring Social Privilege, 41
Example of DivET overarching scenario, SJT item, and response options.
Your neighbor, Grace, has stopped by to chat about her son’s college application process. She’s
disappointed that her son was rejected from a nearby university. Grace also indicates that a
Hispanic classmate, Maria, was admitted to the university with a minority scholarship.
Assume that after mentioning her son’s college admission process, Grace made a single follow-
up comment.
Grace states: “I know Hispanics have been discriminated against in the past, but it’s time to
move on.” Your response would be to:
1. State that it’s unfortunate her son was not admitted. (Avoidant)
2. State that Grace’s son wasn’t rejected so that Maria could be admitted. (Challenging)
3. State that scholarships should not be set aside for minorities. (Reinforcing)
4. Ask Grace if she knows Maria (Engagement).