measuring shipping connectivity and performance -...
TRANSCRIPT

Measuring shipping connectivity and performancePerspective on the need for statistics and data
Christopher Pålsson
Head of Consultancy & maritime-insight
Lloyd’s List Intelligence

DisclaimerThis presentation and accompanying material is provided by the Lloyd’s List Group (“LLG") for the use of the recipient only and is not to be copied or distributed to any other person. No representation, warranty or undertaking (express or implied) is given and no responsibility is accepted by LLG or its clients, or by any of their respective partners, officers, employees, advisers or agents for the completeness or accuracy of any information contained in, or of any omissions from, this presentation or any supplementary information and any liability in respect of such information or omissions is hereby expressly disclaimed.
© Informa UK Limited (2016). All rights reserved.

Commercial

Vessel characteristics and activities

Systematic intelligence for gathering of data

Lloyd’s List Intelligence | informa6

Lloyd’s List Intelligence | informa7

Lloyd’s List Intelligence | informa8
Combining ship characteristics, vessel tracking & insight
Market analysis & forecasting
MRV

Parts of the container fleet are getting old, replacements of small ships have started
1,222 ships
1.9 mteu
4,041 ships
18.1 mteu
593 ships
4.3 mteu
21% of fleet
-1999
2000-
Orderbook

The number of idle ships have not been high since the ”Great Recession”

Average time in port varies – no clear trend in sight though
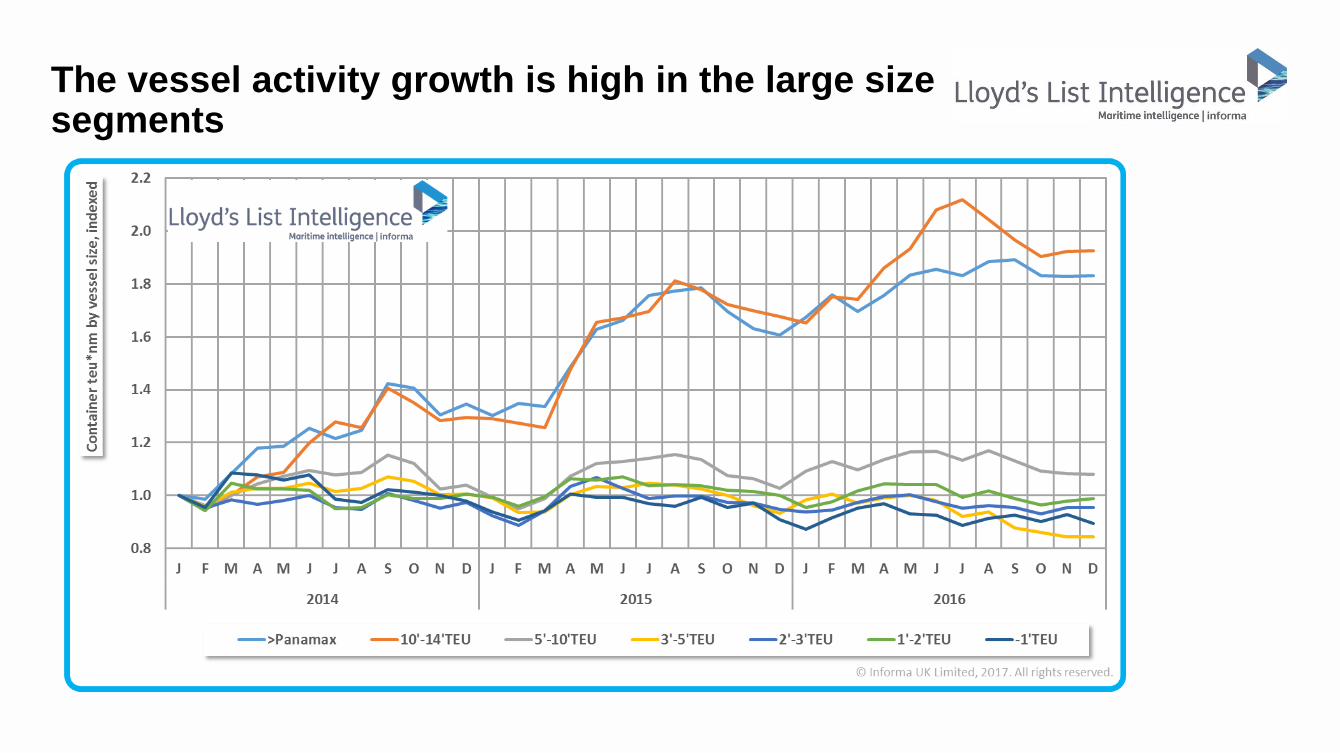
The vessel activity growth is high in the large size segments

Sometimes activity growth and fleet growth are out of sync

Fleet growth matches demand growth with a delay, but this is largely a supply driven market

Almost all growth of seaborne general cargo is in container

Lloyd’s List Intelligence | informa17
Supply/Demand balancemore than just dwt and cargo tonnes.
TONNES
DISTANCE
CARGO CAP
LOAD FACTOR
SPEED
TIME IN PORT
IDLE/WAITING

MRV
• We provide calculation of:• Distance
• Speed
• Fuel consumption
• Emissions to air
•We have tables of:• ship engine characteristics,
• engine emissions factors for a large number of main engines,
• representative main engine emissions factors
• representative auxiliary engine emissions factors,
• reduction factors for vessels known to have abatement technology,
• types of fuel for main and auxiliary engines per vessel category,
