measuring race & ethnicity: a mixed bag · measuring race & ethnicity: a mixed bag patrick...
TRANSCRIPT

Measuring Race & Ethnicity: g yA Mixed Bag
Patrick Perry, CCCCORosaleen Ryan, Monterey Penin. Coll.y , yAndrew LaManque, Foothill-DeAnza
Lan Hao Citrus CollegeLan Hao, Citrus College

California, 1950’s
Looked a lot like “Grease”90% white%
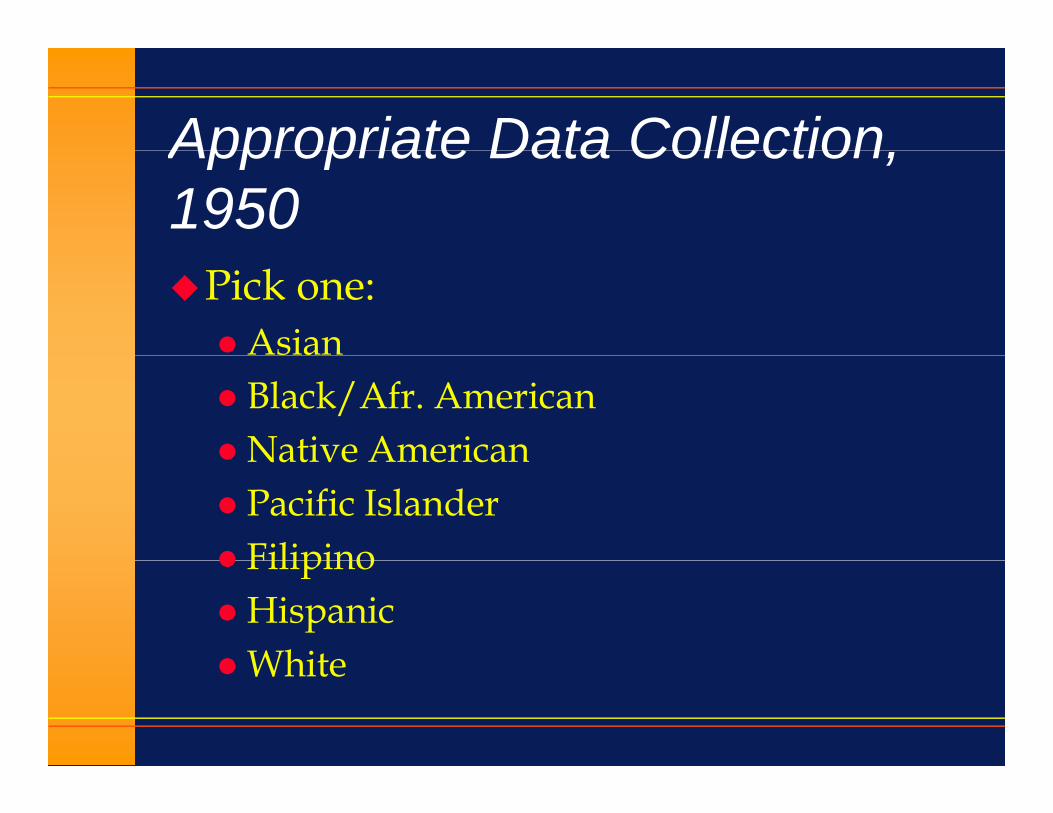
Appropriate Data CollectionAppropriate Data Collection,1950
Pick one:AsianBlack/Afr. AmericanNative AmericanNative AmericanPacific IslanderFilipinoFilipinoHispanicWhiteWhite

California, 2010’s
Looks a lot more like “High School Musical”

Consider…
Corbin Bleu (aka “Chad”) in HSM:
Mother: ItalianFather: JamacianFather: Jamacian

Consider…
Vanessa Hudgens (aka Gabriella Montez) in HSM:)
Father: Irish & Native AmericanFather: Irish & Native AmericanMother: Filipina

History
On October 19, 2007, the U.S. Department of Education posted:p p
"Final Guidance on Maintaining Final Guidance on Maintaining, Collecting, and Reporting Racial and Ethnic Data to the U.S. Department of pEducation“ to implement OMB’s 1997 Standards.

And it said:
Two questions must be used when collecting ethnicity/race.g y/

Question One:
Whether the respondent is:“Hispanic or Latino or Spanish Origin” or p p g“Not Hispanic or Latino or Spanish Origin” g
(The term “Hispanic or Latino or Spanish Origin” is defined as a person of Cuban, Mexican, Puerto Rican, South or Central American, or other Spanish culture or origin, , p g ,regardless of race).
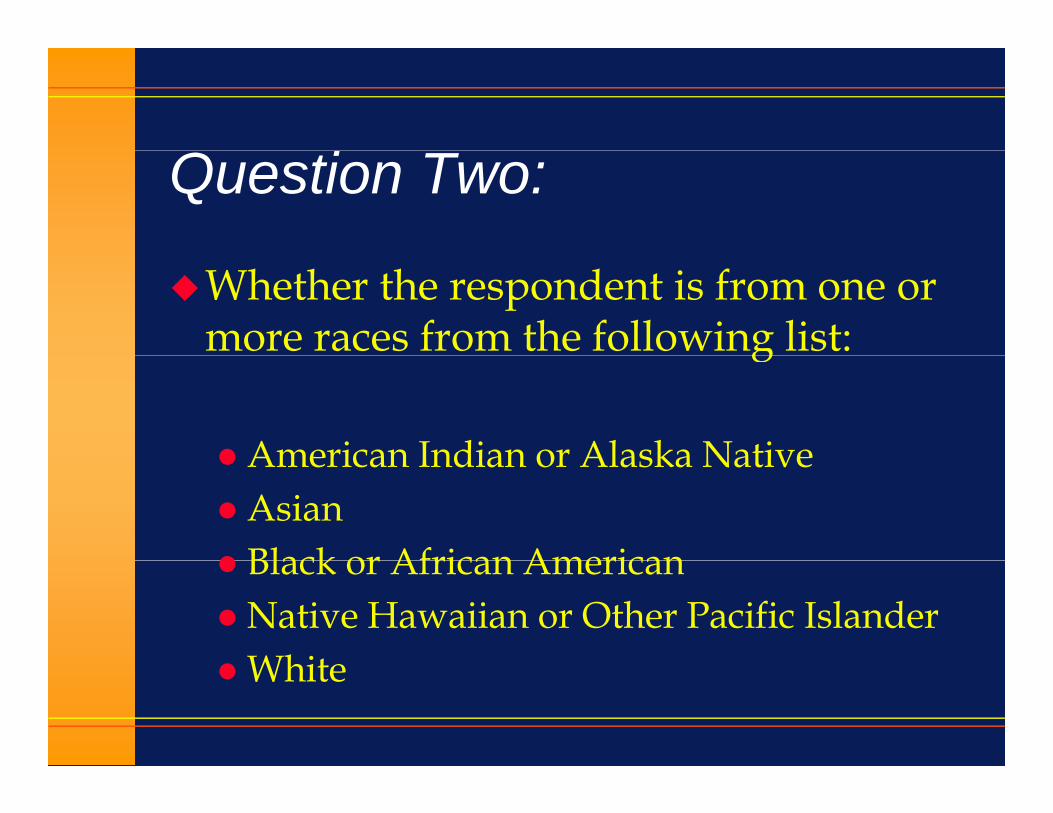
Question Two:
Whether the respondent is from one or more races from the following list: g
American Indian or Alaska NativeAmerican Indian or Alaska NativeAsianBlack or African AmericanBlack or African AmericanNative Hawaiian or Other Pacific IslanderWhit White

Three caveats (per Feds):
“decline to state” is not an allowable option—no checkboxpQuestion must not be framed as being “optional”, however no controls can optional , however no controls can exist to disallow a student/employee from simply not respondingfrom simply not responding.“Check One or More” is the question for question #2for question #2.

Reporting
Is different than collection.Populations (students, staff) will now Populations (students, staff) will now have a [one : many] collectionrelationship between person and relationship between person and race/ethnicityReporting seeks a [one : one] Reporting seeks a [one : one] relationship so that things all add up to 100%100%

Reporting
Federal Reporting Categories:
Current IPEDS Reporting Categories New IPEDS Reporting Categories
1) Nonresident Alien2) Race and Ethnicity unknown
1) Nonresident Alien2) Race and Ethnicity unknown
3) Black, non-Hispanic4) American Indian/Alaskan Native5) Asian/Pacific Islander6) Hispanic
3) Hispanics of any race
For non-Hispanics only:4) American Indian or Alaska Native
7) White, non-Hispanic 5) Asian6) Black or African American7) Native Hawaiian or Other Pacific Islander8) Whit8) White9) Two or more races
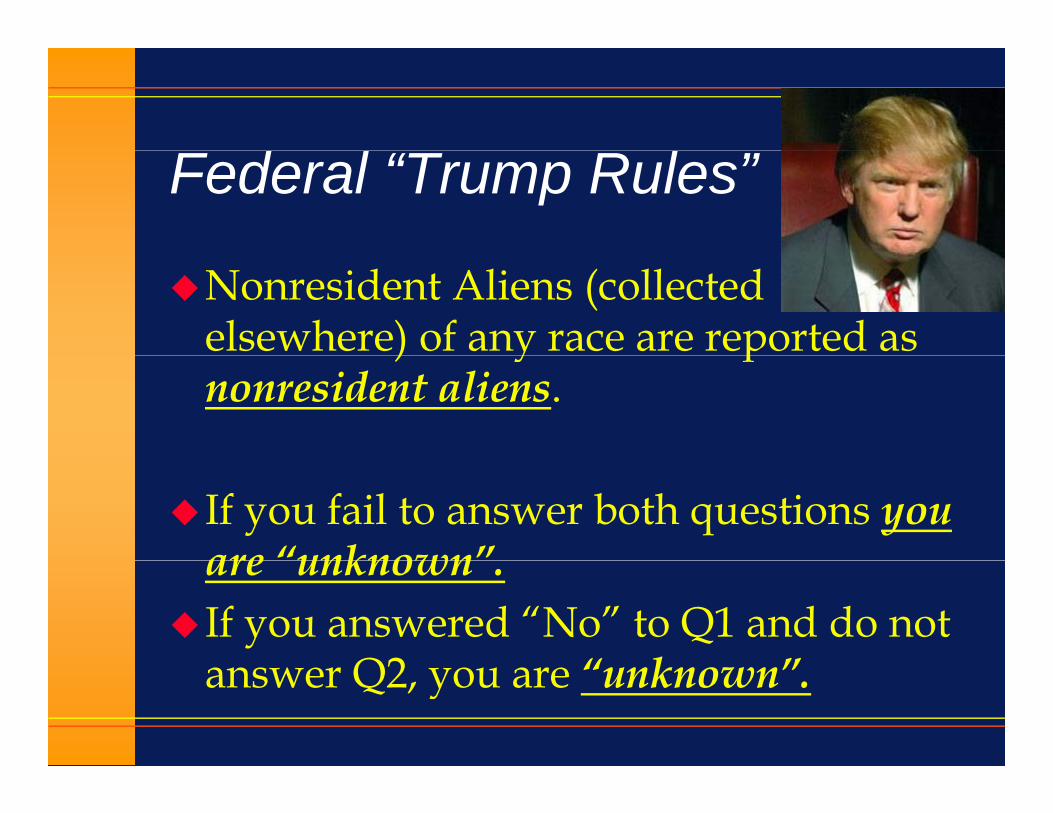
Federal “Trump Rules”
Nonresident Aliens (collected elsewhere) of any race are reported as ) y pnonresident aliens.
If you fail to answer both questions you are “unknown”are unknown .If you answered “No” to Q1 and do not
Q2 “ k ”answer Q2, you are “unknown”.

Federal “Trump Rules”
If you answered “Yes” to Q1 (Hispanic: Y/N), you are “Hispanic”./ ), y p
Regardless of what you answered in Q2Regardless of what you answered in Q2Regardless of whether you even answered Q2Q2

Federal “Trump Rules”
If you answered ‘No’ to or failed to answer Q1 and Qcheck only one race box in Q2, you are considered as only that race you considered as only that race you checked in Q2.

Federal “Trump Rules”
If you answered “No” to or failed to answer Q1 and check more than one Qrace box in Q2, you are considered as “Two or More Races”.
Multiple-races are considered equallyMultiple races are considered equally

New Collection Implemented
Summer 2009: New race/eth collection format implementedpNew MIS collection Element: SB29
Student Multi-EthnicityStudent Multi-EthnicityNew Derived MIS Element: STD10
St d t IPEDS Eth i itStudent IPEDS Ethnicity

What We Thought WouldWhat We Thought Would Happen:
2000 Census: first collection of multi-race in 2 question formatq
How much would Hispanic go up?How much would =>2 races be?How much would 2 races be?How far would all others go down?
In CA:In CA:4.7% identified as 2 or more races
For children <5 this figure was 8 4%For children <5, this figure was 8.4%

CA Census 2000:CA Census 2000: Hispanic/Latino Counts Up:
46% of Native Americans also identified as Latino22% of Whites identify also with Latino9% of Pacific Islanders9% of Pacific Islanders4% of Black/Afr. Amer.1% of Asians

What Really Happened-What Really HappenedStudents:
*drumroll*

Year Asian Hispanic Black >1 Race White Unknown
1992‐1993 11.2% 19.8% 7.4% 50.7% 6.1%
1994‐1995 12.3% 21.8% 7.8% 46.9% 4.8%
1996‐1997 12.2% 22.9% 7.8% 44.7% 7.7%
1998‐1999 12 2% 23 8% 7 6% 42 6% 9 0%1998 1999 12.2% 23.8% 7.6% 42.6% 9.0%
2000‐2001 12.1% 25.0% 7.3% 40.4% 10.6%
2002 2003 12 3% 26 3% 7 5% 39 3% 9 8%2002‐2003 12.3% 26.3% 7.5% 39.3% 9.8%
2004‐2005 12.3% 27.7% 7.6% 37.2% 10.2%
2006‐2007 12.2% 28.8% 7.5% 35.4% 11.1%
2008‐2009 11.6% 29.6% 7.5% 33.6% 12.8%
2009‐2010 11.1% 29.7% 7.0% 1.3% 30.9% 16.0%

What Really Happened-What Really HappenedEmployees:

Term Asian Hispanic Black >1 Race White Unknown
Fall 2003 7.3% 5.3% 9.5% 74.3% 3.6%
Fall 2004 7.6% 5.1% 9.8% 73.8% 3.8%
Fall 2005 7 8% 5 1% 10 2% 72 8% 4 1%Fall 2005 7.8% 5.1% 10.2% 72.8% 4.1%
Fall 2006 8.0% 5.0% 10.4% 72.0% 4.6%
Fall 2007 8.3% 5.3% 10.7% 70.8% 5.0%
Fall 2008 8.3% 5.3% 10.9% 69.8% 5.7%
Fall 2009 8.1% 5.0% 10.6% 0.3% 66.9% 9.2%

First-Time Students:

Year Asian Hispanic Black >1 Race White Unknown
2007‐2008 10.0% 35.3% 8.7% 28.4% 13.2%
2008‐2009 9.5% 35.2% 9.0% 27.7% 14.1%
2009‐2010 8.8% 32.6% 7.4% 2.0% 24.7% 21.5%

What Happened???????
Lots of conjecture, anecdotesCould be a true trend toward non-disclosure, and new, complex questions further turned off constituentsCould be “non-mandatory” nature of questionsCould be data transformation/load errors
Some campuses went of the charts with “ k ” t f f ld t d d “unknowns”: transfer of old to new, recoded with “X” values

Transition to the “New” Multiethnicity Data Element
Rosaleen Ryan, Ph.D.M t P i l C llMonterey Peninsula College
C lif i A i i f I i i l R hCalifornia Association for Institutional ResearchNovember 18, 2010

BackgroundBackground
• We examined the ethnicity of students usingWe examined the ethnicity of students using the “old” ethnicity data field (Spring 2009)
• And re‐examined those same students using the new multiethnicity data element (Fall 2009)

BackgroundBackground
• We did not re‐survey our entire continuingWe did not re survey our entire continuing student population
• Only a small percentage of continuingOnly a small percentage of continuing students update information on “Continuing Student Update Form”
• We are particularly interested inWe are particularly interested in number/percentage of Latino students as we are trying to achieve HSI status

Comparison of old & new ethnicity d ldata elementsIPEDS Ethnicity Data Element (from fall 2009)
A B H N P T W X
Asian 460 1 1 2 2 81
Filipino 218 1 2 29
categorie
s g 2009)
Filipino 218 1 2 29
Black 231 1 1 44
Hispanic 888 6 164
” Ethn
icity
from
sprin
g Am Ind 51 1 2 8
Pac Isl 80 1 16
Other 1 2 1 2 134
“Old” (f
White 1 8 3 2 3932 482
Not reported 4 3 5 4 27 992p


Variations in Reporting Needs Under the New Ethnicity Questions
Andrew LaManque, Ph.D.Foothill De Anza CCDFoothill De Anza CCD
November 18, 2010, CAIR

De Anza College ‘Impact’ GrantDe Anza College Impact Grant
•Asian American and Native American Pacific Islander‐Asian American and Native American Pacific IslanderServing Institutions (AANAPISI) grant
•De Anza College grant focuses on certain groups: Filipino, Cambodian, Laotian, Vietnamese, G i H ii S Oth P ifi I l dGuamanian, Hawaiian, Samoan, Other Pacific Islander.
•Current Practice – At the detail ethnic level use ofCurrent Practice At the detail ethnic level, use of Multi‐ethnic if a student picks more than one category. g y
11/23/2010 7Andrew LaManque, Ph.D., CAIR
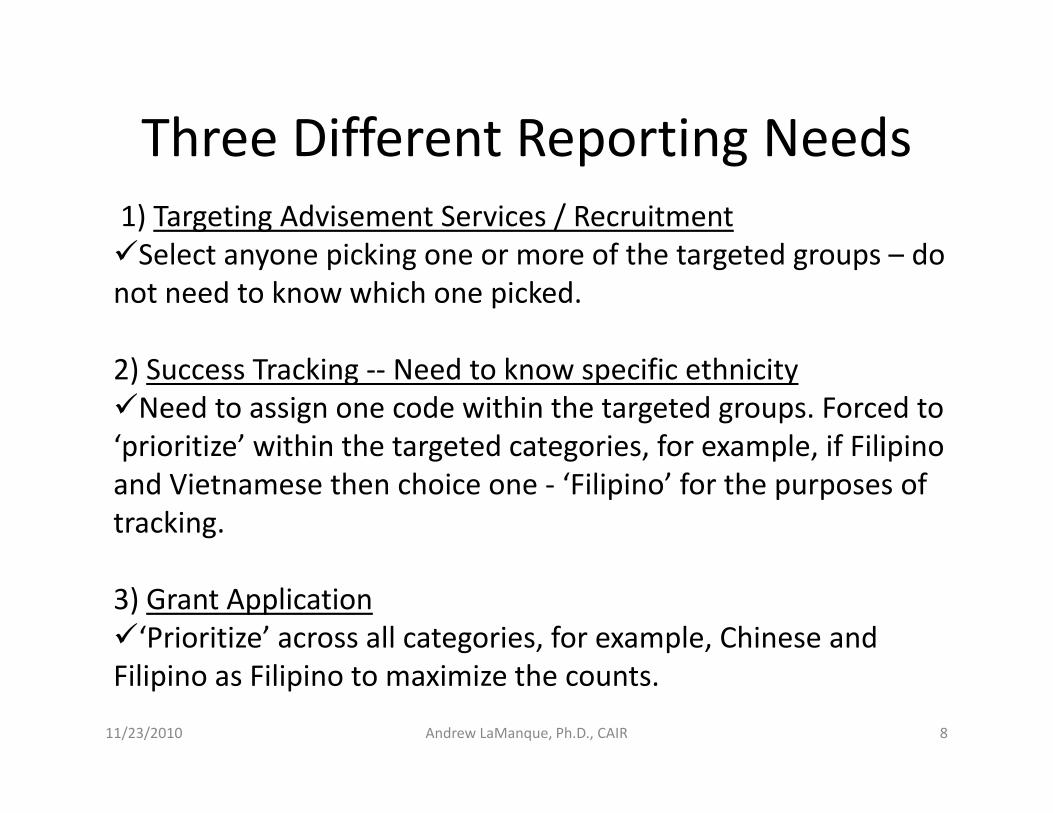
Three Different Reporting NeedsThree Different Reporting Needs1) Targeting Advisement Services / RecruitmentSelect anyone picking one or more of the targeted groups doSelect anyone picking one or more of the targeted groups – do
not need to know which one picked.
2) Success Tracking ‐‐ Need to know specific ethnicity Need to assign one code within the targeted groups. Forced to
‘prioritize’ within the targeted categories, for example, if Filipino p g g , p , pand Vietnamese then choice one ‐ ‘Filipino’ for the purposes of tracking.
3) Grant Application‘Prioritize’ across all categories, for example, Chinese and
Filipino as Filipino to maximize the counts.
11/23/2010 8Andrew LaManque, Ph.D., CAIR

Other IssuesOther Issues•Merging data from old and new formats
•No longer have Decline to State option
•Moved to CCC Apply in 2009‐10 ‐‐ No longer a required item
11/23/2010 9Andrew LaManque, Ph.D., CAIR


Unknown in Race/EthnicityUnknown in Race/Ethnicity
Lan Hao, Ph.D.Citrus CollegeCitrus College
November 18, 2010, CAIR
Citrus CollegeCitrus College
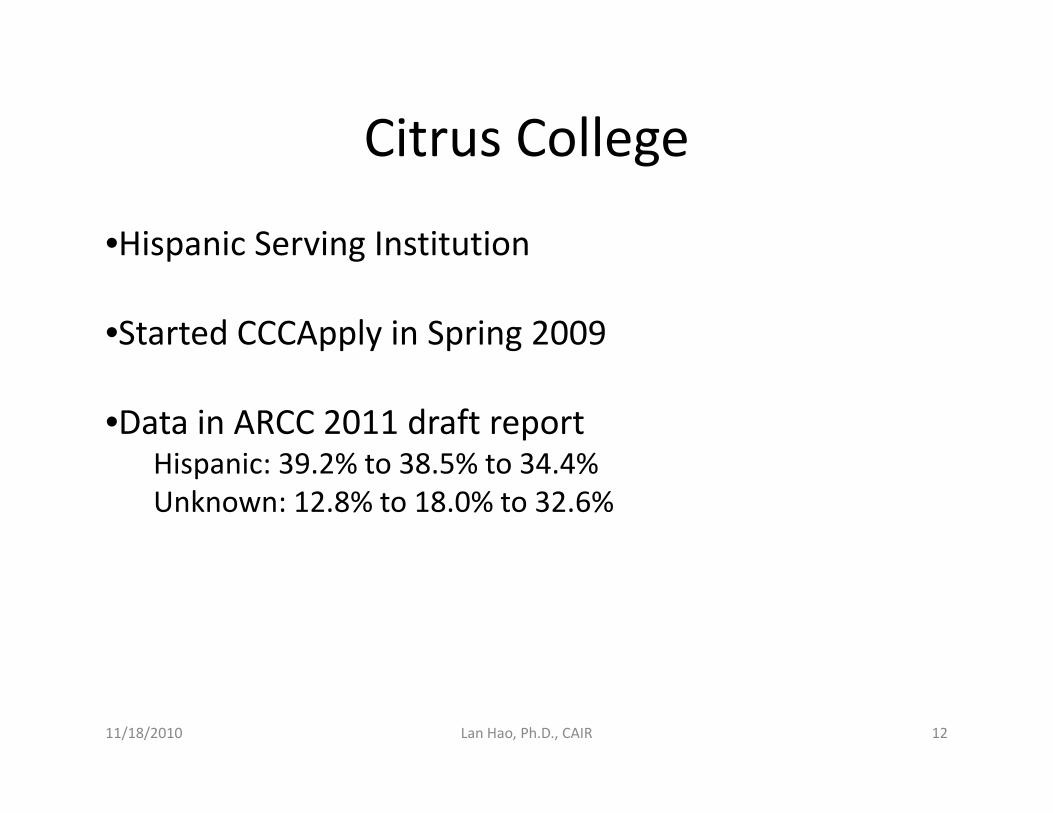
•Hispanic Serving InstitutionHispanic Serving Institution
•Started CCCApply in Spring 2009
•Data in ARCC 2011 draft reportHi i 39 2% t 38 5% t 34 4%Hispanic: 39.2% to 38.5% to 34.4%Unknown: 12.8% to 18.0% to 32.6%
11/18/2010 12Lan Hao, Ph.D., CAIR

ARCC: Unknown in Ethnicity Comparison
College 2007-2008 2008-2009 2009-2010Banner School?
Southwestern 5 3 5 4 68 7Southwestern 5.3 5.4 68.7North Orange Adult 21.4 18.8 64.8Barstow 9.9 13.3 64.5 yesGavilan 12.3 14.5 59.5 yesSolano 6.0 19.6 53.5 yesFullerton 9.0 9.3 40.6 yesCerro Coso 6.3 7.7 39.6 yesBerkeley City 14 2 21 5 35 8Berkeley City 14.2 21.5 35.8Bakersfield 6.8 7.2 34.1 yesCitrus 12.8 18.0 32.6 yesSanta Barbara 7.4 9.1 32.4 yes
11/18/2010 13Lan Hao, Ph.D., CAIR
Cerritos 13.1 11.5 30.8

A little data investigationA little data investigation…
Fall 09 Credit and Non-credit, CCCApply
Are you of Hispanic Origin?
Yes 4647 32.5%
No 4858 34.0%answered Q2 4698 32.9%
Skipped Q2 160 1.1%
Skipped Q1 4782 33 5%answered Q2 175 1 2%Skipped Q1 4782 33.5%answered Q2 175 1.2%
Skipped Q2 4607 32.2%
Total 14287 100.0%
11/18/2010 14Lan Hao, Ph.D., CAIR

Local Impacts and l l lPotential Policy Implications
• Grant application efforts
• Examining data through the equity lenses and th E it I dthe Equity Index
11/18/2010 Lan Hao, Ph.D., CAIR 15