measuring progress on climate change adaptation and … · ewa jackson, managing director march 6,...
TRANSCRIPT

Measuring Progress on Climate Change Adaptation and Resilience
Ewa Jackson, Managing Director March 6, 2018

• Are We There Yet? Applying Sustainability Indicators to Measure Progress on Adaptation
These projects were made possible with support from Natural
Resources Canada through the Measuring Progress Working
Group of the Adaptation Platform
• The Use of Climate Change Adaptation Indicators in OECD
Countries
Overview
1

Why measure?
• Show progress in moving from
unawareness to action on adaptation
• Document impacts on the investment of
resources and demonstrate accountability
• Provide information to improve future
adaptation activities
• Determine whether investments have
been the most efficient or cost-effective
• Raise the profile of the issue
Source: Natural Resources Canada 2

How to measure?
Adapted from: Brown, C., Shaker, R.,& Das, R. (2018)
• Measuring against baselines
• An initial measurement is taken, this measurement is taken again
at various intervals to gauge the effectiveness of strategies aimed
at making progress on this indicator.
• Measuring against definitions
• Establishment of a definition or “end-state” that one is working
towards, then through consensus building (for example) around
what success towards this definition looks like the issue becomes
resolved.
• Measuring against project objectives
• Incorporating measurement at the activity or initiative level – or
incorporating measurement throughout the project – as opposed to
the beginning and the end. 3

Underlying conditions will change,
as will the climate
Multiple contributors to success or
failure (attribution)
In many instances it is a case of
measuring avoided impacts
We don’t measure well to begin
with
There is no one panacea set of
indicators or M&E approaches
Challenges in measuring progress on adaptation
4

Tracking towards a moving target
5

Scope: Examination of adaptation indicators that have been developed to
monitor and evaluate action on climate change adaptation in OECD countries
Purpose: Assess whether the identified indicators can contribute to monitoring
and/or evaluation climate change adaptation efforts in Canada
Ultimately to connect Canadian public sector agencies and institutions with
appropriate international approaches currently being used or suggested
The Use of Climate Change Adaptation
Indicators in OECD Countries
6

Australia (14)
Finland (7)
France (245)
Germany (23)
Japan (4)
Mexico (4)
New Zealand (13)
Turkey (22)
United States (23)
7

8

So what?
What did we learn after doing this work?
It is one thing to have access to a bank of indicators, but
should be careful in picking effective indicators:
• RELEVANT and VALID
• Built into PLANNING and ACTION SETTING efforts
• CLEAR and EASY TO UNDERSTAND
• RELIABLE
• ACCESSIBLE DATA
9

• Status of adaptation in Canada – still much focus is on
measuring progress not effectiveness of actions
• Setting out monitoring and measuring plans early
• Tracking progress:
• Assess whether you are continuing towards your adaptation vision and
goals;
• Know more accurately where, to what extent, and against which impacts
your community is most vulnerable;
• Know whether the actions in the adaptation plan are producing the
results that were anticipated; and
• Celebrate your first steps in becoming more adapted!
• Adjusting your plans as needed
Adaptation Planning and M&E
10

• Using M&E to overcome common constraints to
implementation
• Clarity/specificity of option
• Maintaining momentum
• Building a business case
Leveraging Implementation
• Stakeholder buy-in
• Political will
• Competing priorities
Leveraging M&E for Implementation
11
• To provide advice to the federal government on measuring
progress on adaptation and climate resilience
• Panel consists of academic, private sector, government,
non-government, youth, and representatives of Indigenous
governments and organizations
• A final report to the Deputy Minister of ECCC by March 31,
2018
• The Report will be made publically available in spring 2018
• https://www.canada.ca/en/environment-climate-
change/services/climate-change/adapting-climate-
change/expert-adaptation-resilience-results.html
Leveraging Implementation Expert Panel on Climate Change Adaptation &
Resilience Results (EPCCARR)
12

Thank you!
Ewa Jackson
Managing Director, ICLEI Canada
T: 647-728-4387
Thank you!
13

• Brown, C., Shaker, R. R., & Das, R. (2018). A review of approaches for monitoring and
evaluation of urban climate resilience initiatives. Environment, Development and
Sustainability, 20(1), 23–40. https://doi.org/10.1007/s10668-016-9891-7
Leveraging Implementation References
14

Applying Sustainability Indicators to Measure Progress on Adaptation

Challenges measuring progress on adaptation
• Adaptation is not an objective or an end-point
• Uncertainties are inherent when implementing adaptation interventions
• In adaptation it is a case of measuring avoided impacts
• Tracking towards a ‘moving target’
• Adaptation spans multiple scales and sectors
• There is no one set of indicators or monitoring and evaluation approaches
16

Scope: Examination of sustainability indicators drawn from four Canadian sectors, and their application as adaptation indicators:
Purpose: Assess whether the identified indicators can contribute to monitoring and/or evaluating climate change adaptation efforts
Infrastructure
Project Overview
17
Research Team
18

Review and Guidance Team
Expert reviewers
•Institute for Catastrophic Loss Reduction
•Ontario Centre for Climate Impacts and Adaptation
•Health Canada Climate Change and Health Office
•Clean Air Partnership
•ICLEI Canada
•Greater Toronto Area Clean Air Council
• Southern Ontario Municipal StormwaterManagement Discussion Group
Project task force
•Toronto Public Health
•London/Middlesex Health Unit
•Northern Climate Exchange
•Colombia Basin Rural Development Institute
•McGill Climate Change Adaptation Research Group
•Health Canada Climate Change and Health Office
•Transport Canada
•Toronto and Region Conservation Authority
•Institute for Catastrophic Loss Reduction
•District of Saanich, BC
•Measuring Progress Working Group
19

Data Collection
•Electronic structured survey
•Followed up with structured interview where necessary
•Targeted to local, provincial, or national private, non-governmental and public sector agencies working in the four focus sectors
•A general category was also established
•NOT comprehensive
20
Indicators Overview
What type of indicators did we collect?
• A variety of process and outcome-based sustainability orientated indicators, including:
- Descriptive/ Informational Indicators
- Performance Indicators
- Benchmarking/ Baseline Indicators
- Policy effectiveness indicators
21

Research MethodologyHow was our analysis conducted?
• Vetting indicators to determine what indicators are “Applicable,” “POTENTIALLY Applicable” and “NOT Applicable” to monitoring/evaluating climate change adaptation efforts using the following criteria:
22

Research Methodology132
49 17 839 8
23

Overview• Presents 40 sustainability orientated indicators identified as
applicable to adaptation• Designed to be high level and easy to read
Potential Users/audience:• Municipalities• Provincial and Regional Governments• Federal Government• Sector agencies
Purpose:• Provide examples of what is possible with respect to measuring
progress on adaptation • Serve as a starting point for continual examination of process and
outcome-based indicators from varying sectors
Indicators Case Study Series
24

Quick Facts Section
Sector:
Themes:
Human and Financial Resource Requirements:
25

Factors to Consider Section
Rationale
Metric
Geographic Scale
Baseline
Applicability to Adaptation
Contextual Information
Frequency of Data Collection
Complimentary Indicators
Limitations
Potential data sources
More Information
26

27

Health: Percentage of Population Under Water Quality Advisory
28

Health: Percentage of Population Under Water Quality Advisory
29

Coastal Mgmt: Length of Coastline with Soft Shoreline and Natural Buffer Techniques
30
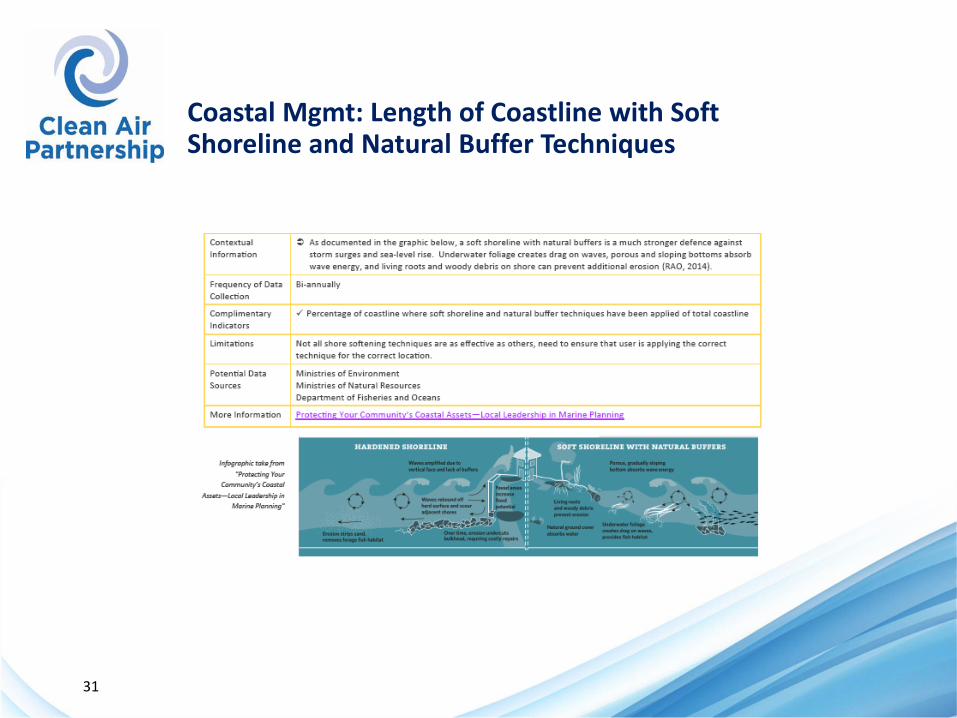
Coastal Mgmt: Length of Coastline with Soft Shoreline and Natural Buffer Techniques
31

Infrastructure: Estimated Percentage of Water Loss in Distribution System
32

Infrastructure: Estimated Percentage of Water Loss in Distribution System
33

Flood Mgmt: % Compliance with Municipal Mandatory Downspout Disconnection Program
34

Flood Mgmt: % Compliance with Municipal Mandatory Downspout Disconnection Program
35

Indicators Overview
Number of days when air quality index is poor
Asthma emergency department visits: volume and median length of stay
Area of catchment directly tied to a stormwater system
Number of rain events that exceed municipal stormwater utilities design standards
Area covered by integrated stormwater management plans
Number of implemented Green Infrastructure projects
Number of households prepared for a seven day emergency
Number of external partnerships on adaptation
Percentage Probability of Unacceptable Performance (PUP)
Total number of residences at risk of coastal flooding
Risk register
36

Indicators Overview
Reported number of properties experiencing flooding
Percentage of total area served by stormwater ponds
Number of combined sewer overflows
Percentage of people with high levels of social support
Percent compliance with municipal mandatory downspout disconnection program
Number of city facilities offering extended hours during summer and shoulder season
Number of planning mechanisms implemented to protect against flooding
Annual cost of road maintenance
Total number of emergency responders
Spatial location of green space
Use of climate change adaptation terminology in plans or policies
37

Indicators Overview
Part 1: Percentage of implemented adaptation actions
Part 2: Number of measures that indirectly address adaptation
Annual change in wetland area
Percentage of population under water quality advisory
Local renewable energy projects and kilowatt capacity
Percentage of land in food production
Estimated percentage of water loss in distribution system
Change in integrated stormwater management plans
Rating of water quality measurements
Number of weather related transit service disruptions
38

Final Thoughts…
• Examining the applicability of emerging sustainability to adaptation could further our understanding of how we can measure adaptation progress
• As adaptation remains an evolving field, sector agencies need to measure progress in an ongoing and consistent fashion that is resource efficient, appropriate to their unique adaptation actions and local climate impacts
• The continual emergence of new and interesting indicators is anticipated as we progress into a more erratic climate future.
• Focus on the attainment of a set level of a certain indicator runs counterproductive to the iterative organizational and behavioral changes required for the successful implementation of adaptation strategies
39

Ewa JacksonICLEI [email protected]
Kevin BehanClean Air [email protected]
This project was made possible with support from Natural Resources Canada through the Adaptation Platform
40