measuring principals’ effectiveness: results from new … · 2016-11-21 · principals; however,...
TRANSCRIPT

May 2015
Making Connections
Measuring principals’ effectiveness:Results from New Jersey’s principal evaluation pilot
Christine Ross Mariesa Herrmann
Megan Hague Angus Mathematica Policy Research
Key findings
• The developers of the principal practice instruments used by pilot districts pro
vided partial information about the instruments’ reliability (consistency across
raters and observations) and validity (accurate measurement of true principal
performance).
• Principal practice ratings varied across the possible score range in the pilot year,
indicating that the measures have the potential to differentiate performance among
principals; however, most principals received ratings of effective or highly effective.
• School median student growth percentiles, which measure student achievement
growth during the school year, exhibit year-to-year stability even when the school
changes principals. This may reflect persistent school characteristics, suggest
ing a need to investigate whether other evaluation measures could more closely
gauge principals’ contributions to student achievement growth.
• School median student growth percentiles correlate with student disadvantage,
a relationship that warrants further investigation using statewide evaluation data.
At ICF InternationalU . S . D e p a r t m e n t o f E d u c a t i o n

U.S. Department of Education Arne Duncan, Secretary
Institute of Education Sciences Sue Betka, Acting Director
National Center for Education Evaluation and Regional Assistance Ruth Curran Neild, Commissioner Joy Lesnick, Associate Commissioner Amy Johnson, Action Editor Felicia Sanders, Project Officer
REL 2015–089
The National Center for Education Evaluation and Regional Assistance (NCEE) conducts unbiased large-scale evaluations of education programs and practices supported by federal funds; provides research-based technical assistance to educators and policymakers; and supports the synthesis and the widespread dissemination of the results of research and evaluation throughout the United States.
May 2015
This report was prepared for the Institute of Education Sciences (IES) under Contract ED-IES-12-C-0006 by Regional Educational Laboratory Mid-Atlantic administered by ICF International. The content of the publication does not necessarily reflect the views or policies of IES or the U.S. Department of Education, nor does mention of trade names, commercial products, or organizations imply endorsement by the U.S. Government.
This REL report is in the public domain. While permission to reprint this publication is not necessary, it should be cited as:
Ross, C., Herrmann, M., & Angus, M. H. (2015). Measuring principals’ effectiveness: Results from New Jersey’s principal evaluation pilot (REL 2015–089). Washington, DC: U.S. Department of Education, Institute of Education Sciences, National Center for Education Evaluation and Regional Assistance, Regional Educational Laboratory Mid-Atlantic. Retrieved from http://ies.ed.gov/ncee/edlabs.
This report is available on the Regional Educational Laboratory website at http://ies.ed.gov/ ncee/edlabs.
Summary
States and districts across the country are implementing new principal evaluation systems that include measures of the quality of principals’ school leadership practices and measures of student achievement growth. Because the systems will be used for high-stakes decisions, it is important that the component measures of the evaluation systems fairly and accurately differentiate between effective and ineffective principals. This requires the measures to be reliable (consistent across raters and observations) and valid (accurately measuring true principal performance).
New Jersey has implemented a new principal evaluation system to improve principal effectiveness, beginning with a pilot in 2012/13 in 14 school districts across the state. This report examines data from the pilot year to describe the component measures used to evaluate principals in New Jersey. Half a principal’s summative rating is composed of measures of practice, with the largest share (40 percent) coming from a principal practice instrument selected or developed by the district, and half is composed of measures of student achievement. School median student growth percentiles—measures of student achievement growth on state assessments in English language arts and math—are the most common measure used across districts and account for 20 percent of the summative rating for principals of schools with grades 4–8.
The study examines three statistical properties of the component measures used in principal evaluations: their variation across principals, their year-to-year stability, and the associations between ratings on the component measures of the evaluation system and the characteristics of students in the schools. Information about the properties of the measures can inform modifications of the principal evaluation system or revisions to the guidance given to districts.
Key findings: • The developers of principal practice instruments provided partial information
about their instruments’ reliability and validity. • Principal practice ratings varied across the possible score range in the pilot year,
indicating that the measures have the potential to differentiate performance among principals; however, most principals received ratings of effective or highly effective.
• School median student growth percentiles, which measure student achievement growth during the school year, exhibit year-to-year stability even when the school changes principals. This may reflect persistent school characteristics, suggesting a need to investigate whether other measures could more closely gauge principals’ contributions to student achievement growth.
• School median student growth percentiles correlate with student disadvantage, a relationship that warrants further investigation using statewide evaluation data.
i

Contents
Summary i
Why this study? 1
What the study examined 3
What the study found 6 The developers of the principal practice instruments provided partial information on
reliability and validity 6 Variation in ratings on the component measures 7 Changes in school median student growth percentiles and school median student growth
percentile ratings across years 12 Correlations between ratings and student characteristics 15
Implications of the study findings 16
Limitations of the study 17
Appendix A. Description of districts participating in the pilot A-1
Appendix B. Data used in the study B-1
Appendix C. Design of the principal evaluation system and component measures selected by pilot districts C-1
Appendix D. Variation in ratings on the component measures D-1
Notes Notes-1
References Ref-1
Boxes 1 Component measures of New Jersey’s principal evaluation system 2 2 Data and methods 4 C1 New Jersey Department of Education criteria for principal practice instruments C-1 C2 Example of guidance for setting principal goals C-10
Figures 1 Most principals received a principal practice rating of 3 or higher in 2012/13, and ratings
were concentrated at 2 and 3 8 2 Most principals received a human capital management responsibilities rating of 3 in 2012/13 9 3 Most principals statewide received a school median student growth percentile rating of
3 or higher in 2012/13 10 4 In pilot districts school median student growth percentile ratings varied less than
principal practice instrument ratings in 2012/13 11 5 Most principals received a principal goal rating of 3 or higher in 2012/13 12
ii

6 School median student growth percentiles statewide were more stable for larger schools than for smaller schools 13
A1 A higher percentage of principals received an ineffective or partially effective school median student growth percentile rating in pilot districts than in all districts statewide in 2012/13 A-3
C1 Component measures and their weights in summative evaluation ratings changed between the pilot and statewide years C-2
C2 Principal practice instruments selected by pilot districts for use in 2012/13 were similar to those selected by districts statewide for use in 2013/14 C-3
C3 Evaluators in half the pilot districts received 11–30 hours of training C-8 C4 Transformation of school median student growth percentiles into school median
student growth percentile ratings C-12 C5 Effectiveness rating categories corresponding to summative evaluation scores C-13
Tables 1 Developers provided partial information about the validity and reliability of their
principal evaluation instruments 7 2 School median student growth percentile ratings were relatively stable across years
among principals who remained in the same school 14 3 School median student growth percentiles and school median student growth
percentile ratings had statistically significant negative correlations with the schoolwide percentage of economically disadvantaged students in 2012/13 15
A1 Number of schools and students in New Jersey districts participating in principal evaluation pilot in 2012/13 A-1
A2 Student background characteristics of New Jersey districts participating in principal evaluation pilot in 2012/13 A-2
B1 Number of districts that provided information on each evaluation rating in 2012/13 B-2 B2 Number of districts, schools, and principals with school median student growth
percentiles in 2012/13 B-3 C1 Pilot districts using each principal practice instrument and the number of schools in
those districts, 2012/13 C-4 C2 The number of domains, items, and rating levels varies across selected principal
practice instruments C-5 C3 Domains of selected principal practice instruments C-5 C4 Developers recommend multiple observations and meetings between principal and
evaluator to support ratings on the practice instruments C-6 C5 Selected principal practice instruments require at least one day of training by
developers and staff; certification is optional or not defined C-7 C6 The most common approach to calculating summative ratings in the pilot year was to
rely entirely on the principal practice instrument rating, 2012/13 C-13 D1 Summary statistics for principal evaluation ratings and school median student growth
percentiles, 2012/13 D-1 D2 Percentage of principals in each performance category, 2012/13 D-2
iii

Why this study?
States and districts across the country are implementing new principal evaluation systems that include measures of the quality of principals’ school leadership practices and measures of student achievement growth. These evaluation systems will be used to inform career decisions as well as decisions about professional development. Since 2012, 43 states and the District of Columbia have committed to implementing such principal evaluation systems as part of the U.S. Department of Education’s grant of flexibility related to provisions of the Elementary and Secondary Education Act. Federal grant programs, such as Race to the Top, School Improvement Grants, and the Teacher Incentive Fund, also support the reform of principal evaluation.
States and districts implementing new principal evaluation systems must select or develop the component measures of their system. Because the systems will be used for high-stakes decisions, it is important that the measures fairly and accurately differentiate between effective and ineffective principals. This requires that the measures be reliable (consistent across raters and observations) and valid (accurately measuring true principal performance). But the research base on the reliability and validity of principal evaluation measures is thin. A review of principal practice instruments found that only 2 of 65 instruments documented reliability or validity (Goldring et al., 2009).
Like many states and districts, New Jersey has implemented a new principal evaluation system to help improve principal effectiveness. In its request for grant proposals from districts to pilot the new evaluation system, New Jersey cited four goals: help districts systematically and accurately gauge the effectiveness of principals, improve principals’ effectiveness by clarifying expectations for performance, support districts in creating schoolwide and systemwide collaborative cultures, and enable districts to improve personnel decisions concerning school leadership (New Jersey Department of Education, 2012b). In 2012/13, 14 school districts piloted a principal evaluation system in which half a principal’s evaluation rating was based on measures of practice and half was based on measures of student achievement (see appendix A for a description of the participating districts and box 1 for details of the component measures used in the evaluation system).
The purpose of the principal evaluation pilot was to provide the New Jersey Department of Education information about the implementation of the new evaluation system and advice to inform the statewide rollout. The department has already received information about implementation challenges and recommendations on component measures from the Evaluation Pilot Advisory Committee (New Jersey Department of Education, 2013a,b) and from staff in pilot districts. The department used this information to modify the design of the evaluation system and to revise the guidance it had provided to districts for the statewide rollout. At that time, evaluation data from the pilot districts were not yet available. As a member of the Principal Evaluation Research Alliance of Regional Educational Laboratory (REL) Mid-Atlantic, the department asked the REL to systematically analyze data from the pilot year of the principal evaluation system.
States and districts implementing new principal evaluation systems must select or develop the component measures of their system, but the research base on the reliability and validity of principal evaluation measures is thin
1

Box 1. Component measures of New Jersey’s principal evaluation system
Pilot districts selected or developed two component measures of principal practice and several
component measures of goals based on student achievement during 2012/13. Each measure
yielded a rating on a 1–4 scale (corresponding to performance levels of ineffective, partially
effective, effective, or highly effective). During the pilot year the New Jersey Department of
Education provided additional guidance to districts on the measures and refined the design
of the evaluation system for the statewide year. The pilot year data enabled the study team to
analyze measures used in the pilot year as well as the school median student growth percen
tile ratings developed for use in the following year.
Pilot measures of principal practice
Principal practice instrument (40 percent of the summative rating). Districts were asked to select
or develop a research-based or evidence-supported principal practice instrument that measures
domains of practice aligned to the principal practice standards developed by the Interstate
School Leadership Licensure Consortium (Council of Chief State School Officers, 2008).
Human capital management responsibilities (10 percent of the summative rating). Districts were
asked to select their own measure of how well principals supervise, evaluate, and support teach
ing staff; recruit and retain effective teachers; and help ineffective teachers leave the school.
Pilot measures of student achievement
School student achievement (20 percent of the summative rating). This rating was based on
school achievement on state assessments: for elementary schools, school median student
growth percentiles in English language arts and math on the New Jersey Assessment of Skills
and Knowledge for grades 4–8, and for high schools, changes in proficiency rates on the
state’s High School Proficiency Assessment.
Aggregated school student achievement goals in nontested areas (15 percent of the summative
rating). Principals were rated based on how well they met student achievement goals for two
student outcome areas without state tests. These goals were to be developed by principals
jointly with their evaluators and were to be strategic as well as specific, measurable, attain
able, results-based, and time-bound—for example, to increase student proficiency on school
science achievement tasks by a specific percentage.
School-specific student subgroup achievement goals (15 percent of the summative rating). Prin
cipals and their evaluators set two additional specific, measurable, attainable, results-based,
and time-bound goals. At least one had to be based on the academic achievement of student
subgroups (for example, reducing by a specific percentage the achievement gap on state
assessments between native English speakers and English learner students1). Principals could
also set one goal for students’ nonacademic achievement, such as increasing average monthly
student attendance by the end of the school year.
Measures developed or refined during the pilot year
School median student growth percentile ratings. The New Jersey Department of Education
established ratings on a 1–4 scale associated with each school median student growth per
centile and reduced the weight on the rating for schools where the student growth percentiles
are available for only one grade of students.
(continued)
Pilot districts selected or developed two component measures of principal practice and several component measures of goals based on student achievement during 2012/13
2

Box 1. Component measures of New Jersey’s principal evaluation system (continued)
Evaluation leadership. The New Jersey Department of Education replaced the district-selected
measure of human capital management responsibilities with an instrument for rating evalua
tion leadership.
Administrator goals. The New Jersey Department of Education replaced the two specific types
of student achievement goal measures (school student achievement goals and school-specific
student subgroup achievement goals) with a single administrator goal measure that entails
setting one or two student achievement goals.
Teacher student growth objective average. The New Jersey Department of Education added
a principal rating based on the average rating teachers achieved on their student growth
objectives.
Note 1. The New Jersey Department of Education uses the term “limited English proficient student” rather than “English learner student.”
What the study examined
This study describes the component measures used in principal evaluation in the pilot year 2012/13 and examines three of their statistical properties: their variation across principals, their year-to-year stability, and the associations between ratings on the component measures of the evaluation system and the characteristics of students in the schools (see box 2 for an overview of the study’s data and methods). Information about the properties of the measures can inform modifications of the design of the principal evaluation system or revisions to the guidance given to districts. However, the data do not allow an empirical test of the validity of the component measures because the data do not support the construction of an independent measure of principal performance or of principals’ impacts on student achievement; thus, they can provide only indirect evidence about validity.
The study addressed four research questions, three descriptive and one correlational:
1. What did developers of the principal practice instruments used by pilot districts report about their instruments’ reliability and validity?
2. To what extent did ratings on each of the component measures vary across principals?
3. What does the variation in school median student growth percentiles and their ratings across schools and in the same schools across years suggest regarding the reliability and validity of these measures?
4. What were the correlations between the principal ratings on the component measures and school measures of student disadvantage?
Districts had considerable latitude to select principal practice instruments, and most districts selected commercially available instruments that other states and districts might be considering. Information that developers reported about the reliability and validity of the instruments is useful for policymakers contemplating using them.
This study describes the component measures used in principal evaluations in 2012/13 and examines three of the components’ statistical properties: their variation across principals, their year-to-year stability, and the associations between ratings on the component measures of the evaluation system and the characteristics of students in the schools
3

Box 2. Data and methods
Data
The data for the study included information on the principal practice instruments that pilot dis
tricts reported to the New Jersey Department of Education, information provided by developers
of the instruments to the study team, principal evaluation ratings reported by districts to the
New Jersey Department of Education, principals’ job assignments, and publicly available data
on school-level student achievement growth (school median student growth percentiles) and
background characteristics (see appendix B for a detailed description of each data source).
Data on the principal practice instruments were used to address research question 1.
New Jersey Department of Education staff collected data on instrument implementation from
staff in the 14 pilot districts in 2012/13. Information about the six commercially available
principal practice instruments and the one district-developed instrument was collected from
publicly available sources and sent to the instrument developers for verification. Five develop
ers of commercially available instruments responded.
Data on the principal evaluation ratings reported by districts to the New Jersey Depart
ment of Education were used to address research questions 2 and 4. The data are from the
2012/13 pilot year, though only 10 of the 14 pilot districts provided data on at least one of the
component measures. The number of districts reporting ratings varied across component mea
sures from 2 (16 principals) that provided human capital management responsibility ratings to
10 (192 principals) that provided principal practice instrument ratings. The number of princi
pals included in each analysis varies based on data availability.
Data on principals’ job assignments covered all principals in New Jersey from 2011/12 to
2012/13 and were used to address research questions 2, 3, and 4. The data linked principals
to the student growth percentiles of the schools they led and to the background characteris
tics of those schools. The data also made it possible to identify principals who were new to
their schools.
Data on school median student growth percentiles and ratings were used to address
research questions 2, 3, and 4. The school median student growth percentile data are avail
able for all schools in New Jersey that had students in grades 4–8 from 2011/12 to 2012/13
(1,742 schools).
Data on student background characteristics were used to address research question 4.
The student background data covered all schools in New Jersey in 2012/13.
Methods
Analyses to address research question 1 described information provided by developers about
the principal practice instruments.
Analyses to address research question 2 described the distribution of principal evaluation
ratings on each component measure and the distribution of school median student growth
percentiles. The distribution of ratings on a component measure was characterized by the
percentage of principals rated in different intervals on the 1–4 point scale. The distribution of
school median student growth percentiles was characterized by the percentage of schools in
different intervals of the 0–100 percentile scale.
Analyses to address research question 3 described the relationship between school
median student growth percentiles in 2011/12 and 2012/13 for principals who were in the
same schools in both years and for principals who were new to their schools in 2012/13.
These analyses also described the relationship between the school median student growth
(continued)
4
Box 2. Data and methods (continued)
percentile ratings in 2011/12 and 2012/13 for principals who were in the same schools in
both years.
Analyses to address research question 4 examined the relationship between principal eval
uation ratings (including school median student growth percentile ratings) and two measures of
student disadvantage: the percentages of economically disadvantaged and English learner stu
dents in the school. These relationships were measured using a Pearson correlation coefficient.
The variation in ratings on each of the component measures indicates whether the measure has the potential to differentiate between highly effective and ineffective principals. Principals vary in their effectiveness at increasing student achievement (Branch, Hanushek, & Rivkin, 2012; Chiang, Lipscomb, & Gill, in press; Coelli & Green, 2012; Dhuey & Smith, 2012, 2014). Thus, if these component measures of the principal evaluation system are expected to gauge principals’ effectiveness at raising student achievement, ratings on each of the component measures would also be expected to differ across principals.
A good measure of principal performance should be reliable; that is, it should not show large measurement error. Available data do not allow a direct calculation of the reliability of school median student growth percentile scores or resultant school median student growth percentile ratings. Nevertheless, the year-to-year stability of school median student growth percentiles as a measure of student achievement growth can be assessed and sheds some light on the measure’s reliability. In particular, if small schools show substantially more year-to-year variation than large schools do, measurement error (rather than true change in performance) is the likely explanation.
A good measure of principal performance should also be valid—that is, it should be a fair measure of the true performance of the principal, distinguishing principal-specific factors from the factors of school performance that are outside the principal’s control. Yet school median student growth percentiles (and the ratings derived from them) may reflect not just principal performance, but other school factors that are difficult to change in a single year (such as neighborhood quality and the quality of teaching staff). Existing data are insufficient for a full assessment of the extent to which the school median student growth percentile measure captures principal performance, but the data can be used for an exploratory analysis that sheds light on the question. In particular, schools that change principals should experience more variation in a measure of principal effectiveness from one principal to the next than should schools that keep the same principal. Thus, if schools that keep the same principal show as much year-to-year variation in school median student growth percentiles as schools that change principals, persistent school factors and measurement error likely account for a larger share of the school median student growth percentile in a single year than true principal performance does.
The correlations between the principal ratings on the component measures and school measures of student disadvantage are of interest because they could provide information about bias in the component measures or the distribution of effective principals among schools in New Jersey. Negative correlations between principal ratings and measures of student disadvantage might suggest that the ratings are biased against principals of schools with more disadvantaged students. This could occur if, for example, evaluators’ judgments
The correlations between the principal ratings on the component measures and school measures of student disadvantage could provide information about bias in the component measures or the distribution of effective principals among schools in New Jersey
5

about the principal were influenced by student achievement levels, which in turn are related to levels of student disadvantage. But negative correlations between component measure ratings and measures of student disadvantage do not necessarily imply bias; less effective principals might actually be serving schools with more disadvantaged students. Although neither of these explanations can be confirmed without more data, the existence of such correlations would highlight the need for further investigation.
What the study found
This section details the findings related to the study’s four research questions.
The developers of the principal practice instruments provided partial information on reliability and validity
The New Jersey Department of Education required pilot districts to select or develop principal practice instruments that were aligned with the Interstate School Leadership Licensure Consortium standards and that were reliable and valid (see appendix C for details about the requirements for principal practice instruments). This section describes information about reliability and validity reported by developers of the seven principal practice instruments selected or developed by the 14 pilot districts (see appendix C for more details about these principal practice instruments).
The developers of the principal practice instruments provided partial information on reliability and validity. As required for approval for use in principal evaluations in New Jersey, all the instrument developers demonstrated to the New Jersey Department of Education that the instruments aligned with the Interstate School Leadership Licensure Consortium standards. Six of the developers of principal practice instruments stated that the instruments were informed by research on the relationship between principal practice and student achievement.
The study team was unable to independently examine the reliability and validity of the principal practice instruments because of limitations in the data reported by districts to the New Jersey Department of Education. Accordingly, the study team sought information on the reliability and validity of principal practice instruments from the instrument developers.
The instrument developers provided partial information regarding the reliability and validity of the practice instruments (table 1). Five of the six developers that said that the instruments are research based cited specific research on principal practice and student achievement that informed the construction and revision of items in the instruments (see appendix C for specific citations provided by the developers). Internal consistency reliability (the degree to which different parts of the principal practice instrument come to similar conclusions about a principal’s effectiveness) was confirmed by one instrument developer. Inter-rater reliability (the degree of agreement among raters) is important to ensure that principals are rated accurately. Yet only one developer provided standards for acceptable levels of inter-rater reliability or the training necessary to meet such standards. Three other developers offer ongoing inter-rater reliability refresher training but do not define standards for inter-rater reliability. None of the instrument developers reported completing any studies relating scores on the principal practice instruments with concurrent measures of principal effectiveness based on student achievement growth or other student outcomes.
Five of the six developers of the principal practice instruments piloted in New Jersey that said that the instruments are research based cited specific research on principal practice and student achievement that informed the construction and revision of items in the instruments
6

-
Table 1. Developers provided partial information about the validity and reliability of their principal evaluation instruments
Instrument Validity Internal consistency reliability Inter rater reliability
Focal Point Principal Evaluation Developed based on effective No information available. Focal Point team conducts Instrument school leadership and effective regular inter-rater reliability
schools research. sessions before and after each session with client. Evaluators are coached and then evaluated after each of four coaching cycles.
Marshall Principal Evaluation Developed based on effective No information available. No information available. Rubric school leadership and effective
schools research.
Marzano School Leader Developed based on research No information available. Ongoing training regarding Evaluation Model on principal practices that inter-rater reliability is provided.
correlate with student achievement.
McREL International: Principal Evaluation System
Developed based on meta-analyses of research on school leadership and student achievement.
No information available. No information available.
Multidimensional Principal Performance Rubric
Developed based on research on principal practices and school improvement as well as the Interstate School Leadership Licensure Consortium standards. Statistical analyses of validity in progress.
Analyses in progress. No information available.
Newark Public Schools Leadership Frameworka
No information available. No information available. The district’s evaluators participated in inter-rater reliability exercises throughout the pilot year.
Stronge Leader Effectiveness Performance Evaluation System
Developed based on research on principal effectiveness.
Reliability of one component measure (a climate survey) is 0.87–0.93; overall instrument reliability has not been evaluated.
Optional inter-rater reliability training requires a minimum of 66 percent reliability on each of two simulations. Alternatively, districts may elect to require 75 percent reliability on each simulation.
a. The developer did not respond to multiple requests for verification.
Source: Instrument developers’ websites, verified through personal correspondence.
Variation in ratings on the component measures
Principals vary in their effectiveness at increasing student achievement (Branch et al., 2012; Chiang et al., in press; Coelli & Green, 2012; Dhuey & Smith, 2012, 2014). A principal effectiveness measure therefore should, at minimum, be able to distinguish among principals.
This section analyzes variation in each component measure: principal practice instrument ratings, human capital management responsibilities ratings, school median student growth percentiles and ratings, and principal goal ratings. It also describes the percentage of principals in each performance category: ineffective (a rating of 1.00–1.84), partially effective
7

1.00
–1.2
4
1.25
–1.4
9
1.50
–1.7
4
1.75
–1.9
9
2.00
–2.2
4
2.25
–2.4
9
2.50
–2.7
4
2.75
–2.9
9
3.00
–3.2
4
3.25
–3.4
9
3.50
–3.7
4
3.75
–4.0
0
(a rating of 1.85–2.64), effective (a rating of 2.65–3.49), and highly effective (a rating of 3.50–4.00; see appendix C for more information about the component measures and the performance categories and appendix D for more information on variation in component measure ratings).
Principal practice ratings varied across the possible score range in the pilot year, indicating that the measures have the potential to differentiate performance among principals; however, most principals received ratings of effective or highly effective. More than 62 percent of principals in the pilot districts received a principal practice rating of 3 or higher (figure 1). In the pilot year principals received scores across the full range of ratings (1–4). Most principals received a rating on the higher end of the scale: the average was 2.9. If the performance category thresholds for the summative ratings were applied to the principal practice ratings, about 46 percent of principals would be rated as effective and 21 percent as highly effective. However, a sizable minority of principals (30 percent) would be rated as partially effective and 3 percent as ineffective.
Four of the districts reported the principal practice ratings in discrete values, compressing the variation in ratings possible based on averaging the scores of each item in the practice instrument. As a result, principal practice ratings were clustered at discrete values, such as 2 and 3 (see figure 1). Approximately 47 percent of principals received one of these two values, with 17 percent receiving a 2 and 30 percent receiving a 3.1 Many principal practice instruments assign performance categories based on the range in which the average item score falls, so it should be possible for many districts to report the rating as an average item score itself.
In the pilot year most principals received a principal practice rating of 3 or higher
Figure 1. Most principals received a principal practice rating of 3 or higher in 2012/13, and ratings were concentrated at 2 and 3
Percent of principals
50
40
30
20
10
Ineffective P ar tially effective
Effective Highly effective
Practice rating
Note: The number of principals with a principal practice rating was 192. The average rating was 2.9, with a standard deviation of 0.6.
Source: Authors’ calculations based on data from the New Jersey Department of Education.
8
0

80
1.00
–1.2
4
1.25
–1.4
9
1.50
–1.7
4
1.75
–1.9
9
2.00
–2.2
4
2.25
–2.4
9
2.50
–2.7
4
2.75
–2.9
9
3.00
–3.2
4
3.25
–3.4
9
3.50
–3.7
4
3.75
–4.0
0
Figure 2. Most principals received a human capital management responsibilities rating of 3 in 2012/13
Percent of principals
Ineffective P ar tially effective
Effective Highly effective
60
40
In the two 20 districts that
rated principals on human capital
0 management responsibilities in the pilot year, 56 percent of principals received a rating of exactly 3
Human capital management responsibilities rating
Note: The number of principals with a human capital management responsibilities rating was 16. The average rating was 2.9, with a standard deviation of 0.2.
Source: Authors’ calculations based on data from the New Jersey Department of Education.
Most principals received a human capital management responsibilities rating of 3. Only two districts rated principals on human capital management responsibilities in the pilot year, and in these districts 56 percent of principals received a rating of exactly 3 (figure 2). The low number (16) of principals rated on this component measure limits the conclusions that can be drawn. Within this small sample, the range of the human capital management responsibilities ratings was limited (2.3–3.3). If the performance category thresholds for the summative ratings were applied to the human capital management responsibilities ratings, 81 percent of principals would be rated as effective and 19 percent as partially effective.
Most principals statewide received a school median student growth percentile rating of 3 or higher based on the state’s conversion formula. School median student growth percentiles varied substantially across the state and were approximately normally distributed, with an average of 50 and a standard deviation of 10 (figure 3, top panel). The study team converted school median student growth percentiles into ratings using the formula adopted by the New Jersey Department of Education for both principals and teachers (see figure C4 in appendix C).2 This formula compresses variation in the school median student growth percentiles, particularly for school median student growth percentiles in the middle of the distribution (see appendix C for more details). Principals with a school median student growth percentile from the 45th to the 55th percentile are assigned a rating of 3.
More than 74 percent of principals statewide in 2012/13 received a school median student growth percentile rating of 3 or higher (see figure 3, bottom panel). The average rating was 3. Some 44 percent of principals had a school median student growth percentile of 45–55 and received a school median student growth percentile rating of exactly 3. If the performance category thresholds for the summative ratings were applied to the school median
9

0–4 5–
9 10
–14
15–1
9
20–2
4
25–2
9
30–3
4
35–3
9
40–4
4
45–4
9
50–5
4
55–5
9
60–6
4
65–6
9
70–7
4
75–7
9
80–8
4
85–8
9
90–9
4
95–1
00
3.00
3.01
–3.2
4
3.25
–3.4
9
3.50
–3.7
4
3.75
–4.0
0
1.00
–1.2
4
1.25
–1.4
9
1.50
–1.7
4
1.75
–1.9
9
2.00
–2.2
4
2.25
–2.4
9
2.50
–2.7
4
2.75
–2.9
9
Figure 3. Most principals statewide received a school median student growth percentile rating of 3 or higher in 2012/13
Percent of principals
More than 74 percent of principals statewide in
0
10
20
30
2012/13 received a school median student growth
Statewide distribution of school median student growth percentiles percentile rating of 3 or higher
Percent of principals
50 Ineffective P ar tially
effective Effective Highly
effective
40
30
20
10
0
Statewide distribution of school median student growth percentile ratings
Note: The number of principals with a school median student growth percentile was 1,742. The average school median student growth percentile was 50.4, with a standard deviation of 9.6. The average school median student growth percentile rating was 3.0, with a standard deviation of 0.3.
Source: Authors’ calculations based on data from the New Jersey Department of Education.
student growth percentile ratings, about 82 percent of principals would be rated as effective and 7 percent as highly effective. Few principals would be rated as partially effective (9 percent) or ineffective (2 percent). Thus, variation in school median student growth percentile ratings was limited, despite considerable variation in school median student growth percentiles.
10

The limited variation in school median student growth percentile ratings results from both the underlying distribution of school median student growth percentiles and the formula that converts school median student growth percentiles into school median student growth percentile ratings. That formula was developed to convert teacher median student growth percentiles into teacher median student growth percentile ratings and was adopted for principals. Because school median student growth percentiles are based on more students than teacher median student growth percentiles are, school student growth percentiles are typically less variable than teacher student growth percentiles. Using the same conversion formula for principals and teachers means that a smaller percentage of principals than teachers will have a median student growth percentile that results in either a very low or very high rating.
In pilot districts principals’ school median student growth percentile ratings varied less than principal practice instrument ratings. For principals who received both school median student growth percentile ratings and principal practice instrument ratings (the two ratings for which the most data were available), the average ratings were about the same: 2.9 compared with 2.8. But school median student growth percentile ratings had less variation (with a standard deviation of 0.5, compared with 0.7 for principal practice instrument ratings). Fewer principals were rated as either highly effective or partially effective on school median student growth percentiles than on principal practice instruments (figure 4).
Most principals received a principal goal rating of 3 or higher. Only four districts provided information on principal goal ratings in the pilot year. In these districts 89 percent of
For principals who received both school median student growth percentile ratings and principal practice instrument ratings, the average ratings were about the same, but school median student growth percentile ratings had less variation
Figure 4. In pilot districts school median student growth percentile ratings varied less than principal practice instrument ratings in 2012/13
Percent of principals
Ineffective (1.00–1.84) Partially effective (1.85–2.64) Effective (2.65–3.49) Highly effective (3.50–4.00)
100
75
50
25
0 School median student growth percentile rating Principal practice instrument rating
Principal ratings
Note: The number of principals with both ratings was 131. The average school median student growth percentile rating was 2.8, with a standard deviation of 0.5. The average principal practice instrument rating was 2.9, with a standard deviation of 0.7.
Source: Authors’ calculations based on data from the New Jersey Department of Education.
11
80
1.00
–1.2
4
1.25
–1.4
9
1.50
–1.7
4
1.75
–1.9
9
2.00
–2.2
4
2.25
–2.4
9
2.50
–2.7
4
2.75
–2.9
9
3.00
–3.2
4
3.25
–3.4
9
3.50
–3.7
4
3.75
–4.0
0
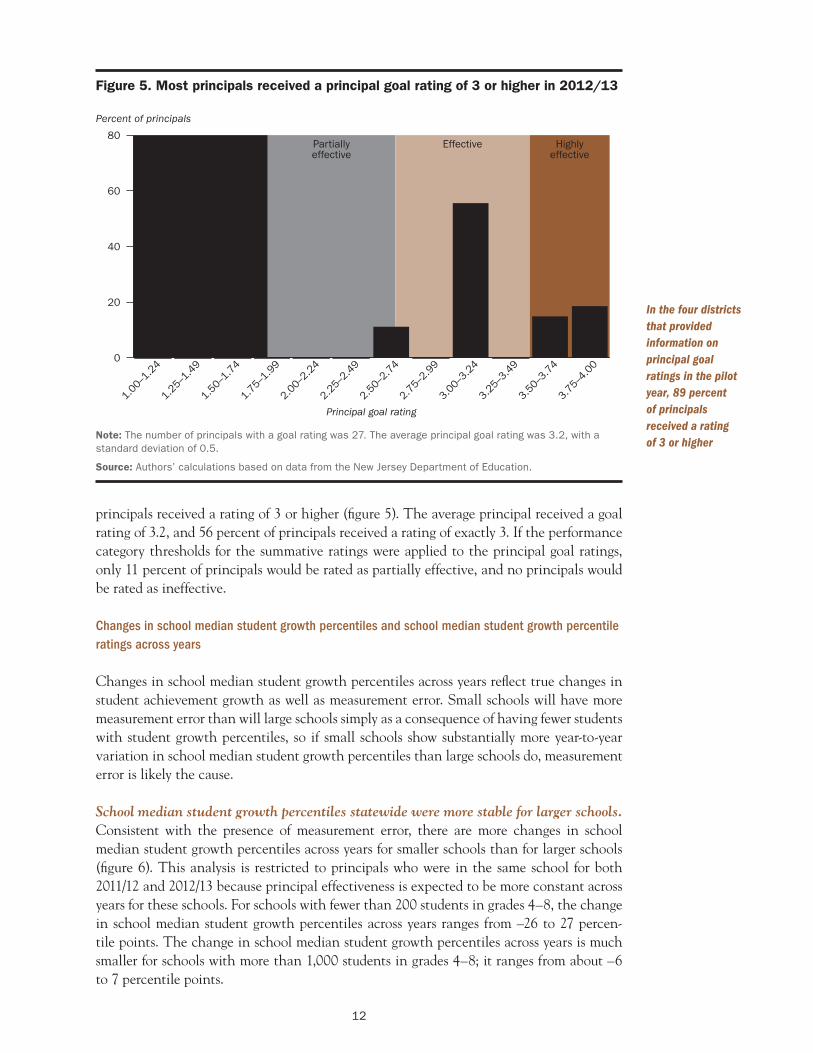
Figure 5. Most principals received a principal goal rating of 3 or higher in 2012/13
Percent of principals
60
40
20 In the four districts that provided information on
Ineffective P ar tially effective
Effective Highly effective
0
Principal goal rating
principal goal ratings in the pilot year, 89 percent of principals received a rating
Note: The number of principals with a goal rating was 27. The average principal goal rating was 3.2, with a of 3 or higher standard deviation of 0.5.
Source: Authors’ calculations based on data from the New Jersey Department of Education.
principals received a rating of 3 or higher (figure 5). The average principal received a goal rating of 3.2, and 56 percent of principals received a rating of exactly 3. If the performance category thresholds for the summative ratings were applied to the principal goal ratings, only 11 percent of principals would be rated as partially effective, and no principals would be rated as ineffective.
Changes in school median student growth percentiles and school median student growth percentile ratings across years
Changes in school median student growth percentiles across years reflect true changes in student achievement growth as well as measurement error. Small schools will have more measurement error than will large schools simply as a consequence of having fewer students with student growth percentiles, so if small schools show substantially more year-to-year variation in school median student growth percentiles than large schools do, measurement error is likely the cause.
School median student growth percentiles statewide were more stable for larger schools. Consistent with the presence of measurement error, there are more changes in school median student growth percentiles across years for smaller schools than for larger schools (figure 6). This analysis is restricted to principals who were in the same school for both 2011/12 and 2012/13 because principal effectiveness is expected to be more constant across years for these schools. For schools with fewer than 200 students in grades 4–8, the change in school median student growth percentiles across years ranges from –26 to 27 percentile points. The change in school median student growth percentiles across years is much smaller for schools with more than 1,000 students in grades 4–8; it ranges from about –6 to 7 percentile points.
12

Figure 6. School median student growth percentiles statewide were more stable for larger schools than for smaller schools
Change in school median student growth percentile from 2011/12 to 2012/13 (percentile points)
30
15
0
–15
–30 0 500 1,000 1,500 2,000
Number of students in grades 4–8
Note: The number of principals who were in the same school in 2011/12 and 2012/13 was 1,374.
Source: Authors’ calculations based on data from the New Jersey Department of Education.
The greater measurement error for smaller schools supports the New Jersey Department of Education policy (for 2013/14 and later) of giving lower weight to school median student growth percentiles in schools where only one grade has students with student growth percentiles (20 percent) than in schools where multiple grades do (30 percent). However, the number of grades is only a rough proxy for the number of students, which is what matters for measurement error. Although on average, schools with student growth percentiles for multiple grades have more students in those grades (309) than schools with student growth percentiles for a single grade (105) do, the range of the number of students in grades with student growth percentiles overlaps for both groups (26–1,891 for schools with student growth percentiles for multiple grades and 20–666 for schools with student growth percentiles for a single grade). Thus, to reduce the impact of measurement error on principal summative ratings, a more direct approach would be based on the number of students in grades with student growth percentiles rather than the number of grades with student growth percentiles.
Like school median student growth percentiles, school median student growth percentile ratings statewide were relatively stable across years for principals who remained in the same school. Among the 82 percent of principals who remained in the same school in 2011/12 and 2012/13 and who received a school median student growth percentile rating of effective, 73 percent were rated effective in both years (table 2). About 6 percent of principals received a rating of partially effective or ineffective in two consecutive years, and less than 1 percent received a rating of ineffective in both years. The stability of the school median student growth percentile ratings across years suggests that principals are likely to receive the same rating in each year.
A valid measure of principal effectiveness gauges the true performance of the principal, distinguishing principal-specific factors from the factors of school performance that are
There are more changes in school median student growth percentiles across years for smaller schools than for larger schools, supporting the policy of giving lower weight to this measure in schools where only one grade has student growth percentiles than in schools where multiple grades do
13
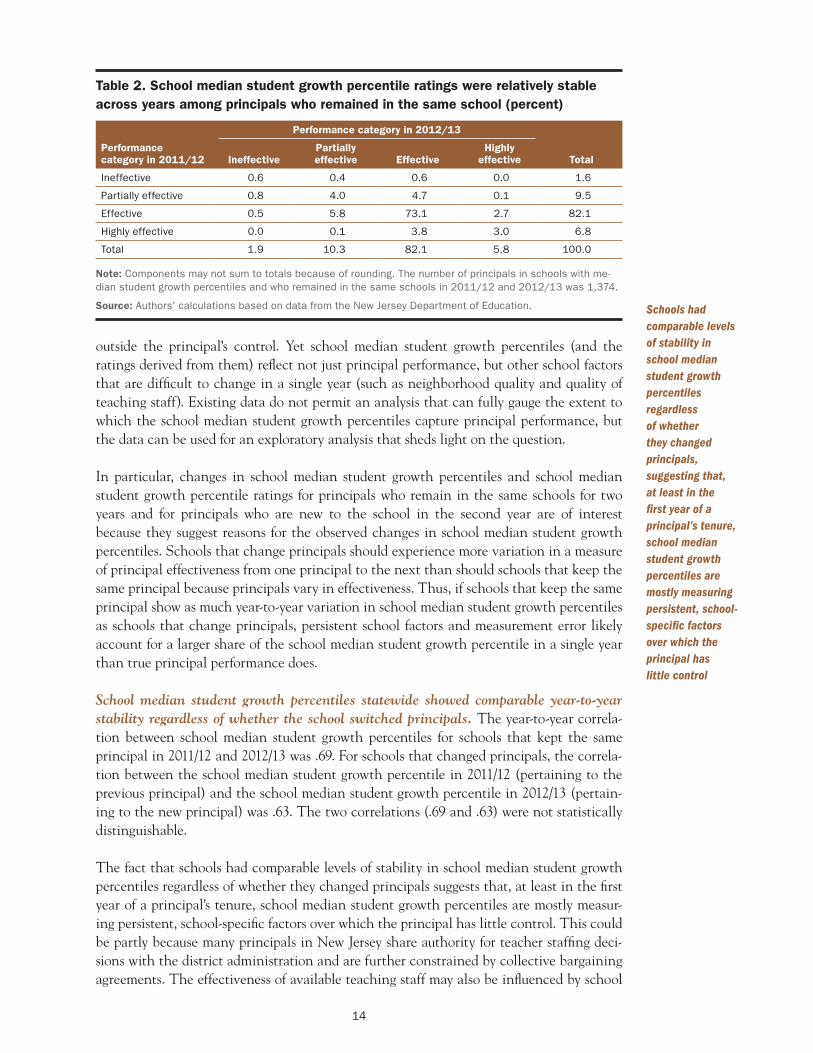
Table 2. School median student growth percentile ratings were relatively stable across years among principals who remained in the same school (percent)
Performance category in 2011/12
Performance category in 2012/13
Total Ineffective Partially effective Effective
Highly effective
Ineffective 0.6 0.4 0.6 0.0 1.6
Partially effective 0.8 4.0 4.7 0.1 9.5
Effective 0.5 5.8 73.1 2.7 82.1
Highly effective 0.0 0.1 3.8 3.0 6.8
Total 1.9 10.3 82.1 5.8 100.0
Note: Components may not sum to totals because of rounding. The number of principals in schools with median student growth percentiles and who remained in the same schools in 2011/12 and 2012/13 was 1,374.
Source: Authors’ calculations based on data from the New Jersey Department of Education. Schools had
outside the principal’s control. Yet school median student growth percentiles (and the ratings derived from them) reflect not just principal performance, but other school factors that are difficult to change in a single year (such as neighborhood quality and quality of teaching staff). Existing data do not permit an analysis that can fully gauge the extent to which the school median student growth percentiles capture principal performance, but the data can be used for an exploratory analysis that sheds light on the question.
In particular, changes in school median student growth percentiles and school median student growth percentile ratings for principals who remain in the same schools for two years and for principals who are new to the school in the second year are of interest because they suggest reasons for the observed changes in school median student growth percentiles. Schools that change principals should experience more variation in a measure of principal effectiveness from one principal to the next than should schools that keep the same principal because principals vary in effectiveness. Thus, if schools that keep the same principal show as much year-to-year variation in school median student growth percentiles as schools that change principals, persistent school factors and measurement error likely account for a larger share of the school median student growth percentile in a single year than true principal performance does.
School median student growth percentiles statewide showed comparable year-to-year stability regardless of whether the school switched principals. The year-to-year correlation between school median student growth percentiles for schools that kept the same principal in 2011/12 and 2012/13 was .69. For schools that changed principals, the correlation between the school median student growth percentile in 2011/12 (pertaining to the previous principal) and the school median student growth percentile in 2012/13 (pertaining to the new principal) was .63. The two correlations (.69 and .63) were not statistically distinguishable.
The fact that schools had comparable levels of stability in school median student growth percentiles regardless of whether they changed principals suggests that, at least in the first year of a principal’s tenure, school median student growth percentiles are mostly measuring persistent, school-specific factors over which the principal has little control. This could be partly because many principals in New Jersey share authority for teacher staffing decisions with the district administration and are further constrained by collective bargaining agreements. The effectiveness of available teaching staff may also be influenced by school
comparable levels of stability in school median student growth percentiles regardless of whether they changed principals, suggesting that, at least in the first year of a principal’s tenure, school median student growth percentiles are mostly measuring persistent, school-specific factors over which the principal has little control
14

factors such as location (neighborhood safety or local teacher labor markets). Another study has similarly found that schools’ contributions to student achievement growth are “sticky,” with school effectiveness under the previous principal having a strong relationship to school effectiveness under the current principal, even several years after a principal transition (Chiang et al., in press). In short, the existing data raise questions about the validity of school median student growth percentiles as a measure of principal performance.
Correlations between ratings and student characteristics
The correlations between the principal ratings on the component measures and school-wide measures of student disadvantage can provide important information about the relationship between the two: negative correlations might suggest that the ratings are biased against principals of schools with more disadvantaged students or that less effective principals might actually be serving schools with more disadvantaged students. Although it is not yet possible to confirm either explanation, the existence of such correlations would highlight the need for further investigation.
Analyses of these correlations show significant negative relationships between principal ratings on the student achievement measure and two measures of student disadvantage— the schoolwide percentages of economically disadvantaged students and English learner students (table 3). Because of the limited data available on some of the component measures, the analyses focused on the two measures with the most complete data: school median student growth percentiles (with their associated ratings) and principal practice instrument ratings. To use all the available data, correlations were examined in three samples:
• The statewide sample of principals with school median student growth percentiles (and associated ratings).
• The sample of principals in pilot districts with principal practice instrument ratings.
• The sample of principals in pilot districts with both school median student growth percentiles and principal practice instrument ratings.
Analyses of the correlations between the principal ratings on the component measures and schoolwide measures of student disadvantage show significant negative relationships between principal ratings on the student achievement measure and schoolwide percentages of economically disadvantaged students and English learner students
Table 3. School median student growth percentiles and school median student growth percentile ratings had statistically significant negative correlations with the schoolwide percentage of economically disadvantaged students in 2012/13
Component measure
Correlation with
Schoolwide percentage of economically disadvantaged
students Schoolwide percentage of English learner students
Principals statewide with school median student growth percentiles (n = 1,742)
School median student growth percentile –0.50* –0.11*
School median student growth percentile rating –0.47* –0.09*
Principals in pilot districts with principal practice ratings (n = 132)
Principal practice instrument rating –0.17 0.10
Principals in pilot districts with school median student growth percentiles and principal practice instrument ratings (n = 131)
School median student growth percentile
School median student growth percentile rating
Principal practice instrument rating
–0.60*
–0.47*
–0.17
–0.18*
–0.07
0.10
* Statistically significant at p < .05, two-tailed test.
Source: Authors’ calculations based on data from the New Jersey Department of Education.
15

Most of the component measures of the principal evaluation system analyzed had significant negative correlations with the schoolwide percentages of economically disadvantaged students. In the statewide sample, school median student growth percentiles had a statistically significant negative correlation (–0.50) with the percentage of economically disadvantaged students, and school median student growth percentile ratings, which are derived directly from school median student growth percentiles, had a statistically significant negative correlation of nearly identical size (–0.47). In the sample of principals from pilot districts, the principal practice ratings had a smaller negative correlation (–0.17) with the percentage of economically disadvantaged students, but it was not statistically significant (p = 0.06). Findings for the sample of principals with both school median student growth percentiles and principal practice instrument ratings were similar (see table 3).
Some of the correlations between principal ratings on the component measures and the schoolwide percentage of English learner students were statistically significant and negative. In the statewide sample and the sample of principals in pilot districts with both school median student growth percentiles and principal practice instrument ratings, school median student growth percentiles had a statistically significant negative correlation with the percentage of English learner students. The correlation between school median student growth percentile ratings and the percentage of English learner students was smaller and statistically significant only in the statewide sample. The correlation between principal practice instrument ratings and the percentage of English learner students was not statistically significant.
These findings suggest either that school median student growth percentiles and school median student growth percentile ratings are biased against principals who lead schools with a high percentage of economically disadvantaged students or that principals who lead schools with a high percentage of economically disadvantaged students are more likely to be ineffective. These findings are consistent with another study on student growth percentiles that found that students who were eligible for free or reduced-price lunch had lower student growth percentiles than students who were not eligible, for all content areas and grade levels (Colorado Department of Education, 2013). Neither that study nor this one could determine whether the findings are the result of bias or an inequitable distribution of principals in the state.
Determining whether these findings represent bias or an inequitable distribution of principals in the state requires further investigation. The ideal way to determine whether the findings represent bias would be to obtain an unbiased measure of principal effectiveness that could be used to validate the current component measures. Several studies have attempted to separate principals’ contributions to student achievement growth from those of the school by controlling for student achievement growth under the principals’ predecessor (Grissom, Kalogrides, & Loeb, 2015; Teh, Chiang, Lipscomb, & Gill, 2014). This method might reduce bias from persistent, school-specific factors that affect student achievement. Because of data limitations, this method is outside of the scope of this study; it may be a suitable topic for further research.
Implications of the study findings
In New Jersey’s current principal evaluation system, the principal practice instrument makes up 30 percent of the summative rating, and the new evaluation leadership instrument makes up 20 percent. Information on inter-rater reliability and the training necessary
Either school median student growth percentiles and school median student growth percentile ratings are biased against principals who lead schools with a high percentage of economically disadvantaged students, or principals who lead schools with a high percentage of economically disadvantaged students are more likely to be ineffective
16
to attain high levels of inter-rater reliability would help in understanding the accuracy of these ratings. Information on the internal consistency reliability of principal practice instruments would demonstrate the extent to which items and subscales of each instrument are capturing an underlying notion of principal quality. Information linking principal practice instruments with the principal’s contribution to student achievement growth would strengthen the evidence that these measures accurately tap dimensions of principal performance that are critical for improving student achievement.
Principals vary in performance, yet more than half the principal practice ratings reported to the New Jersey Department of Education were discrete values, compressing the variation in ratings that the instruments are capable of producing. Averaging item scores on the principal practice instruments and reporting the ratings to one decimal place would increase the variation in principal practice ratings. Averaging the ratings from multiple goals and reporting the result to one decimal place would increase the variation in principal goal ratings.
The high year-to-year correlation between school median student growth percentiles for schools with the same principal and for those with different principals suggests that school-specific factors (such as neighborhood safety, district policies, and teaching staff) have strong year-to-year persistence even when the principal changes. Use of school median student growth percentiles in principal evaluations could thus discourage effective principals from accepting positions in low-performing schools. Moreover, the negative correlation between school median student growth percentiles and the percentage of students eligible for free or reduced-price lunch, which could reflect either actual practice differences or bias, poses a similar disincentive for effective principals to work in schools serving economically disadvantaged students. Alternative measures of student achievement growth that can isolate the principal’s contribution could reduce this disincentive, but proposed measures require more study.
Schools with fewer students in grades with student growth percentiles had higher year-toyear variability in the school median student growth percentile than schools with more students in grades with student growth percentiles. The higher variability for smaller schools might simply reflect measurement error because the median student growth percentile in smaller schools could be more influenced by a few students having a bad or good test day than could the median student growth percentile in larger schools. This finding supports the New Jersey Department of Education policy of reducing the weight of school median student growth percentile ratings for principals at schools with student growth percentiles for only one grade, but the correspondence between the number of students with student growth percentiles and the number of grades with student growth percentiles is not exact. Using the number of students with student growth percentiles as the measure of school size would reduce the likelihood that summative principal evaluation ratings are unfairly skewed by highly variable school median student growth percentile ratings. To address this issue for smaller schools, using multiple years of student growth percentiles or reducing the weight on the single year of student growth percentiles could decrease measurement error.
Limitations of the study
Limitations of the study include small sample size, lack of item-level data, late guidance to districts on some component measures, and lack of a known unbiased measure of principal effectiveness.
The high year-toyear correlation between school median student growth percentiles for schools with the same principal and for those with different principals suggests that school-specific factors have strong year-to-year persistence even when the principal changes, which could discourage effective principals from accepting positions in low-performing schools
17

The study is based on 14 pilot districts (238 principals), 4 of which did not provide any evaluation data to the New Jersey Department of Education. The nonrepresentative sample means that findings may change when statewide evaluation data from 2013/14 are available for analysis. The small sample limits the precision of estimates, so this study did not examine the relationships among component measures of the evaluation system and the variability of ratings on each principal practice instrument. Similarly, the study did not examine the inter-rater reliability of the practice instruments because only a few small districts provided scores from multiple raters on the principal practice instruments.
The study used summary evaluation data reported by districts to the New Jersey Department of Education. To reduce reporting burden, districts did not report data at the item or domain (or subscale) level, so the internal consistency reliability of the practice instruments cannot be examined.
Some component measures of the principal evaluation system were developed or refined during the pilot year. As a result, guidance to districts on how to assess some components of the evaluation system (including principal goals and human capital management responsibilities) was not developed until February or March of the pilot year. Because of this delay, some districts did not implement these component measures.
Although the study has found evidence suggesting reasons for concern about the validity of the principal practice measure and the school median student growth percentiles (when used in principal evaluation), the extent of bias in these measures is unknowable without a good measure of principal effectiveness against which to compare them.
Although the study found evidence suggesting reasons for concern about the validity of the principal practice measure and the school median student growth percentiles, the extent of bias in these measures is unknowable without a good measure of principal effectiveness against which to compare them
18

––
–
– –
Appendix A. Description of districts participating in the pilot
This appendix presents information about the school districts piloting the principal evaluation system in 2012/13 and school districts statewide.
Pilot districts were diverse in size, school composition, and student demographic composition
The New Jersey Department of Education selected the 14 districts that participated in the principal evaluation pilot in 2012/13 through a competitive grant process. A total of 21 districts applied to participate in the pilot, and the 14 districts selected had the highest scores on their grant applications.3 These districts received a combined total of $400,000 to implement the principal evaluation system.
Characteristics of the districts and schools that participated in the principal evaluation pilot aid in understanding the extent to which the findings might be generalized to other settings. Pilot districts included 10 percent of the schools in New Jersey; the smallest pilot district had 4 schools and fewer than 2,000 students, and the largest had 72 schools and 36,000 students (table A1). The characteristics of pilot districts were mostly similar to the state average (table A2). The percentages of economically disadvantaged and English learner students in the pilot districts did not differ from the statewide averages by statistically significant amounts. However, the average number of students and the percentage of Asian students were higher in the pilot districts than in all districts statewide, both by statistically significant amounts.
Table A1. Number of schools and students in New Jersey districts participating in principal evaluation pilot in 2012/13
District County
Number of schools
Number of students
Combination and other Total
Alexandria Township and North Hunterdon-Voorhees Regional Hunterdon 1 0 2 1 4 3,307
Bergenfield Bergen 5 1 1 0 7 3,510
Edison Township Middlesex 13 4 2 0 19 14,307
Elizabeth Union 3 0 6 24 33 23,988
Lawrence Township Mercer 5 1 1 0 7 4,036
Monmouth County Vocational Monmouth 0 0 8 2 10 2,106
Morris Morris 8 1 1 0 10 5,024
Newark Essex 13 1 9 49 72 36,014
North Brunswick Township Middlesex 4 1 1 0 6 6,095
Paterson Passaic 10 2 12 21 45 24,297
Pemberton Township Burlington 8 1 1 0 10 4,994
Rockaway Township Morris 5 1 0 0 6 2,426
Spotswood Middlesex 2 1 1 0 4 1,797
Stafford Ocean 5 0 0 0 5 2,224
Total for all pilot districts 82 14 45 97 238 134,125
Total for all districts in New Jersey 1,242 372 385 496 2,495 1,368,606
Source: Authors’ calculations based on data from the New Jersey Department of Education.
A-1
Elementary schools
(PK–grade 5 or PK–grade 6)
Middle schools (grades 5–8
or 6–8)High schools
(grades 9–12)
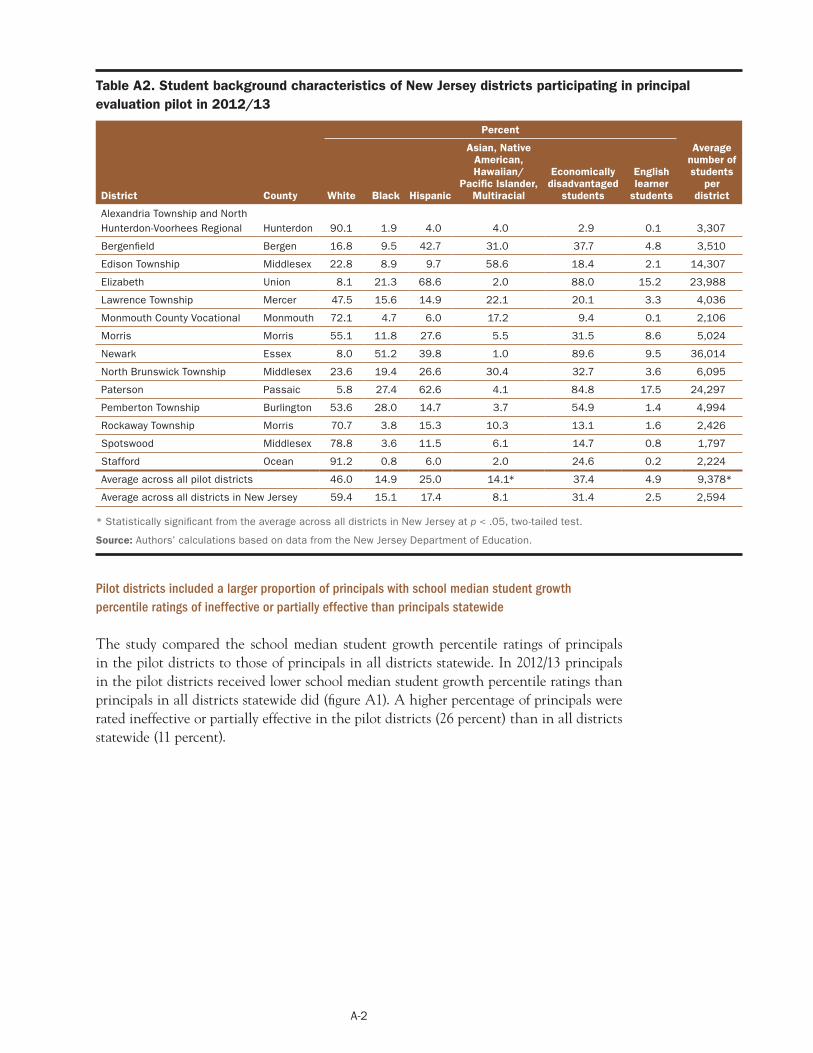
Table A2. Student background characteristics of New Jersey districts participating in principal evaluation pilot in 2012/13
District County
Percent
Average number of students
per district White Black Hispanic
Asian, Native American, Hawaiian/
Pacific Islander, Multiracial
Economically disadvantaged
students
English learner
students
Alexandria Township and North Hunterdon-Voorhees Regional Hunterdon 90.1 1.9 4.0 4.0 2.9 0.1 3,307
Bergenfield Bergen 16.8 9.5 42.7 31.0 37.7 4.8 3,510
Edison Township Middlesex 22.8 8.9 9.7 58.6 18.4 2.1 14,307
Elizabeth Union 8.1 21.3 68.6 2.0 88.0 15.2 23,988
Lawrence Township Mercer 47.5 15.6 14.9 22.1 20.1 3.3 4,036
Monmouth County Vocational Monmouth 72.1 4.7 6.0 17.2 9.4 0.1 2,106
Morris Morris 55.1 11.8 27.6 5.5 31.5 8.6 5,024
Newark Essex 8.0 51.2 39.8 1.0 89.6 9.5 36,014
North Brunswick Township Middlesex 23.6 19.4 26.6 30.4 32.7 3.6 6,095
Paterson Passaic 5.8 27.4 62.6 4.1 84.8 17.5 24,297
Pemberton Township Burlington 53.6 28.0 14.7 3.7 54.9 1.4 4,994
Rockaway Township Morris 70.7 3.8 15.3 10.3 13.1 1.6 2,426
Spotswood Middlesex 78.8 3.6 11.5 6.1 14.7 0.8 1,797
Stafford Ocean 91.2 0.8 6.0 2.0 24.6 0.2 2,224
Average across all pilot districts 46.0 14.9 25.0 14.1* 37.4 4.9 9,378*
Average across all districts in New Jersey 59.4 15.1 17.4 8.1 31.4 2.5 2,594
* Statistically significant from the average across all districts in New Jersey at p < .05, two-tailed test.
Source: Authors’ calculations based on data from the New Jersey Department of Education.
Pilot districts included a larger proportion of principals with school median student growth percentile ratings of ineffective or partially effective than principals statewide
The study compared the school median student growth percentile ratings of principals in the pilot districts to those of principals in all districts statewide. In 2012/13 principals in the pilot districts received lower school median student growth percentile ratings than principals in all districts statewide did (figure A1). A higher percentage of principals were rated ineffective or partially effective in the pilot districts (26 percent) than in all districts statewide (11 percent).
A-2

Figure A1. A higher percentage of principals received an ineffective or partially effective school median student growth percentile rating in pilot districts than in all districts statewide in 2012/13
Percent of principals
Ineffective (1.00–1.84) Partially effective (1.85–2.64) Effective (2.65–3.49) Highly effective (3.50–4.00)
100
75
50
25
0 Statewide Pilot districts
Sample of principals
Note: The number of principals statewide with a school median student growth percentile rating was 1,742. The number of principals with a school median student growth percentile rating in the pilot districts was 132. The average rating for principals statewide was 3.0, with a standard deviation of 0.3. The average rating for principals in pilot districts was 2.8, with a standard deviation of 0.5.
Source: Authors’ calculations based on data from the New Jersey Department of Education.
A-3
Appendix B. Data used in the study
The study used implementation data and principal evaluation ratings collected by the New Jersey Department of Education from pilot districts, as well as statewide data from the department on principals’ job assignments, school median student growth percentiles, and school background characteristics. This appendix provides details on the data sources.
Implementation data
New Jersey Department of Education staff conducted telephone surveys of pilot districts between January and March 2013 to gather information about the measures that districts had selected or developed to evaluate principals, how districts planned to weight component measures in the summative evaluation rating, training received by evaluators and principals, communication about the evaluation system, and evaluation data management systems. Superintendents or their designees responded to the structured set of questions on each topic. Of the 14 pilot districts, 13 responded to the survey. Responses were recorded in a spreadsheet. In addition, in October 2013 the department used an online survey to collect information from districts statewide on the principal practice instruments they had selected or developed. Superintendents or their designees responded to this survey. All districts responded to at least one round of the survey.
Evaluation ratings
The primary data source for this study is the evaluation ratings that pilot districts reported to the New Jersey Department of Education in June and July 2013. The pilot principal evaluation system called for districts to rate principals and assistant principals on four component measures: principal practice instrument, human capital management responsibilities, school student achievement goals in nontested areas, and school-specific student subgroup achievement goals. These ratings would be combined with the school student achievement rating (school median student growth percentiles or changes in High School Proficiency Assessment passing rates) calculated by the New Jersey Department of Education to form a summative evaluation score.
The number of districts that provided ratings data varied across the type of school leader and component measure (table B1). Ten districts provided evaluation ratings for principals, but only three districts provided evaluation ratings for assistant principals. The availability of district evaluation data varied across component measures for several reasons. First, districts encountered challenges in implementing the human capital management responsibilities rating, which required them to identify or develop a measure, and the goal ratings, which required developing four or more goals for student achievement. Recognizing these challenges, the New Jersey Department of Education provided additional guidance and announced modifications to the design of the evaluation system for the statewide year. For example, in the statewide year a measure of evaluation leadership developed by the department replaced the measure of human capital management responsibilities, and a single measure of principal goals replaced the measures of school student achievement goals in nontested areas and school-specific student subgroup achievement goals. The modifications simplified the component measures that districts found most challenging to implement, but at the end of the pilot year 10 districts provided evaluation ratings on the principal practice instrument, 4 districts provided ratings on principal goals, and 2 districts provided
B-1

Table B1. Number of districts that provided information on each evaluation rating in 2012/13
Evaluation rating
Principals
Number of districts
Number of principals
Number of schools
Number of districts
Number of assistant principalsb
Number of schools
Principal practice instrument 10 192 192 3 107 61
Human capital management responsibilities 2 16 16 1 5 3
School median student growth percentile 13 132 132 13 107 57
Principal goals 4 27 27 2 10 5
District-provided summative ratinga 9 187 187 3 107 61
All pilot districts 14 238 238 14 — —
— is not available.
a. Districts varied in how they calculated these ratings because they were calculated prior to the release of student growth percentile ratings.
b. Exceeds the number of schools because multiple assistant principals may be in the same schools.
Source: Authors’ calculations based on data from the New Jersey Department of Education.
ratings on human capital management responsibilities. Although districts were asked to develop two types of goal measures in the pilot year, only one district provided two goal ratings, so the table presents the goal rating as one rating.4 Nine districts also provided summative ratings. These ratings were based primarily on the principal practice instrument rating because school student achievement ratings were not available in July, when districts submitted the evaluation ratings to the New Jersey Department of Education.
The analyses in the report focus on principals and the component measures for which the data were most complete. The report does not present analyses for assistant principals because only three districts reported data for assistant principals.
Principals’ job assignments
Data on principals’ job assignments linked principals to the schools they led and identified principals who were new to their schools in 2012/13. These data are from publicly available databases on the New Jersey Department of Education website and contained principals’ names and their school assignments for 2011/12 and 2012/13.
School-level student achievement growth
Data on school-level student achievement growth were used to calculate the principal evaluation ratings based on school median student growth percentile and to analyze the stability of these measures across years. These data are from publicly available databases on the New Jersey Department of Education website.
These data included school-level median student growth percentiles in math and English language arts for schools with students in grades 4–8 in 2011/12 and 2012/13 (table B2). School-level median student growth percentiles are available only for schools with students in grades 4–8 because the student growth percentiles are based on scores on the New
B-2
Assistant principals

Table B2. Number of districts, schools, and principals with school median student growth percentiles in 2012/13
Districts Number of districts Number of principals Number of schools
All pilot districts 13a 132 132
All districts in New Jersey 570 1,742 1,742
a. One pilot district had no schools with students in grades 4–8.
Source: Authors’ calculations based on data from the New Jersey Department of Education.
Jersey Assessment of Skills and Knowledge, which is administered to students in grades 3–8, and growth percentiles require students to have a test score in the prior year (which excludes students in grade 3). For principal evaluations in 2013/14, the New Jersey Department of Education will calculate school median student growth percentiles based on the median student growth percentile across students in both math and English language arts rather than based on an average of the median student growth percentiles for math and English language arts. Since the department did not calculate the school student growth percentile as a median across all student-level student growth percentiles for 2012/13, this study uses the average of the two school-level median student growth percentiles in math and English language arts for the school student growth percentile measure.
School-level student background characteristics
Data on school-level student background characteristics were necessary to analyze the relationship between principal evaluation ratings and measures of student disadvantage. These data are from publicly available databases on the New Jersey Department of Education website and contained the percentages of students of each race/ethnicity, the percentage of economically disadvantaged students, and the percentage of English learner students.
B-3

Appendix C. Design of the principal evaluation system and component measures selected by pilot districts
This appendix describes the design of the pilot principal evaluation system and the component measures of principal performance selected or developed by pilot districts. It discusses the guidance provided by the New Jersey Department of Education for each of the measures and the experiences of pilot districts in implementing them.
The pilot design for the principal evaluation system required districts to select or develop a principal practice instrument, a measure of human capital management responsibilities, and measures of student achievement growth, including at least four goals for student achievement. Most districts selected one principal practice measure as part of their application to participate in the pilot but waited for guidance from the New Jersey Department of Education before developing measures of goals or human capital management responsibilities. During the pilot year the department provided additional guidance on selecting or developing goals for student achievement and refined the design of the evaluation system for the statewide year (box C1 and figure C1).
The guidance and modifications of component measures of the principal evaluation system during the pilot year affected the extent to which pilot districts implemented the component measures. Notably, only two districts submitted a separate principal rating for human capital management responsibilities, which was not used in the statewide year. Only four districts submitted principal ratings for goals, and they submitted a single rating for each principal, so it is unclear whether principals in the pilot districts set at least four goals for school student achievement in nontested areas and school-specific student subgroup achievement.
Box C1. New Jersey Department of Education criteria for principal practice instruments
• Align with the 2008 Interstate School Leadership Licensure Consortium professional stan
dards for school leaders.
• Distinguish a minimum of four levels of performance.
• Use information from multiple sources of evidence collected throughout the year.
• Use information from at least two school-based observations of practice for tenured princi
pals and three school-based observations of practice for nontenured principals.
• Assess progress on at least one individual, school, or district performance goal related to
professional practice.
• Incorporate feedback from teachers regarding principal performance and from other stake
holder groups, as appropriate, regarding individual, school, or district performance goals.
• Assess the principal’s leadership in implementing a rigorous curriculum and assessments
aligned with the New Jersey Core Curriculum content standards.
• Assess the principal’s leadership for high-quality instruction.
• Assess the principal’s performance in evaluating teachers.
• Assess the principal’s support for teachers’ professional growth.
Source: New Jersey Department of Education, 2012b.
C-1

Figure C1. Component measures and their weights in summative evaluation ratings changed between the pilot and statewide years
Percent of total weight
Goals Change in High School Proficiency Assessment passing rates School median student growth percentiles Teacher student growth objectivesa
Evaluation leadership Human capital management responsibilities Practice instrument 100
75
50
25
0
30 30
20
10
30
40
20
10
30 20
20 20 10 10
10 10 20 20
40 40
30 30
Elementary and High Single grade has Multiple grades No grades have middle schools schools student growth have student growth student growth
percentiles percentiles percentiles
Pilot year (2012/13) Statewide year (2013/14)
a. Teacher-selected goals for achievement growth of the teacher’s own students. These were a component measure of the teacher evaluation system beginning in 2012/13. The average teacher rating is a component measure in principal evaluations beginning in 2013/14. The two types of goals set in the pilot year are combined in this figure because all but one of the districts reported them together.
Source: New Jersey Department of Education, 2014a.
Districts selected six commercially available principal practice instruments and developed one instrument approved by the New Jersey Department of Education
Districts selected or developed measures of principals’ professional practice that were approved by the New Jersey Department of Education. The department required principal practice instruments to include several features (see box C1 for details) and to demonstrate their rigor, reliability, and validity.
School districts as well as community-based organizations, charter management organizations, private companies, and others were eligible to submit principal practice instruments for review through a “request for qualifications” process. Submission materials included the instrument and a narrative explanation of evidence to support the instrument’s alignment with the approval criteria. After review and approval, the New Jersey Department of Education placed the instrument on its list of approved principal practice instruments.
During the 2012/13 pilot year the New Jersey Department of Education approved 20 principal practice instruments, including 6 developed by school districts (New Jersey Department of Education, 2012a). The 14 pilot districts selected seven principal practice instruments from this approved list. Additional principal practice instruments were approved for 2013/14 (New Jersey Department of Education, 2014b), but the principal
C-2

Figure C2. Principal practice instruments selected by pilot districts for use in 2012/13 were similar to those selected by districts statewide for use in 2013/14
14 pilot districts selected Statewide, most districts selected 7 principal instruments 5 principal instruments
Four other instruments Focal point District-developed
Focal point
1
1
Marshall 1
Marshall 135
Marzano 65
Marzano 2
McREL 3
McREL 54
Stronge 5
Stronge 117
MPPR 1
MPPR 114
District-developed 20
26 9
Focal Point is Focal Point Principal Evaluation Instrument; Marshall is Marshall Principal Evaluation Rubric; Marzano is Marzano School Leader Evaluation Model; McREL is McREL International: Principal Evaluation System; MPPR is Multidimensional Principal Performance Rubric; Stronge is Stronge Leader Effectiveness Performance Evaluation System; and four other instruments are the New Jersey LoTi Principal Evaluation Instrument, the Rhode Island Model: Building Administrator Evaluation and Support Model, Principal Evaluation and Improvement Instrument, and The Thoughtful Classroom Principal Effectiveness Framework.
Source: New Jersey Department of Education survey of school districts, February 2013 and October 2014.
practice instruments selected by the pilot districts for use in 2012/13 were selected by a large proportion of districts statewide for use in 2013/14 (figure C2).
Of the seven principal practice instruments selected by pilot districts, six were commercially available, and one was developed by a district (table C1). The number of principals evaluated using each of these instruments ranged from 10 to 72.
Developers of six of the principal practice instruments stated that the instruments were developed and modified based on research on principal practices related to school performance or student achievement. Developers of the Focal Point Principal Evaluation Instrument cited DuFour (2003), Marzano (2003), and Reeves (2010). Developers of the Marshall Principal Evaluation Rubric cited 33 books and articles, including Allen (2001); Collins (2001); DuFour, Eaker, and Karhanek (2004); Marshall (2009); Marzano (2003, 2005); Murphy and Pimentel (1996); Reeves (2006); Sullivan and Glanz (2005); and Wiggins and McTighe (2007). Developers of the Marzano School Leader Evaluation Model cited Marzano (2003, 2004); Marzano Research Laboratory (2011); and Shen et al. (2007). Developers of the McREL International: Principal Evaluation System cited Waters, Marzano, and McNulty (2003). Developers of the Stronge Leader Effectiveness Performance Evaluation System cited Catano and Stronge (2006, 2007); Stronge (2008); and Stronge, Xu, Leeper, and Tonneson (2013). Developers of the Multidimensional Principal Performance Rubric did not cite specific literature, and developers of the Newark Public Schools Leadership Framework did not respond to requests for information about the instrument.
C-3
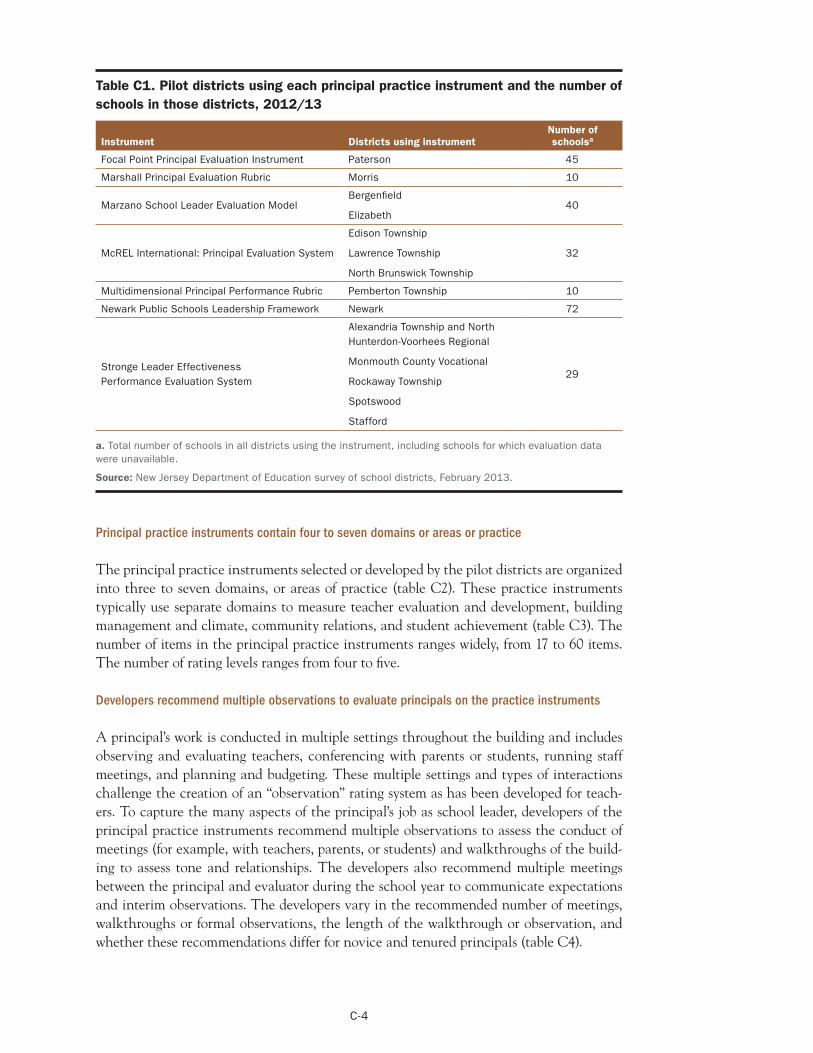
Table C1. Pilot districts using each principal practice instrument and the number of schools in those districts, 2012/13
Instrument Districts using instrument Number of schoolsa
Focal Point Principal Evaluation Instrument Paterson 45
Marshall Principal Evaluation Rubric Morris 10
Bergenfield Marzano School Leader Evaluation Model 40
Elizabeth
Edison Township
McREL International: Principal Evaluation System Lawrence Township 32
North Brunswick Township
Multidimensional Principal Performance Rubric Pemberton Township 10
Newark Public Schools Leadership Framework Newark 72
Alexandria Township and North Hunterdon-Voorhees Regional
Stronge Leader Effectiveness Performance Evaluation System
Monmouth County Vocational
Rockaway Township 29
Spotswood
Stafford
a. Total number of schools in all districts using the instrument, including schools for which evaluation data were unavailable.
Source: New Jersey Department of Education survey of school districts, February 2013.
Principal practice instruments contain four to seven domains or areas or practice
The principal practice instruments selected or developed by the pilot districts are organized into three to seven domains, or areas of practice (table C2). These practice instruments typically use separate domains to measure teacher evaluation and development, building management and climate, community relations, and student achievement (table C3). The number of items in the principal practice instruments ranges widely, from 17 to 60 items. The number of rating levels ranges from four to five.
Developers recommend multiple observations to evaluate principals on the practice instruments
A principal’s work is conducted in multiple settings throughout the building and includes observing and evaluating teachers, conferencing with parents or students, running staff meetings, and planning and budgeting. These multiple settings and types of interactions challenge the creation of an “observation” rating system as has been developed for teachers. To capture the many aspects of the principal’s job as school leader, developers of the principal practice instruments recommend multiple observations to assess the conduct of meetings (for example, with teachers, parents, or students) and walkthroughs of the building to assess tone and relationships. The developers also recommend multiple meetings between the principal and evaluator during the school year to communicate expectations and interim observations. The developers vary in the recommended number of meetings, walkthroughs or formal observations, the length of the walkthrough or observation, and whether these recommendations differ for novice and tenured principals (table C4).
C-4
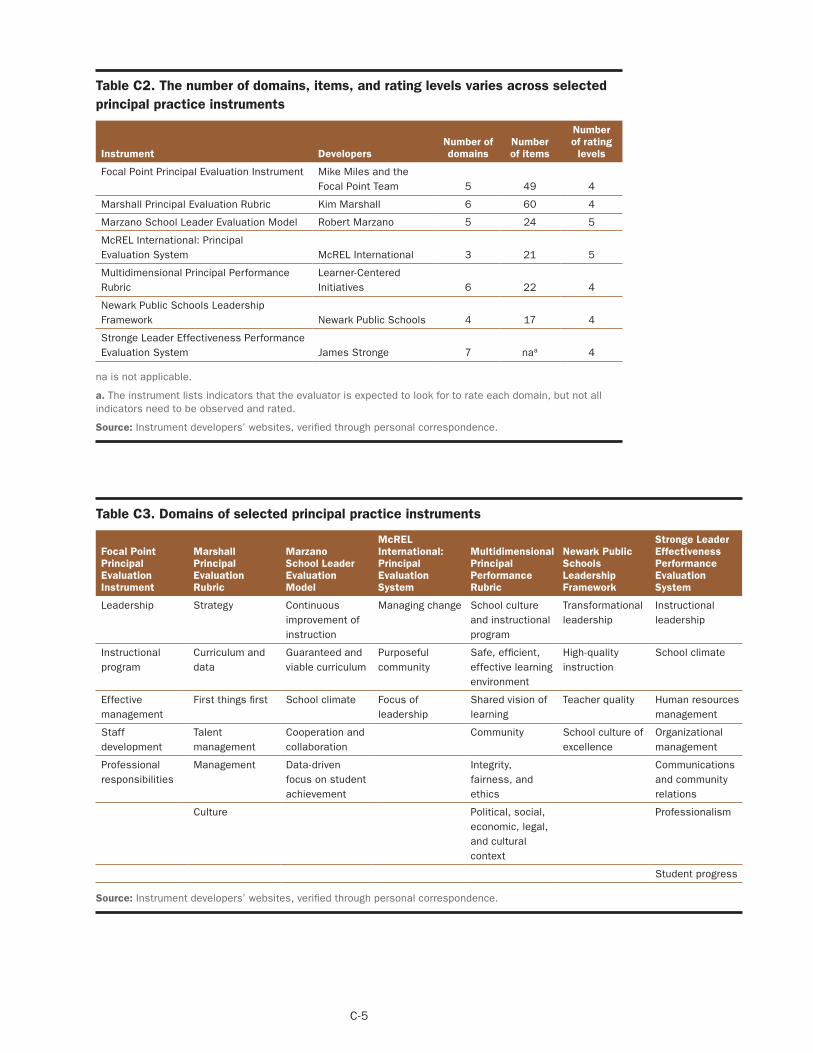
Table C2. The number of domains, items, and rating levels varies across selected principal practice instruments
Instrument Developers Number of domains
Number of items
Number of rating
levels
Focal Point Principal Evaluation Instrument Mike Miles and the Focal Point Team 5 49 4
Marshall Principal Evaluation Rubric Kim Marshall 6 60 4
Marzano School Leader Evaluation Model Robert Marzano 5 24 5
McREL International: Principal Evaluation System McREL International 3 21 5
Multidimensional Principal Performance Learner-Centered Rubric Initiatives 6 22 4
Newark Public Schools Leadership Framework Newark Public Schools 4 17 4
Stronge Leader Effectiveness Performance Evaluation System James Stronge 7 naa 4
na is not applicable.
a. The instrument lists indicators that the evaluator is expected to look for to rate each domain, but not all indicators need to be observed and rated.
Source: Instrument developers’ websites, verified through personal correspondence.
Table C3. Domains of selected principal practice instruments
Focal Point Principal Evaluation Instrument
Marshall Principal Evaluation Rubric
Marzano School Leader Evaluation Model
McREL International: Principal Evaluation System
Multidimensional Principal Performance Rubric
Newark Public Schools Leadership Framework
Stronge Leader Effectiveness Performance Evaluation System
Leadership Strategy Continuous Managing change School culture Transformational Instructional improvement of and instructional leadership leadership instruction program
Instructional Curriculum and Guaranteed and Purposeful Safe, efficient, High-quality School climate program data viable curriculum community effective learning instruction
environment
Effective First things first School climate Focus of Shared vision of Teacher quality Human resources management leadership learning management
Staff Talent Cooperation and Community School culture of Organizational development management collaboration excellence management
Professional Management Data-driven Integrity, Communications responsibilities focus on student fairness, and and community
achievement ethics relations
Culture Political, social, Professionalism economic, legal, and cultural context
Student progress
Source: Instrument developers’ websites, verified through personal correspondence.
C-5

Table C4. Developers recommend multiple observations and meetings between principal and evaluator to support ratings on the practice instruments
Instrument Recommended number of meetings Recommended number of walkthroughs and observations
Recommended time for observations or walkthroughs
Focal Point Principal 6 Four walkthroughs per semester 10–20 minutes per Evaluation Instrument Coaching done four times per year with for tenured principals and eight per walkthrough
reviews at midyear and end of year semester for nontenured principals
Marshall Principal 2 One per month and two 3 hours per school visit Evaluation Rubric Midyear formative check-in and a unannounced classroom visits
summative meeting at the end of the year
Marzano School Leader 3 Two observations required 30–60 minutes per Evaluation Model Beginning of the year, midyear, and a observation
summative evaluation at the end of the year
McREL International: Principal Evaluation System
4 Pre-evaluation conference, midyear evaluation, end-of-year performance discussion, and final evaluation
Two site visits, one per semester Not specified
Multidimensional Principal Performance Rubric
5 Baseline meeting, goal-setting meeting, identification of expectations and evidence discussion, document and goal progress discussion, and final evaluation
Not specified Not specified
Newark Public Schools Leadership Framework
2 Midyear formative review and formal summative evaluation rating
Not specified Not specified
Stronge Leader Effectiveness Performance Evaluation System
3 Beginning of the year, midyear, and end of the year
At least two observations for tenured principals and at least three for nontenured principals
60 minutes
Source: Instrument developers’ websites, verified through personal correspondence.
Developers recommend one to three days of training on the principal practice instruments
To prepare evaluators to accurately rate principal practice, the developers recommend one to three days of training provided by the developer or the developer’s staff (table C5). Three of the developers offer additional training toward certification that the evaluator is rating with a high level of consistency, but certification is optional.
Half the pilot districts reported that they received 11–30 hours of training on the principal practice instruments from the developers
By the middle of the pilot year, 10 districts had trained all principals on the principal practice instrument, 2 districts had trained the majority of principals, and 2 districts did not report their progress, according to a survey of pilot districts conducted by the New Jersey Department of Education. All but two districts reported that they had trained the superintendents, assistant superintendents, and others in the district who would rate principal practice.
The amount of training required for the average evaluator in a district during the pilot year, including initial and follow-up training, ranged from 6 to 60 hours. Half the pilot districts reported that the average evaluator would spend 11–30 hours in training on the principal
C-6

Table C5. Selected principal practice instruments require at least one day of training by developers and staff; certification is optional or not defined
Instrument Time required for training Trainers Evaluator certification offered or required
Focal Point Principal Evaluation Instrument
Two-day training required along with four job-embedded coaching days
Focal Point teams No certification process
Marshall Principal Evaluation Rubric
One-day training Developer and associated consulting company, Safal Partners
No certification process
Marzano School Leader Two to three days of training Learning Sciences International Certification optional Evaluation Model consultants and staff
McREL International: Principal Three-day training McREL International staff and Certification optional. Requires Evaluation System consultants 80 percent correct on test
of instrument content and process and a discussion of case studies
Multidimensional Principal One to two days of training Learner-Centered Initiatives Certification optional Performance Rubric staff
Newark Public Schools No information specified No information specified No information specified Leadership Framework
Stronge Leader Effectiveness One-day training; additional Stronge & Associates trainers Certification optional. Requires Performance Evaluation System days of optional training include 66 percent reliability on each of
training on making summative two simulations; districts may decisions and require a higher standard inter-rater reliability (one day) and goal setting and measures of student progress (one day)
Source: Instrument developers’ websites, verified through personal correspondence.
practice instruments (figure C3). Three districts reported that the average observer would spend 6 hours in training on the practice instruments during the school year, and three districts reported that observers would spend 40–60 hours in training.
Pilot districts reported training successes and challenges
In response to an open-ended survey question (“What have the successes been in training [on the principal practice instruments] thus far”), eight of the pilot districts reported to the New Jersey Department of Education that district administrators had improved their understanding of effective leadership practices and developed a shared vocabulary for discussing leadership practices and performance standards. Two other districts cited an improved understanding of the principal practice instrument. One district reported a greater focus on student achievement, and another reported a greater focus on instructional feedback.5
When asked about the greatest challenges, 10 districts cited the time demands. Specifically, districts noted that finding time to meet for training was a challenge, the time required for evaluation activities took administrators away from their other professional responsibilities, and providing meaningful feedback to 10 principals and several other administrative staff was challenging. No other challenge was cited by more than one district as the greatest challenge posed by training. Two districts said there were no challenges.
C-7
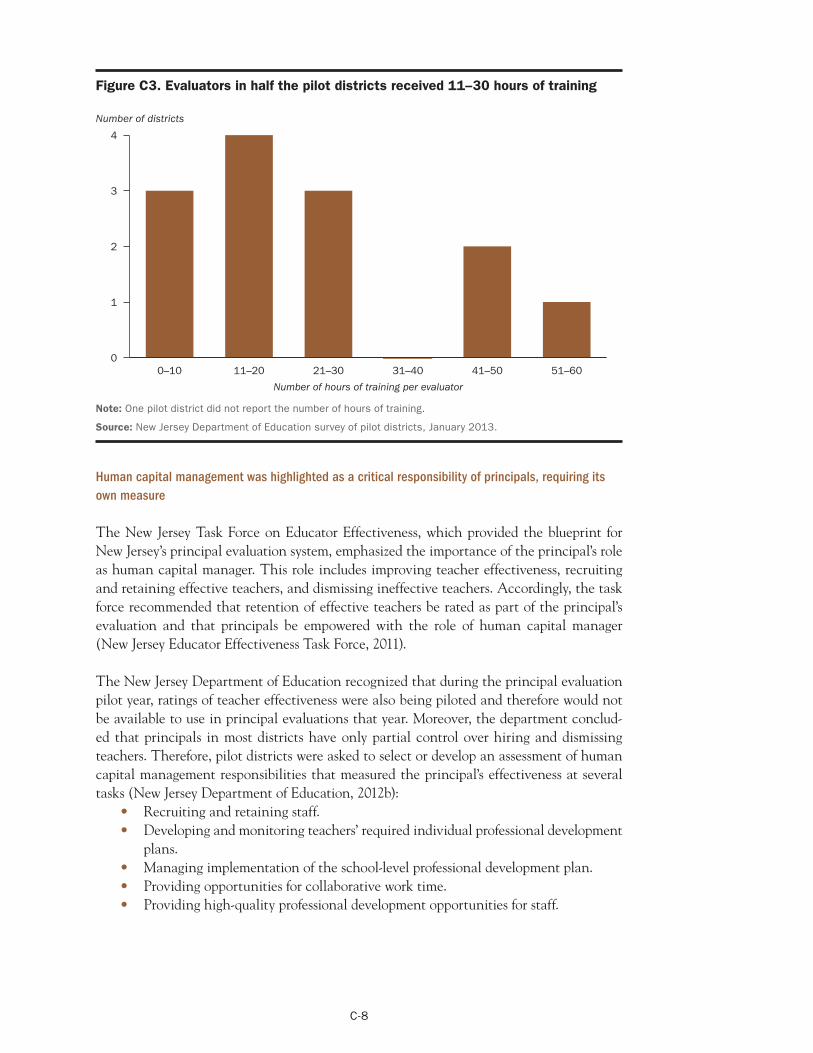
Figure C3. Evaluators in half the pilot districts received 11–30 hours of training
Number of districts
4
3
2
1
0 0–10 11–20 21–30 31–40 41–50 51–60
Number of hours of training per evaluator
Note: One pilot district did not report the number of hours of training.
Source: New Jersey Department of Education survey of pilot districts, January 2013.
Human capital management was highlighted as a critical responsibility of principals, requiring its own measure
The New Jersey Task Force on Educator Effectiveness, which provided the blueprint for New Jersey’s principal evaluation system, emphasized the importance of the principal’s role as human capital manager. This role includes improving teacher effectiveness, recruiting and retaining effective teachers, and dismissing ineffective teachers. Accordingly, the task force recommended that retention of effective teachers be rated as part of the principal’s evaluation and that principals be empowered with the role of human capital manager (New Jersey Educator Effectiveness Task Force, 2011).
The New Jersey Department of Education recognized that during the principal evaluation pilot year, ratings of teacher effectiveness were also being piloted and therefore would not be available to use in principal evaluations that year. Moreover, the department concluded that principals in most districts have only partial control over hiring and dismissing teachers. Therefore, pilot districts were asked to select or develop an assessment of human capital management responsibilities that measured the principal’s effectiveness at several tasks (New Jersey Department of Education, 2012b):
• Recruiting and retaining staff. • Developing and monitoring teachers’ required individual professional development
plans. • Managing implementation of the school-level professional development plan. • Providing opportunities for collaborative work time. • Providing high-quality professional development opportunities for staff.
C-8

The majority of pilot districts reported measuring human capital management responsibilities by using their selected principal practice instrument or by designing their own rubric
Five districts reported to the New Jersey Department of Education in January 2013 that they planned to measure human capital management responsibilities using a single domain of their principal practice instrument that addressed this area. Six districts responded that they had created a rubric to measure human capital management responsibilities or that they planned to rate aspects of principal performance in the areas identified using a four-point scale. One district indicated that principals would assess themselves in this area, and one district reported that it would not rate principals on human capital management responsibilities.
In February of the pilot year, the New Jersey Department of Education announced that the human capital management responsibilities component measure would be replaced in the following school year by a state-developed evaluation leadership instrument. This instrument assesses principals’ effectiveness at building teachers’ knowledge and collaboration and in evaluating teachers (including adhering to teacher evaluation requirements, coaching and providing feedback, ensuring reliable and valid observation results, and ensuring that teachers construct rigorous student growth objectives). The change in measurement guidelines for this area acknowledged that the majority of principals in New Jersey do not have ultimate control over hiring and dismissing teachers and that principals have a critical role in effectively implementing new teacher evaluation and professional development systems.
Many pilot districts may have dropped human capital management as a separate component measure of the principal evaluation system following the New Jersey Department of Education announcement that a new instrument would be used the following year. The use of a single domain of the principal practice instrument to assess this factor (in five districts) introduces ambiguity regarding calculation of the summative score: should districts count that domain as both part of the practice rubric and a component measure score (double counting the domain score) or use it only as a human capital management measure score and omit that domain from the practice rubric score? Only two districts reported separate human capital management responsibilities ratings to the New Jersey Department of Education at the end of the pilot year, and one of those districts used a domain of the principal practice instrument to assess this factor.
Pilot districts provided limited information on principal goals
The pilot principal evaluation system called for principals to be rated based on attainment of two types of goals:
• School student achievement goals for state assessments and for nontested content areas.
• School-specific achievement goals for student subgroups.
Pilot guidance indicated that the goals should be set by the principals and approved by their evaluators and that the goals should be established based on a review of past student achievement, an understanding of school and district goals, and the principal’s professional growth plan.
C-9
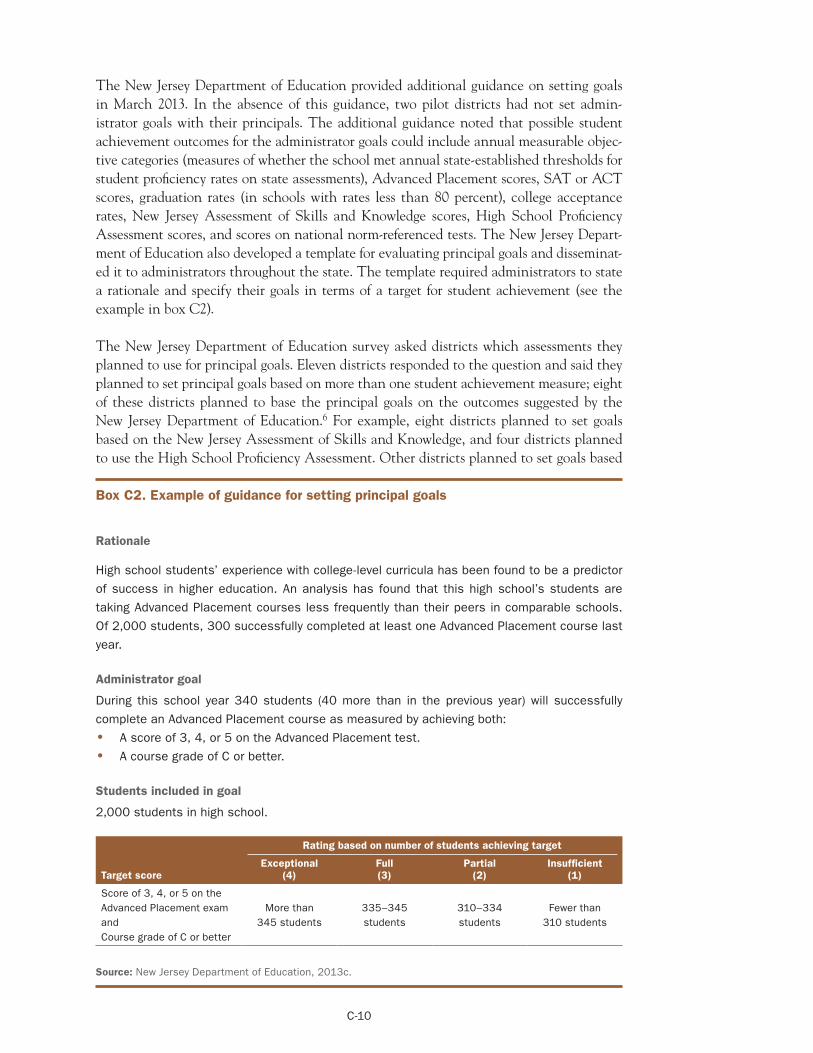
The New Jersey Department of Education provided additional guidance on setting goals in March 2013. In the absence of this guidance, two pilot districts had not set administrator goals with their principals. The additional guidance noted that possible student achievement outcomes for the administrator goals could include annual measurable objective categories (measures of whether the school met annual state-established thresholds for student proficiency rates on state assessments), Advanced Placement scores, SAT or ACT scores, graduation rates (in schools with rates less than 80 percent), college acceptance rates, New Jersey Assessment of Skills and Knowledge scores, High School Proficiency Assessment scores, and scores on national norm-referenced tests. The New Jersey Department of Education also developed a template for evaluating principal goals and disseminated it to administrators throughout the state. The template required administrators to state a rationale and specify their goals in terms of a target for student achievement (see the example in box C2).
The New Jersey Department of Education survey asked districts which assessments they planned to use for principal goals. Eleven districts responded to the question and said they planned to set principal goals based on more than one student achievement measure; eight of these districts planned to base the principal goals on the outcomes suggested by the New Jersey Department of Education.6 For example, eight districts planned to set goals based on the New Jersey Assessment of Skills and Knowledge, and four districts planned to use the High School Proficiency Assessment. Other districts planned to set goals based
Box C2. Example of guidance for setting principal goals
Rationale
High school students’ experience with college-level curricula has been found to be a predictor
of success in higher education. An analysis has found that this high school’s students are
taking Advanced Placement courses less frequently than their peers in comparable schools.
Of 2,000 students, 300 successfully completed at least one Advanced Placement course last
year.
Administrator goal
During this school year 340 students (40 more than in the previous year) will successfully
complete an Advanced Placement course as measured by achieving both:
• A score of 3, 4, or 5 on the Advanced Placement test.
• A course grade of C or better.
Students included in goal
2,000 students in high school.
Target score
Rating based on number of students achieving target
Exceptional (4)
Full (3)
Partial (2)
Insufficient (1)
Score of 3, 4, or 5 on the Advanced Placement exam More than 335–345 310–334 Fewer than and 345 students students students 310 students Course grade of C or better
Source: New Jersey Department of Education, 2013c.
C-10

on short-cycle assessments, graduation rates, Advanced Placement participation or scores, college-going rates, benchmark assessments, and districtwide assessments.
Only four districts provided a separate rating for principal goal attainment. Districts might have waited for New Jersey Department of Education guidance on setting principal goals and, when guidance was received in February, decided it was too late to establish goals, or the goal rating might have been included as part of the principal practice rating. The Stronge Leader Effectiveness Performance Evaluation System (used by three of the districts submitting practice ratings) includes setting goals for student performance as partial evidence for two of the seven performance standards rated.
The method of converting school median student growth percentiles into school median student growth percentile ratings compresses the variation in school median student growth percentiles, especially for percentiles in the middle of the distribution
School student achievement growth is measured using school median student growth percentiles in math and English language arts. Student growth percentiles are first calculated at the student level. For each student, the student growth percentile indicates the percentile ranking of his or her test score relative to those of students with similar test score histories (Betebenner, 2007). Thus, the student growth percentile accounts for students’ prior test scores but not for student background characteristics such as economic disadvantage or English learner status (New Jersey Department of Education, 2014c).
Student growth percentiles are aggregated to the school level by taking the median student growth percentile among the student growth percentiles for both math and English language arts. The school median student growth percentile is transformed into a school median student growth percentile rating using a formula developed by the New Jersey Department of Education in consultation with the developer of the student growth percentile methodology for teacher evaluation (Damian Betebenner of the National Center for the Improvement of Educational Assessment). The rationale for this formula is that educators with median student growth percentiles in the middle of the distribution—the 45th to 55th percentiles—are effective and should receive a rating of 3.0. Above and below that range, ratings change more quickly, so that the formula distinguishes educators outside that middle range more than those in the middle range (45–55). School median student growth percentile ratings increase from 1.1 to 2.9 when school median student growth percentiles are between 21 and 44, equal 3 when school median student growth percentiles are between 45 and 55, and increase from 3.1 to 3.9 when school median student growth percentiles are between 56 and 79. School median student growth percentile ratings equal 1 when school median student growth percentiles are 20 or less and equal 4 when school median student growth percentiles are 80 or above. The New Jersey Department of Education adopted this formula for both the teacher and principal evaluation systems (figure C4).
School median student growth percentiles in math and English language arts for the 2012/13 pilot year were released in January 2014. This is because, like many states and districts, New Jersey does not receive student achievement growth measures from its test vendor until late fall of the following school year. As a result, pilot districts did not have the school median student growth percentile measures when they submitted the principal evaluation data in July 2013. The lag in receiving the school median student growth
C-11

Figure C4. Transformation of school median student growth percentiles into school median student growth percentile ratings
School median student growth percentile rating
4
3
2
1
0 0 10 20 30 40 50 60 70 80 90 100
School median student growth percentile
Source: Authors’ calculations based on median student growth percentile scores and associated evaluation ratings shown in New Jersey Department of Education presentation (2014a, slide 38).
percentiles means that evaluations that require these measures are not complete until the following school year, which also delays any decisions based on these evaluations.
Summative ratings were not calculated uniformly for the pilot year
The summative rating is a weighted average of the component measure ratings and is converted into four performance categories: ineffective, partially effective, effective, and highly effective. The New Jersey Department of Education, its consultant, and practitioners developed the threshold scores for the four performance categories based on qualitative evidence about teacher (not principal) practice and associated rating scores. The New Jersey Department of Education adopted the threshold scores developed for teacher practice ratings for use with all educators, including principals (figure C5).
For several reasons, neither the districts nor the New Jersey Department of Education formally calculated summative ratings for the pilot year. First, school median student growth percentiles were not released until January 2014, so they could not be used to calculate summative ratings in July 2013, when pilot districts submitted their evaluation data to the New Jersey Department of Education. Second, most pilot districts did not implement or submit ratings on all of the pilot year component measures (for example, human capital management responsibilities and the principal goal measures). Third, summative ratings for the pilot year would not have been informative about ratings in the statewide year because of the changes in the evaluation system between years.
Many districts used their own formulas to calculate summative ratings for the pilot year (table C6). Half the districts that reported summative ratings gave the principal practice instrument rating a weight of 100 percent in the summative rating. This might reflect the perception of some of these districts that their principal practice instruments included a
C-12

Figure C5. Effectiveness rating categories corresponding to summative evaluation scores
Threshold scores for rating categories
Highly effectiveEffective
2.651.85
Partially effectiveIneffective
3.50
1.00 1.50 2.00 2.50 3.00 3.50 4.00
Summative evaluation score
Source: New Jersey Department of Education, 2014a, slide 52.
Table C6. The most common approach to calculating summative ratings in the pilot year was to rely entirely on the principal practice instrument rating, 2012/13
How summative rating was calculated Number of
pilot districts
New Jersey Department of Education–recommended weights: principal practice instrument (40 percent), human capital management (10 percent), aggregated school achievement goals (35 percent), and school-specific student achievement goals (15 percent) 2
Principal practice instrument (100 percent) 4
Principal practice instrument (50 percent), human capital management (10 percent), principal goals (40 percent), school-specific student achievement goals (0.5 percent) 1
Principal practice instrument (75 percent), aggregated school achievement goals and school-specific student achievement goals (25 percent) 1
No summative rating provided 6
Source: Authors’ calculations based on data from the New Jersey Department of Education.
domain measuring human capital management responsibilities and a domain measuring principal goal attainment. Two districts applied the weights recommended by the New Jersey Department of Education to all but one of the individual component measure ratings but gave more weight to the school achievement goals because school median student growth percentile ratings were not available.
C-13

Appendix D. Variation in ratings on the component measures
This appendix contains supplemental information and analyses of the variation of evaluation ratings for each component measure. The number of principals with each component measure rating varies, reflecting the number of districts submitting evaluation data on each component measure to the New Jersey Department of Education. School median student growth percentiles and ratings are available for principals of schools with grades 4–8 statewide.
Means and standard deviations for each component measure rating and for specified samples of principals are shown in table D1.
Information on the variation of scores for each component measure rating by performance category is shown in table D2. The percentage of principals in each effectiveness rating category indicates that some component measure ratings, such as the school median student growth percentile rating, included more principals in the highest and lowest effectiveness rating categories than did other component measure ratings, such as the goals rating. The percentage of principals receiving a rating of exactly 3.0 on each component measure highlights the issue of low variability for some measures (such as the goals rating). Measures with low variability have less ability to distinguish varying levels of principal performance.
Table D1. Summary statistics for principal evaluation ratings and school median student growth percentiles, 2012/13
Component measure Sample Mean Standard deviation
Number of schools or principals
Principal practice rating Pilot principals with this rating 2.86 0.63
School median student growth percentile Principals statewide with this rating 50.42 9.60 1,742
School median student growth percentile rating Principals statewide with this rating 2.99 0.34 1,742
School median student growth percentile Pilot principals with this rating 46.65 11.15
School median student growth percentile rating Pilot principals with this rating 2.84 0.47
Human capital management responsibilities Pilot principals with this rating 2.89 0.24
Principal goals Pilot principals with this rating 3.20 0.47
Principal practice rating Pilot principals with both the practice rating and school median student growth percentiles 2.85 0.67 131
School median student growth percentile rating Pilot principals with both the practice rating and school median student growth percentile 2.84 0.47 131
Source: Authors’ calculations based on data from the New Jersey Department of Education.
D-1
192
132
132
16
27

Table D2. Percentage of principals in each performance category, 2012/13
Component measure Sample
Performance category Percentage of principals with rating
of 3.0
Number of schools or principals Ineffective
Partially effective Effective
Highly effective
Principal practice rating Pilot principals with this rating 2.60 30.21 45.83 21.35 29.69 192
School median student Pilot principals statewide with growth percentile rating this rating 1.55 9.41 82.20 6.83 44.26 1,742
School median student Pilot principals with this rating growth percentile rating 5.30 19.70 68.94 6.06 37.12 132
Human capital Pilot principals with this rating management responsibilities 0 18.75 81.25 0 56.25 16
Principal goals Pilot principals with this rating 0 11.11 55.56 33.33 55.56 27
Principal practice rating Pilot principals with both the practice rating and school median student growth percentiles 3.05 32.82 39.69 24.43 27.48
School median student Pilot principals with both the growth percentile rating practice rating and school median
student growth percentiles 5.34 19.85 68.70 6.11 36.64 131
Source: Authors’ calculations based on data from the New Jersey Department of Education.
D-2
131

Notes
1. The clustering at 3.5 is due to one district classifying performance into five categories and mapping the second highest category to a value of 3.5. The highest category was mapped to a value of 4, and the middle category was mapped to a value of 3.
2. In 2013/14 principals statewide in New Jersey were rated based on school median student growth percentile for the first time. The analysis in this report transforms school median student growth percentile for 2011/12 and 2012/13 into school median student growth percentile ratings based on the formula used for 2013/14 in order to explore statistical properties of the measure, but the ratings were not actually applied to principals in those years.
3. Application scores were based on ratings of the project description; goals, objectives, and indicators; project activity plan; organizational commitment and capacity; and budget. Application scores were used to rank applicants within their geographic region (Northern, Central, and Southern), and awards were granted based on applicants’ rank within their region subject to applicants attaining a minimum score of 65 points (out of a possible 100). The districts that were not selected for the pilot did not attain the minimum score.
4. For the district that provided two ratings, the goal rating was calculated as the average of the two ratings.
5. Two districts did not respond to the question about successes or the question about challenges.
6. Two districts were in the process of establishing school achievement goals, and one district did not respond.
Notes-1

References
Allen, D. (2001). Getting things done. New York, NY: Penguin.
Betebenner, D. W. (2007). Estimation of student growth percentiles for the Colorado Student Assessment Program. Dover, NH: National Center for the Improvement of Educational Assessment.
Branch, G., Hanushek, E., & Rivkin, S. (2012). Estimating the effect of leaders on public sector productivity: The case of school principals (Working paper). Cambridge, MA: National Bureau of Economic Research. http://eric.ed.gov/?id=ED529199
Catano, N., & Stronge, J. H. (2006). What are principals expected to do? Congruence between principal evaluation and performance standards. National Association of Secondary School Principals Bulletin, 90(3), 221–237.
Catano, N., & Stronge, J. H. (2007). What do we expect of school principals? Congruence between principal evaluation and performance standards. International Journal of Leadership in Education, 10(4), 379–399.
Chiang, H., Lipscomb, S., & Gill, B. (in press). Is school value-added indicative of principal quality? Journal of Education Finance and Policy.
Coelli, M., & Green, D. (2012). Leadership effects: School principals and student outcomes. Economics of Education Review, 31(1), 92–109. http://eric.ed.gov/?id=EJ953968
Collins, J. (2001). Good to great. New York, NY: Harper Business.
Colorado Department of Education, Accountability and Data Analysis Unit. (2013). Colorado growth model—Brief report: Student growth percentiles and FRL status. Denver, CO: Colorado Department of Education. Retrieved August 7, 2014, from http://www.cde. state.co.us/sites/default/files/CGM_SGP_FRL_Brief.pdf.
Council of Chief State School Officers. (2008). Educational leadership policy standards: ISLLC 2008. Washington, DC: Author. Retrieved August 7, 2014, from http://www.ccsso.org/ Resources/Publications/Educational_Leadership_Policy_Standards_ISLLC_2008_ as_Adopted_by_the_National_Policy_Board_for_Educational_Administration.html.
Dhuey, E., & Smith, J. (2012). How school principals influence student learning (Working paper). Toronto, ON: University of Toronto. http://eric.ed.gov/?id=ED535648
Dhuey, E., & Smith, J. (2014). How important are school principals in the production of student achievement? Canadian Journal of Economics, 47(2), 634–663.
DuFour, R. (2003). Building a professional learning community. The School Administrator, 60(5), 13–18.
DuFour, R., Eaker, R., & Karhanek, G. (2004). Whatever it takes: How professional learning communities respond when kids don’t learn. Bloomington, IN: Solution Tree.
Ref-1

Goldring, E., Cravens, X. C., Murphy, J., Porter, A. C., Elliott, S. N., & Carson, B. (2009). The evaluation of principals: What and how do states and urban districts assess leadership? Elementary School Journal, 110(1), 19–39. http://eric.ed.gov/?id=EJ851761
Grissom, J. A., Kalogrides, D., & Loeb, S. (2015). Using student test scores to measure principal performance. Educational Evaluation and Policy Analysis, 37(1), 3–28.
Marshall, K. (2009). Rethinking teacher supervision and evaluation. Hoboken, NJ: Wiley Jossey-Bass.
Marzano, R. J. (2003). What works in schools: Translating research into action. Alexandria, VA: Association for Supervision and Curriculum Development.
Marzano, R. J. (2004). Validity and reliability report for snapshot survey of school effectiveness factors. Englewood, CO: Marzano and Associates.
Marzano, R. J. (2005). School leadership that works. Alexandria, VA: Association for Supervision and Curriculum Development.
Marzano Research Laboratory. (2011). What works in Oklahoma schools: Phase I state report. Englewood, CO: Author.
Murphy, J., & Pimentel, S. (1996). Grading principals: Administrator evaluations come of age. Phi Delta Kappan, 78(1), 74.
New Jersey Department of Education. (2012a). New Jersey Department of Education approved principal practice evaluation instruments as of December 21, 2012. Trenton, NJ: Author. Retrieved August 7, 2014, from http://www.state.nj.us/education/archive/EE4NJ/providers/approvedprincipallist.doc.
New Jersey Department of Education. (2012b). Notice of grant opportunity. Trenton, NJ: Author. Retrieved August 7, 2014, from http://www.state.nj.us/education/archive/EE4NJ/ngo.
New Jersey Department of Education. (2013a). 2011–12 Evaluation Pilot Advisory Committee (EPAC): Interim report. Trenton, NJ: Author. Retrieved August 7, 2014, from http:// www.state.nj.us/education/AchieveNJ/resources/EPACInterim11–12.pdf.
New Jersey Department of Education. (2013b). Evaluation Pilot Advisory Committee (EPAC): Final report. Trenton, NJ: Author. Retrieved August 7, 2014, from http://www. state.nj.us/education/AchieveNJ/resources/FinalEPACReport.pdf.
New Jersey Department of Education. (2013c). Sample administrator template and goals. Trenton, NJ: Author. Retrieved August 7, 2014, from http://www.nj.gov/education/ AchieveNJ/principal/SampleAdministratorGoals.pdf.
New Jersey Department of Education. (2014a). AchieveNJ: Increasing student achievement through educator effectiveness. Presentation to New Jersey school districts. Trenton, NJ: Author. Retrieved August 7, 2014, from http://www.state.nj.us/education/AchieveNJ/ intro/OverviewPPT.pdf.
Ref-2
New Jersey Department of Education. (2014b). New Jersey Department of Education approved principal practice evaluation instruments as of April 15, 2014. Trenton, NJ: Author. Retrieved August 7, 2014, from http://www.state.nj.us/education/AchieveNJ/teacher/ approvedprincipallist.doc.
New Jersey Department of Education. (2014c). User guide for the teacher median student growth percentile report. Trenton, NJ: Author. Retrieved August 7, 2014, from http:// www.state.nj.us/education/AchieveNJ/teacher/percentile/mSGPuserguide.pdf.
New Jersey Educator Effectiveness Task Force. (2011). Interim report. Trenton, NJ: New Jersey Department of Education. Retrieved August 7, 2014, from http://www.state.nj.us/ education/educators/effectiveness.pdf.
Reeves, D. B. (2006). The learning leader. Alexandria, VA: Association for Supervision and Curriculum Development.
Reeves, D. B. (2010). Finding your leadership focus: What matters most for student results. New York, NY: Teachers College Press.
Shen, J., Cooley, V., Ma, X., Reeves, P., Burt, W., Rainey, M., & Wen, Y. (2007). Data-informed decision-making on high-impact strategies: A measurement tool for school principals. Kalamazoo, MI: Michigan Coalition of Educational Leadership.
Stronge, J. H. (2008). Qualities of effective principals. Alexandria, VA: Association for Supervision and Curriculum Development.
Stronge, J. H., Xu, X., Leeper, L., & Tonneson, V. C. (2013). Principal evaluation: Standards, rubrics, and tools for effective performance. Alexandria, VA: Association for Supervision and Curriculum Development.
Sullivan, S., & Glanz, J. (2005). Supervision that improves teaching. Thousand Oaks, CA: Corwin.
Teh, B., Chiang, H., Lipscomb, S., & Gill, B. (2014). Measuring school leaders’ effectiveness: An interim report from a multiyear pilot of Pennsylvania’s Framework for Leadership (REL 2015–058). Washington, DC: U.S. Department of Education, Institute of Education Sciences, National Center for Education Evaluation and Regional Assistance, Regional Educational Laboratory Mid-Atlantic. http://eric.ed.gov/?id=ED550494
Waters, J. T., Marzano, R. J., & McNulty, B. (2003). Balanced leadership: What 30 years of research tells us about the effect of leadership on student achievement. Aurora, CO: Mid-continent Research for Education and Learning.
Wiggins, G., & McTighe, J. (2007). Schooling by design. Alexandria, VA: Association for Supervision and Curriculum Development.
Ref-3
The Regional Educational Laboratory Program produces 7 types of reports
Making Connections Studies of correlational relationships
Making an Impact Studies of cause and effect
What’s Happening Descriptions of policies, programs, implementation status, or data trends
What’s Known Summaries of previous research
Stated Briefly Summaries of research findings for specific audiences
Applied Research Methods Research methods for educational settings
Tools Help for planning, gathering, analyzing, or reporting data or research