measuring post acute care outcomes in … post acute care outcomes in snfs ... 24 hr rn or nurse...
TRANSCRIPT

MEASURING POST ACUTE CARE
OUTCOMES IN SNFS
David Gifford MD MPH
American Health Care Association
Atlantic City, NJ
Mar 17th, 2015
Principles Guiding Measure Selection
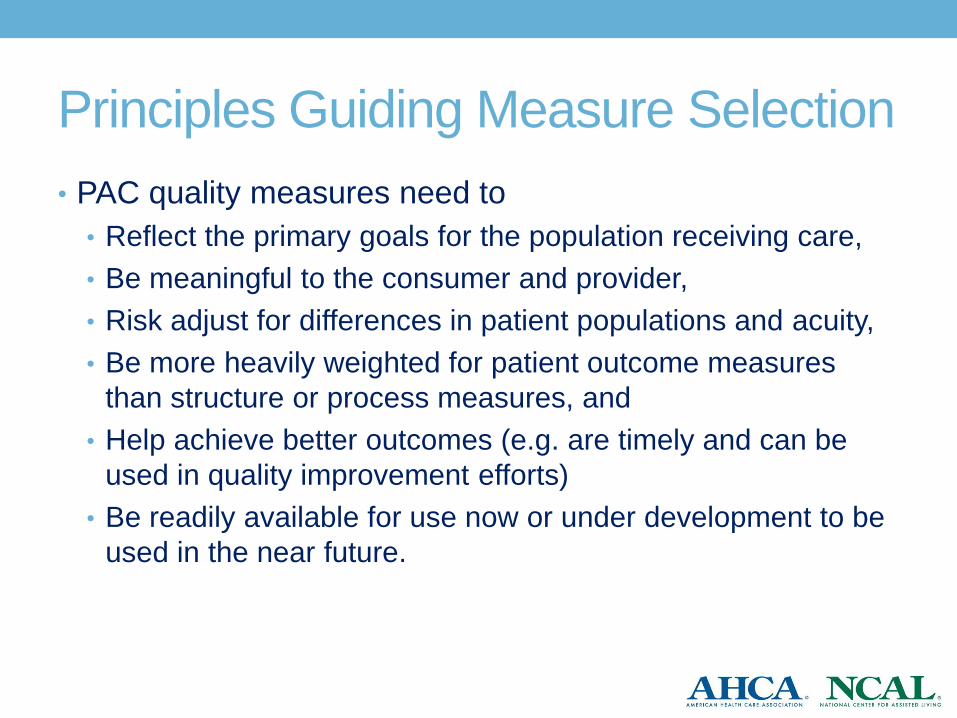
• PAC quality measures need to
• Reflect the primary goals for the population receiving care,
• Be meaningful to the consumer and provider,
• Risk adjust for differences in patient populations and acuity,
• Be more heavily weighted for patient outcome measures
than structure or process measures, and
• Help achieve better outcomes (e.g. are timely and can be
used in quality improvement efforts)
• Be readily available for use now or under development to be
used in the near future.

Primary Purpose of PAC Care
• Assist individuals return to their prior living situation as
quickly as possible
• Avoid rehospitalization
• Improve the individual’s function related to mobility, self-
care (e.g. ADLs), and speech
• Improve their clinical condition (e.g. wounds)
• Complete course of skilled nursing medical care
• (e.g. IV medications such as antibiotics),
• Learn to manage their disease illness better
• (e.g. how to administer medications)

Framework for Measure Portfolio
•Grouped measures into those that apply to
• “short stay” individuals seeking post-acute care
• “long stay” individuals requiring long term care
•Classify measures using Donabedian’s
classic framework
• Structure (e.g. staffing, equipment, etc)
• Processes (e.g. treatments, meds, tests, etc)
• Outcomes (function, disease, satisfaction, etc)

Short Stay: Structural Measures
• CMS-State Survey Inspection score
• Staffing component on CMS Five Star
• Baldrige recipient • e.g. AHCA Quality Award silver/gold recipients
• Nurse Staff turnover
• Nursing presence • e.g., 24 hr RN or Nurse Practitioner available
• Staff satisfaction

Short Stay: Process Measures
• CMS nursing home compare QMs
• % immunized for both influenza and pneumovax
• Antipsychotics started during first 100 days
• Transitions of care measure
• modified version for SNF use of the CTM-3 patient interview
measure on three items: provider addressed post-discharge needs,
understand health instructions; understand purpose of medications)

Short Stay: Outcome Measures
• 30d risk-adjusted rehospitalization following admission
• Risk-adjusted % discharged to community
• Improved function in:
• self-care and mobility – risk adjusted (based on CARE tool)
• speech/communication based on NOMs
• CMS nursing home compare QMs
• % new pressure ulcers
• % with untreated pain
• Resident/Family Satisfaction
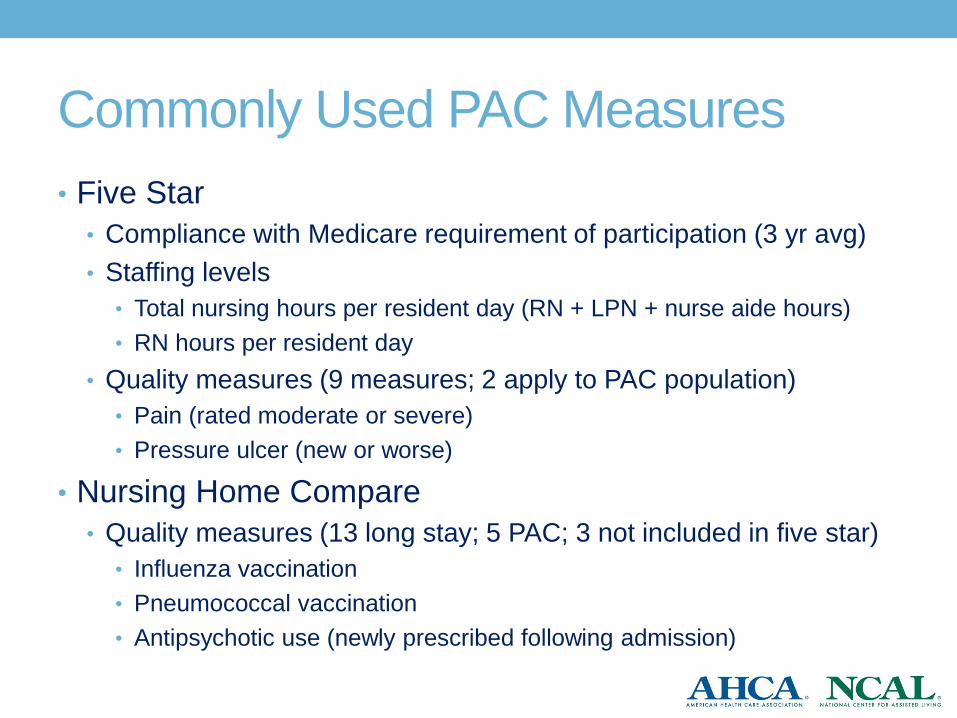
Commonly Used PAC Measures
• Five Star
• Compliance with Medicare requirement of participation (3 yr avg)
• Staffing levels
• Total nursing hours per resident day (RN + LPN + nurse aide hours)
• RN hours per resident day
• Quality measures (9 measures; 2 apply to PAC population)
• Pain (rated moderate or severe)
• Pressure ulcer (new or worse)
• Nursing Home Compare
• Quality measures (13 long stay; 5 PAC; 3 not included in five star)
• Influenza vaccination
• Pneumococcal vaccination
• Antipsychotic use (newly prescribed following admission)

Data Sources in PAC setting
• Medicare claims (SNF part A, B or D or Hospital part A)
• Minimum Data Set (MDS)
• >500 clinical, functional, treatment or demographic data elements
collected at admission, and regular intervals thereafter for anyone
admitted to a nursing home from anywhere.
• Medical Record Review
• Patient interview/survey
• CMS survey inspection results
• Medicare Cost reports

Sample size
• NQF & CMS and basic statistics requires a minimum
denominator size for most measures of 25-30 people
• Smaller sample sizes result in large fluctuations over time due to
sample size and patient population rather than changes in care
delivery
• Sample size precludes most measures being stratified by
• Diagnoses
• Payor
• Patient characteristics

# of Facilities vs # of Part A Admissions
2009 2010 2011
Number
of
Facilities
%
of
Total
Number
of
Facilities
%
of
Total
Number
of
Facilities
% of
Total
TOTAL 15,453 15,449 15,395
Low volume (≤ 100 stays/ year)
6,766 44%
6,744 44%
7,773 50%
Moderate volume (101-200 stays/ year)
4,678 30%
4,591 30%
4,449 29%
High volume (201-300 stays/ year)
2,061 13%
2,103 14%
1,784 12%
Very high volume (>300 stays/ year)
1,948 13%
2,011 13%
1,389 9%
11
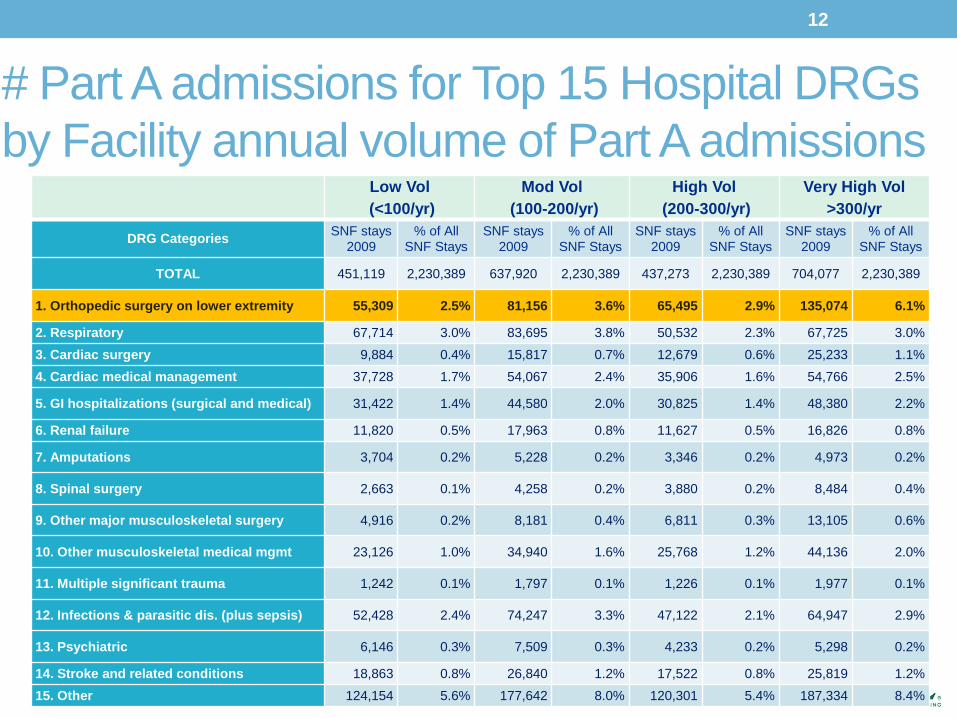
# Part A admissions for Top 15 Hospital DRGs
by Facility annual volume of Part A admissions
Low Vol
(<100/yr)
Mod Vol
(100-200/yr)
High Vol
(200-300/yr)
Very High Vol
>300/yr
DRG Categories SNF stays
2009 % of All
SNF Stays SNF stays
2009 % of All
SNF Stays SNF stays
2009 % of All
SNF Stays SNF stays
2009 % of All
SNF Stays
TOTAL 451,119 2,230,389 637,920 2,230,389 437,273 2,230,389 704,077 2,230,389
1. Orthopedic surgery on lower extremity 55,309 2.5% 81,156 3.6% 65,495 2.9% 135,074 6.1%
2. Respiratory 67,714 3.0% 83,695 3.8% 50,532 2.3% 67,725 3.0%
3. Cardiac surgery 9,884 0.4% 15,817 0.7% 12,679 0.6% 25,233 1.1%
4. Cardiac medical management 37,728 1.7% 54,067 2.4% 35,906 1.6% 54,766 2.5%
5. GI hospitalizations (surgical and medical) 31,422 1.4% 44,580 2.0% 30,825 1.4% 48,380 2.2%
6. Renal failure 11,820 0.5% 17,963 0.8% 11,627 0.5% 16,826 0.8%
7. Amputations 3,704 0.2% 5,228 0.2% 3,346 0.2% 4,973 0.2%
8. Spinal surgery 2,663 0.1% 4,258 0.2% 3,880 0.2% 8,484 0.4%
9. Other major musculoskeletal surgery 4,916 0.2% 8,181 0.4% 6,811 0.3% 13,105 0.6%
10. Other musculoskeletal medical mgmt 23,126 1.0% 34,940 1.6% 25,768 1.2% 44,136 2.0%
11. Multiple significant trauma 1,242 0.1% 1,797 0.1% 1,226 0.1% 1,977 0.1%
12. Infections & parasitic dis. (plus sepsis) 52,428 2.4% 74,247 3.3% 47,122 2.1% 64,947 2.9%
13. Psychiatric 6,146 0.3% 7,509 0.3% 4,233 0.2% 5,298 0.2%
14. Stroke and related conditions 18,863 0.8% 26,840 1.2% 17,522 0.8% 25,819 1.2%
15. Other 124,154 5.6% 177,642 8.0% 120,301 5.4% 187,334 8.4%
12
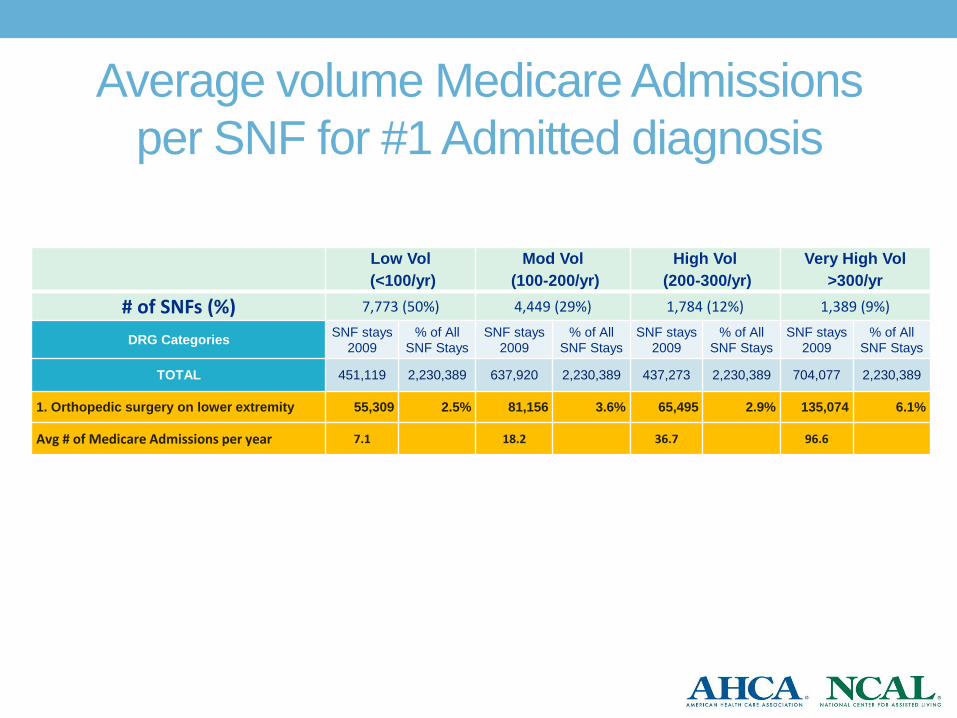
Average volume Medicare Admissions
per SNF for #1 Admitted diagnosis
Low Vol
(<100/yr)
Mod Vol
(100-200/yr)
High Vol
(200-300/yr)
Very High Vol
>300/yr
# of SNFs (%) 7,773 (50%) 4,449 (29%) 1,784 (12%) 1,389 (9%)
DRG Categories SNF stays
2009 % of All
SNF Stays SNF stays
2009 % of All
SNF Stays SNF stays
2009 % of All
SNF Stays SNF stays
2009 % of All
SNF Stays
TOTAL 451,119 2,230,389 637,920 2,230,389 437,273 2,230,389 704,077 2,230,389
1. Orthopedic surgery on lower extremity 55,309 2.5% 81,156 3.6% 65,495 2.9% 135,074 6.1%
Avg # of Medicare Admissions per year 7.1 18.2 36.7 96.6

AHCA DEVELOPED
PAC QUALITY MEASURES

AHCA Developed PAC Measures
• PointRight Pro 30 Rehospitalization (now available)
• Discharge Back to the Community (now available)
• Length of Stay (Feb 2015)
• Improvement in Functional Status* (Jan 2015)
• Mobility (based on CARE tool)
• Self-Care (based on CARE tool)
• Customer Satisfaction** (Jan 2015)
* Requires use of CARE tool linked with MDS admission data
** Requires use of AHCA CoreQ satisfaction questionnaire

Use of AHCA PAC Measures
• AHCA PointRight Pro 30 Rehospitalization
measure endorsed by NQF Dec 2014
• ACOs/MCOs currently using this measure
• 3 MA Pioneer ACOs (Rehosp & Satisfaction)
• 1 MA dual-eligible MCO (Rehosp)
• 1 NJ ACO (Rehosp & DC back to Community & LOS)
• 1 SC Care Management Co (Rehosp)
• 1 large national PAC management co (Rehosp & DC
to Community)

WHERE DO I GET MY
DATA?

Your
Member
Resource
Survey History
CMS Five Star Rating
Resident Characteristics
Staffing Information
AHCA Post-Acute Measures
www.ltctrendtracker.com
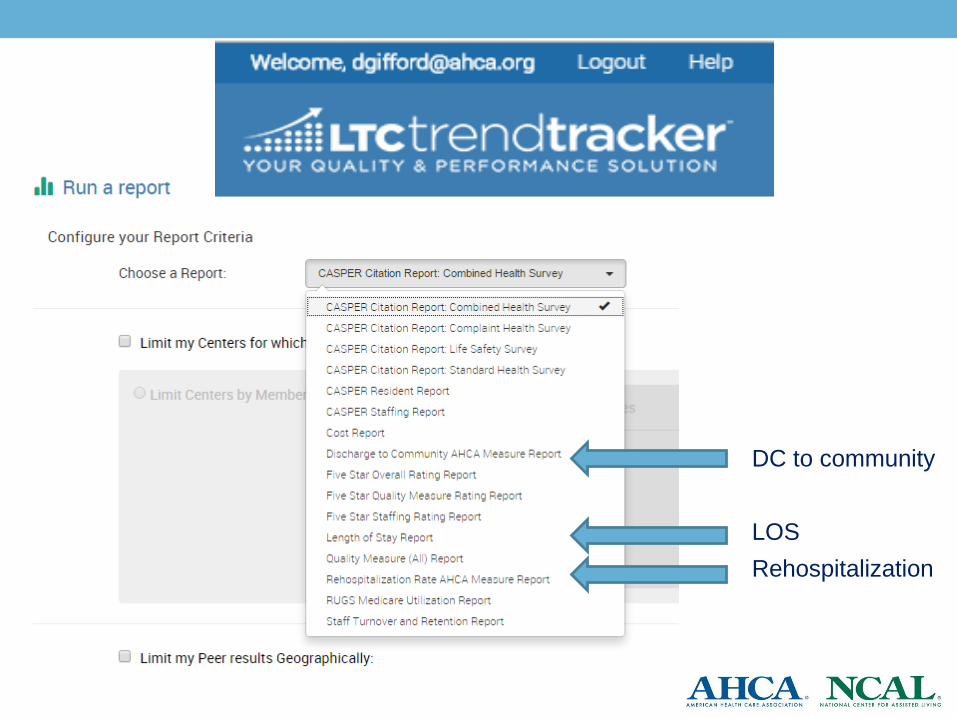
DC to community
LOS
Rehospitalization

MEASURING HOSPITAL
READMISSIONS

• Readmissions = all patients admitted to a SNF from a
hospital for SNF Part A services who are sent back to any
hospital for any reasons within the next 30 days for either
inpatient admission or observation status
Day SNF Rehospitalization
Actual to Expected Ratio is key
Ratio is >1 you rehospitalized more people than expected
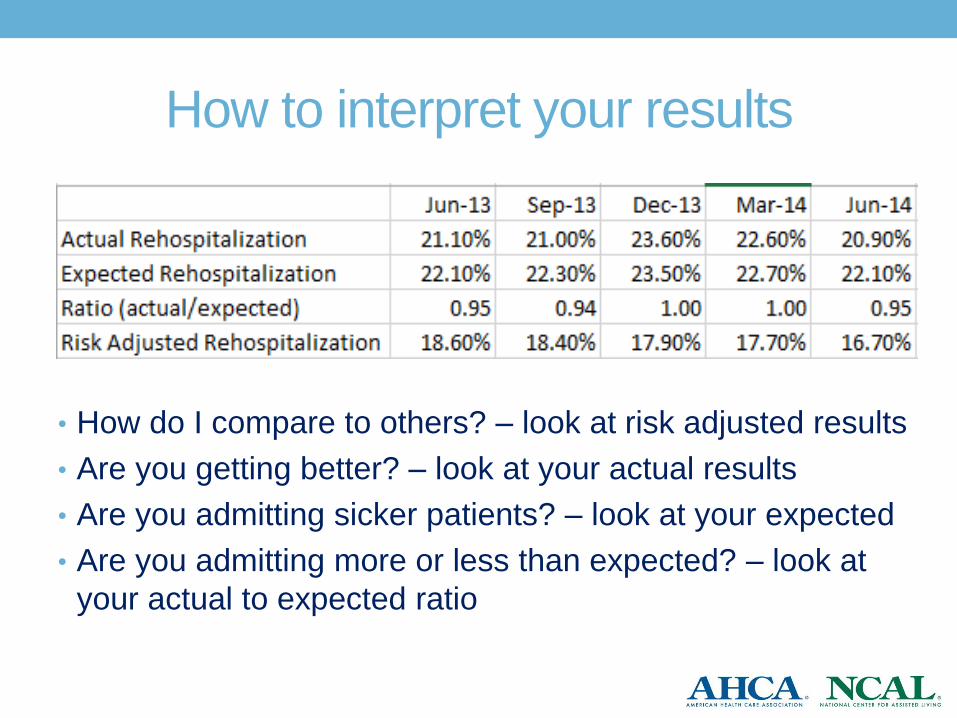
How to interpret your results
• How do I compare to others? – look at risk adjusted results
• Are you getting better? – look at your actual results
• Are you admitting sicker patients? – look at your expected
• Are you admitting more or less than expected? – look at
your actual to expected ratio
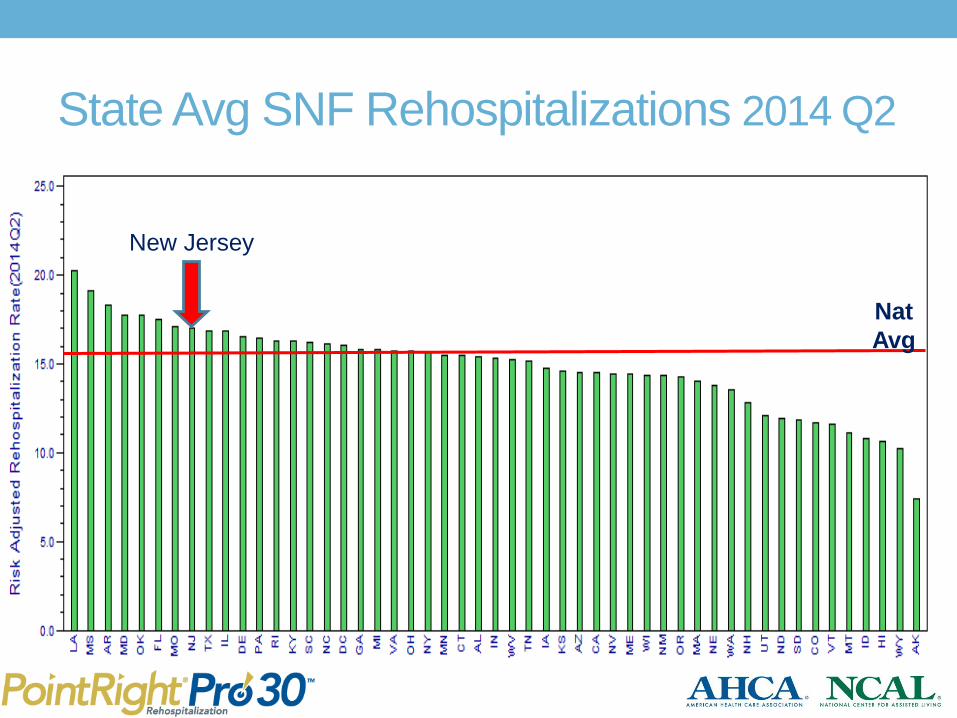
State Avg SNF Rehospitalizations 2014 Q2
Nat
Avg
New Jersey
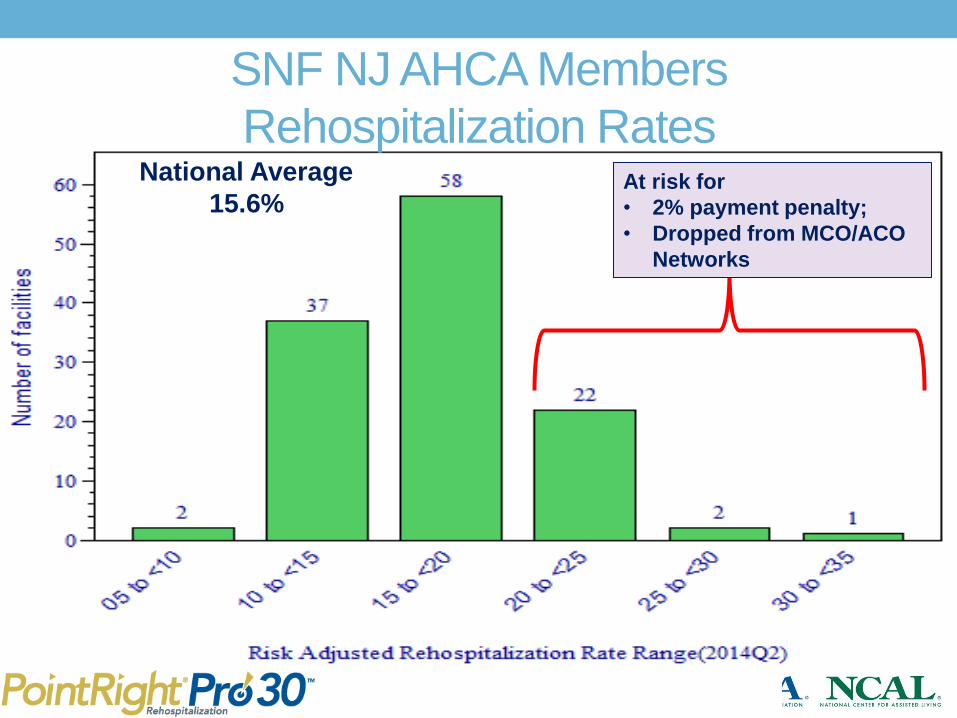
SNF NJ AHCA Members
Rehospitalization Rates National Average
15.6% At risk for
• 2% payment penalty;
• Dropped from MCO/ACO
Networks
MEASURING DISCHARGE BACK
TO COMMUNITY
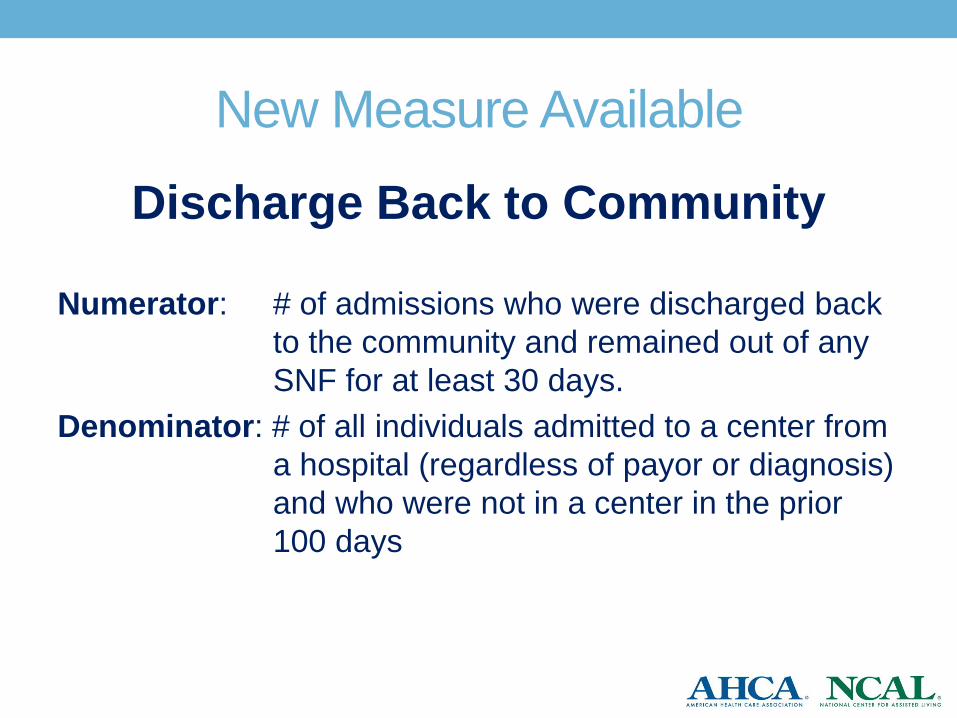
New Measure Available
Discharge Back to Community
Numerator: # of admissions who were discharged back
to the community and remained out of any
SNF for at least 30 days.
Denominator: # of all individuals admitted to a center from
a hospital (regardless of payor or diagnosis)
and who were not in a center in the prior
100 days

National Discharge to Community Rates
Among AHCA members
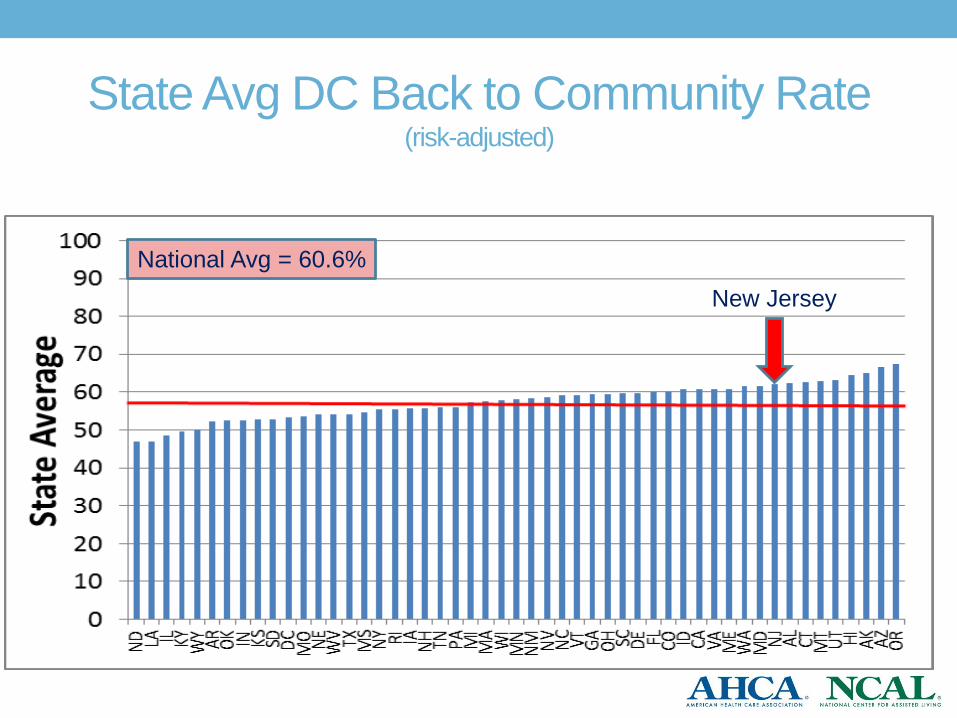
State Avg DC Back to Community Rate (risk-adjusted)
New Jersey
National Avg = 60.6%

CUSTOMER
SATISFACTION
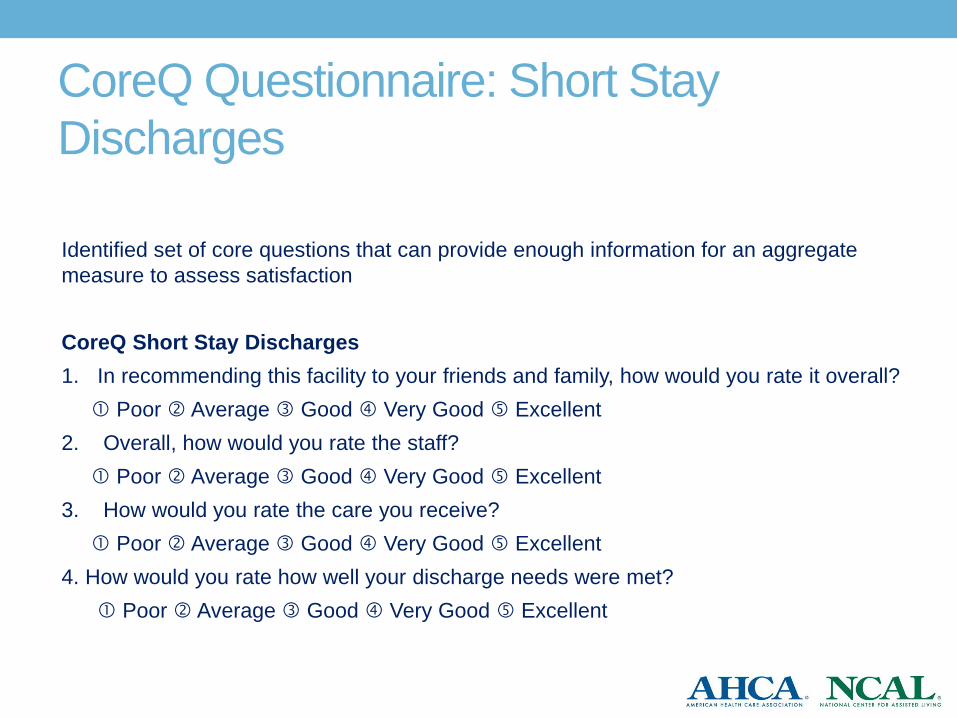
CoreQ Questionnaire: Short Stay
Discharges
Identified set of core questions that can provide enough information for an aggregate
measure to assess satisfaction
CoreQ Short Stay Discharges
1. In recommending this facility to your friends and family, how would you rate it overall?
Poor Average Good Very Good Excellent
2. Overall, how would you rate the staff?
Poor Average Good Very Good Excellent
3. How would you rate the care you receive?
Poor Average Good Very Good Excellent
4. How would you rate how well your discharge needs were met?
Poor Average Good Very Good Excellent
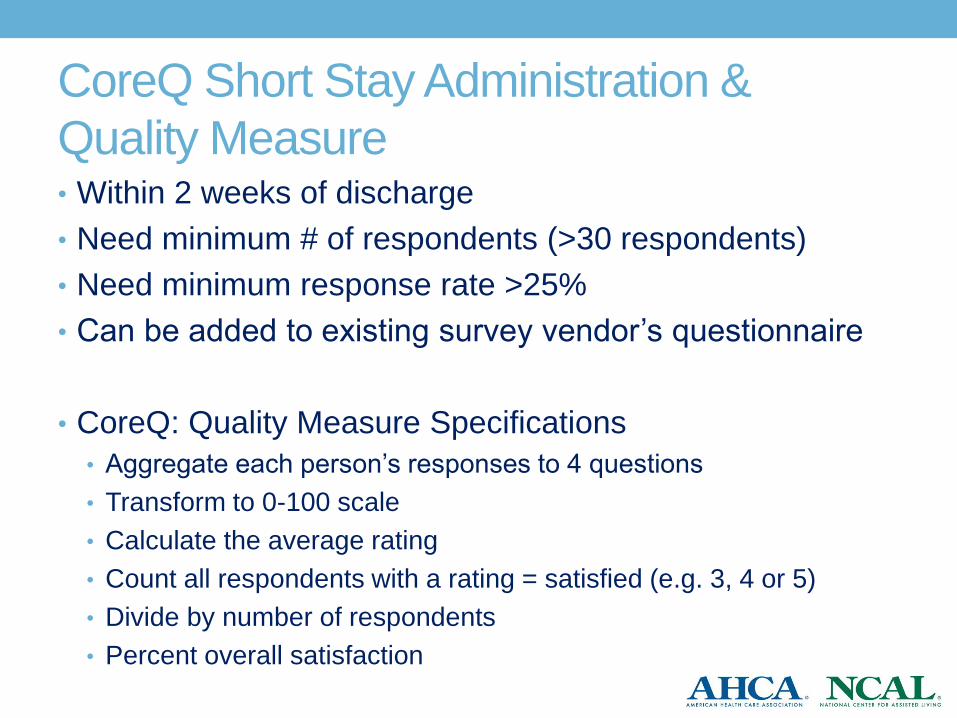
CoreQ Short Stay Administration &
Quality Measure • Within 2 weeks of discharge
• Need minimum # of respondents (>30 respondents)
• Need minimum response rate >25%
• Can be added to existing survey vendor’s questionnaire
• CoreQ: Quality Measure Specifications
• Aggregate each person’s responses to 4 questions
• Transform to 0-100 scale
• Calculate the average rating
• Count all respondents with a rating = satisfied (e.g. 3, 4 or 5)
• Divide by number of respondents
• Percent overall satisfaction

CoreQ Long Stay Residents: Scores in
Pilot

MEASURING LENGTH OF STAY
(LOS) IN SNF
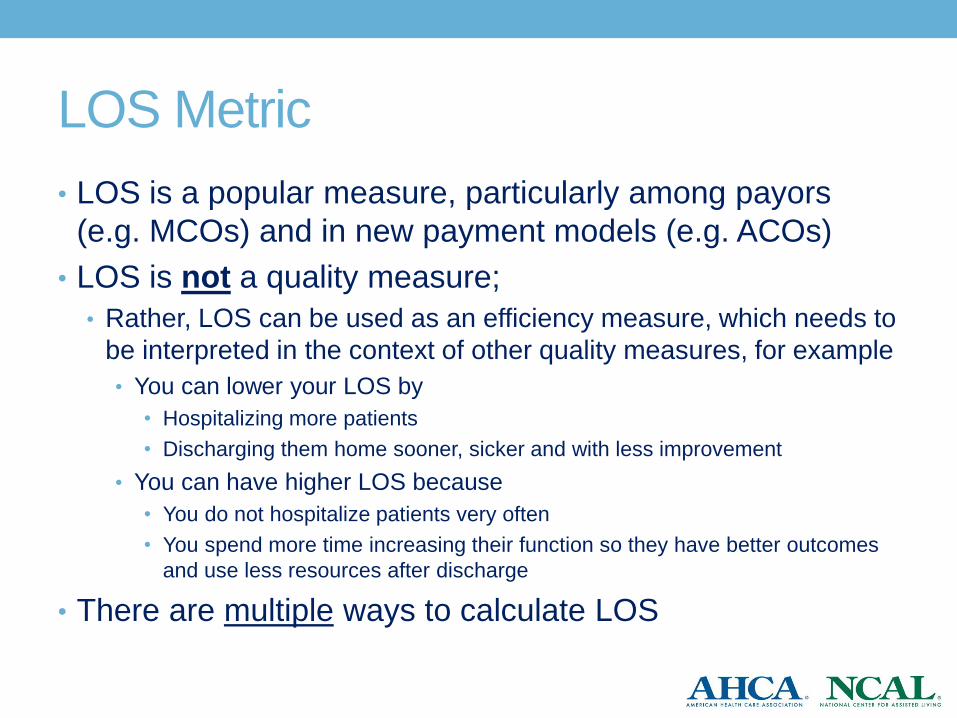
LOS Metric
• LOS is a popular measure, particularly among payors
(e.g. MCOs) and in new payment models (e.g. ACOs)
• LOS is not a quality measure;
• Rather, LOS can be used as an efficiency measure, which needs to
be interpreted in the context of other quality measures, for example
• You can lower your LOS by
• Hospitalizing more patients
• Discharging them home sooner, sicker and with less improvement
• You can have higher LOS because
• You do not hospitalize patients very often
• You spend more time increasing their function so they have better outcomes
and use less resources after discharge
• There are multiple ways to calculate LOS
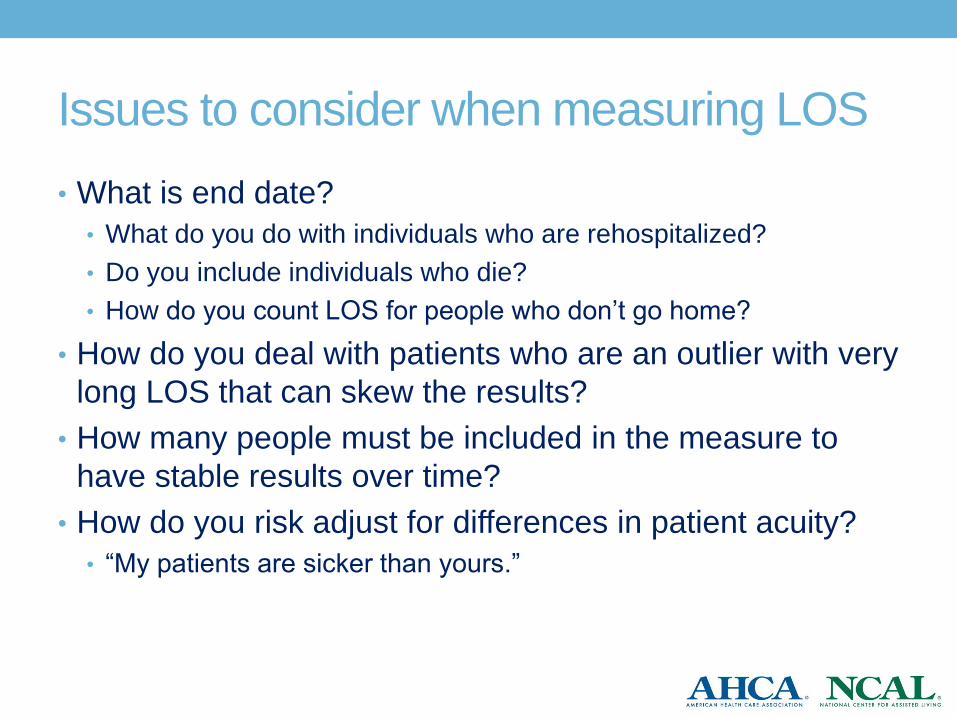
Issues to consider when measuring LOS
• What is end date?
• What do you do with individuals who are rehospitalized?
• Do you include individuals who die?
• How do you count LOS for people who don’t go home?
• How do you deal with patients who are an outlier with very
long LOS that can skew the results?
• How many people must be included in the measure to
have stable results over time?
• How do you risk adjust for differences in patient acuity?
• “My patients are sicker than yours.”
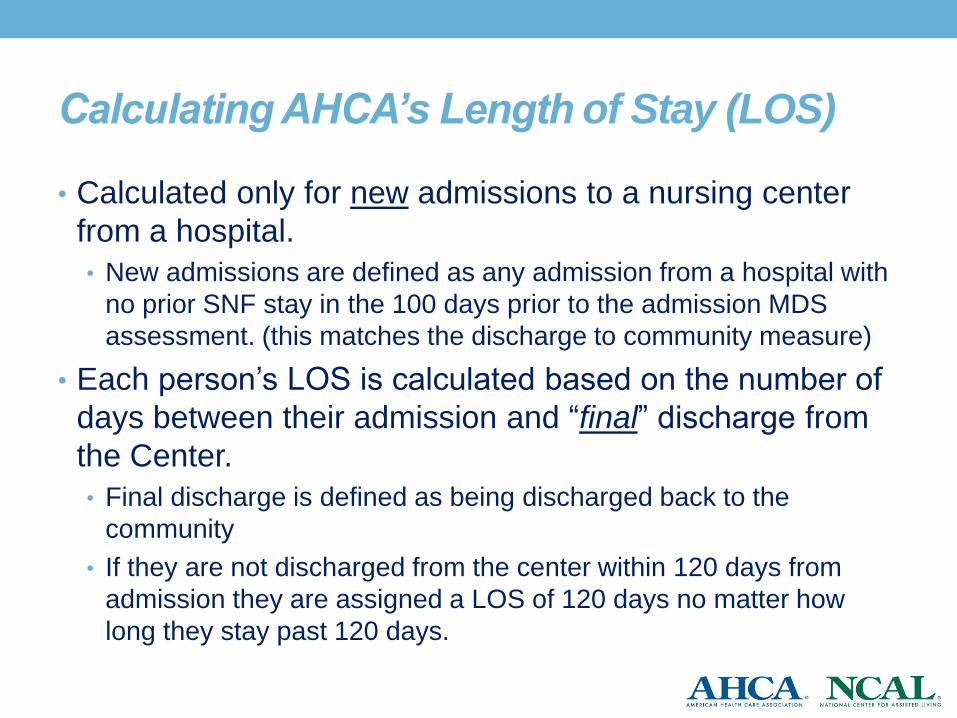
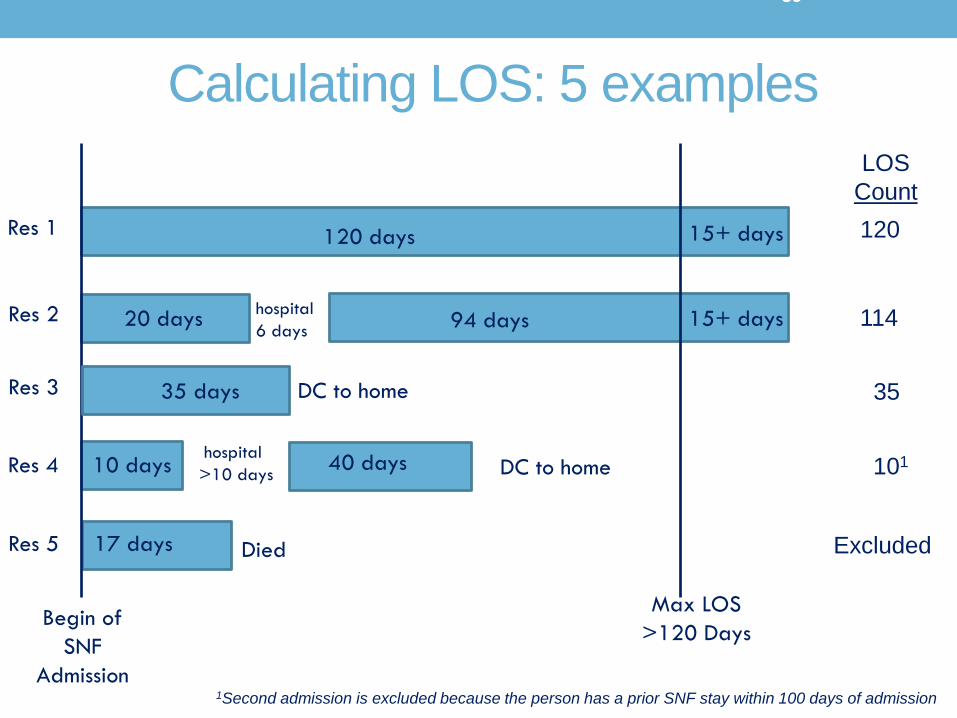
Calculating AHCA’s Length of Stay (LOS)
• Calculated only for new admissions to a nursing center
from a hospital.
• New admissions are defined as any admission from a hospital with
no prior SNF stay in the 100 days prior to the admission MDS
assessment. (this matches the discharge to community measure)
• Each person’s LOS is calculated based on the number of
days between their admission and “final” discharge from
the Center.
• Final discharge is defined as being discharged back to the
community
• If they are not discharged from the center within 120 days from
admission they are assigned a LOS of 120 days no matter how
long they stay past 120 days.

What happens when a person is
rehospitalized?
• When an individual has an interruption in service
(e.g. rehospitalization) that is 10 days or less,
their LOS before and after rehospitalization are
added together.
• When an individual has an interruption in service
that is greater than 10 days; their LOS ends on
the day of interruption (e.g. discharge to the
hospital). • The LOS following their readmission is not counted in these cases.

What happens when a person dies?
• When an individual dies during their SNF stay: • They are not counted in the LOS metrics
39
Calculating LOS: 5 examples
Begin of
SNF
Admission
Max LOS
>120 Days
Res 1
Res 2
Res 3
Res 4
Res 5
120 days
17 days
10 days
35 days
94 days 20 days
15+ days
15+ days
hospital
>10 days
DC to home
hospital
6 days
40 days
Died
DC to home
LOS
Count
120
114
35
101
Excluded
1Second admission is excluded because the person has a prior SNF stay within 100 days of admission
How do you count LOS for people who
don’t go home?
• If you only count people who go home, • you make your LOS look shorter
• If you also count people who do not go home,
• what is their end date for counting their LOS?
• They will have a very long LOS that will skew your results
• Three ways to address this
• Count all people but truncate LOS after a certain time for those who
do not go home (e.g. after 120 days)
• Calculate the Median LOS not the Average (or Mean) LOS
• Calculate % of people who stay fewer than a certain number of
days (e.g., % who stay 14 days or fewer)

Median vs Average LOS
•When you have individuals with outlier LOS,
they can skew the average. • Example:
• You have 5 patients, with LOS of 8, 12, 20, 40, 120 days
• Average is (8+12+20+40+120)/5 = 40 days
• Median is 8, 12, 20, 40, 120 20 days
Midpoint value where half
have a LOS less and half
have a LOS greater

AHCA LOS Metrics
#1 Total Median LOS in days for all admissions
#2 Another way to look at LOS besides calculating the total
LOS in days is to look at how many people stay for
certain periods of time
• How many have LOS of 7 or fewer days
• How many have LOS of 14 or fewer days
• How many have LOS of 20 or fewer days
• How many have LOS of 45 or fewer days

% Staying 7, 14, 20 or 45 days or fewer
• Each metric [staying <7, <14, <20, and <45 days] is calculated by
• XX = either 7, 14, 20, or 45 days
• Example: The percentage staying 14 days or fewer is calculated by dividing the number of individuals with LOS 14 days or fewer by the total number of admissions from a hospital that did not have a prior stay in a SNF within the 100 days of admission and did not die before 14 days

% Admissions Staying “x” days of fewer
-
20,000
40,000
60,000
80,000
100,000
120,000
2 6 10 14 18 22 26 30 34 38 42 46 50 54 58 62 66 70 74 78 82 86 90 94 98 170
Nu
mb
er o
f S
NF
sta
ys
Medicare Covered Length of Stay (in Days)
Distribution of All1 SNF Stays in 2011
Stay <45 days
Stay <20 days
Stay <14d
<7d
1All Part A SNF admissions excluding those with hospitalization or death

Risk Adjustment
• The risk-adjusted LOS is calculated by…
• Common formula that looks at the ratio of what is actually happening
compared to the “expected” which is based on the experience similar
patients have on average across the country.

Data Available in LTC Trend Tracker
• Insert screen shot for drop down menu for creating report
showing LOS report

LOS Report in LTC Trend Tracker
Contact Information
David Gifford MD MPH
SR VP for Quality & Regulatory Affairs
American Health Care Association
120 L St. NW
Washington DC 20005
202-898-3161
www.ahcancal.org