measuring performance - personal banking | bmo … working capital ratio would be 2.5:1 • indf...
TRANSCRIPT

Measuring performance
• Importance of tracking performance
• How to measure performance
• Internal and external yardsticks
• Early warning system
B u s I n E s s C O a C H s E r I E s

Is your business doing well?
B u s I n e s s C o a C h s e r I e s
The situation
You prefer being your own boss and
running your own show. You are happy
with the progress you’ve made so far.
However, you’re not sure whether your
business is earning as much as it should
be, considering the hours and effort
you’re putting into it. You may even
have difficulty placing a value on your
business.
The solution
At BMO Bank of Montreal ®, we are
committed to helping Canadian
businesses develop and succeed.
The purpose of this Business Coach
is to help you recognize when you are
succeeding… and when you are not.

There are many ways to measure success; for
instance, if you enjoy doing what you do, then
you have achieved some personal success.
However, from a financial viewpoint success is
measured with raw numbers, comparisons to
standards and yardsticks. We see businesses in
all shapes and sizes; in all states of profitability.
Based on our in-depth knowledge and expertise,
we have designed this booklet to help you
manage for profit by measuring your results.
Timely measurement can help you:•identifyproblemareasbeforethey’reoutofcontrol
•separatetheprofitablefromnon-profitable
products/services
•isolateareasforcostcutting
•evaluatenewideas
•seeyourcompanyasoutsiderswillseeit
Guidelines•Measurebycomparison.Measurementsdon’t
stand alone; a result is:
– better or worse than last year
– over or under budget
– above or below the industry average, etc.
•Compare“applestoapples.” For instance,
compare pre-tax (usually safer than after-tax)
profits to pre-tax profits. Remember:
–don’tmixinventoryturnusing“costofgoods”
withinventoryturnusing“totalsales”
–“returnonassets”isnotthesameas“return
onequity”(seethecompanionBusiness
Coach booklet Making Sense of Financial
Terms and Jargon on this topic)
– be careful to use a consistent year-end
•Focusonnumbersforprecision. Words can be
too vague.
– Three times turn of inventory is better than
two and a half turns.
– 42 days receivables is an improvement
on 60 days.
– Working capital of $60,000 is better
than $40,000.
•Useratiosandpercentages.By reducing
everything to a common base — 1 or 100 —
they make results easy to compare. Based on
the numbers above:
– the three times turn is a 20% improvement
over two and a half
– 42 days is a 30% improvement over 60, and
Use the following Guidelines to
ensure the measurements you rely on
are valid and relevant.
conseils
!
conseils
!
conseils
!
Tips!
Tips!
Tips!
– if the $60,000 were made up of $100,000
current assets and $40,000 current liabilities,
the working capital ratio would be 2.5:1
•Findinternal comparisons— measurements
within your company.
For instance:
– this year vs. last
– last month vs. a year ago last month
– store A vs. store B
– performance vs. budget
•Makeexternalcomparisons by obtaining
industry standards and ratios from:
– trade association statistics
– Dun and Bradstreet, particularly the annual
statistical review
– trade papers, magazines and websites
– Statistics Canada, which often has more data
than it publishes
– annual reports of public companies in your
industry
– bank managers, accountants
•Bewareofthe“cover-up.”Don’tdependon
averages or composite figures. Look behind
the numbers. For example:
– a low inventory turn will conceal some
fast-moving items among the slow
– 45 days average receivables probably
will hide some 120-day payers among
the fast payers
•Adjustforreality.You may have to make
adjustments to ensure a fair comparison, a
true measurement. Among the more common
adjustments necessary:
–Salary. If you draw a low salary, your pre-tax
profit should be adjusted downwards by the
difference you would have to pay an outside
manager for the same job. For example,
if normal salary is $40,000 and you drew
$20,000, then pre-tax profit of, say, $40,000 is
realistically only $20,000. This adjustment
isimportantwhenevaluatingacompany’s
earnings.
–Marketvalue. If the market value of your
assets is a lot more than shown on your books
after depreciation, you are overstating your
return on investment. If someone else were
to buy your company, you should expect the
buyer to pay at least the market value for
the assets. To see your real return, add the
difference between market and depreciated
value to the net worth.
–Inflation. If your sales have grown steadily
every year for, say, five years, use the cost-of-
living index to adjust the sales by the amount
of inflation. You may be surprised at the
amount of real growth.
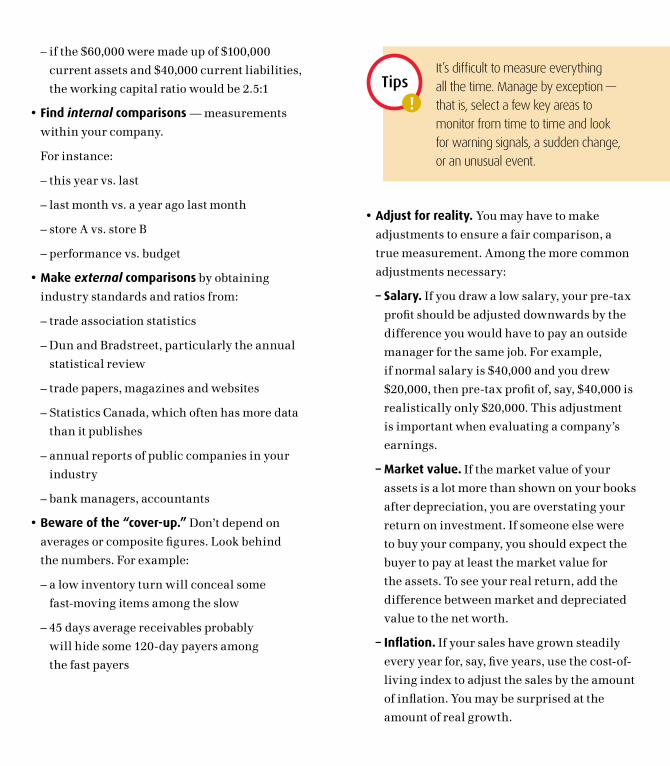
It’s difficult to measure everything
all the time. Manage by exception —
that is, select a few key areas to
monitor from time to time and look
for warning signals, a sudden change,
or an unusual event.
conseils
!
conseils
!
conseils
!
Tips!
Tips!
Tips!

Internal yardsticks
NOTE
The figures used for demonstrating each
measurement are taken from the sample financial
statements, “Profit and Loss” and “Balance Sheet,”
at the back of this Business Coach. Each capital letter
and small letter in equations refers to a specific line
in the financial statements, making it easy for you to
do similar calculations for your own company.
The following are some key yardsticks, each
with an explanation of how to use it, what it can
mean and how to look for negative causes behind
the figures. Once the cause is apparent, you can
begin to make the necessary changes.
Receivables
Receivables are your most important current
assets.Iftheyare“good,”(say,lessthan90days)
you can usually borrow up to 75% of their value
fromthebank.Iftheyare“old,”or“long,”they’re
likely to turn into bad debts — and you cannot
borrow against them.
Determine average age of receivables:
sTeP 1last year b
= $ 57,000 x 365 = 38.5 days
A $ 540,000
previous year $ 51,000 x 365 = 40.5 days $ 460,000
sTeP 2 Breakreceivablesinto30,60,90days,andmore
than90days.Monitortheover-90-daysbyday;
the balance by week.
•Lookfortelltalesigns:
– weak credit judgment
– poor collection procedures
– not enforcing terms
– slow issue of statements
– customer dissatisfaction
Payables
Usingotherpeople’smoney—inthiscaseyour
suppliers’—canbeappropriatewithinreason.
Justdon’tletitgetoutofhand.
sTeP 1 Determine average age of payables. As with
receivables, break into groups of 30, 60 days, and
so on to monitor. Also focus on those offering
discountstodecidewhetherit’sworthwhileto
pay quickly. It may not be.
last year I =
$ 52,000 x 365 = 50.2 days H $ 378,000
previous year $ 46,000 x 365 = 50.7 days $ 331,000

sTeP 2 Ask yourself:
•Whodemandsinterest?
•Whothreatenstocutyouoff?
•Canextendedtermsbenegotiated?
•Isfactory/warehouseturnaroundtimetoolong?
•Aretherealternativesources?
•Arestaggeredshipmentsandpayments
possible?
Inventory
It’sestimatedthat,tocarryinventory,itcoststwo-
and-a-half to three times the prevailing bank rate.
For example, if the interest rate is 6%, inventory
will cost you more than 15% per annum. This
includes heat, light, power, labor, insurance, and
so on. Therefore, moving inventory is critical.
last year H =
$ 378,000 = 2.36 turns C $ 160,000
previous year $ 331,000 =1.97turns $ 168,000
Expressed in days inventory on hand:
last year C =
$ 160,000 x 365 = 154 days H $ 378,000
previous year $ 168,000 x 365 = 185 days $ 331,000
Look for:
•Excessiveinventoryorpoormix—areyou
takingtoomanyquantitydiscounts?
•Slowmovers—howcanyoucleanthemout?
•Suppliersthatcandeliveronshortnotice.
Currentfinancialstability
An important reading of your financial health
can be found in the current ratio — the balance
betweenyourcurrentassets(what’sowedtoyou)
andyourcurrentliabilities(what’sowedbyyou).
last year d =
$ 224,000 = 3.3 : 1 p $ 68,000
previous year $ 226,000 =3.9:1 $ 58,000
Anything more than 1:1 is healthy. This
company has plenty of room for more borrowing.
Thenthere’stheacidtest(quickratio)thatbanks
like to look at: current assets that can be quickly
turned into cash, versus current liabilities.
a + b
p
last year $ 7,000 + $ 57,000=.94:1 $ 68,000
previous year $ 7,000 + $ 51,000 = 1 : 1 $ 58,000
1 : 1 is considered healthy.

Long-termfinancialstability
Here are three key readings on the long-term
viability of your company — especially as seen
through the eyes of bankers and other lenders.
•Debt to equity (also known as leverage).
p + q
v
last year $68,000+$39,000 = .53 : 1 $ 202,000
previous year $ 58,000 + $ 43,000=.59:1 $ 172,000
The leverage has gone down slightly, so this
company could borrow substantially more.
However, beware of fluctuating interest rates.
Rising rates can reduce the leverage available
because of lack of coverage (see below). Leverage
varies from industry to industry, but about 3:1 or
2:1 debt to equity is acceptable in many.
•Coverage.There are two forms of coverage:
asset and earnings (ability to service the debt)
Asset i =
$ 85,000 = 2.2 : 1 Asset
q $39,000 coverage
This means $2.2 of assets covers $1 of long-term
debt.
Earnings Q =$39,000
= 3.5 : 1 Earnings O $ 11,000 coverage
Anything more than 2:1 is generally considered
healthy.
•Retainedearnings.It’simportanttorealizethat
what you leave in the company influences the
confidence of outsiders, particularly bankers.
In this case, retained earnings have gone from
$97,000to$127,000becausetheownerdidn’t
take earnings out in dividends.
Measurement does not reveal why
something happened; it can alert you to
look for causes and probe for reasons.
conseils
!
conseils
!
conseils
!
Tips!
Tips!
Tips!

KeyPandLfactors
Compare each of the following to last year and to
budget — preferably by quarter. This can also be
done by product versus product.
Breakeven
This is the point at which sales less cost of goods
(that is, gross profit) equals overhead. Once sales
exceed the breakeven point, you begin to make a
profit. On sales up to the breakeven point, you will
incur losses. The lower you keep your breakeven,
the less vulnerable you are. The more costs you
can make variable (that is, incurred only if sales
are made), the less vulnerable you are.
Using“lastyear’s”figuresandassumingthatall
selling and administrative expenses were fixed
overhead, the breakeven point would be:
Fixed overhead = Breakeven level of sales Gross profit margin
(L ) $ 48,000 + (P) $ 75,000 = $ 410,000 0. 30 (I) A
If, on the other hand, selling expenses all
became variable — perhaps commissions —
then the breakeven point would fall.
$75,000 = $250,000 0.30
Keeping your breakeven point low and your gross
margin high is a sound goal even in good times.
last year previous year
% Gross Profit
$ 129,000 = 28.0%
$ 460,000 (improved)
% Selling Expense
$ 36,000 = 7.8%
$ 460,000 (worse)
% Administrative Expense
$ 69,000 = 15.0%
$ 460,000 (improved)
% Pre-tax Profit
$ 24,000 = 5.2%
$ 460,000 (improved)
% Direct Labour to Cost of Goods Sold
$ 88,000 = 26.6%
$ 331,000 (higher)
% Sales Increase/Decrease
Q =
$ 39,000 = 7.2%
A $ 540,000
D =
$ 112,000 = 29.6%
H $ 378,000
P =
$ 75,000 = 13.8%
A $ 540,000
L =
$ 48,000 = 8.9%
A $ 540,000
I =
$ 162,000 = 30.0%
A $ 540,000
$ 540,000 – $ 460,000 = 17.4%
$ 460,000 (up)
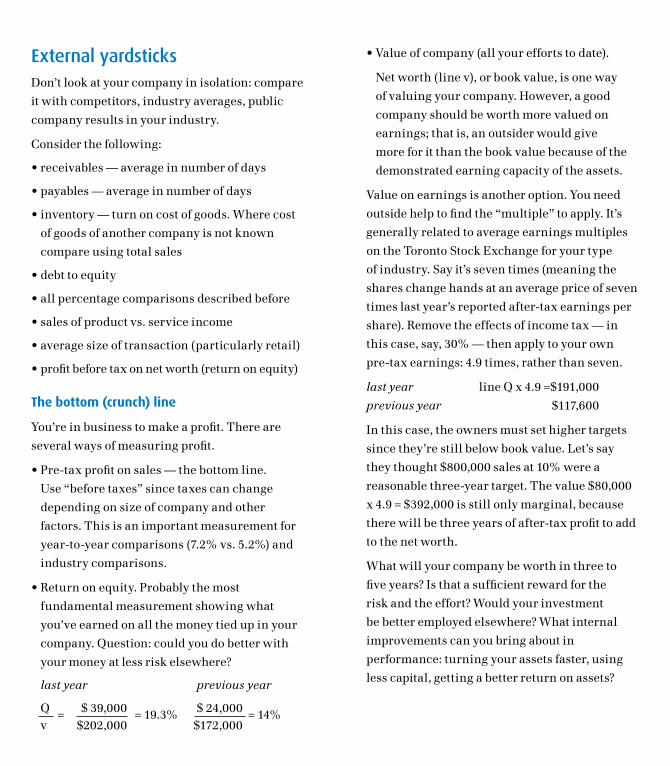
external yardsticksDon’tlookatyourcompanyinisolation:compare
it with competitors, industry averages, public
company results in your industry.
Consider the following:
•receivables—averageinnumberofdays
•payables—averageinnumberofdays
•inventory—turnoncostofgoods.Wherecost
of goods of another company is not known
compare using total sales
•debttoequity
•allpercentagecomparisonsdescribedbefore
•salesofproductvs.serviceincome
•averagesizeoftransaction(particularlyretail)
•profitbeforetaxonnetworth(returnonequity)
Thebottom(crunch)line
You’reinbusinesstomakeaprofit.Thereare
several ways of measuring profit.
•Pre-taxprofitonsales—thebottomline.
Use“beforetaxes”sincetaxescanchange
depending on size of company and other
factors. This is an important measurement for
year-to-year comparisons (7.2% vs. 5.2%) and
industry comparisons.
•Returnonequity.Probablythemost
fundamental measurement showing what
you’veearnedonallthemoneytiedupinyour
company. Question: could you do better with
yourmoneyatlessriskelsewhere?
last year previous year
Q = $39,000 =19.3% $ 24,000 = 14% v $202,000 $172,000
•Valueofcompany(allyoureffortstodate).
Net worth (line v), or book value, is one way
of valuing your company. However, a good
company should be worth more valued on
earnings; that is, an outsider would give
more for it than the book value because of the
demonstrated earning capacity of the assets.
Valueonearningsisanotheroption.Youneed
outsidehelptofindthe“multiple”toapply.It’s
generally related to average earnings multiples
on the Toronto Stock Exchange for your type
ofindustry.Sayit’sseventimes(meaningthe
shares change hands at an average price of seven
timeslastyear’sreportedafter-taxearningsper
share). Remove the effects of income tax — in
this case, say, 30% — then apply to your own
pre-taxearnings:4.9times,ratherthanseven.
last year lineQx4.9=$191,000
previous year $117,600
In this case, the owners must set higher targets
sincethey’restillbelowbookvalue.Let’ssay
they thought $800,000 sales at 10% were a
reasonable three-year target. The value $80,000
x4.9=$392,000isstillonlymarginal,because
there will be three years of after-tax profit to add
to the net worth.
What will your company be worth in three to
fiveyears?Isthatasufficientrewardforthe
riskandtheeffort?Wouldyourinvestment
bebetteremployedelsewhere?Whatinternal
improvements can you bring about in
performance: turning your assets faster, using
lesscapital,gettingabetterreturnonassets?

hot buttonsSince you cannot measure everything all the
time,usethe“HotButtons”thatfollowasyour
early warning system. Select those that are
relevant and, when they sound an alarm, look for
thecauseandtakecorrectiveactionbeforeit’s
too late.
Applicabletomostbusinesses
•pre-taxprofitonsales
•grossprofit/margin
•breakevensaleslevel
•inventoryturnover
•ageofreceivables
•baddebts
•ageofpayables
•customercomplaints
•returnedgoods
•staffturnover
•absenteeism
Industry-specific
In addition to the above:
•manufacturing
– gross profit/margin per item
– order backlog
– percent labor costs
– downtime
– accidents
– product complaints/rejects
– service/warranty costs
•service
– volume per employee
– gross profit per sale/per customer
– rent as a percent of volume
– average sales per invoice
– lost business
– repeat business/referrals
– overhead to sales
•retail
– average mark-up (also per item)
–stock“outs”
– delivery/service per $ sales
–percent“onsale”vs.regularprices
– sales per customer
– average sales per invoice
– rent as percentage volume
•contracting
– average gross profit per completed job
– tenders vs. successful bids
– dollar value of hold-backs
– value of work-in progress to total volume
– cost overruns
– problems with bid bonds
– overhead to sales

ABC LTD. Statement of Profit and Loss for year ended December 31, 20__
P R E V I O U S Y EA R Amount % of sales
A) Net sales $ 460,000 100.0%
Less Cost of Goods Sold B) Beginning inventory $ 150,000C) Purchases $ 219,000
Production Expenses: D) Direct labor $ 88,000E) Direct overhead $ 42,000 ––––––––––––F) Cost of goods on hand $ 499,000G) Less: ending inventory $ 168,000 ––––––––––––H) Cost of goods sold $ 331,000 72.0%I) Gross profit (A minus H) $ 129,000 28.0%
Less Expenses Selling Expenses: J) Salaries and commissions $ 31,000 6.7%K) Advertising and other expenses $ 5,000 1.1% –––––––––––– –––––––L) Total selling expenses $ 36,000 7.8%
Administrative Expenses: M) Salaries and wages $ 46,000 10.0%N) Rent and utilities $ 13,000 2.8%O) Interest and other expenses $ 10,000 2.2% –––––––––––– –––––––P) Total administrative expenses $ 69,000 15.0%Q) Net profit before taxes $ 24,000 5.2%R) Less: income taxes $ 6,000 1.3% –––––––––––– –––––––S) Net income after taxes $ 18,000 3.9%
ABC LTD. Statement of Profit and Loss for year ended December 31, 20__
L A ST Y EA R Amount % of sales
A) Net sales $ 540,000 100.0%
Less Cost of Goods Sold B) Beginning inventory $ 168,000C) Purchases $ 210,000
Production Expenses: D) Direct labor $ 112,000E) Direct overhead $ 48,000 ––––––––––––F) Cost of goods on hand $ 538,000G) Less: ending inventory $ 160,000 –––––––––––– –––––––H) Cost of goods sold $ 378,000 70.0%I) Gross profit (A minus H) $ 162,000 30.0%
Less Expenses Selling Expenses: J) Salaries and commissions $ 38,000 7.0%K) Advertising and other expenses $ 10,000 1.9% –––––––––––– –––––––L) Total selling expenses $ 48,000 8.9%
Administrative Expenses: M) Salaries and wages $ 51,000 9.4%N) Rent and utilities $ 13,000 2.4%O) Interest and other expenses $ 11,000 2.0% –––––––––––– –––––––P) Total administrative expenses $ 75,000 13.8%Q) Net profit before taxes $ 39,000 7.2%R) Less: income taxes $ 9,000 1.6% –––––––––––– –––––––S) Net income after taxes $ 30,000 5.6%
ABC LTD. Statement of Profit and Loss for year ended December 31, 20__
P R E V I O U S Y EA R Amount % of sales
A) Net sales $ 460,000 100.0%
Less Cost of Goods Sold B) Beginning inventory $ 150,000C) Purchases $ 219,000
Production Expenses: D) Direct labor $ 88,000E) Direct overhead $ 42,000 ––––––––––––F) Cost of goods on hand $ 499,000G) Less: ending inventory $ 168,000 ––––––––––––H) Cost of goods sold $ 331,000 72.0%I) Gross profit (A minus H) $ 129,000 28.0%
Less Expenses Selling Expenses: J) Salaries and commissions $ 31,000 6.7%K) Advertising and other expenses $ 5,000 1.1% –––––––––––– –––––––L) Total selling expenses $ 36,000 7.8%
Administrative Expenses: M) Salaries and wages $ 46,000 10.0%N) Rent and utilities $ 13,000 2.8%O) Interest and other expenses $ 10,000 2.2% –––––––––––– –––––––P) Total administrative expenses $ 69,000 15.0%Q) Net profit before taxes $ 24,000 5.2%R) Less: income taxes $ 6,000 1.3% –––––––––––– –––––––S) Net income after taxes $ 18,000 3.9%
ABC LTD. Statement of Profit and Loss for year ended December 31, 20__
L A ST Y EA R Amount % of sales
A) Net sales $ 540,000 100.0%
Less Cost of Goods Sold B) Beginning inventory $ 168,000C) Purchases $ 210,000
Production Expenses: D) Direct labor $ 112,000E) Direct overhead $ 48,000 ––––––––––––F) Cost of goods on hand $ 538,000G) Less: ending inventory $ 160,000 –––––––––––– –––––––H) Cost of goods sold $ 378,000 70.0%I) Gross profit (A minus H) $ 162,000 30.0%
Less Expenses Selling Expenses: J) Salaries and commissions $ 38,000 7.0%K) Advertising and other expenses $ 10,000 1.9% –––––––––––– –––––––L) Total selling expenses $ 48,000 8.9%
Administrative Expenses: M) Salaries and wages $ 51,000 9.4%N) Rent and utilities $ 13,000 2.4%O) Interest and other expenses $ 11,000 2.0% –––––––––––– –––––––P) Total administrative expenses $ 75,000 13.8%Q) Net profit before taxes $ 39,000 7.2%R) Less: income taxes $ 9,000 1.6% –––––––––––– –––––––S) Net income after taxes $ 30,000 5.6%
aBC LTD. statement of Profit and Loss for year ended December 31, 20__
aBC LTD. statement of Profit and Loss for year ended December 31, 20__

ABC LTD. Balance Sheet at December 31, 20__
P R E V I O U S Y EA R
Assets Current assets a) Cash in bank and petty cash $ 7,000 Accounts receivable $ 53,000 Less allowance for doubtful accounts $ 2,000 ––––––––––b) Net accounts receivable $ 51,000c) Inventory $ 168,000 –––––––––––d) Total current assets $226,000
Fixed Assetse) Land and building $ 41,000f) Machinery and equipment $ 57,000g) Furniture and fixtures $ 14,000 –––––––––– $112,000h) Less accumulated depreciation $ 65,000 –––––––––––i) Total fixed assets $ 47,000 –––––––––––j) Total assets $273,000
Liabilities and Shareholders’ Capital Current liabilities k) Bank loan $ 4,000l) Accounts payable $ 46,000m) Accrued expenses & commissions $ 2,000n) Taxes payable $ 2,000o) Current portion of bank term loan $ 4,000 –––––––––––p) Total current liabilities $ 58,000
Long-term liabilities q) Long-term debt due after one year $ 43,000
Shareholders’ (capital) equity r) Common stock (1,000 shares) $ 15,000 s) Preferred shares ($10 par value)$ 60,000 ––––––––––t) $ 75,000 u) Retained earnings $ 97,000 –––––––––––v) Total shareholders’ (capital) equity $172,000 –––––––––––w) Total liabilities and shareholders’ (capital) equity $273,000
ABC LTD. Balance Sheet at December 31, 20__
L A ST Y EA R
Assets Current assets
a) Cash in bank and petty cash $ 7,000 Accounts receivable $ 59,000 Less allowance for doubtful Accounts $ 2,000 ––––––––––b) Net accounts receivable $ 57,000c) Inventory $ 160,000 –––––––––––d) Total current assets $224,000
Fixed assets e) Land and building $ 41,000f) Machinery and equipment $ 83,000g) Furniture and fixtures $ 28,000 –––––––––– $ 152,000h) Less accumulated depreciation $ 67,000 ––––––––––i) Total fixed assets $ 85,000 –––––––––––j) Total assets $309,000
Liabilities and Shareholders’ Capital Current liabilities k) Bank loan $ 8,000l) Accounts payable $ 52,000m) Accrued expenses & commissions $ 2,000n) Taxes payable $ 2,000o) Current portion of bank term loan $ 4,000 –––––––––––p) Total current liabilities $ 68,000
Long-term liabilities q) Long-term debt due after one year $ 39,000
Shareholders’ (capital) equityr) Common stock (1,000 shares) $ 15,000s) Preferred shares ($10 par value) $ 60,000 ––––––––––t) $ 75,000u) Retained earnings $ 127,000 ––––––––––v) Total shareholders’ (capital) equity $202,000 –––––––––––w) Total liabilities and shareholders’ (capital) equity $309,000
ABC LTD. Balance Sheet at December 31, 20__
P R E V I O U S Y EA R
Assets Current assets a) Cash in bank and petty cash $ 7,000 Accounts receivable $ 53,000 Less allowance for doubtful accounts $ 2,000 ––––––––––b) Net accounts receivable $ 51,000c) Inventory $ 168,000 –––––––––––d) Total current assets $226,000
Fixed Assetse) Land and building $ 41,000f) Machinery and equipment $ 57,000g) Furniture and fixtures $ 14,000 –––––––––– $112,000h) Less accumulated depreciation $ 65,000 –––––––––––i) Total fixed assets $ 47,000 –––––––––––j) Total assets $273,000
Liabilities and Shareholders’ Capital Current liabilities k) Bank loan $ 4,000l) Accounts payable $ 46,000m) Accrued expenses & commissions $ 2,000n) Taxes payable $ 2,000o) Current portion of bank term loan $ 4,000 –––––––––––p) Total current liabilities $ 58,000
Long-term liabilities q) Long-term debt due after one year $ 43,000
Shareholders’ (capital) equity r) Common stock (1,000 shares) $ 15,000 s) Preferred shares ($10 par value)$ 60,000 ––––––––––t) $ 75,000 u) Retained earnings $ 97,000 –––––––––––v) Total shareholders’ (capital) equity $172,000 –––––––––––w) Total liabilities and shareholders’ (capital) equity $273,000
ABC LTD. Balance Sheet at December 31, 20__
L A ST Y EA R
Assets Current assets
a) Cash in bank and petty cash $ 7,000 Accounts receivable $ 59,000 Less allowance for doubtful Accounts $ 2,000 ––––––––––b) Net accounts receivable $ 57,000c) Inventory $ 160,000 –––––––––––d) Total current assets $224,000
Fixed assets e) Land and building $ 41,000f) Machinery and equipment $ 83,000g) Furniture and fixtures $ 28,000 –––––––––– $ 152,000h) Less accumulated depreciation $ 67,000 ––––––––––i) Total fixed assets $ 85,000 –––––––––––j) Total assets $309,000
Liabilities and Shareholders’ Capital Current liabilities k) Bank loan $ 8,000l) Accounts payable $ 52,000m) Accrued expenses & commissions $ 2,000n) Taxes payable $ 2,000o) Current portion of bank term loan $ 4,000 –––––––––––p) Total current liabilities $ 68,000
Long-term liabilities q) Long-term debt due after one year $ 39,000
Shareholders’ (capital) equityr) Common stock (1,000 shares) $ 15,000s) Preferred shares ($10 par value) $ 60,000 ––––––––––t) $ 75,000u) Retained earnings $ 127,000 ––––––––––v) Total shareholders’ (capital) equity $202,000 –––––––––––w) Total liabilities and shareholders’ (capital) equity $309,000
aBC LTD. Balance sheet at December 31, 20__
aBC LTD. Balance sheet at December 31, 20__

This document is designed for information purposes and should not be considered advice. For specific information on your business needs please consult with the appropriate business professional.
® Registered trade-marks of Bank of Montreal. 5033020 (10/11)
10/11-962
At BMO Bank of Montreal, we are committed to
helping Canadian businesses develop and succeed.
To this end, we’ve created a Business Coach Series that
provides information and knowledge that can optimize
the value of your company’s financial resources. The
booklets that make up the Series focus on essential
areas of financial management allowing you to focus
on operating your business more effectively.
For more information on how BMO Bank of Montreal can help your business:• talk to your Commercial Account Manager
• call us directly at 1-877-262-5907 or
• log on to bmo.com/business-resources
Standard Mixed Sources Labels
Minimum Size
.669”
.472”
Mini Labels
Standard Mini
.433”
.315”
XXXXXXX
XXXXXXX XXXXXXX XXXXXXX XXXXXXX
XXXXXXXXXXXXXXXXXXXXXXXXXXXX
XXXXXXX
XXXXXXX
XXXXXXX
XXXXXXX XXXXXXX
XXXXXXX
XXXXXXX
XXXXXXX
XXXXXXX
XXXXXXX