measuring optical temperature coefficients of intralipid®
TRANSCRIPT

This content has been downloaded from IOPscience. Please scroll down to see the full text.
Download details:
IP Address: 92.227.68.157
This content was downloaded on 27/04/2014 at 06:44
Please note that terms and conditions apply.
Measuring optical temperature coefficients of Intralipid®
View the table of contents for this issue, or go to the journal homepage for more
2007 Phys. Med. Biol. 52 2367
(http://iopscience.iop.org/0031-9155/52/9/003)
Home Search Collections Journals About Contact us My IOPscience
IOP PUBLISHING PHYSICS IN MEDICINE AND BIOLOGY
Phys. Med. Biol. 52 (2007) 2367–2378 doi:10.1088/0031-9155/52/9/003
Measuring optical temperature coefficients ofIntralipid R©
V Andrew McGlone1, Paul Martinsen1, Rainer Kunnemeyer2,Bob Jordan1 and Biju Cletus2
1 The Food and Horticulture Research Institute of New Zealand, Hamilton, New Zealand2 The University of Waikato, Hamilton, New Zealand
E-mail: [email protected]
Received 23 November 2006, in final form 13 February 2007Published 10 April 2007Online at stacks.iop.org/PMB/52/2367
AbstractThe temperature sensitivities of absorption and reduced scattering coefficientsin the range 700–1000 nm are determined for the liquid phantom Intralipid R©
using spatially resolved continuous wave measurements. The measurementswere conducted on a 10 L heated volume of 1% Intralipid R© subjected to a40–30 ◦C cooling regime. The temperature sensitivities of the absorbancecoefficients are similar to that expected for pure water. However, the reducedscattering coefficients are more sensitive than can be explained by temperaturerelated density changes, and show an unexpected relationship with wavelength.We have also found that temperature perturbations provide a useful means toevaluate instrument model performance.
(Some figures in this article are in colour only in the electronic version)
Introduction
Many authors have looked at characterizing diffusing media, such as Intralipid R©, by threeoptical transport coefficients: the absorption coefficient, µa (cm−1); the scattering coefficient,µs (cm−1); and the dimensionless scattering anisotropy factor g (van Staveren et al 1991,Flock et al 1992, Nichols et al 1997, Chance et al 1998, Bevilacqua et al 2000, Chen et al2006, for example). The coefficients are typically determined by modelling the propagation oflight in the solution, using an approximation of the Boltzmann transport equation, and fittingthis model to experimental measurements. Two experimental schemes are well establishedfor making these measurements: modulated wave (Chance et al 1998) and continuous wave(Nichols et al 1997).
The modulated wave approach applies pulsed or modulated sources (typically lasers)and has been the dominant scheme for biomedical applications. This approach offersrelatively simple measurement geometries and takes advantage of well-established radar and
0031-9155/07/092367+12$30.00 © 2007 IOP Publishing Ltd Printed in the UK 2367

2368 V A McGlone et al
telecommunications technologies. It is typically constrained to a small number of wavelengths,using one source for each.
The continuous wave approach typically uses broadband light sources and conventionalspectrometers. The experimental geometry is usually more complex as this method requiresseveral measurements from multiple, or moveable, sensors to separate the optical coefficients.This also restricts the technique to homogenous samples. Its main advantage is in the relativesimplicity of the apparatus and the possibility of measurements over wide spectral bands. Thiscan be beneficial for samples containing several chromophores or interesting absorption bandsand for selecting appropriate wavelengths for the modulated wave approach. Not surprisingly,combinations of the two approaches have been reported (Bevilacqua et al 2000).
A problem faced with either scheme is the lack of a primary standard method to validateresults (Chen et al 2006). Simple phantoms, such as Intralipid R©, that mimic the opticalproperties of real-world samples are widely used for method and instrument development.However, batch-to-batch variations leave these unsuitable as reference samples with significantdisparity in the published results for the optical transport coefficients (Delfino et al 1999).
In this work, we have investigated the correspondence between Intralipid R© and water bothin the transport coefficients and in their temperature dependence. The common assumptionfor Intralipid R©, over the biologically important ‘diagnostic’ window (700–1000 nm), is anabsorption coefficient entirely due to water, with scatter determined by the density andsize distribution of micelles (Nakai et al 1997, Jacques 1998). As well as validating thecompositional assumptions made about Intralipid R©, we believe temperature offers a usefultool to test instruments and models. It can be readily and accurately measured, and may offera way to introduce temporary perturbations to a sample. This offers a simple approach tocollecting non-sequential replicates to explore performance, for example, that a permanentchange (such as dilution) does not.
Theory
Menon et al (2005) recently reported an improved diffusion model to study light transportin turbid media that accounts for a directional light source. They do this by separating thephoton radiance, at each point in space, into two directional half-spheres defined relative to theprimary source direction. They find that the photon fluence (in photons m−3) for a collimatedsource at a polar angle of ϑ at some radial distance r in front of the source is given by
F(r) =[
1
D+ 3 cos ϑ
(k +
1
r
)− 3
µ
(k2 sin2 ϑ − (3 cos2 ϑ − 1)
(k
r+
1
r2
))]G(r). (1)
Here µT is the sum of the absorption and scattering coefficients and G(r) is the basicsolution (Green’s function) for the steady-state diffusion equation:
G(r) = exp(−kr)/4πr, (2)
and k = õa/D. The diffusion constant D is
D = 1
3(µa + µ′s)
. (3)
Here, µa is the absorption coefficient and µ′s is the reduced scattering coefficient equal to
µs(1 − g).For an axial point detector, which subtends a vanishingly small angle ϑ , we find that
equation (1) reduces to
F(r) =[
1
D+ 3
(k +
1
r
)+ 18D
1 − g
r
(k +
1
r
)]G(r). (4)

Measuring optical temperature coefficients of Intralipid R© 2369
lamp powersupply
digital exposurecontroller
! !
fixedsourcefibre
detectorfibre
spectrometer
referencephotodiode
light source
plastic coversealed to rim
heating, magneticstirrer
temperaturesensor
translation stage
Y-splitter
Figure 1. The absorption and reduced scattering coefficients were measured for 1% Intralipid R©in a 10 L stainless steel pot. A laboratory light source (left), with intensity feedback control,illuminated the sample via an optical fibre. The diffusely transmitted light was measured, via asecond fibre, by a temperature stabilized Zeiss spectrometer (right).
For an optical fibre detector, the detection locus is approximately one reduced scatteringdistance from the tip of the fibre reducing the radial distance between the source and detector.Thus equation (4) becomes
F(r) =[
1
D+
(3 + 18D
1 − g
r − 1/µ′s
) (k +
1
r − 1/µ′s
)]G(r − 1/µ′
s). (5)
This equation will be used to model our experimental data to determine the opticaltransport coefficients.
Method
The experimental setup is illustrated in figure 1. Our method is based on measuring near-infrared spectra, diffusely transmitted through Intralipid R© at temperatures between 30 and40 ◦C, at a range of source–detector separations.
Continuous wave near-infrared spectra were measured with a Zeiss mms-1 near-infraredspectrometer (Carl Zeiss, Jena, Germany). The spectrometer measures light intensity between300 and 1100 nm using a 256-element photodiode array. It has a nominal bandwidth of 10 nm,uses a 15-bit analogue-to-digital converter (ADC) and has a combined readout and electronicnoise floor of 1.5 bits and a full well depth of 108 electrons. At 800 nm, the quantum efficiencyis approximately 50%, so each ADC count corresponds to 6000 photons. The spectrometerand associated electronics were contained in a custom designed housing that maintained theinstrument at 16 ◦C.
A 50 W halogen lamp provided illumination for the measurement. The lamp was mountedin an Oriel lamp housing (66884, Newport, USA) and light coupled into the optical fibre usinga fibre bundle focusing assembly (77799, Newport, USA). The lamp was powered by an
2370 V A McGlone et al
Oriel radiometric power supply (69931, Newport, USA). A Spectra-Physics digital exposurecontrol (68950, Newport, USA) was used to stabilize the light output from the lamp. One armof a Y-fibre splitter delivered light from the lamp to the digital exposure control monitoringdetector. The other arm of the Y-fibre splitter provided illumination for the experiment. A400 µm fibre was used in each arm of the Y-splitter (Thorlabs, USA). Direct measurementsof the lamp, through a neutral density filter, indicated a drift in the lamp intensity of less than0.5% over 12 h. Most of this drift was during the first 2 h; in the remaining 10 h, the lampdrift was less than 0.2%. This is important because lamp spectra were not measured duringthe experiment so it was crucial that the light delivered by the lamp be constant.
A 1% solution of Intralipid R© was made from 1 L of 10% stock Intralipid R© solution(Pharmco, New Zealand) and 9 L of deionized water in a 10 L stainless steel pot purchasedfrom a local home-ware store. With an internal diameter of 26 cm and depth of 21 cm,the pot was chosen so that the intensity of light travelling from the centre of the pot tothe closest boundary and back to the centre would be reduced below the noise floor of ourspectrometer.
A 400 µm fibre with a numerical aperture of 0.45 (in air) delivered light to the solutionfrom the light source. An identical fibre collected light for measurement by the spectrometer.Before entering the solution, the optical fibres were threaded through stainless steel tubes(external diameter 6 mm), which included a 90◦ bend (bend radius 50 mm), and were cappedwith an acetyl ferrule. The stainless steel tubes were suspended from a gantry and set so thatthe fibre tips were facing each other and nearly touching in the middle of the stainless steelpot. The source fibre was mounted on a fixed portion of the gantry; the detector fibre wasmounted on a moving carriage. In this way the distance between the source and detector fibretips could be controlled, by a computer, to a precision of better than 10 µm, from nearly 0 mmto more than 60 mm.
The stainless steel pot was kept on a magnetic stirrer (RET basic, IKA, Germany) withintegrated heating capability. The magnetic stirrer ensured that the solution was mixed well.The heater was turned on and off by a computer program to raise the temperature of thesolution to 40 ◦C. A temperature sensor (LM35, National Semiconductor, USA) monitoredthe solution temperature to a precision better than 0.1 ◦C. While validating the system wechecked that the Intralipid R© temperature was uniform over the central bulk of the pot.
A loose plastic cover with elastic around the circumference covered the stainless steelpot. The cover was carefully sealed around holes cut for the optical fibres and temperaturesensor using sticky tape. A 16 mm PVC hose was split longitudinally and clipped aroundthe circumference to seal the stainless steel pot. The airtight seal reduces water loss from thesolution through evaporation. With these measures, the mass lost from an uncovered stainlesssteel pot was reduced from 21 g h−1 to less than 0.04 g h−1 from a carefully sealed stainlesssteel pot. Minimizing evaporation is important because loss of water will increase the scatterconcentration, altering the optical properties of the solution. Loss of water also decreasesthe water concentration, though we calculate this effect to be negligible in our experimentalconfiguration.
After the lamp warmed up for 2 h, data were collected in four cycles providing replicatemeasurements. At the start of each cycle, the heater/stirrer warmed the Intralipid R© to 40 ◦C(about 30 min). The heater was turned off and the solution cooled slowly (losing heat to theenvironment) to 30 ◦C (about 10 h), at which point the cycle was repeated. During cooling,spectra were continually collected for a sequence of 54 distances between the source anddetector fibres spanning 1 to 54 mm. Below 20 mm, the steps were 0.5 mm apart; from 20to 44 mm, 1 mm apart; beyond 44 mm, 2 mm apart. Each separation sequence took less than10 min. Over this time, the Intralipid R© temperature decreased by less than 0.1 ◦C.

Measuring optical temperature coefficients of Intralipid R© 2371
400 500 600 700 800 900 1000 110010-1
100
101
102
103
104
105
106
107
50
20
15
10
2
Inte
nsity
[AD
C/s
]
Wavelength [nm]
5
Figure 2. Selected spectra collected over one replicate temperature cycle. Curves are labelledwith the distance (in millimetres) between the source and detector fibres. Water absorption bands(750 nm, 840 nm and 970 nm) become apparent as the path length increases.
The signal intensity drops by about four orders of magnitude as the source–detectorseparation is increased from 1 to 54 mm. To compensate, the integration time (the durationlight is collected by the detector) was increased from 3 ms to 6.5 s (the maximum) at about20 mm. The integration time was selected automatically, so that the peak signal was 28 000counts (85% of maximum) for each distance before the first heating cycle.
The entire measurement process was completed automatically. LabView (NationalInstruments, USA) programs controlled the translation stage and heated stirrer. Matlab (TheMathWorks, USA) coordinated data collection communicating with the LabView programsand spectrometer interface via ActiveX (Microsoft Corporation, USA).
Results and discussion
The spectra collected are plotted in figure 2. The intensity has been scaled to analogue-to-digital converter counts per second (ADC/s) to account for the different integration times usedat each distance. When the source and detector fibres are close together, the spectra closelyresemble the source. At greater distances, where the influence of absorption increases withlarger path lengths, water absorption features become clear in the measurements.
Figure 3 shows the data at two different source–detector distances for all replicate cycles.We found the replicates to be more similar at larger distances between the source and detectorfibres. Two effects could be responsible for this. Firstly, the temperature cycling may bechanging the Intralipid R© physically; a distinct inflexion is apparent at both distances justbelow 37 ◦C. Secondly, at shorter distances the integration time is shorter and the number ofscattering events is lower, leaving the measurement sensitive to short-term variations in thesolution. This requires further investigation.
The signal intensity decreased very quickly as the distance between the source anddetector increased (figure 4). The signal-to-noise ratio, calculated for the mean intensityat each distance, tended to increase initially and decrease at large distances. The initialincrease reflects the higher noise at closer distances mentioned above. The decrease reflectsthe lower signal measured at greater separations. The signal noise was estimated from the

2372 V A McGlone et al
30 32 34 36 38 402900
2910
2920
2930
2940
2950
2960
2970
2980
Replicate:1234
Inte
nsity
[AD
C/s
]
Temperature [°C]
Spectrometer Noise
30 32 34 36 38 40900
905
910
915
920
925
930
935
940
945
Spectrometer Noise
Replicate:1234
Inte
nsity
[AD
C/s
]
Temperature [°C]
Figure 3. Intensity measured at 800 nm, with a source–detector separation of 20 mm (left) and30 mm (right). All four replicate cycles are plotted. A representative error bar (approximately±0.5 ADC/s) illustrates the noise for each set of measurements.
10-1
100
101
102
103
104
105
106
107
108
0 10 20 30 40 50
-0.4-0.20.00.20.4
990 nm
Inte
nsity
[AD
C/s
]
800 nm
SNR
Separation [mm]
Sta
ndar
dize
dR
esid
uals
Figure 4. Typical fits of equation (5) to the measurements. Data are at two wavelengths, 800 and990 nm, from one separation scan in the last cycle. The Intralipid R© temperature was 30.1 ◦C. Solidsymbols are included in the fit while open symbols were excluded. The signal-to-noise (SNR),used to weight the fit, is also plotted for each wavelength. The standardized residuals are plottedbeneath the fitted curve on a scale chosen to show most of the data. The first few residuals are offthe scale.
standard deviation of signal intensity over all four cycles, after removing any linear temperaturevariation.
We used Matlab’s Curve Fitting toolbox to fit equation (5) using the nonlinear least-squares Trust-Region algorithm to our data (Branch et al 1999). The best results were obtainedwhen expanding equation (5) to a function of the absorption coefficient, reduced scattering
Measuring optical temperature coefficients of Intralipid R© 2373
k
k
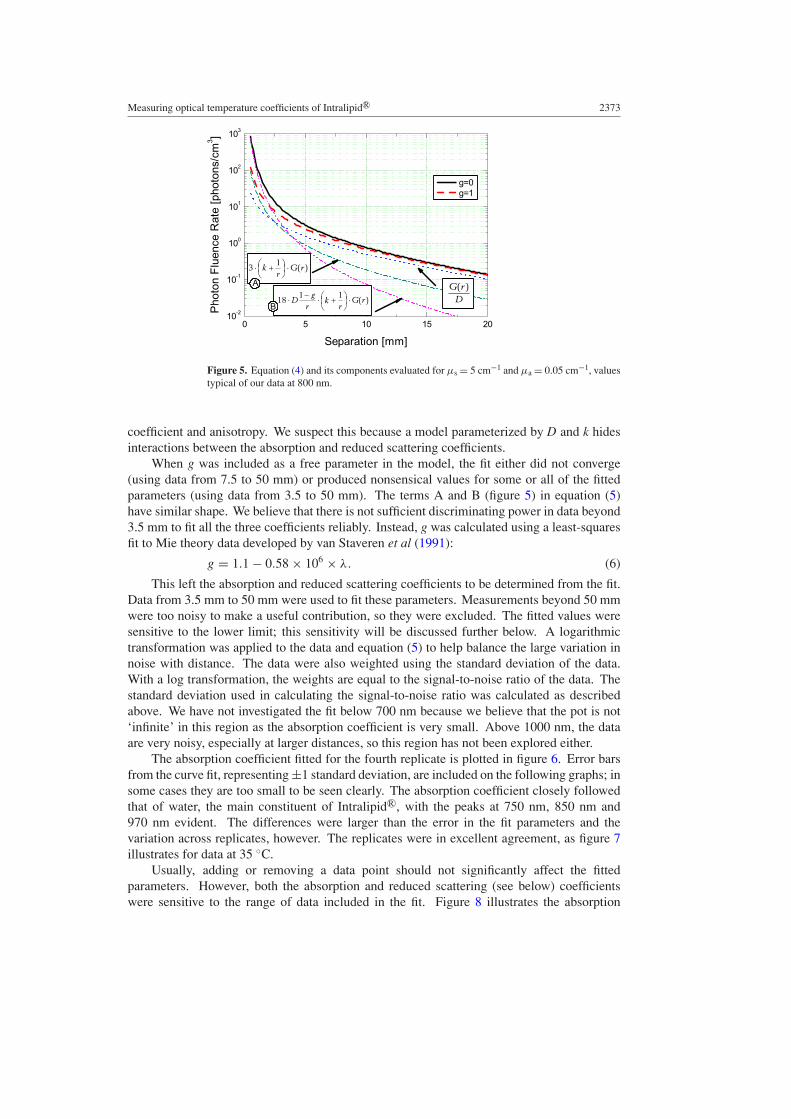
Figure 5. Equation (4) and its components evaluated for µs = 5 cm−1 and µa = 0.05 cm−1, valuestypical of our data at 800 nm.
coefficient and anisotropy. We suspect this because a model parameterized by D and k hidesinteractions between the absorption and reduced scattering coefficients.
When g was included as a free parameter in the model, the fit either did not converge(using data from 7.5 to 50 mm) or produced nonsensical values for some or all of the fittedparameters (using data from 3.5 to 50 mm). The terms A and B (figure 5) in equation (5)have similar shape. We believe that there is not sufficient discriminating power in data beyond3.5 mm to fit all the three coefficients reliably. Instead, g was calculated using a least-squaresfit to Mie theory data developed by van Staveren et al (1991):
g = 1.1 − 0.58 × 10⁶ × λ. (6)
This left the absorption and reduced scattering coefficients to be determined from the fit.Data from 3.5 mm to 50 mm were used to fit these parameters. Measurements beyond 50 mmwere too noisy to make a useful contribution, so they were excluded. The fitted values weresensitive to the lower limit; this sensitivity will be discussed further below. A logarithmictransformation was applied to the data and equation (5) to help balance the large variation innoise with distance. The data were also weighted using the standard deviation of the data.With a log transformation, the weights are equal to the signal-to-noise ratio of the data. Thestandard deviation used in calculating the signal-to-noise ratio was calculated as describedabove. We have not investigated the fit below 700 nm because we believe that the pot is not‘infinite’ in this region as the absorption coefficient is very small. Above 1000 nm, the dataare very noisy, especially at larger distances, so this region has not been explored either.
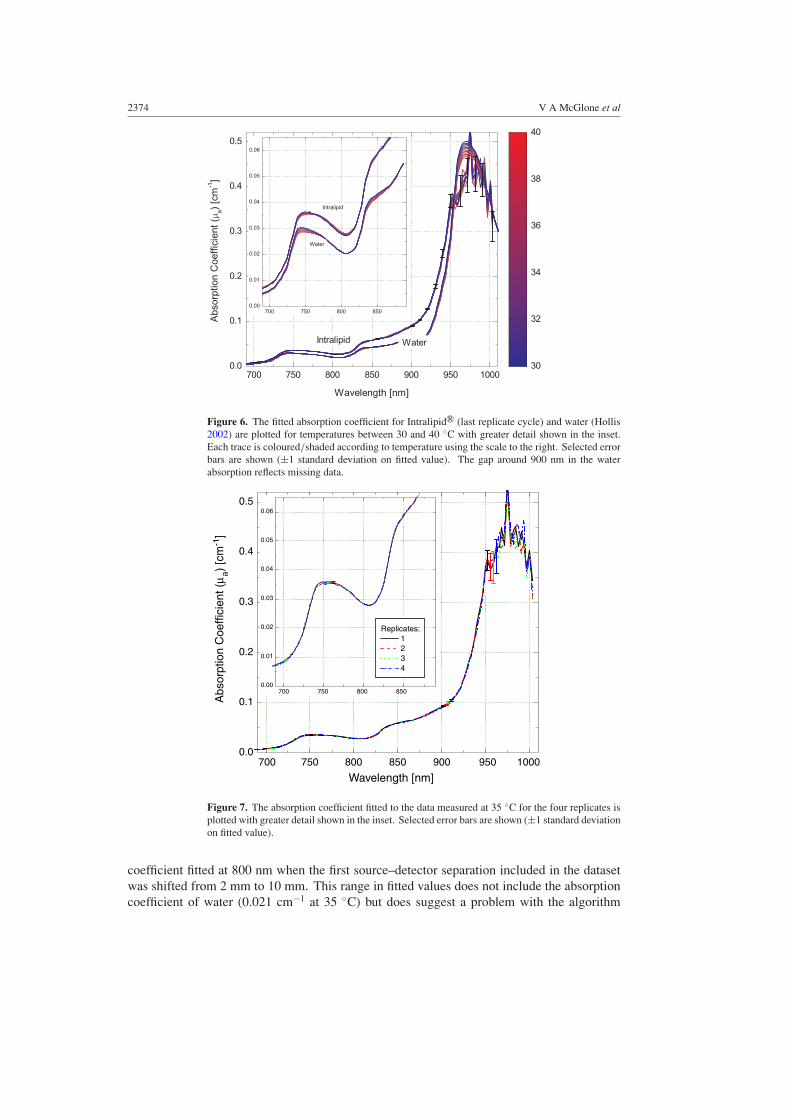
The absorption coefficient fitted for the fourth replicate is plotted in figure 6. Error barsfrom the curve fit, representing ±1 standard deviation, are included on the following graphs; insome cases they are too small to be seen clearly. The absorption coefficient closely followedthat of water, the main constituent of Intralipid R©, with the peaks at 750 nm, 850 nm and970 nm evident. The differences were larger than the error in the fit parameters and thevariation across replicates, however. The replicates were in excellent agreement, as figure 7illustrates for data at 35 ◦C.
Usually, adding or removing a data point should not significantly affect the fittedparameters. However, both the absorption and reduced scattering (see below) coefficientswere sensitive to the range of data included in the fit. Figure 8 illustrates the absorption
2374 V A McGlone et al
Figure 6. The fitted absorption coefficient for Intralipid R© (last replicate cycle) and water (Hollis2002) are plotted for temperatures between 30 and 40 ◦C with greater detail shown in the inset.Each trace is coloured/shaded according to temperature using the scale to the right. Selected errorbars are shown (±1 standard deviation on fitted value). The gap around 900 nm in the waterabsorption reflects missing data.
700 750 800 850 900 950 10000.0
0.1
0.2
0.3
0.4
0.5
700 750 800 8500.00
0.01
0.02
0.03
0.04
0.05
0.06
Wavelength [nm]
Replicates:1234
Abs
orpt
ion
Coe
ffici
ent (
µ a) [c
m-1
]
Figure 7. The absorption coefficient fitted to the data measured at 35 ◦C for the four replicates isplotted with greater detail shown in the inset. Selected error bars are shown (±1 standard deviationon fitted value).
coefficient fitted at 800 nm when the first source–detector separation included in the datasetwas shifted from 2 mm to 10 mm. This range in fitted values does not include the absorptioncoefficient of water (0.021 cm−1 at 35 ◦C) but does suggest a problem with the algorithm
Measuring optical temperature coefficients of Intralipid R© 2375
30 32 34 36 38 40 42
0.0250
0.0255
0.0260
0.0265
Abs
orpt
ion
Coe
ffici
ent
0.0270
0.0275
0.0280
0.0285
8
106
4µ a)[cm
-1]
Temperature [°C]
2
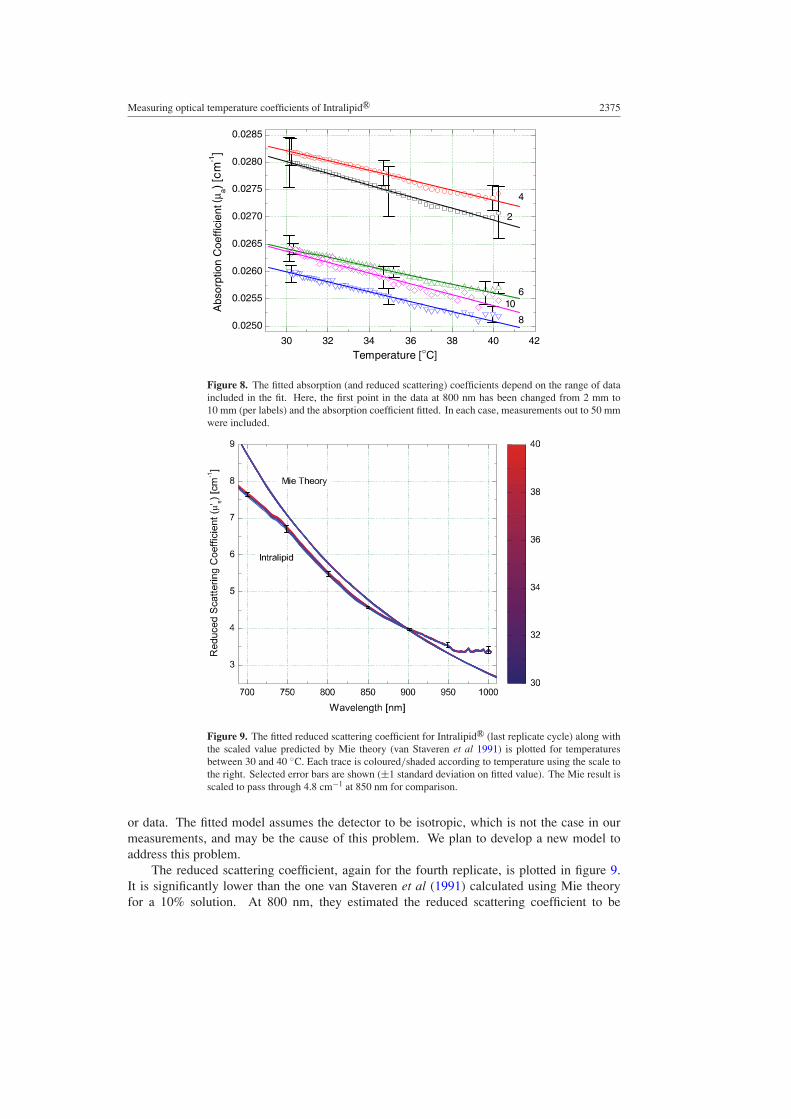
Figure 8. The fitted absorption (and reduced scattering) coefficients depend on the range of dataincluded in the fit. Here, the first point in the data at 800 nm has been changed from 2 mm to10 mm (per labels) and the absorption coefficient fitted. In each case, measurements out to 50 mmwere included.
Figure 9. The fitted reduced scattering coefficient for Intralipid R© (last replicate cycle) along withthe scaled value predicted by Mie theory (van Staveren et al 1991) is plotted for temperaturesbetween 30 and 40 ◦C. Each trace is coloured/shaded according to temperature using the scale tothe right. Selected error bars are shown (±1 standard deviation on fitted value). The Mie result isscaled to pass through 4.8 cm−1 at 850 nm for comparison.
or data. The fitted model assumes the detector to be isotropic, which is not the case in ourmeasurements, and may be the cause of this problem. We plan to develop a new model toaddress this problem.
The reduced scattering coefficient, again for the fourth replicate, is plotted in figure 9.It is significantly lower than the one van Staveren et al (1991) calculated using Mie theoryfor a 10% solution. At 800 nm, they estimated the reduced scattering coefficient to be
2376 V A McGlone et al
700 750 800 850 900 950 1000
3
4
5
6
7
8
9
Red
uced
Sca
tterin
g
µ' s)[
cmC
oeffi
cien
t-1]
Wavelength [nm]
Replicate:1234
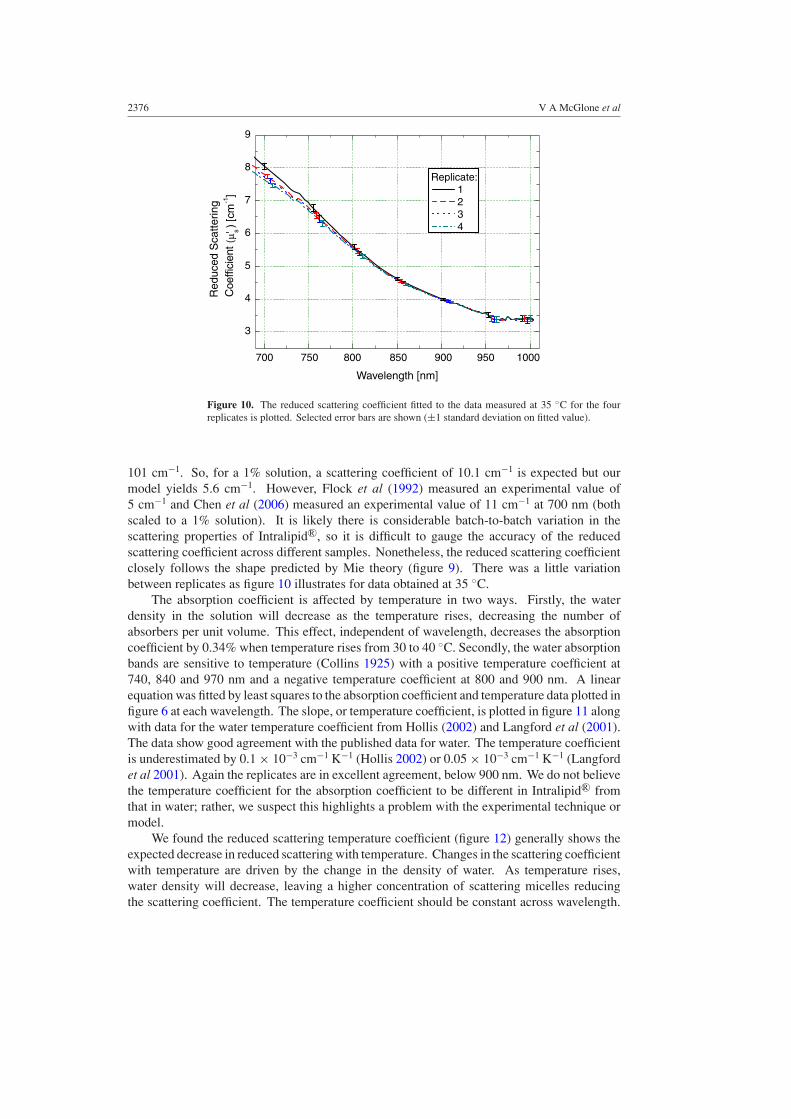
Figure 10. The reduced scattering coefficient fitted to the data measured at 35 ◦C for the fourreplicates is plotted. Selected error bars are shown (±1 standard deviation on fitted value).
101 cm−1. So, for a 1% solution, a scattering coefficient of 10.1 cm−1 is expected but ourmodel yields 5.6 cm−1. However, Flock et al (1992) measured an experimental value of5 cm−1 and Chen et al (2006) measured an experimental value of 11 cm−1 at 700 nm (bothscaled to a 1% solution). It is likely there is considerable batch-to-batch variation in thescattering properties of Intralipid R©, so it is difficult to gauge the accuracy of the reducedscattering coefficient across different samples. Nonetheless, the reduced scattering coefficientclosely follows the shape predicted by Mie theory (figure 9). There was a little variationbetween replicates as figure 10 illustrates for data obtained at 35 ◦C.
The absorption coefficient is affected by temperature in two ways. Firstly, the waterdensity in the solution will decrease as the temperature rises, decreasing the number ofabsorbers per unit volume. This effect, independent of wavelength, decreases the absorptioncoefficient by 0.34% when temperature rises from 30 to 40 ◦C. Secondly, the water absorptionbands are sensitive to temperature (Collins 1925) with a positive temperature coefficient at740, 840 and 970 nm and a negative temperature coefficient at 800 and 900 nm. A linearequation was fitted by least squares to the absorption coefficient and temperature data plotted infigure 6 at each wavelength. The slope, or temperature coefficient, is plotted in figure 11 alongwith data for the water temperature coefficient from Hollis (2002) and Langford et al (2001).The data show good agreement with the published data for water. The temperature coefficientis underestimated by 0.1 × 10⁻³ cm−1 K−1 (Hollis 2002) or 0.05 × 10⁻³ cm−1 K−1 (Langfordet al 2001). Again the replicates are in excellent agreement, below 900 nm. We do not believethe temperature coefficient for the absorption coefficient to be different in Intralipid R© fromthat in water; rather, we suspect this highlights a problem with the experimental technique ormodel.
We found the reduced scattering temperature coefficient (figure 12) generally shows theexpected decrease in reduced scattering with temperature. Changes in the scattering coefficientwith temperature are driven by the change in the density of water. As temperature rises,water density will decrease, leaving a higher concentration of scattering micelles reducingthe scattering coefficient. The temperature coefficient should be constant across wavelength.

Measuring optical temperature coefficients of Intralipid R© 2377
700 750 800 850 900 950 1000
-0.20
-0.15
-0.10
-0.05
0.00
0.05
0.10
0.15
0.20
-2.0
-1.5
-1.0
-0.5
0.0
0.5
1.0
1.5
2.0
HollisLangford
Replicate:1234
-3
-1·K
-1]
Wavelength [nm]
Tem
pera
ture
Coe
ffic
ient
[cm
-3
Figure 11. The absorption temperature coefficient of 1% Intralipid R© fitted to the absorptioncoefficient calculated for each replicate is plotted along with published data for pure water fromHollis (2002) and Langford et al (2001). Data below 900 nm are plotted on 10× expanded scalefor clarity.
700 750 800 850 900 950 1000-12
-10
-8
-6
-4
-2
0
2
DensityReplicate:
1234
-3
-1·K
Tem
pera
ture
Coe
ffici
ent [
cm-1]
Wavelength [nm]
Figure 12. The reduced scattering temperature coefficient of 1% Intralipid R© fitted to the reducedscattering coefficient calculated for each replicate is plotted along with the density temperaturecoefficient. The density coefficient illustrates the anticipated temperature coefficient for the reducedscattering coefficient, for comparison.
We found the temperature and wavelength dependence to be affected by the range of dataincluded in the fit, again suggesting unresolved problems in the technique or model. Thereplicates agree well above 800 nm, but there is a considerable variation below this wavelengthsuggesting structural changes in the solution, perhaps due to the temperature cycling. Weexpect these lower wavelengths to be more sensitive to such changes because the lowerabsorption coefficient will mean a greater number of scattering events taking place.

2378 V A McGlone et al
Conclusion
We have made estimates of absorption and reduced scattering coefficients for wavelengthsbetween 700 and 950 nm for a 1% solution of Intralipid R© using measurements of lightintensity at a range of source–detector separations. The measurements are sufficiently preciseto observe the effect of a 10 ◦C change in temperature on the absorption and reduced scatteringcoefficients.
The temperature sensitivity of the absorption coefficient closely matches the publisheddata for water. The reduced scattering coefficient is more sensitive than can be explained bya change in water density alone, and shows an unexpected relationship with wavelength. It ispossible that the scattering micelles are sensitive to temperature also.
The common assumption for Intralipid R© in the wavelength range explored is an absorptioncoefficient entirely due to water with scatter determined by the density and size of micelles.We have found that while the results closely match this assumption, there is a room forimprovement. Towards this end, we plan to develop a model that incorporates the numericalaperture of the fibres. However, it is clear that temperature perturbations offer a usefulbenchmark for validating instrumentation and models used to calculate optical transportcoefficients.
References
Bevilacqua F, Berger A J, Cerussi A E, Jakubowski D and Tromberg B J 2000 Broadband absorption spectroscopy inturbid media by combined frequency-domain and steady-state methods Appl. Opt. 39 6498–507
Branch M, Coleman T and Li Y 1999 A subspace, interior, and conjugate gradient method for large-scale bound-constrained minimization problems SIAM J. Sci. Comput. 21 1–23
Chance B, Cope M, Gratton E, Ramanujam N and Tromberg B 1998 Phase measurement of light absorption andscatter in human tissue Rev. Sci. Instrum. 69 3457–81
Chen C, Lu J Q, Ding H, Jacobs K M, Du Y and Hu X H 2006 A primary method for determination of opticalparameters of turbid samples and application to Intralipid between 550 and 1630 nm Opt. Expr. 14 7420–35
Collins J F 1925 Change in the infra-red absorption spectrum of water with temperature Phys. Rev. 26 771–9Delfino I, Lepore M and Indovina P L 1999 Experimental tests of different solutions to the diffusion equation for
optical characterization of scattering media by time-resolved transmittance Appl. Opt. 38 4228–36Flock S T, Jacques S L, Wilson B C, Star W M and van Gemert M J C 1992 Optical properties of Intralipid: a phantom
for light propagation studies Lasers Surg. Med. 12 510–19Hollis V S 2002 Non-invasive monitoring of brain tissue by near-infrared spectroscopy PhD Thesis University College
LondonJacques S 1998 Optical properties of “IntralipidTM”, an aqueous suspension of lipid droplets
http://omlc.ogi.edu/spectra/intralipid/Langford V S, McKinley A J and Quickenden T I 2001 Temperature dependence of the visible-near-infrared absorption
spectrum of liquid water J. Phys. Chem. A 105 8916–21Menon S, Su Q and Grobe R 2005 Velocity half-sphere model for multiple light scattering in turbid media Phys. Rev.
E 72 041910Nakai T, Nishimura G, Yamamoto K and Tamura M 1997 Expression of optical diffusion coefficient in high-absorption
turbid media Phys. Med. Biol. 42 2541–49Nichols M G, Hull E L and Foster T H 1997 Design and testing of a white-light, steady-state diffuse reflectance
spectrometer for determination of optical properties of highly scattering systems Appl. Opt. 36 93–104van Staveren H J, Christian J M M, Van Marle J, Prahl S and Van Gemert M 1991 Light scattering in Intralipid-10%
in the wavelength range of 400–1100 nm Appl. Opt. 30 4507–14