measuring national output chapter 5. economic goals economic growth full employment low inflation...
TRANSCRIPT

Measuring National Output
Chapter 5

Economic goals Economic growth Full employment Low inflation
An economy grows because of increases in available resources and improvements in technology.
Economic growth is not smooth
0
10
20
30
40
50
60
70
80
90
1980 2000
US
Asia
Europe
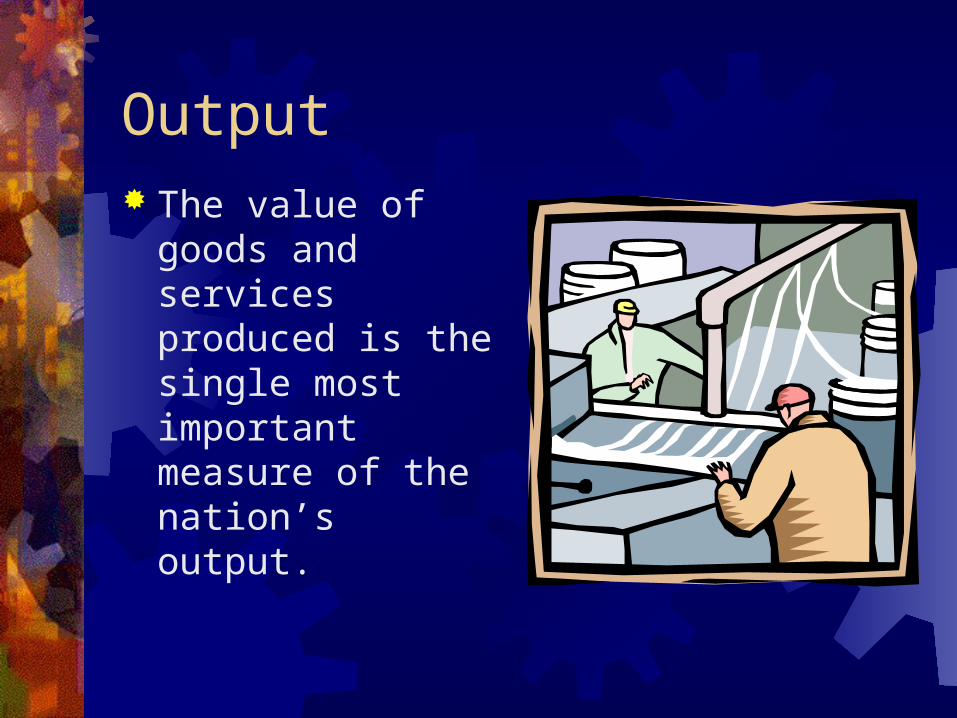
Output The value of goods
and services produced is the single most important measure of the nation’s output.
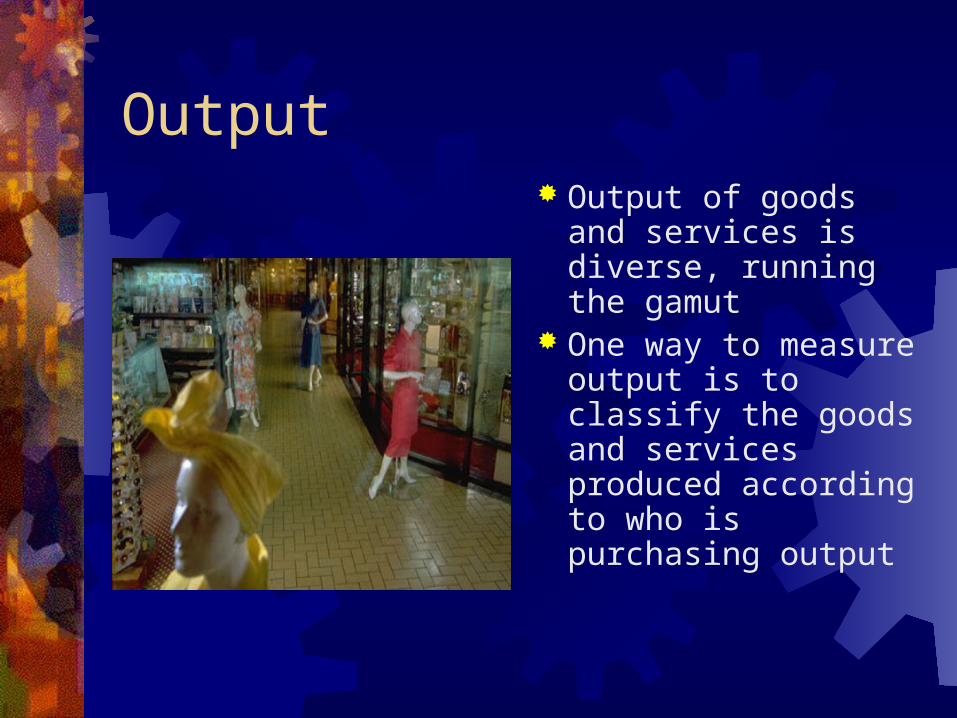
Output Output of goods and
services is diverse, running the gamut
One way to measure output is to classify the goods and services produced according to who is purchasing output

Four Sectors of OutputHouseholds ConsumptionBusiness InvestmentGovernment GovernmentForeign Sector Net exports

Gross Domestic Output (GDP) The market value of the final goods and
services produced in the economy within some time period, usually one quarter or one year
Key terms Market value – price paid Final goods – goods to ultimate consumer Intermediate goods – goods used to make other
goods
Expenditure ApproachMethod of computing GDP that sums
consumption, gross investment, government purchases, and net exports.
GDP = C + I + G + NX

Consumption Purchasing by
households 70% of GDP Durable goods Nondurable goods
Investment Spending now in order to increase output or
productivity later; includes spending on capital, new housing, and changes in business inventories
16% of GDP Purchases by firms on capital such as new
factories and machines Consumers’ purchases of new housing, a form
of consumer capital The market value of change in business
inventories

Change in Inventories Increase in
inventories: part of firms production is not sold, economy slows down
Decrease in inventories: firm’s production falls short of sales, economy speeds up
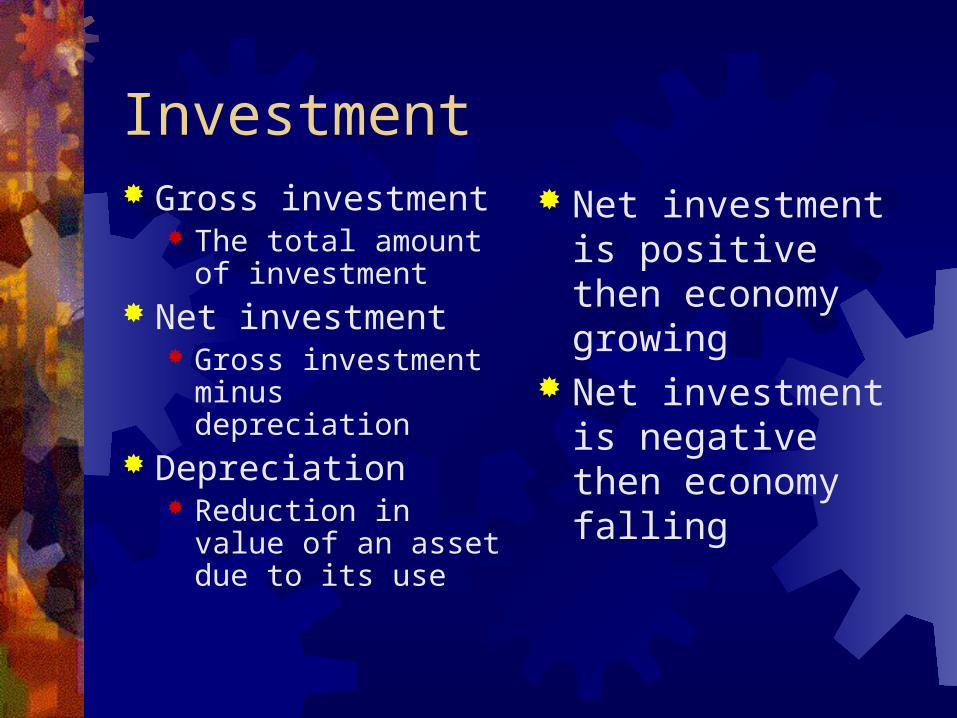
Investment Gross investment
The total amount of investment
Net investment Gross investment
minus depreciation Depreciation
Reduction in value of an asset due to its use
Net investment is positive then economy growing
Net investment is negative then economy falling

Government Federal, state and
local levels 19% of GDP Purchases goods
and services Transfer payments
such as social security are not included
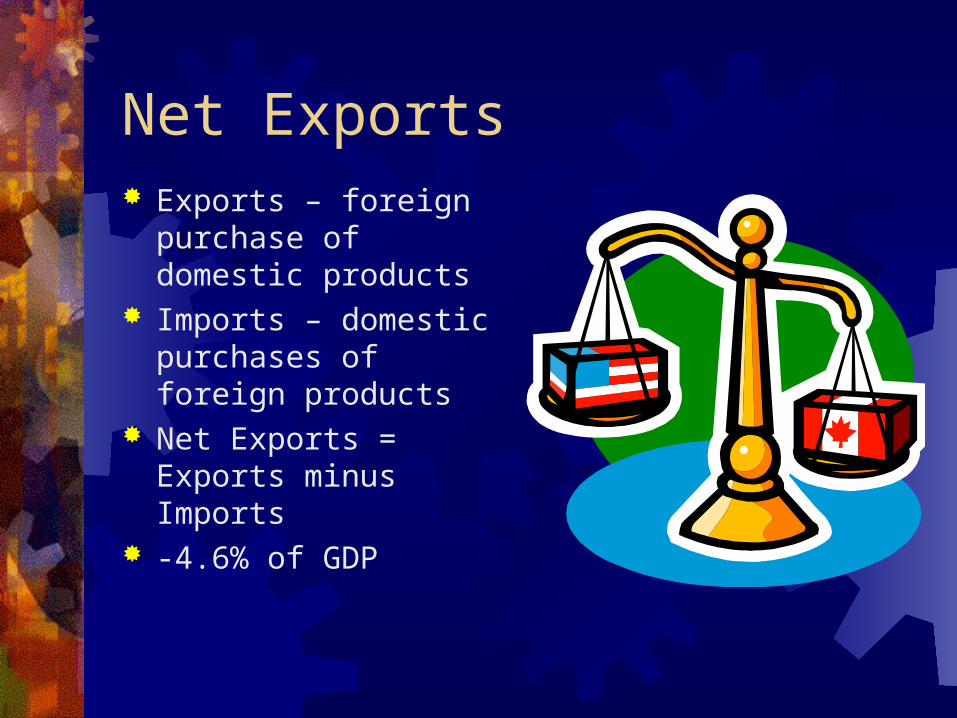
Net Exports Exports – foreign
purchase of domestic products
Imports – domestic purchases of foreign products
Net Exports = Exports minus Imports
-4.6% of GDP
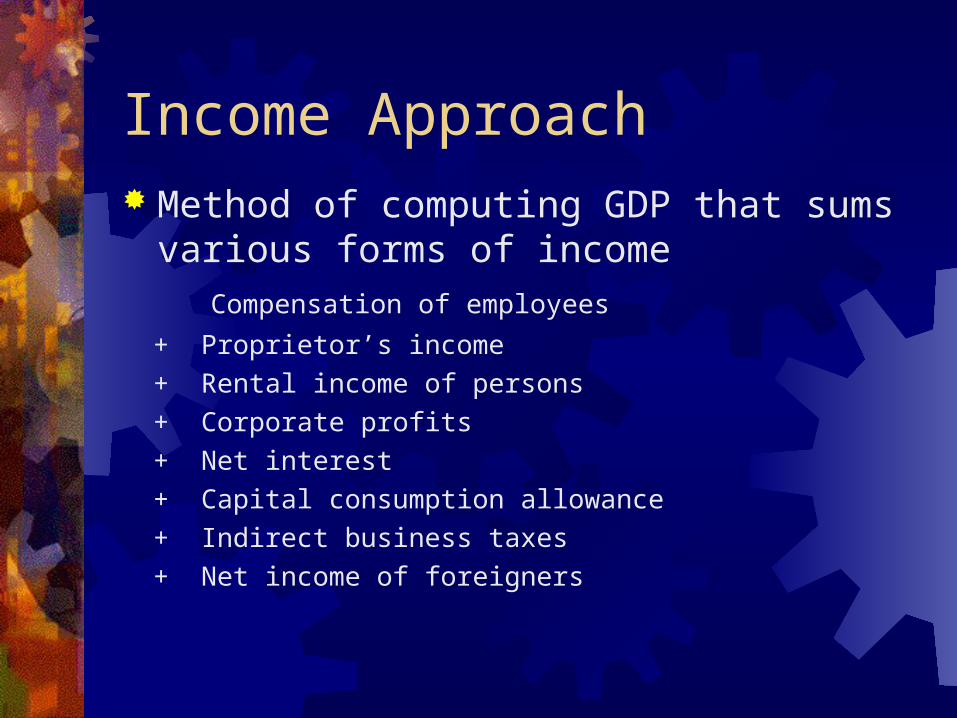
Income Approach Method of computing GDP that sums various
forms of income Compensation of employees
+ Proprietor’s income
+ Rental income of persons
+ Corporate profits
+ Net interest
+ Capital consumption allowance
+ Indirect business taxes
+ Net income of foreigners

GDP as value addedValue added – the difference between
the revenue and the cost of purchased inputs.
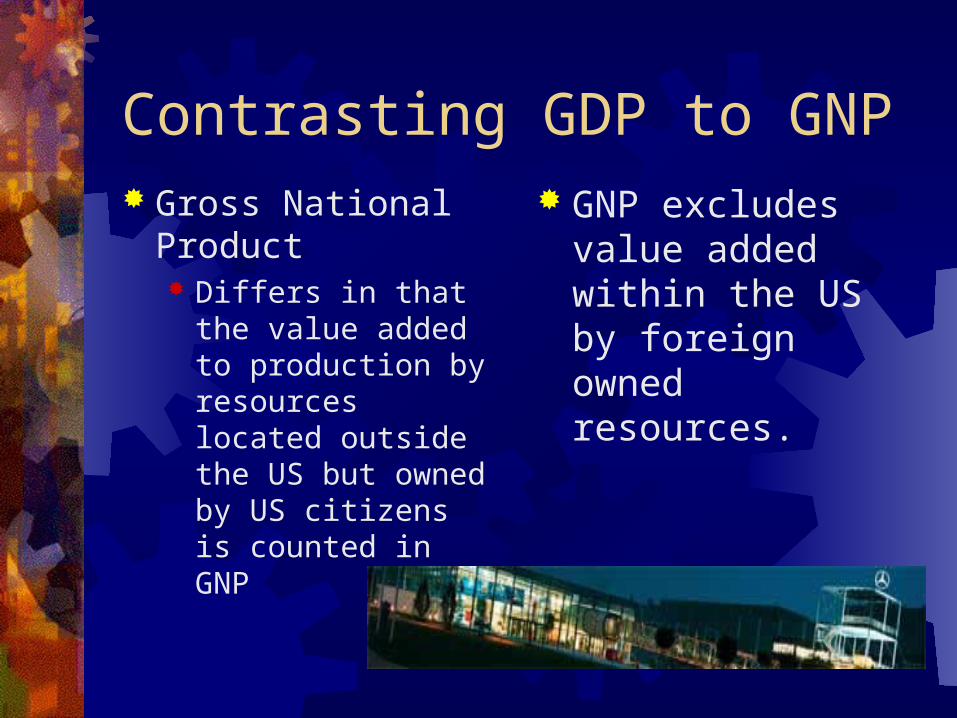
Contrasting GDP to GNP Gross National
Product Differs in that the
value added to production by resources located outside the US but owned by US citizens is counted in GNP
GNP excludes value added within the US by foreign owned resources.

Shortcomings to GDP Underground economy
Market transactions that go unreported to government
Household production Environmental issues
Measure of Economic Welfare - Tobin
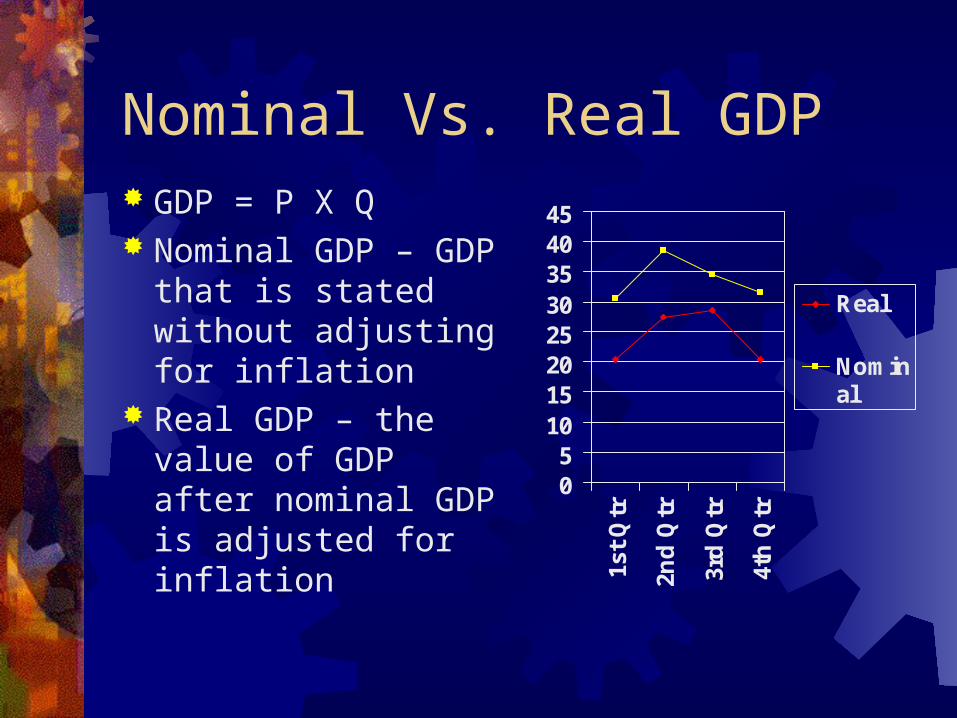
Nominal Vs. Real GDP GDP = P X Q Nominal GDP –
GDP that is stated without adjusting for inflation
Real GDP – the value of GDP after nominal GDP is adjusted for inflation
05
1015202530354045
1st
Qtr
2nd
Qtr
3rd
Qtr
4th
Qtr
Real
Nominal
GDP Price Index Is an index of prices that measures
price changes over time, linking each year with the next.
Real GDP = Nominal GDP X 100
GDP price index
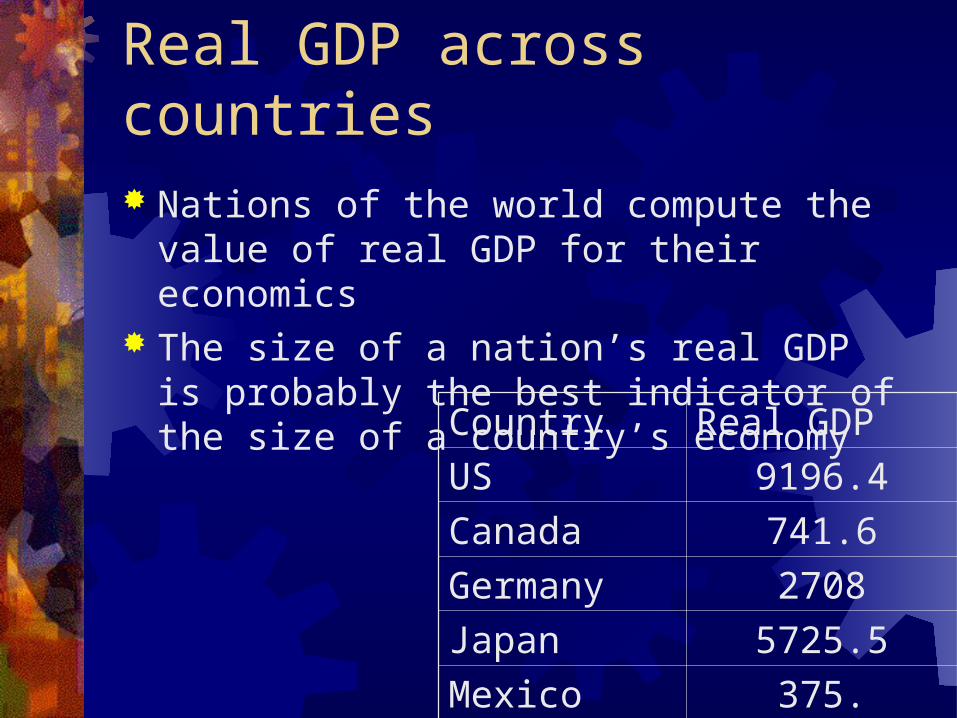
Real GDP across countries Nations of the world compute the value of
real GDP for their economics The size of a nation’s real GDP is probably
the best indicator of the size of a country’s economy
Country Real GDP
US 9196.4
Canada 741.6
Germany 2708
Japan 5725.5
Mexico 375.

Business CycleRefers to the expansions and
contractions in economic activity that take place over time.REAL GDP
Time
Expansion
Peak
Recession
Trough
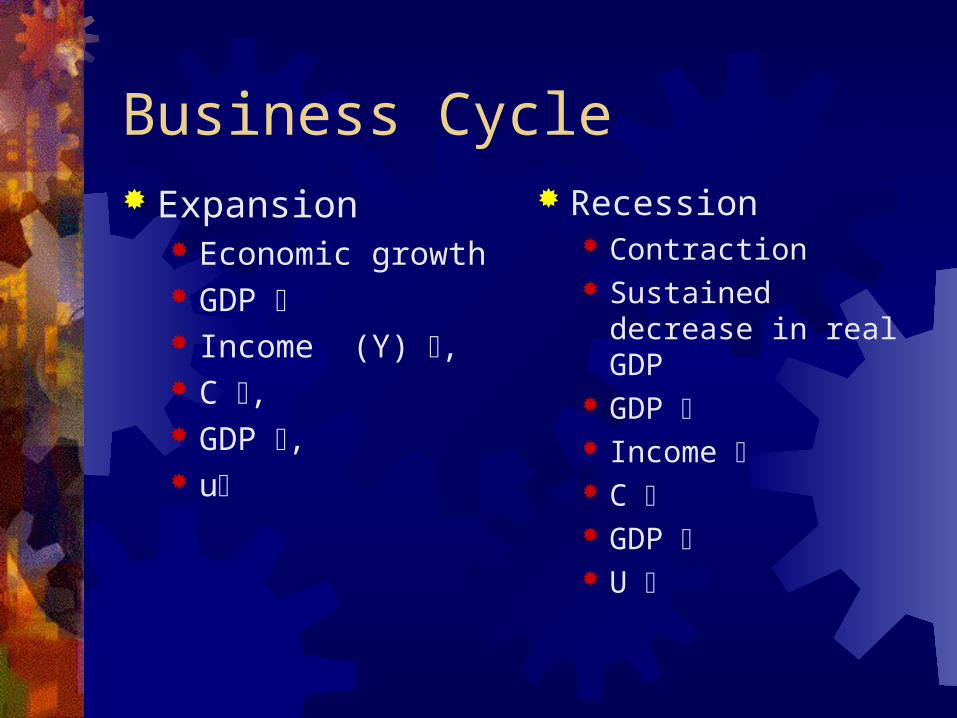
Business Cycle Expansion
Economic growth GDP Income (Y) , C , GDP , u
Recession Contraction Sustained decrease
in real GDP GDP Income C GDP U

Business Cycle Peak – highest level
of economic activity Full employment Potential GDP is
reached
Trough – lowest level of economic activity
Highest level of unemployment
Overall economic trend is to grow
Leading IndicatorsStatistics that are expected to change
direction before the economy of large does, thereby indicating where the economy is headed
Business inventoriesHousing startsDurable goods production

National Income Accounting
GDPLess: DepreciationNet Domestic Production -indirect business taxes-business transfer paymentsNational income – payments to owners of capital-corporate profits-net interest-social security taxesPersonal income = -personal taxesDisposable income = Consumption + Savings