measuring maturity level of e … of the e-cmm maturity levels ... the rating scale of...
TRANSCRIPT

MEASURING MATURITY LEVEL OF E-TRANSFORMING ORGANIZATIONS
A THESIS SUBMITTED TO THE GRADUATE SCHOOL OF INFORMATICS
OF THE MIDDLE EAST TECHNICAL UNIVERSITY
BY
MERVE HANDE ERGİN
IN PARTIAL FULFILLMENT OF THE REQUIREMENTS FOR THE DEGREE OF
MASTER OF SCIENCE IN
THE DEPARTMENT OF INFORMATION SYSTEMS
DECEMBER 2006

ii
Approval of the Graduate School of Informatics
__________________________________
Assoc.Prof.Dr. Nazife BAYKAL
Director
I certify that this thesis satisfies all the requirements as a thesis for the degree of
Master of Science.
__________________________________
Assoc.Prof.Dr. Yasemin Yardımcı ÇETİN
Head of Department
This is to certify that we have read this thesis and that in our opinion it is fully
adequate, in scope and quality, as a thesis for the degree of Master of Science.
__________________________________
Dr. Ali ARİFOĞLU
Supervisor
Examining Committee Members
Prof.Dr. K. İbrahim AKMAN (Atılım University, COMPE) ___________
Dr. Ali ARİFOĞLU (METU, IS) ___________
Assoc.Prof.Dr. Nazife BAYKAL (METU, IS) ___________
Assoc.Prof.Dr. Onur DEMİRÖRS (METU, IS) ___________
Assoc.Prof.Dr. Ali DOĞRU (METU, CENG) ___________

I hereby declare that all information in this document has been obtained
and presented in accordance with academic rules and ethical conduct. I also declare that, as required by these rules and conduct, I have fully cited and referenced all material and results that are not original to this work.
Name, Surname: Merve Hande ERGİN
Signature: _________________

iv
ABSTRACT
MEASURING MATURITY LEVEL OF
E-TRANSFORMING ORGANIZATIONS
ERGİN, Merve Hande
M.S., Department of Information Systems
Supervisor: Dr. Ali Arifoğlu
December 2006, 302 pages
With the opportunities to expand from a local to a global market,
organizations need to change with the development of information
systems and communication technologies. The electronically transforming
organizations’ success depends not only to hardware/software usage but
also transformation in the well-defined business processes. Successful
transformation from “organization” to “e-organization” by innovative
processes requires strategic and cultural changes as a result of changes
in the leadership. In this thesis, a maturity model for the organizations to
achieve to paperless office level will be constructed. Meanwhile, factors
which are essential to reach that level are to be identified.
Keywords: e-Transformation, e-Organization, Maturity Level, Capability
Maturity Model

v
ÖZ
E-DÖNÜŞEN KURUMLARIN OLGUNLUK SEVİYELERİNİN
BELİRLENMESİ
ERGİN, Merve Hande
Yüksek Lisans, Bilişim Sistemleri Bölümü
Tez Yöneticisi: Dr. Ali Arifoğlu
Aralık 2006, 302 sayfa
Kurumların, yerel pazardan küresel pazara geçişin faydalarından
yararlanabilmek için bilgi sistemleri ve iletişim teknolojilerinin gelişmesiyle
birlikte değişmeleri gerekmiştir. Elektronik olarak değişen kurumların
başarısı yalnızca donanım/yazılım kullanımına değil, aynı zamanda iyi
tanımlanmış süreçlerinin de değişimine ve uygulanmasına dayanır.
Yenilikçi süreçlerle “kurum”dan “e-kurum”a geçiş, liderlik değişimlerinin
sebep olduğu stratejik ve kültürel değişim gerektirir. Bu araştırmada,
kurumların kağıtsız ofis ortamına geçmelerini sağlayacak bir olgunluk
modeli oluşturulacaktır. Aynı zamanda, bu seviyeye ulaşmalarına yardımcı
olacak etmenler açığa çıkarılmış olacaktır.
Anahtar Kelimeler: e-Dönüşüm, e-Kurum, Olgunluk Seviyesi, Yeterlik
Olgunluk Modeli

vi
To my husband,
being with me all the times…

vii
ACKNOWLEDGEMENTS
I want to gratefully thank to Dr. Ali Arifoğlu, without whom I would not be
able to complete my thesis, for his unconditional guidance, constant
support and patience. Being the person who introduced me to the
research topic, his endless tolerance made my research to that stage is
unforgettable.
I would like to thank to all the interviewees participated in the
questionnaires; their helps are greatly appreciated.
I would also like to thank to my family for their encouragement and helpful
pushing along the way.

viii
TABLE OF CONTENTS
ABSTRACT..................................................................................................iv
ÖZ ................................................................................................................ v
DEDICATION………………………………………...………………………….vi
ACKNOWLEDGEMENTS...........................................................................vii
TABLE OF CONTENTS ............................................................................viii
LIST OF TABLES .......................................................................................xii
LIST OF FIGURES ....................................................................................xiii
ABBREVIATIONS......................................................................................xiv
CHAPTER
1. INTRODUCTION .....................................................................................1
1.1. Overview ................................................................................ 1
1.2. Motivation............................................................................... 2
1.3. Problem Statement ................................................................ 3
1.4. Thesis Organization............................................................... 4
2. BACKGROUND TO e-TRANSFORMATION IN e-GOVERNMENT........6
2.1. e-Transformation.................................................................... 6
2.2. e-Government: Models ........................................................ 11
2.2.1. Accenture’s Five Stage Plateau Model of e-Government
Maturity……. ............................................................................... 17

ix
2.2.2. Henderson/Venkatraman e-Government Alignment
Model…. ...................................................................................... 18
2.2.3. Australian e-Government Maturity Model..................... 20
2.2.4. LEMM e-Government Maturity Model .......................... 21
2.2.5. Utah e-Government Maturity Model ............................. 22
2.2.6. “eGoss” Initiative e-Government Maturity Model.......... 23
2.2.7. e-Government Maturity Model for the British Columbia
(BC) Government ........................................................................ 23
2.2.8. Gartner Group’s four Stages of e-Government ............ 24
2.2.9. UN Approach ................................................................ 25
2.2.10. OECD e-Government Task Force Model ..................... 26
2.3. Maturity Models and Process Improvement Approaches.... 26
2.3.1. Plan-Do-Act-Check Cycle (PDCA) ............................... 27
2.3.2. ISO/IEC TR 15504 – SPICE......................................... 27
2.3.3. Capability Maturity Model (CMM) ................................. 29
2.3.4. Capability Maturity Model Integrated (CMMI)............... 29
2.3.5. People Capability Maturity Model (P-CMM) ................. 33
2.3.6. ISO 9000....................................................................... 34
2.3.7. COBIT........................................................................... 34
2.4. Information Systems Research Methodologies................... 36
2.4.1. Qualitative Research .................................................... 36
2.4.2. Quantitative Research .................................................. 37
3.CMM: CAPABILITY MATURITY MODEL FOR SOFTWARE
PROCESSES ............................................................................................39
4. e-CMM: e-ORGANIZATION MATURITY...............................................46

x
4.1. Introducing the e-CMM ....................................................... 47
4.2. Structure of the e-CMM ....................................................... 49
4.3. Definition of the e-CMM Maturity Levels.............................. 50
4.3.1. Level 1 – The Initial Level............................................. 52
4.3.2. Level 2 – e-Transformation Vision and Information
Technology Capability................................................................. 53
4.3.3. Level 3 – Customer/Citizen Centered and Data
Standards.................................................................................... 54
4.3.4. Level 4 – Integrated Web Services .............................. 54
4.3.5. Level 5 – Change Management ................................... 55
4.4. Key Process Areas of the e-CMM ....................................... 55
5. A CASE STUDY: e-CMM SURVEY ......................................................64
5.1. Research Methodology........................................................ 64
5.1.1. Steps............................................................................. 64
5.1.2. Potential Findings ......................................................... 67
5.2. Research Findings............................................................... 72
5.2.1. Data Analysis: Prioritized Factors for Transforming
Organizations .............................................................................. 72
5.2.2. Key Findings for e-Transformation and Observations.. 78
5.2.3. Organizations in General.............................................. 91
5.2.4. Quantitative Analysis .................................................... 93
6. JUSTIFICATION....................................................................................97
6.1. Available Models Approach ................................................. 97
6.2. Dependency Analysis on Key Process Areas ................... 101
6.3. Analysis of the Model Developed by Interviewees ............ 102

xi
7. CONCLUSION & LIMITATIONS..........................................................104
7.1. Summary............................................................................ 104
7.2. Contribution........................................................................ 105
7.3. Limitations.......................................................................... 106
7.4. Future Work ....................................................................... 106
REFERENCES……………………………………………………………..108
APPENDICES
A. LIST OF INTERVIEWED ORGANIZATIONS.……………..………..121
B. e-CMM INTERVIEW QUESTIONNAIRE..…………………..…….. 122
C1. e-CMM LEVEL 2 KEY PRACTICES…..……………………..……..126
C2. e-CMM LEVEL 3 KEY PRACTICES…..………………………..…..158
C3. e-CMM LEVEL 4 KEY PRACTICES…..…………………………....217
C4. e-CMM LEVEL 5 KEY PRACTICES…..……………………………264
D. KEY PROCESS AREA ANALYSIS…………………………….….....280
E. MATURITY LEVEL OF ORGANIZATIONS..………………….….....288
F. MATURITY LEVEL DETERMINATION OF EACH
ORGANIZATION……………………………………………….….....289
G. POTENTIAL FACTORS THAT INFLUENCE ORGANIZATIONAL
TRANSFORMATION…………………………………………….…..299

xii
LIST OF TABLES
Table 1.1. Difference Between Traditional and e-Transformed
Organization Structures…..………………..………………………………….12
Table 2.2. The Rating Scale of Processes..……………………………….. 31
Table 2.3. CMMI Staged Model Maturity Levels…………………………....31
Table 2.4. CMMI Continuous Model Process Categories...……………….32
Table 2.5. P-CMM Maturity Levels..………………………………………….33
Table 2.6. COBIT Areas and Processes...…………………………………..35
Table 2.7.Qualitative Research Philosophical Perspectives………………37
Table 2.8. Qualitative Research Methods...…………………………………38
Table 3.1. CMM Maturity Levels Description..…………………………….. 42
Table 3.2. CMM Key Process Areas…………………………………………43
Table 5.1. Factors Ranking According to Mean Importance Ratings…….74
Table 5.2. Factor Rankings for Organization Website According to mean
importance ratings…..…………………………………………………………76
Table 5.3. Overall Existence of each Level...……………………………….92
Table 5.4. Maturity Level Grouping.………………………………………….92
Table 5.5. Level of ITC Departments in Organizations.………………….. 93
Table 5.6. Number of Computer Owned…………………………………….94
Table 5.7. Number of Servers Owned……………………………………….95
Table 5.8. Percentage of e-Workers for Organizations.…………………...95
Table 6.1. e-Government Maturity Models-Comparison.………………...100
Table 6.2. Significance Values of KPAs….………………………………..101
Table 6.3. Dependency of KPAs……………………....……………………102

xiii
LIST OF FIGURES
Figure 2.1. Organization Value Chain..……………………………………….8
Figure 2.2. STOPE View……………………………………………………..10
Figure 2.3. The Components of e-Government…………………………….13
Figure 2.4. The Architecture of e-Government...…………………………...14
Figure 2.5. e-Government Maturity Growth of Nations from 2000 to 2005
…………………………………………………………………………………...15
Figure 2.6. SPICE Software Process Improvement Steps...………………30
Figure 2.7. Action Research Quality Cycle...………………………………..38
Figure 3.1. CMM Process Maturity Levels…………………………………..41
Figure 3.2. CMM Architecture…………………………………………………42
Figure 3.3. CMM Common Properties..…………………………………..…43
Figure 4.1. Improvement Focus Triangle...………………………………….47
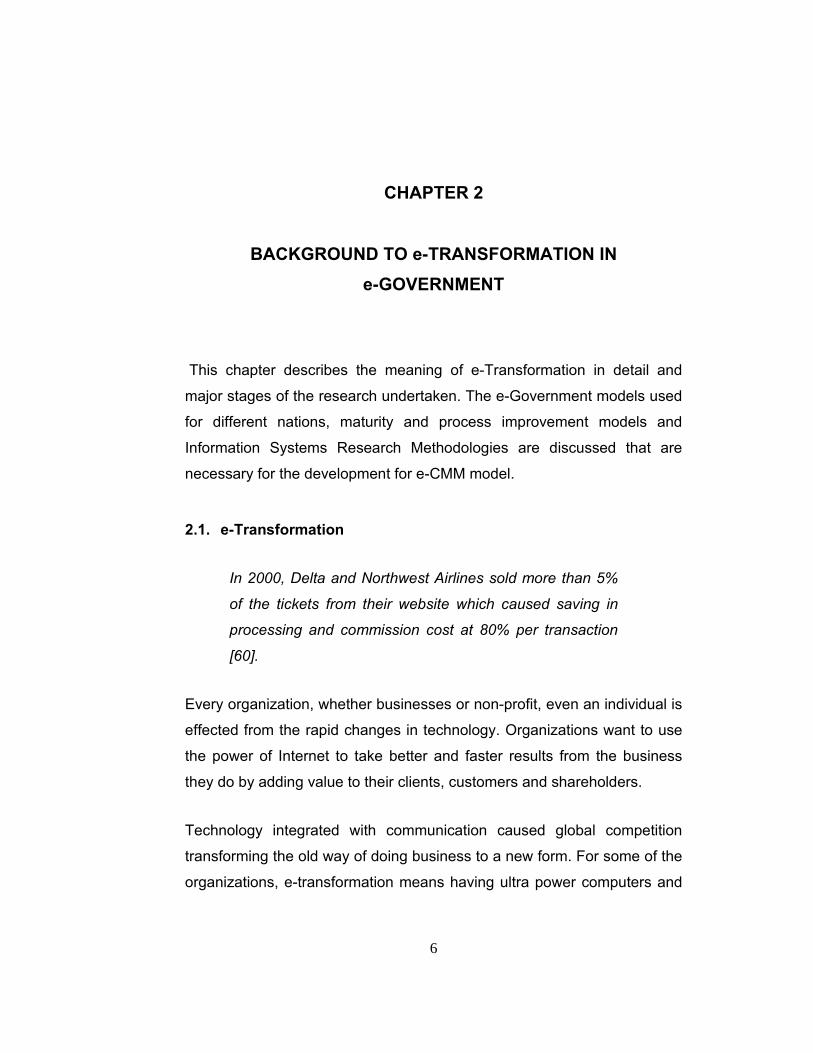
Figure 4.2. Five Maturity Levels of the e-CMM...…………………………...51
Figure 4.3. Key Process Areas of the e-CMM by Maturity Level..………..57
Figure 5.1. Worldwide Economic Damage from Digital Attack.………….. 72
Figure 5.2. Organizations’ Existing KPA – First Draft...……………………80
Figure 5.3. Organizations’ Existing KPA (Modified & Refined)..………….90

xiv
ABBREVIATIONS
24/7: 24 hours a day, 7 days a week
B2B: Business to Business
B2C: Business to Customer
BC Government: British Columbia Government
BPR: Business Process Reengineering
CIF: Corporate Information Factory
CMM: Capability Maturity Model
CRM: Customer Relationship Management
CRMS: Customer Relationship Management System
ERP: Enterprise Resource Planning
FAQ: Frequently Asked Questions
G2B: Government to Business
G2C: Government to Citizen
G2G: Government to Government
GDP: Gross Domestic Product
ICT: Information Communication Technologies
IT: Information Technology
KPA: Key Process Area

xv
LEMM: Levels of e-Government Maturity Model
ODS: Operational Data Store
OECD: Organization for Economic Cooperation and Development
PA: Process Attributes
PDCA Cycle: Plan-Do-Act-Check Cycle
SPICE: Software Process Improvement and Capability dEtermination
TQM: Total Quality Management
UK: United Kingdom

1
1. CHAPTER 1
INTRODUCTION
This chapter makes a short introduction to explain the meaning of
transformation in terms of organizations. Then the motivation behind that
study and problem is defined. Finally, the content of the thesis is included.
1.1. Overview
Globalization has changed and still changing the way of doing business.
From small- to large-size, enterprises effected from the internet and web
through information technology usage in terms of competitiveness.
Beginning from 21st century, e-business concept has gained wide usage
including e-government, e-commerce and other e-service definitions.
Changes in government services from their present state to e-government
services, has been an international trend in most of the places of the
world. Bakry suggests gains in two ways; adding value to digital economy
not only to government but also to organizations and society, besides,
removing unnecessary and ineffective services by the government after
the evaluation of the present services [10]. A transformation is necessary
not only in the infrastructure but also in the business processes.

2
1.2. Motivation
The starting point of this work is the wide usage of the Internet and web
services for business purposes. Changing the way they do business
results to a new type of organization with the presentation of Information
Technology. With the development in technology, organizations aimed
increase in efficiency, productivity and gain competitive advantage by
using the power of Internet. Providing integration with communication
caused to present value added services to internal and external
customers. This must lead to a kind of transformation since requires
change in the business processes. To run parallel with or to lead the
change, organization should search for new way of doing business.
Today we are talking about e-Government. But what is that “e”? What
does “e” need? Let’s take any government service as an example. To get
traditional government service, an individual should go to government
building, wait in the queue to take information, fill the form, go to the
related individual for that service, wait in the queue, individual signs the
form, directs you to another individual and so on. Even for a simple
service, the individual should waste hours for the completion of it. This is a
waste because any individual providing service in the government could
deal one person at a time; however, Internet could deal with multiples. “e”
means giving the organization’s services in the electronic medium.
However, behind that presentation, organization should change the
actions taken in business processes. Moreover, government is in contact
with other groups also; with non-profit organizations, businesses, other
government agencies. The transformation in the government is not enough
by itself. To talk about real transformation, the others being in contact with
each other should also change. But, how to change is not clear. There are
some models used by nations to transform their government services.
When they are examined, it is seen that the focus is on the development of

3
the web site of the organization since the services are delivered by online
or Internet based aspects. Other models deal with the maturity of some
organizational processes such as project management, intranet, web site
etc. However, a roadmap is missing focusing on the whole organization’s
transformation.
In this study, a model is formed to guide the organizations to be successful
in e-transformation. This study is directly related to that effort and findings
of the study could be used by the organizations that want to be an e-
organization.
1.3. Problem Statement
To remain competitive in today’s global marketplace, and being efficient
and effective, a transformation is necessary not only in the infrastructure
but also in the internal and external business processes. The ultimate aim
of that transformation is to be a paperless office by digitalizing the
enterprise as well as its business processes and culture. For any company
or organization, the answer to the following question raised by almost
every manager, has been used to guide this research work:
Where are we in terms of e-transformation and how can we
increase our level of that?
The main component of that question is the issue of moving the steps of
the e-transformation stair one-by-one in the rapidly changing world.
Therefore, we started to define e-Transformation first and continued with
its maturity.

4
1.4. Thesis Organization
The thesis begins with a brief definition of e-Terms. Chapter 2 is followed
by a general overview of e-Transformation concept. Reviews about the
different government models for being e-government are given and these
models are compared depending on the activities and maturity levels.
Different maturity models related with determining the maturity of
organization are explained.
In Chapter 3, the model constructing a fundamental base model for e-
transforming organizations is explained. Capability Maturity Model (CMM)
is taken as framework for the development of e-CMM. CMM maturity
levels and activities in these levels are introduced.
In Chapter 4, e-CMM model, the model designed for electronically
transforming organizations is described in detail. The development of the
model, definition of each maturity model, the activities and common
features for each activity is explained.
Chapter 5 presents the results of the survey. The questionnaire findings
are analyzed, the organization’s maturity level is given, the factors that are
prioritized for organization about transformation is examined.
Chapter 6 discusses the justification of the e-CMM model with the help of
the findings from Chapter 5. The activities determined for each level is
discussed.
Chapter 7 summarizes the things done for this study, talks about the
contribution of e-CMM model to organizations, limitations considered
during the study and comments for the future study for evolving the model.

5
There are some missing points for the organizations in being a guide to
coordinate the business processes and activities in the elimination of
paper transformation within and between the organizations. All in all, this
thesis carries the aim of being a base model for e-Transforming
organizations formed by the help of e-government models and the result of
the questionnaires.
Following the main text, this thesis also includes six appendices. In
Appendix A, a list of the individuals interviewed is given with the institution
name. Appendix B presents a sample questionnaire used throughout the
study. Appendices C gives the common features for each key practice for
maturity level 2, 3, 4 and 5 to be utilized for the model formed in Chapter
4. Appendix D indicates the graphical representation for each activities
resulted from questionnaire data. Appendix E and F lists the maturity level
of each organization interviewed and details how that maturity level is
calculated.
6
2. CHAPTER 2 …
BACKGROUND TO e-TRANSFORMATION IN
e-GOVERNMENT
This chapter describes the meaning of e-Transformation in detail and
major stages of the research undertaken. The e-Government models used
for different nations, maturity and process improvement models and
Information Systems Research Methodologies are discussed that are
necessary for the development for e-CMM model.
2.1. e-Transformation
In 2000, Delta and Northwest Airlines sold more than 5%
of the tickets from their website which caused saving in
processing and commission cost at 80% per transaction
[60].
Every organization, whether businesses or non-profit, even an individual is
effected from the rapid changes in technology. Organizations want to use
the power of Internet to take better and faster results from the business
they do by adding value to their clients, customers and shareholders.
Technology integrated with communication caused global competition
transforming the old way of doing business to a new form. For some of the
organizations, e-transformation means having ultra power computers and

7
expensive software without knowing where and why to use. However, a
change in business processes is vital to be e-transformed organization. An
organization, similar to human, is a living system, of course, that kind of
change cannot occur at one night. To do that, the organization should
know itself well; it could define what it has and has not. During the change,
if the organization becomes successful, it goes ahead in the competition;
otherwise, it may become a history. This comes to a point that, a change
in one organization does not mean anything or means everything. The
change in one should fire the others, the other organizations being in
contact, internal and external customers. The result of e-transformation in
the view of businesses is business-to-business (B2B), business-to-
consumer (B2C), business-to-employee (B2E) and business-to-
government (B2G) interactions and transactions. That business-to-
something could also be converted into customer-to and government-to
issues since the change effects everybody.
Government, industrial and commercial organizations needs to develop
their value chain and support their systems. In Figure 2.1, Bakry (2004)
suggests that information systems could add value to value chain and
systems of organizations, its suppliers and customers [10]. In case of the
effective usage of electronic medium, the value system of the country will
increase, invert to digital economy so results to improvement in the
society.
For the improvement in services and to have high quality products,
organizations should focus to people, process and technology components
which are related with each other [68]. However, an organization is also in
contact with its environment. To achieve an e-transformation, the
organization should have a strategy and that strategy should deal with
technology to support the system. So the coordination between the
organization, people, strategy, technology and environment is necessary

8
for the development. Bakry called this as STOPE (Strategy / Technology /
Organization / People / Environment) view) [10]. He indicates the concepts
that should be found in e-government for the development through digital
economy in Figure 2.2.
Partners and Suppliers Value Chain
Customers Value Chain
Organization
Primary Activities
Value Chain
Support Activities(including “e” support )
“e”
“e”
“e”
“e”
“e”
“e”
“e”
“e”
Figure 2.1. Organization Value Chain (Taken from Bakry, S. H. [10])
In government infrastructure, there should be e-service operations
necessary to give government services and containing internal activities
from government to government (G2G). Also, the government should give
services to citizens and businesses from a portal continuously 24 hours 7
days a week; thus, the transactions and operations would be speed;
movement and transportation requirement would be minimum; saving in
facility and stationary, standardization in processes; have more than one
copy of the documents if necessary; combination of government,
international and national services; and transparency would occur.

9
In the e-enabled enterprise, all the processes affecting inside and outside
activities of the organization is taken into account. For the delivery of the
right product, to the right place, at the right time at the lowest cost, called
Supply Chain Management, requires the integration of the service or
product enabler with its suppliers and customers. With the increase in
quality in the interaction to suppliers, distributors and customers,
improvement in the customer service and low inventory levels takes place.
This interaction in a way needed share of organization data which also
requires transparency in the operations of the organization and build of
trust between the parties. All of the transformations are done to make the
works in a more efficient and effective way to obtain profit.
Customer is the end point who is going to decide the effectiveness of the
works done so the communication with the customers is tried to be
optimized. By identifying, selecting, acquiring, developing and retaining the
most profitable customers, it is possible for the organization to address the
personal preferences and values to satisfy the customer needs and
expectations. May be the most important side of the transformation
process is the right knowledge delivered to the right people, at the right
time. Knowledge gains a value if it is shared between the individuals so
enrichment occurs.
In the transformation process, the organization has to use the power of the
Internet for better and faster business results to add value to its
customers, clients and shareholders. In the Accenture’s Outlook Special
Edition eSeries [1], five stages are determined to integrate the Internet to
the organizational processes. The transformation occurs starting from
designing number of websites for each product line. As learning occurs,
organization forms strategy for e-business and management level starts to
control the processes. With the increase in maturity level, measuring and
monitoring applications start to evolve and at the last stage, the e-business

10
strategies and processes are integrated with core business. e-
Transformation also requires change in the culture and strategy of the
organization. A vision, a leadership to own and direct the changes, a
healthy company culture, a plan to achieve the e-Transformation and a
severe communications strategy within and between the organizations
and/or customers are must-to-have factors for e-Transformation [24]. The
organization may need specific job skills, new job responsibilities may
occur, improvement in the products and services may be needed and
more cross functional communications may be necessary [65]. Table 2.1
shows the fundamental differences between traditional and e-Transformed
organization structures [80].
Strategy
TECHNOLOGY ORGANIZATIONS PEOPLEIT Users
IT Staff
Managers
IT Production:
Producers/Users
Basic Internet Services: Providers/Users
E-Governemnt, e-Commerve & Other e-Services:Providers/Users
IT Industries
Communications Infrastructure
Advanced Internet Infrastructrure
Basic Internet Infrastructure
ENVIRONMENTKnowledge SecurityManagementEconomyExperience
Education
Media Resources
Business
Initiative
Regulations
Practice
Leadership
Rules
Challenges
Protection
Local Culture and Internal Influence (Globalization)
CONTINUOUS DEVELOPMENT
Approach:
TQM/BPR/Six Sigma
Vision:
where/targetMission:
why/reason
Plans/Projects/Implementation
Improvement: Cheaper / Better / Faster / Different / Secure
Figure 2.2. STOPE View (Taken from Bakry, S. H. [10])

11
Consequently, as Zott et al., Avlonitis and Carayannis indicate
organizations facing with e-Transformation has efficiency in business
transactions and work environment which results to quick customer
responses, personalized product development and organizations become
more competent in responding to market needs (as cited in [48]) .
In summary e-Transformation can be shortly defined as [8]:
e-Transformation = [e-Individual Transformation + e-Business
Transformation + e-Commerce Transformation +
e-Organization Transformation + e-Government
Transformation ]
In other words, e-Transformation means restructuring of business
processes, model and culture for the benefit of human kind within an aim
of continuous improvement.
2.2. e-Government: Models
Government is composed of various participants: citizens, business, other
governments to enable interoperability, agencies work together to provide
one-stop service. When we talk about e-Government, we are talking about
a transformation within the government processes and between the
relationships of the government and the interacting sides. The components
of e-Government are given in Figure 2.3 [35].
The objectives of e-Government is to improve processes by managing the
performance to cut processing costs and make strategic connections in
government; connecting the citizens to government with transactions; and
building external interactions to work better with businesses, communities
by building partnerships (cited from [84]). For a government to be e-

12
Government, interaction with citizens and integration between government
departments is necessary.
Table1.1. Difference Between Traditional and e-Transformed Organization
Structures
Traditional Organizational Structures e-Transformed Organizational StructuresStructured around specialized functions Structured around customer in processes
Departmentalization of operations Integrated operations connects all departmental operations
Functional specialization with operations Process-integration connects all departmental operations
Individual departments make operational decisions
Senior cross-functional team makes operational decisions
Inside focus on departmental needs External focus & customer centric
Slow operations as departments are not in synchronization
Fast execution given connectivity & process integration
Departmental results Customer results
Structures under "one" roof in relation to customer & supplier locations
Structures distributed around global processes for all customers
Departmental learning, skill development Total organizational learning, core competency, skill development & career focus
Different definitions for e-Government taken from different resources are
given below:
“…a transformation of public sector internal and external relationships through use of ICT to promote greater accountability of the Government, increase efficiency and cost-effectiveness and create greater constituency participation [84].”
“A permanent commitment by government to improve the relationship between the private citizen and the public sector through enhanced, cost effective and efficient delivery of services, information and knowledge. It is the

13
practical realization of the best that government has to offer.” (A UN definition)
“The use by government agencies of information technologies…that have the ability to transform relations with citizens, businesses and other arms of government. These technologies can serve a variety of different ends: better delivery of government services to citizens, improved interactions with business and industry, citizen empowerment through access to information, or more efficient government management.” (A World Bank definition) “The use of information and communication technologies, and particularly the Internet, as a tool to achieve better government.” (OECD definition) “e-Government is about building skills, fast transforming complex organizations to achieve agility and efficiency…and competing affectively in the global economy. The foundation is based on using networking & knowledge to revolutionize education, government service and participative democracy.” (A private sector definition)
Other agencies
Non-profits
Communities
Businesses
e-Administration:
Improved processes
Government
GovernmentG2Ge-Services:
External interactions
Citizens
Customers
e-Services:
Improved delivery
G2NG2C
G2B
e-Citizens:
Connected Citizens
Figure 2.3. The Components of e-Government (Taken from Heeks, R. [35])

14
For e-Government, all the citizens have possibility of reaching not only
governmental but numerous services from anywhere, any time through
any media. Although citizens interact with government by using e-mail,
web, phone, kiosk, WAP, PDA and face-to-face, the relationship between
the parties and the government is wanted to be satisfied mostly by
personal computer (PC) for the development of e-Government. However,
Accenture (2005) reported that 63% of the industrialized countries citizen
contact by phone, where as 31% is using Internet [3]. e-Government
services are satisfied by the integration of data systems, leadership,
technology and human, and adaptation of web-services and back office
systems. To satisfy the goals, information and decisions actions and
service transactions are taken into consideration. The architecture of e-
Government is shown in Figure 2.4 [34].
Recipient
Channel
Processing
Source
Citizens, Businesses, Public servants etc.
Intermediaries
Mobile
phonesDigital
TVCall
centersKiosks PCs PDAs
Web
Intranet Extranete-mail
Management support system
Basic data system
Office automation
Government data
Data communication
devices
Data communication
applications
Network-enabled data processing
applications
Figure 2.4. The Architecture of e-Government (Taken from Heeks, R. [35])

15
e-Government maturity is described as the degree of development on
online presence. For developing and maintaining the e-Government
services, the control of processes is mandatory. In the maturity model, the
current state is determined and the improvement actions are taken to
reach the excellence.
To achieve high maturity level, transformational changes should be
continuous and the priorities should be planned carefully by reviewing the
strategies for a new action plan. Taking citizen feedback into consideration
is important in the growth of maturity. Figure 2.5 indicates the maturity
growth of 21 nations from 2000 to 2005.
Figure 2.5. e-Government Maturity Growth of Nations from 2000 to 2005 (Taken from Accenture (2005) [2])

16
Singh, Das and Joseph developed a research to find a reason for rich
nations being at the top of e-Government ranking [79]. Their hypothesis is
that rich nations are talking more about e-Government maturity. In the
model they developed, for e-Government maturity, organization has three
main influences: human capital, ICT infrastructure and Governance.
According to UN Development Report [91], the human capital is measured
with adult literacy rate and the number of students in schools in the
country. For ICT infrastructure, UN World Public Sector Report (2003) [90]
indicates the number of PC’s, phone lines, mobile phones, television per
1000 person, number of Internet users and online population per 1000
person as an indicator for measurement. Political stability, quality of laws,
government effectiveness is given as examples for governance. At the end
of their research, they found that technological infrastructure plays an
important role for e-Government maturity. Since rich nations have higher
Gross Domestic Product (GDP), they can afford high investment in so
have higher maturity. However, the other two, human capital and
governance, showed negligible effect on e-Government maturity.
e-Government is citizen centric and offers maximization of services given
depending on the needs and the preferences. To access these services, a
central point, called portal is used. By the time, the personalization of the
portal will be required for the citizen to obtain more appropriate services
and more relevant information. This process is going to require better use
of citizen data by the government which serves a similar purpose to
Customer Relationship Management (CRM).
The aim of e-Government models is to guide other governments being in
the same purpose. In models, there are numbers of criteria for the
assessment of the government performance that wants to transform so
also compare itself with the other governments at other countries. As
moving from one level to another, government development cost

17
increases, new technologies, development in new business practices are
needed.
Some of the models use the term maturity stage in terms of maturity level.
To observe the e-Government maturity levels, several of researches are
done. 10 models are examined for different nation’s e-government models.
All models have different maturity levels. Some of the models are
developed from a base model. At the first part, information about the e-
Government models will be given. At the second part, the comparison of
the models will be indicated.
2.2.1 Accenture’s Five Stage Plateau Model of e-Government Maturity
Accenture’s Stage Model [7] is formed by tracking number of e-
Government changes world wide with a methodology of interviewing and
scoring 100 questions. For the model construction, historical measures are
used. In the Five Stage Plateau Model, many government has some
triggers while moving from one stage to another feeling the plateau effect.
In Five-Stage Plateau Model of e-Government Maturity is defined in five
levels:
• Plateau 1 – Online Presence: The information owned by the
organization is published online. Few services are available on the
website. Infrastructure has to be built to support the processes.
• Plateau 2 – Basic Capability: Central action plan is created.
Infrastructure is improved by adding security to the system and
certifying. Online presence between the government and citizens
occurs. Revenue generating sectors are primary consideration. Basic
transaction between the government and citizens is took place. Vision
development for e-Government activities and encouragement between
the departments are considered.

18
• Plateau 3 – Service Availability: Basic portal design is constructed for
interacting with citizen. The number of services available online is
increased. Some sophisticated transaction capabilities are
implemented. Cooperation with other departments is coordinated.
• Plateau 4 – Maturity Delivery: Transactional capabilities are increased
by value adding services and processes. Services provided are
clustered. The transformation process is owned by top level manager.
Collaboration between the different levels of government is started.
Citizen-centered actions are taken into consideration. Involvement of
the customer to processes is recommended.
• Plateau 5 – Service Transformation: Vision is the planning citizen-
centered processes. e-Government is not a separate action but part of
transformation. There is integration between the departments and other
governments. Changes in the organization, processes and technology
are accurately planned and applied.
2.2.2 Henderson/Venkatraman e-Government Alignment Model
The strategic alignment model designed by Henderson & Venkatraman
[22] has 4 areas: Business strategy, IT strategy, organization infrastructure
and IT infrastructure. On the strategic alignment model, the interaction
between these four issues is considered. The e-Government Alignment
Model is an integrated model considering the e-Government maturity
issues and strategic alignment model. e-Government Alignment Model has
concentrated on four areas similar to Strategic Alignment model:
• Government Strategy: defines the external relationship between the
citizen and other organizations.
• E-Government Strategy: defines the processes needed to support
and/or create opportunities and examines new features to create
advantages.

19
• Government Infrastructure: defines the properties of the structure of the
organization and the culture, and organization’s key processes.
• e-Government Infrastructure: explains the infrastructure items of the
organization such as platforms, hardware, software, network and the
organization’s IT processes.
The maturity model has six stages:
• Stage 1 – Rhetoric: Government realized the benefits of going online.
They are having a strategy, pronouncing the strategy to key
stakeholders.
• Stage 2 – The Vision: e-Government vision defining the things to be
done to add value; strategic vision indicating the strategic direction of
the government, where it goes; and system focused activities
determining the dissemination of information through website is
activated.
• Stage 3 – The Plan: Government has a strategic plan for integrating
the plans and actions. Automation in citizen-centered activities is
started. e-Government infrastructure is completed; however, the
government should have a clear understanding of where it wants to go
not to have a planning gap.
• Stage 4 – e-Government Integration: IT implementations are
coordinated with strategies. Services are integrated and web enabled
services are offered. There is cooperation and collaboration between
the departments. Activities are scheduled; feedback mechanism for
citizen is working.
• Stage 5 – Transformation: All the e-Government systems and
processes are transformed and searching for innovative activities.
Government is responsive to change.

20
• Stage 6 – Beyond eGovernment: Everything occurs in terms of “e”.
Online services are routinely used where most of the services are
served online.
2.2.3 Australian e-Government Maturity Model
For Australian e-Government Maturity Model [23, 69], during the
development of maturity model, transaction processing, degree of
fulfillment of online activities, integration and collaboration of processes,
citizen-centricity and government delivery architecture in the view-point of
citizen is considered. DMR Consulting developed the model to be applied
by Australian Government. The model illustrates that the delivery of quality
e-business services is possible with organizational learning. The model is
developed based on Gartner Group has four stages for e-Government
maturity:
• Stage 1 – Presence: The government information is posted on the
website. The information given is static. Technology infrastructure is
developed.
• Stage 2 – Interaction: In the website, basic search capabilities and
downloadable forms and documents are available. Links are given to
other websites. The communication between the government and
citizen is provided by e-mail.
• Stage 3 – Transaction: Cross-agency services are started to be
developed. Technology infrastructure is re-modeled. Citizens are
engaged in transitive actions. Privacy and security is ensured.
• Stage 4 – Transformation: The processes are fully automated and
online. Government is focused to citizen. Integration and collaboration
between the agencies are available. Single-point of contact for citizens
is designed for transparency of government. The transactions are
authenticated.

21
In the maturity model, there is development from traditional commerce to
e-commerce through e-business. Between the stages, gaps occur. From
transiting stage 1 to 2, security issues should be solved for doing the
business online. From stage 2 to 3, since transaction in the processes are
required, the business and technology skills should be reoriented. Through
the final stage, value added services by citizen-centric processes to
develop a framework due to life events and natural systems are required,
so the developments in that stage should be planned accordingly.
2.2.4 LEMM e-Government Maturity Model
Levels of e-Government Maturity Model (LEMM) is developed by
Planmatics Inc [74], to provide a framework for the development and
improvement of e-Government processes. Planmatics, Inc defines e-
Government as fully integrated, secure, paper-free, and accessible
whenever a demand occurs. The main components of e-Government are
strategy, enterprise architecture, security and IT asset management and
capital planning of government. The internal processes (operations) and
outcomes of the services are taken in the development of the model.
LEMM has five levels:
• Level 1: The government has static information access through the
website 24/7.
• Level 2: Government-citizen interaction is focused. Data
standardization and exchange format is defined.
• Level 3: Web enabled government transactions are conducted 24/7.
• Level 4: Business processes and workflow is mapped to define the
business strategies. The web enabled transactions are integrated with
business processes.

22
• Level 5: Current processes are transformed depending on the
changing environment and innovative web enabled services are
created.
2.2.5 Utah e-Government Maturity Model
The model developed for State of Utah government is composed of four
levels [94].
• Level 1 – Simple Website: It is the government static website having
some information about the departments and some phone numbers,
some downloadable forms and documents. It is the starting point of
interaction between the government and citizens.
• Level 2 – Online Government: The level is focused on department and
to its business. Transactional services are started to operate on the
website; online payments and applications are possible. Although the
communication is limited, e-mail and frequently asked questions (FAQ)
are for help and feedback to citizen.
• Level 3 – Integrated Government: The focus is on the integration of
multiple processes. End-to-end transaction which is the integration of
back office systems and processes is started to develop. Web-based
training for the employee is available. Information is shared between
the departments.
• Level 4 – Transformed Government: Goal of Level 4 is the
personalization of the processes to satisfy the needs of the citizen. A
common platform is formed for the integrated and collaborated
government processes to reach the content from any point.

23
2.2.6 “eGoss” Initiative e-Government Maturity Model
According to eGoss Initiative [56, 93], e-Government maturity has three
stages:
• First Generation: Informative for the available services, static website of
government occurs. Portal and kiosk development is started for public
access to government issues, and intranet functions to support the call
center operations. There is a change in processes such that e-
signature studies are initiated.
• Second Generation: Services are integrated, new demands and
opportunities are created which cause significant changes at
organizational level.
• Third Generation: All stakeholders participate in the development of
processes so new relationships are developed between public and
private organizations.
2.2.7 e-Government Maturity Model for the British Columbia (BC) Government
British Columbia e-Government transformation vision is the engagement of
government and citizens, and receive services needed at any time, in the
way chosen. For the development of the model proposed for BC
Government [86], e-Government maturity model developed by United
Kingdom, Accenture and Gartner are taken as base. e-BC e-Government
Maturity Model determines five levels:
• Level 1 – Independent Websites: The website has static, informative
pages without common look and feel within the pages. Navigation to
other sites is not possible since no links are given. The vision, plans,
measurements are not clear so the coordination of the services is not
possible. The stakeholders are not defined.

24
• Level 2 – Simple, Common Websites: The vision, plans, measurements
are became clear. Necessary resources are made available for some
services, coordination of some of the services are started but not
completed. Studies for defining the stakeholders are accelerated;
however, there are still barriers for the communication.
• Level 3 – Online Government: Coordination in the plans,
measurements, and stakeholder definition is completed. Most of the
services have necessary resources. e-Services are measured and
monitored in terms of quality and performance.
• Level 4 – Integrated Government: Partnerships are used for delivery of
services. Services are coordinated and collaborated.
• Level 5 – Transformed Government: Partnerships are an integral
component in service delivery. Services and processes are
continuously reviewed and changes are managed.
2.2.8 Gartner Group’s four Stages of e-Government
Gartner has defines four stages for e-Government maturity [28]:
• Stage 1 – Web Presence: Information is offered within the website.
Content creation and identification of roles and responsibilities have
been started.
• Stage 2 – Interactions: There is an interaction with the public to
exchange information by the help of search engines. Simple data
collection techniques are set up, and form and document transmission
is possible on the website. Record and content management has been
started.
• Stage 3 – Online Transactions: Online transactions are ready for public
services. Technical infrastructure for licenses and reservations are
built. Systems are integrated with each other. Security and privacy

25
issues, backup and recovery activities are taken into consideration.
Self-service activities are started. Business Process Reengineering
activities are performed for the control in processes.
• Stage 4 – Transformation of Government: Services are integrated and
data is shared. Infrastructure for the use of wireless technologies, video
conferencing is completed. Citizens’ have personalized portal
according to their needs and preferences.
2.2.9 UN Approach
For the measurement of e-Government activities, five levels have been
identified [89]:
• Level 1 – Emerging Web Presence: Offer static information to citizens
such as laws and rules, guidelines, organizations. There is no
communication between the government and citizen.
• Level 2 - Enhanced Web Presence: The content of the website
becomes dynamic since the number of web pages increase. There is
only one way communication, from government to citizen. Citizen can
send e-mail for requests; however, no response may come from
government.
• Level 3- Interactive Web Presence: Information exchange between the
government and citizen by downloading the forms and submitting the
applications online. Two-way communication between the government
and citizen occurs.
• Level 4 - Transactional Web Presence: Citizens needs and preferences
are determined and the services are served according to prioritization.
Transitive applications are conducted such as paying taxes and
registration fees. The government processes are changed, it is more
than automation; this is transaction.

26
• Level 5 – Fully Integrated Web Presence: All the online government
services are integrated with one-stop-shop, portal.
2.2.10 OECD e-Government Task Force Model
OECD e-Government Task Force Model [69] is developed based on
Australian e-Government Maturity Model. The model is used to assess the
countries and defines three levels:
• Level 1 – Access to Information: Activity reports, contact addresses,
office hours, policy targets are given in the website. The website is
regularly updated, citizens use search engine facilities.
• Level 2 – Consultation: Two-way communication between the
government and citizen is provided by e-mail. Citizen feedbacks are
collected. Web based polls and surveys are applied.
• Level 3 – Active Participation: Discussion forums are took place. e-
Document transactions are possible. Citizens use online referendums
and participate in the development of policy options.
2.3. Maturity Models and Process Improvement Approaches
Below, different models for determining the maturity of a software
organization and quality improvement models will be discussed briefly.
These models are used as a guideline for the development of e-CMM
model. In the maturity and improvement models, steps to be taken for
maturity or improvement, measurement, and plans and activities are
outlined. Some process models, CMM, CMMI, P-CMM and COBIT models
are introduced. In the process model, there are sequenced tasks and
activities to be performed specified by the actors and roles. Maturity level
of an organization indicates the organization capabilities for that level.
Satisfaction level, and strengths and weaknesses of that KPA is

27
determined. As a reference model, SPICE will be discussed used for
software process assessment and process improvement planning. ISO
9000 standard and PDCA cycle are used for continuous improvement of
the processes.
2.3.1 Plan-Do-Act-Check Cycle (PDCA)
PDCA cycle is a repetitive, continuous improvement cycle, also called as
Deming Cycle [32]. The steps of the cycle are:
• Develop a plan to improve: before a problem occurs. Processes are
documented, opportunities for improvement and the scope of the
improvement effort is involved in the plan. Measurable goals are set,
potential causes of the problem are identified with the help of the data
collected and analyzed.
• Do the plan: Plan is implemented for improvement on a small scale for
a time period similar to the development and test of a prototype.
• Check the results: after the implementation of the plan by collection
and analyzing the data relevant to solution.
• Act whenever an adjustment is necessary based on the previous
learning. In case of not achieving desired goals, PDCA cycle is
repeated until completely eliminating the problem. In that situation
systematic changes may be necessary. The solution is adopted and
monitored for improvement.
2.3.2 ISO/IEC TR 15504 – SPICE
ISO/IEC TR 15504 [46] is an international standard for software process
assessment. SPICE framework helps the organization to understand its
key processes and capabilities. The current situation of the process is
determined and strengths, weakness and risks are identified. As a result of

28
this analysis, the affectivity in achieving the goal is evaluated either for
process improvement within an organization or determining the process
capability of the organizational unit. Process capabilities are evaluated on
a continuous scale and objectively by comparing and repeating rather than
pass or fail characteristics. The structure of the organization, management
style, software life cycle models applied, software technologies or
development methodologies are not important for assessment.
Process improvement approach has improvement principles as indicated
in Figure 2.6 [62]. The steps are defined as follows:
1. Examine the organization’s needs and business goals: Process
improvement goals of the organization are set and linked with business
objectives and goals.
2. Initiate process improvement: Process improvement is taken as a
project and based on written plans. Project management steps are applied
(determine phases, milestones, risks, budget etc.).
3. Prepare for and conduct a process assessment: Process improvement
opportunities and road map are identified.
4. Analyze assessment output and derive an action plan: Detailed process
improvement plans are prepared to satisfy the strategic objectives.
5. Implement improvements: New processes are developed.
6. Confirm improvements: Process improvements applied are monitored
and measured and corrective actions are planned if necessary.
7. Sustain improvement gains: Turning back to previous state is inhibited.
8. Monitor performance: The process improvement activities are redirected
with the change in business goals.

29
A set of practices are included in the process model. What has to be done
is described instead of how. In SPICE model, the maturity of each process
is determined by assessment; where as, in CMM, the overall maturity of
the organization is evaluated. There are five process categories in the
model: Customer-supplier processes, engineering processes,
management processes, support processes, organization processes. The
model has two dimensions, process dimension and capability dimension.
Capability dimension has six capability levels, from 0 to 5. The measure of
capability is determined by process attributes attained to each level. No
certification is provided as a result of assessment.
To determine the capability level, each process attribute is measured by
an ordinal rating from 0% to 100% satisfaction. The process attribute is
rated as either not achieved, partially achieved, largely achieved, or fully
achieved (Table 2.2).
2.3.3 Capability Maturity Model (CMM)
Since, CMM model is taken as base reference model for e-CMM, it is
discussed in detail in Chapter 3.
2.3.4 Capability Maturity Model Integrated (CMMI)
In CMMI [79], multiple CMM maturity models are integrated into a single
model. Instead of key process areas, there are process areas having goals
and practices. CMMI project has made the CMM compatible with SPICE
and ISO 9000. CMMI aims enterprise wide improvement and emphasizes
on both process capability and organizational maturity. CMMI model
concentrates on systems engineering where total look to system is
emphasized and software engineering.

30
CMMI model is published in two representations as staged version of the
CMM and continuous version of the CMM. For organizational
improvement, one of the versions is chosen depending on the business
needs and experience on previous improvement activities.
CMMI Staged Model is similar to CMM model: the next levels improvement
is satisfied by the previous maturity levels success. Five maturity levels
are defined as initial, managed, defined, quantitatively managed and
optimizing shown in Table 2.3. With staged model, benchmarking with
similar organizations is possible.
Organization’s needs
1. Examine needs
Scope
2. Initiative improvement
Preliminary plan 3. Conduct
assessment
Results4. Plan improvement Action plan
5. Implement improvement
Improvements
6. Confirm movement
Confirmed improvements
7. Sustain gains
Institutionalized gains
8. Monitor performance
Quantified results Reassessment
request
Figure 2.6. SPICE Software Process Improvement Steps (Taken from
Mutafelija, B. & Stromberg, H [62])

31
Table 2.2. The Rating Scale of Processes
Acronym Achievement of the Defined Attribute
N (Not achieved) 0% to 15%
P (Partially achieved) 16% to 50%
L (Largely achieved) 51% to 85%
F (Fully achieved) 86% to 100%
Table 2.3. CMMI Staged Model Maturity Levels
Focus Process Areas
Level 5 Optimizing
Organization innovation and deployment Causal analysis and resolution
Level 4 Quantitatively Managed
Organization process performance Quantitative project management
Level 3 Defined
Requirements development Technical solutions Product integration Verification Validation Organization process focus Organization process definition Organization training Integrated product management Risk management Decision analysis and resolution
Level 2 Managed
Requirements management Project planning Project monitoring and control Supplier agreement management Measurement and analysis Process and product quality assurance Configuration management
Level 1 Initial

32
CMMI Continuous Model focuses to processes that are important for
achieving the business objectives. Model representation of CMMI is similar
to ISO/IEC TR 15504 SPICE model. Instead of maturity levels of CMM and
CMMI Staged Model, capability levels are defined in CMMI Continuous
Model. The processes’ capability level is determined. The process areas
for each of four process category are given in Table 2.5. Comparison
between the organizations is possible, as well as comparison between
process areas.
Table 2.4. CMMI Continuous Model Process Categories
Process Category Process Areas
Process management processes
Organization process focus Organization process definition Organization training Organization process performance Organization innovation and deployment
Project management processes
Project planning Project monitoring and control Supplier agreement management Integrated project management Risk management Quantitative project management
Engineering processes
Requirements development Requirements management Technical solution Product integration Verification Validation
Support processes
Configuration management Process and product quality assurance Measurement and analysis Decision analysis and resolution Causal analysis and resolution

33
2.3.5 People Capability Maturity Model (P-CMM)
P-CMM [20] is CMM based model focused on continuous improvement of
management and development of the human assets of a software or
information systems organizations. In P-CMM, development in knowledge,
skills and motivation of individuals in the organization is described in an
evolutionary path; from ad-hoc, inconsistent activities to mature,
disciplined and continuously improving workforce.
Structure of P-CMM is similar to CMM. In P-CMM five maturity levels are
defined with key process areas as shown in Table 2.5. Key process areas
are defined by common features including commitment to perform, ability
to perform, activities performed, measurement and analysis, and verifying
implementation. Each maturity level results to continuous improvement
and increase in the workforce capability of the organization.
Table 2.5. P-CMM Maturity Levels
Focus Key Process Areas
Level 5 Optimizing Continuous workforce innovation Coaching Personal competency development
Level 4 Managed
Organizational performance alignment Organizational competency management Team-based practices Team building Mentoring
Level 3 Defined
Participatory culture Competency-based practices Career development Competency development Workforce planning Knowledge and skills analysis
Level 2 Repeatable
Compensation Training Performance management Staffing Communication Work environment
Level 1 Initial

34
2.3.6 ISO 9000
ISO 9000 [45] is the most widely used quality management standard for
goods and services. Instead of specifications, there are requirements
related with quality and manager’s involvement. Prevention is emphasized.
ISO 9000 is composed of three standards:
• ISO 9000:2000 Quality Management Systems – Fundamentals and
Vocabulary.
• ISO 9001:2000 Quality Management Systems – Requirements:
Contains generic requirements that are compatible to any industry or
sector such as manufacturing, software and service organizations.
Organizations are certified to ISO 9001:2000 only.
• ISO 9004:2000 Quality Management Systems – Guidelines for
Performance Improvements: Indicates how an organization’s
performance can be further and continually improved.
2.3.7 COBIT
COBIT [16] stands for Control Objectives for Information and related
Technology. It is a set of guidance material for IT Governance, in other
words, provides internal control over the information and the systems that
are managed. COBIT tries to communicate IT functions, the business and
auditors. COBIT is fully complies with ISO 17799, which is a set of security
controls.
IT Governance integrates IT processes, resources and information to
enterprise strategies and objectives adding best practices. COBIT
framework identifies 34 IT processes in four areas (Table 2.6). For each
processes five-scale grade from 0 to 5 (non-existent to optimized) is
determined to measure the maturity level for strategic choice and

35
benchmarking. Each process is discussed by critical success factors
(CSF) defining the most important actions or issues to achieve control over
and within its IT processes; key goal indicator (KGI) defining measures for
monitoring the achievement to IT process goals; and key performance
indicators (KPI) defining measures to determine the performance of IT
processes.
Table 2.6. COBIT Areas and Processes
Areas Processes Planning and organization PO1 Define a strategic IT plan
PO2 Define the information architecture PO3 Determine technological direction PO4 Define the IT organization and relationships PO5 Manage the IT investment PO6 Communicate management aims and direction PO7 Manage human resources PO8 Ensure compliance with external requirements PO9 Assess risks PO10 Manage projects PO11 Manage quality
Acquisition and implementation AI1 Identify automated solutions AI2 Acquire and maintain application software AI3 Acquire and maintain technology infrastructure AI4 Develop and maintain procedures AI5 Install and accredit systems AI6 Manage changes
Delivery and support DS1 Define and manage service levels DS2 Manage third-party services DS3 Manage performance and capacity DS4 Ensure continuous service DS5 Ensure systems security DS6 Identify and allocate costs DS7 Educate and train users DS8 Assist and advise customers DS9 Manage the configuration DS10 Manage problems and incidents DS11 Manage data DS12 Manage facilities DS13 Manage operations
Monitoring M1 Monitor the processes M2 Assess internal control adequacy M3 Obtain independent assurance M4 Provide for independent audit

36
2.4. Information Systems Research Methodologies
Qualitative and quantitative research approaches are two of main
categories among the other research approaches. For the development of
e-CMM model from the survey results, these two methodologies are used.
2.4.1 Qualitative Research
Qualitative data obtained from such as interviews, documents and
observations are used for qualitative research. Qualitative research
includes case studies and action researches. Myers [63] states that
qualitative research methods are designed to help researchers understand
people and the social and cultural contexts within which they live. Kaplan
and Maxwell (as cited in [63]) argue that in case of the quantified data, the
participant’s view representing the social and institutional context is mostly
lost. Since the qualitative data obtains the snapshot data, the main point in
qualitative research is that the situation that is to be examined will need to
have happened or to happen during the action of noticing. Myers [63] says
that qualitative research can be positivist, interpretive, or critical. These
three philosophical perspectives are described in Table 2.7.
Four qualitative research methods used in information systems: action
research, case study research, ethnography and grounded theory. These
research methods are described in Table 2.8.
Action research, also called development project, is used for the
development of the problem by the help of quality improvement actions.
Perrin and Powell [71] states that by asking useful and necessary
questions, action research is helpful in the design and refinement of new
approaches, testing new ways of doing work, identifying weaknesses,
increase in performance, helps to do the works more systematically. At the

37
end, action occurs depending on the lessons learned. Maynard and Smith
[58] says that the cyclic event continuing till the end of the life of the
project, brings sustainable and continues changes causing improvement in
the practice. The quality cycle is shown in Figure 2.7.
Table 2.7.Qualitative Research Philosophical Perspectives
Philosophical Perspective Description
Positivist
The researcher gives the reality objectively and
quantifiable measures of variables. According to
Orlikowski and Baroudi [59] a positivist IS research has
hypothesis testing and the drawing of inferences about a
phenomenon from the sample to a stated population.
Interpretive People assign meanings to occurrences.
Critical
According to Comstock [18], in critical perspective, the
constraints in the current actions and shape of the
understanding are developed historically.
Organizations are complex systems. Some parts of them cannot be
broken into measurable variables although it is indicated that unless it can
be measured, it cannot be improved. In e-transformation, continues
improvement which prohibits stability but allows change, is the focal point.
As a result of these, action research was chosen as research strategy in
this thesis.
2.4.2 Quantitative Research
In qualitative research, understanding the social phenomena is the
research purpose; where as in quantitative research, causes and the
relationships between the actions are the main points. Quantitative
research includes surveys, laboratory experiments, simulation, and
process and mathematical models.

38
Table 2.8. Qualitative Research Methods
Research Method Description
Action research
In a cyclical process, a link between the theory and practice is
created and by using data feedback, changes in the processes
occur for practical problem solving and expanding the scientific
knowledge.
Case study research If the context boundary is not clear, case study research helps
to investigate phenomenon in real-life context.
Ethnography Ethnographic research deals with social and cultural
occurrences.
Grounded theory
Grounded theory is an ethnographic approach where the
knowledge is taken out from the grounded data, meaning the
theory is generated from observations. The explanation,
properties and the relationship between the categories as a
consequence of the theory.
Action ResearchQuality Cycle
Selectspecific area/focus
Agree a time frame
Appointsteering group and team
Diagnose problemwithin context
Set targets for improvement–quantitativeand qualitative
Agree strategiesfor improvement
Implement strategiesConductformativeevaluation
Adjust strategiesas the need arises
Monitorprogress
towards targets
Evaluateoutcomes and targets
achieved
Decide next steps
Figure 2.7. Action Research Quality Cycle (Taken from Maynard, J. & Smith, V.
[58])

39
3. CHAPTER 3 ….
CMM: CAPABILITY MATURITY MODEL FOR SOFTWARE PROCESSES
The ideas and concepts of maturity are affected from Walter Shewart,
Philip Crosby, W. Edwards Deming and Joseph Juran. The quality
practices are defined in five steps in Crosby’s [19] quality management
maturity model. Until 1980’s, the intended point in quality and efficiency
could not be reached, costs were increasing and the projects were being
late. After detecting the main problem in software as the software
development process, Crosby’s ideas are developed by Humphrey [43] for
software organizations and used in the first studies of Software
Engineering Institute (SEI) in Carnegie Mellon University. This study
helped primarily to the development of a questionnaire based maturity
model, Process Maturity Model, and then Capability Maturity Model (CMM)
[41, 42, 68]. CMM is firstly developed by US Defense Ministry to evaluate
the performance of software producer. Fundamentally; CMM can be
summarized as an application of total quality management, and process
and management concepts to software area. The model defined by Paulk,
Weber, Garcia, Chrissis and Bush [70] explains the necessary process
areas needed for organizations in reaching to a maturity level in process
improvement.
Goal of CMM is to determine and improve the maturity of work processes
for software development organizations. Persse [72] defines the word

40
“maturity” as it is used for an environment where “this time, how much it
will be done better” asked less, in other words, low in estimation and risk.
As a result, increase in maturity levels indicates a decrease in uncertainty.
Each maturity level has an insight of sustainable and continuous process
improvement. In CMM, the process maturity is defined in five levels
(Figure 3.1) and the necessary processes are characterized for an
organization to institutionalize in every step of maturity level as can be
seen in Table 3.1. In stepping from a level to another, cross from a level
which is immature, has randomly and improperly specified processes and
has not developed standardized methods for software development to
mature, having written procedures, monitored and measured quality with
defined criteria, and continuously improved level. According to SEI, 73% of
information technology organizations are in Level 1. The first step to CMM
philosophy is noticed in Level 2 where the structure and processes of
software project is defined effectively. In Level 3, these structure and
processes creates an institutionalized form in the organization.
Performance measurement is done at Level 4. At the last and the most
mature level, at Level 5, reach to the entire maturity where continuous
process improvement mentality is diffused to organization culture. The
organization’s practices, politics and discipline necessitate the production
of software in estimated, trustable and repeatable manner. In the world,
nearly 120 organizations (100 of them are in India) are at Level 5 [47, 64].
Bamberger [11] explains the leveling of CMM as the organization
determines the levels by asking where the organization is, where it wants
to be and how it can know it came there and indicates the steps to follow
to go up to the next level. Figure 3.2 shows that each level forms from key
process areas (KPA) directed to specific goals. The consequence of the
activities indicates whether that key practice has been reached to the
goals set or not. In CMM model, 18 KPAs are defined for improvement. In

41
Table 3.2 KPAs are listed for each maturity level. The strength of any KPA
during the implementation requires sound infrastructure to support the
continuing performance of the activities such as organization policies,
training, resources, tools and measurement.
INITIAL (Level 1)
REPEATABLE (Level 2)
DEFINED (Level 3)
MANAGED (Level 4)
OPTIMIZED (Level 5)Continiously Improving Process
Predictable Process
Standard, Consistent Process
Diciplined Process
Figure 3.1. CMM Process Maturity Levels
Each KPA which is defined by common features using the same pattern, is
collected in five categories can be seen in Figure 3.3. Common features
indicate the effectiveness, repeatability and long lasting structure of the
key process area. Before the activities performed, commitment to perform
and ability to perform should be satisfied. Measurements and analysis and
verifying implementation approves the implementation of the activities.

42
Table 3.1. CMM Maturity Levels Description
Maturity Levels Description
1. Initial Software processes are ad-hoc and complex. Only a part of the processes are defined. Success depends on personal effort.
2. Repeatable
To follow the cost, timing and functionality, fundamental project management processes are defined. New projects are done similar done previous projects to achieve to success.
3. Defined
The software processes in the organization are documented, standardized and integrated with standard software processes in terms of both management and engineering.
4. Managed Software processes and product quality measurements are done in detail. There is production dependent to measurement.
5. Optimized Continuous process improvement is obtained with the help of processes and innovative ideas and technologies.
indicate
achieve
address
describe
contain
organized by
contain
Maturity Levels
Key Process Areas
CommonFeatures
Key Practices
Process Capability
Goals
Implementation or Institutionalization
Infrastructure or Activities
Figure 3.2. CMM Architecture

43
Table 3.2. CMM Key Process Areas
Maturity Levels Key Process Areas
Level 5 - Optimized Defect prevention Technology change management Process change management
Level 4 - Managed Quantitative process management Software quality management
Level 3 - Defined
Peer reviews Software product engineering Integrated software management Intergroup coordination Training program Organization process definition Organization process focus
Level 2 - Repeatable
Software quality assurance Configuration management Subcontractor management Project tracking Project planning Requirements management
Level 1 - Initial
Common Features
Commitment to Perform
Ability to Perform
Activities Performed
Implementation
Measurement and Analysis
Verifying Implementation
Institutionalization
Figure 3.3 CMM Common Properties
Common features are responsible for the implementation and
institutionalization of the KPA and define commitment, ability, activity,

44
measurement and analysis, and verification for the implementation. The
implementation is performing the activities defined for that KPA, where as
institutionalization of KPA is possible via policies, definition, and
documentation of process, training, resources, verification and
measurement [72]. The five common features are described below:
• Commitment to Perform describes the way to make sure that the
activities will take place with the support of organizational policies and
top level management sponsorship.
• Ability to Perform describes prerequisite conditions for the
implementation of organizational processes including training,
resources and organizational structures.
• Activities Performed describes what should be done for the
implementation of a key process area.
• Measurement and Analysis describes the measures for monitoring the
business processes.
• Verifying Implementation describes the steps that the activities are
performed undoubtedly.
5 levels of CMM contain totally 18 KPA, 52 goals. Each goal defines the
content, limit and aim of its KPA. To reach the maturity of a level, all KPAs
of that level and below levels should be satisfied. The maturity level of a
software organization is measured in Likert scale (lowest 1, highest 5),
however, there is no definition as “maturity level is 2,5”.
Mutafelija and Stromberg [62] suggests that according to the report
published in January 2003 by Gartner Inc., CMM is not a foreseeing but a
defining standard; in other words, the model should be taken as a tool
saying how to do instead of what to do. CMM is not a theoretical model; it
is displayed after the existing performance as a result of satisfactory
software development applications and shows “best practice”. Model

45
provides a guidance to meet the needs of the organization. It accepts that
it holds the software organization together by combining the procedure
and methods defining the man (trained, talent and motivated), material and
equipment, and duties of the process. As Heston [37] indicated that as the
level increases, the difference between the obtained and intended lessens,
cost decreases, development time shortens, and quality and productivity
increases. From the study of Herbsleb, Carleton, Rozum, Siegel and
Zubrow [36], it is stated that the most successful software organizations
are the ones who at least complete the stated key processes.
Heston’s [37] working on a case study on process improvement done by
SEI on 13 organizations shows that, as a result of CMM application, 6%-
25% improvement in noticing the defaults in advance; 9%-67% increase in
productivity; 15%-23% decrease in due date; 10%-94% decrease in after
production defaults and 400%-880% yield of improvement program is
obtained.

46
4. CHAPTER 4
e-CMM: e-ORGANIZATION MATURITY As e-Government applications accelerate, the necessity to transform the
organizational activities effectively gains importance. The speed of the
development in technology is so fast that only the ones who can adapt
themselves to change can survive. However, in that environment, “how to
change” is not clear. In many organizations, only by purchasing some
hardware and software, even without knowing how to use and adopt them
to processes, individuals think that they change the way of doing business
although the only change is in the screen written or calculated things
instead of hand done.
It is hard to talk about transformation for the organizations having
beautifully constructed network, purchased fashionable high speed ram
computers and packages without knowing whether they need all of these
items or not. These will be only short term investments since fashion
changes also. Success lies behind the collaboration and integration for
long-term productivity and continuous quality improvement through out an
organization. The transformation should be supported with infrastructure
beside of the well-defined and understood business processes.
This chapter is organized for the explanation of e-CMM model developed
based on CMM. The definition of maturity, maturity of each level, key
process areas and common features of e-CMM model is detailed.

47
4.1. Introducing the e-CMM
Highly mature organizations complete the duties on time, within budget,
with high quality and reliability. On the other hand, in immature
organizations, assessment for the quality of the product is missing. For the
organizations to have improvement in the performance, focus should be
on the interrelated items: people, process and technology (Figure 4.1) [68].
People Process
Technology
Figure 4.1. Improvement Focus Triangle (Taken from O’Regan, G. [68])
e-CMM model depends on the structure of the Capability Maturity Model
(CMM) [66] as the fundamental model. The CMM is a model that tries to
mature software organizations following a logical path for continuously
improving the processes and practices in a cost-effective way. The CMM
is a maturity model only for software processes and practices. The e-CMM
is a maturity framework for that describes the key elements of an effective
e-transforming organization with a continuous improvement in the
management, development and application of an information systems
organization emphasizing the people, process and technology all together.
The strategic objectives of e-CMM are to:
• improve the capability of e-organization by increasing the capability of
processes and activities,

48
• endure that the whole organization acts in the transformation process,
and
• develop integration and collaboration of the processes within the
organization and between the entities of the business environment.
The e-CMM describes an evolutionary improvement path from immature,
ad hoc, reactionary practices to mature, disciplined and continuously
improving processes. The e-CMM model helps organizations to
• characterize the maturity of the organizations main internal and
external processes,
• guide a program for continuous development,
• set priorities for immediate actions, and
• establish a culture of adaptation to change.
The e-CMM is designed to guide organizations for the movement through
paperless office where paper is absent since all the information is stored
and transferred electronically. In the e-CMM model, there are practices for
planning, engineering and managing the organizational development and
improvement to achieve objectives. Maturity of the organizations is
satisfied by determining the current maturity level and adding the
improvement actions on the next layer to the top of the current state.
Reflecting the best of the state of the practices, the e-CMM model will be a
path to improvement. For e-Transforming organizations, in case of
implementation of e-CMM model, achievement of some benefits are
expected such as:
• increase in capability and maturity of organization,
• increase in capability with partners and internal and external
customers,

49
• well-defined and improved business processes,
• measurement of processes and products,
• innovative processes and technologies for better performance,
• change in the culture for improvement.
4.2. Structure of the e-CMM
In e-CMM model, CMM reference model is used for maturity level
formation. The e-CMM is composed of five maturity levels for the
improvement of e-transformation practices. Level 1 is accepted as the
initial point of being an organization; no practices are indicated at that
level. As the organization obtain some gains in the practices, and then its
maturity level evolves. The levels are explained in section 4.3 in detail.
Each maturity area starting from Level 2 is composed of several key
process areas. To justify the distribution of KPAs to different maturity
levels, several activities are taken into consideration:
• Moving from immature to mature processes is considered. For an
organization doing everything at one time is not possible. The activities
should be done are ranked from simple to complex.
• The literature survey done to analyze the e-Government models and
maturity and process improvement models, the ones indicated at
Chapter 2, is taken into consideration. The e-Government models are
compared with each other, which is discussed in Chapter 6 for the
formation and distribution of KPAs.
• A questionnaire is developed with three sections. At the last section of
the questionnaire, interviewees are asked to determine areas for five
maturity levels for the transformation of an organization according to
their thinking. The survey findings are given in Chapter 5.

50
Key process areas describing the practices are organized by common
features composed in five sections: commitment to perform, ability to
perform, activities performed, measurement and analysis, and verifying
implementation. Common features indicate the effectiveness, repeatability
and long lasting structure of a key process area. Five sections of common
practices are applied collectively to reach the goal(s) of that key process
area.
The components of e-CMM include:
Maturity Levels
Process Capability
Key Process Areas
Goals
Common Features
Key Practices
The usage and definitions of those components are the same as the ones
in CMM which is explained in Chapter 3 of this thesis.
The KPAs of e-CMM for each maturity level is listed in section 4.4. The
common features for each KPA is detailed in Appendix C.
4.3. Definition of the e-CMM Maturity Levels
As a capability maturity model, the e-CMM guides organizations to
establish and improve processes through five levels of maturity. Movement
from each maturity level to the following level help the institutionalization of
the organization causing to be more developed and organized.
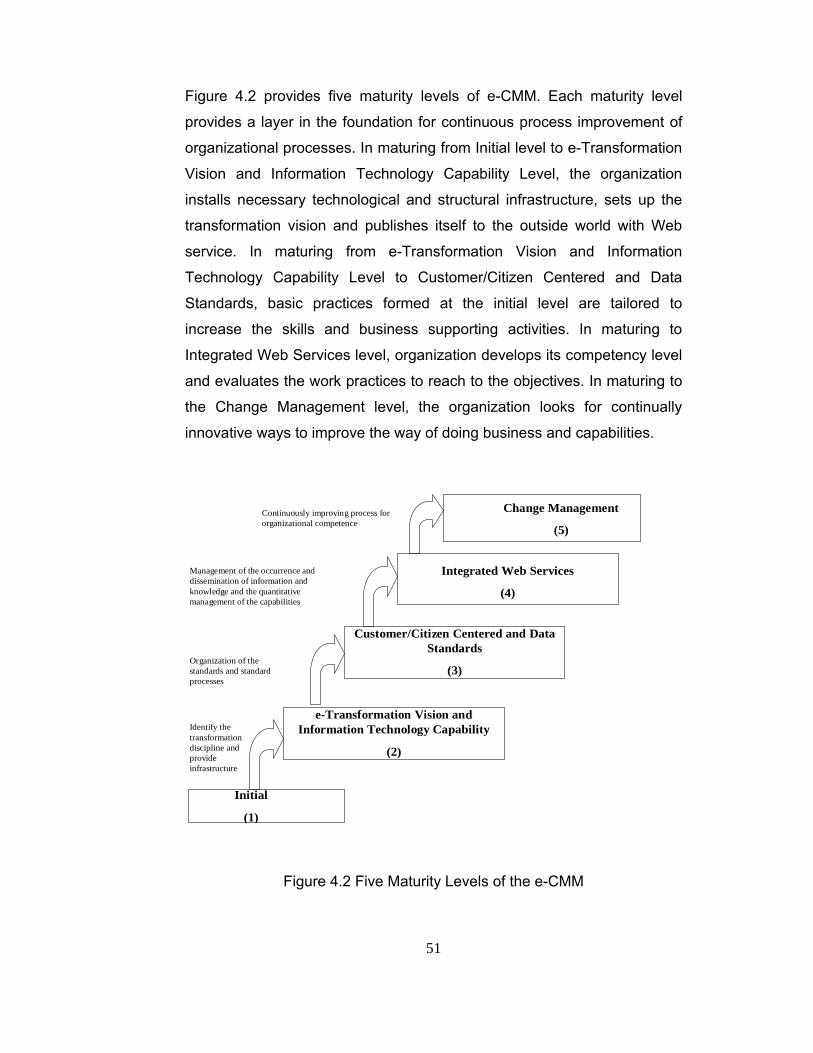
51
Figure 4.2 provides five maturity levels of e-CMM. Each maturity level
provides a layer in the foundation for continuous process improvement of
organizational processes. In maturing from Initial level to e-Transformation
Vision and Information Technology Capability Level, the organization
installs necessary technological and structural infrastructure, sets up the
transformation vision and publishes itself to the outside world with Web
service. In maturing from e-Transformation Vision and Information
Technology Capability Level to Customer/Citizen Centered and Data
Standards, basic practices formed at the initial level are tailored to
increase the skills and business supporting activities. In maturing to
Integrated Web Services level, organization develops its competency level
and evaluates the work practices to reach to the objectives. In maturing to
the Change Management level, the organization looks for continually
innovative ways to improve the way of doing business and capabilities.
Initial
(1)
e-Transformation Vision and Information Technology Capability
(2)
Customer/Citizen Centered and Data Standards
(3)
Integrated Web Services
(4)
Change Management
(5)Continuously improving process for organizational competence
Management of the occurrence and dissemination of information and knowledge and the quantitative management of the capabilities
Organization of the standards and standard processes
Identify the transformation discipline and provide infrastructure
Figure 4.2 Five Maturity Levels of the e-CMM

52
4.3.1 Level 1 – The Initial Level
At the Initial level, the performance of the organization is inconsistent,
does not have defined processes. There is no or little planning. The flow of
processes is reaction-driven, in case of a problem; it tends to change
informally most of the time depending on the experience of the individuals.
Success of the organization depends on the capabilities and heretic
individuals. The management and the individuals do not require training,
the business flows with the people skills or past experiences.
Individual contribution to the work done is at the minimum level since the
owner of the success is the manager. Turnover rate among the individuals
is high since individuals do not feel themselves belong to the organization.
Works are done to save the day. There is no or little documentation of the
processes or written policies. Knowledge production is limited due the high
turn over rate and documentation.
As technological infrastructure, organization has a computer or a few
number of computers for the individuals to use basic spreadsheet
applications and a printer to take a copy of everything written on the
computer. Data collection and analysis is either absent or at minimum
level.
The process capability of the organization in Level 1 is ad hoc,
unpredictable, it does not have ability to develop competitive capability
since the business processes are not defined and are changing constantly.
There is no control mechanism and improvement in the processes or
products since no measurements are done. There is no coordination in the
organization among the individuals or the way of doing business. Being
late on the scheduling, excess in budget are probable outcomes of the
work done.

53
4.3.2 Level 2 – e-Transformation Vision and Information Technology Capability
At Level 2, the problems affecting the individuals’ performance such as
environmental distractions, unclear performance objectives, lack of
relevant knowledge or skill and poor communication [20] is tried to be
eliminated. A transformation vision is set in the organization. A written
policy reflecting the clarity, understandability of the values, the culture and
the roles and responsibilities of the organization are formed by top
managers. Milestones and metrics are defined for the development and
improvement.
Repeatable capability of work flow is satisfied with the effort of
implementing improved practices. However, the institutionalization is not
completed so the management of the practices is done based on the
experience of similar situations occurred in the past. Basic concepts of
project planning are identified. For each project, data planning and
management is done. Results of the previous activities are observed and
the planning of the current situations is done accordingly.
The technological infrastructure is maintained and supported. By using
decision analysis techniques, decision making is fasten. The information
within the organization is updated. The importance of information sharing
is identified and started at the basic level.
The organization has a static web-site providing one-way communication,
gives only information about the organization. There may be some links
not working properly, update of the information is done but the revision
number and the date may not be indicated.
Since the processes are defined but not standardized yet, there may be
inconsistencies between the units in performing the practices.

54
4.3.3 Level 3 – Customer/Citizen Centered and Data Standards
The importance of the common knowledge and skills is become clear in
Level 3. The operations in the organization and the other organizations’
are tracked to determine the best practices. Best practices are taken and
tailored if necessary and used for the standardization of the processes.
Standard processes within the organization, between the units are applied.
That standardized processes establishes a foundation for continuous
improvement since it can be managed. Integration of the processes and
knowledge and information sharing is started. The organization identifies
its core competencies and the skills required to perform its business; the
usage of the resources is planned accordingly. Core business functions of
the organization are performed with that basic knowledge and skills.
All projects have teams with a project manager; the success of the project
indicates the success of the team. All kind of data is recorded and
managed in the organization wide. Data is shared with the staff and
partners due to their authorization levels. Security of the work environment
gains importance.
Care to both the internal and external customers is given to satisfy their
needs and expectations. Skill needed for each position is determined and
documented.
4.3.4 Level 4 – Integrated Web Services
The strategic advantages of the organization are identified by examining
the strength and weaknesses of the organization and benchmarking with
other organizations. Well-defined and consistent quantitative goals are set
for growth and alignment to decrease the variation in the processes.
Performance data of the activities held in the organization are collected

55
and the trends are evaluated and predicted for the development of
capability. In case of a deviation, preventive actions are taken into
account.
Individuals and manager are trained themselves depending on their needs
and the time they are available. The knowledge in the organization is
disseminated organization-wide for efficiency and productivity. The
customers are taken account and behaved as a shareholder of the
organization.
4.3.5 Level 5 – Change Management
In Level 5, there is a continuous focus on improving the processes by
innovative ways. Continuous improvement is the main goal that either
successful innovations are adapted to the organization or the existing
processes are improved by incremental developments. Technological
changes are followed and evaluated for the necessary changes in
processes. The business processes are evaluated continuously. In case of
a defect, the cause is determined and necessary precautions are taken
into account. Efficiency data is evaluated to identify the needs of the
organization.
4.4. Key Process Areas of the e-CMM
We have defined 17 key processes in e-CMM model for e-Transforming
organizations. KPA’s are listed below and explained in further sections.
1. Company Web Page 2. Vision and Policy Definition for e-Transformation Project 3. Organization Information Systems 4. Intranet 5. Information Technology Infrastructure

56
6. Data/Information Standards 7. Customer Relationship Management System 8. Inter-Organizational Training Techniques 9. Project Management Concepts 10. Extranet 11. Security Policy 12. Performance Measurement 13. Continuous e-Learning 14. Information/Document Management Systems 15. Portal 16. Process Change Management 17. Technology Change Management
Figure 4.3 shows the key process areas for each of the five maturity levels
in the e-CMM. A set of related activities are identifies for each key process
area so that performance of these activities collectively will result to each
the goals of the activities. To satisfy that goals are important to gain
increase in the process capability. Key process areas are identified to
reside at a single maturity level.
Key process areas are building blocks that when each of the key process
area is satisfied on top of each other, maturity of that level is obtained. Key
process areas should be implemented for the improvement in
organizational process.
The key process areas at Level 2 focus on setting the basic transformation
goals and forming the infrastructure necessary for communication and
decision making. Descriptions of each of the key process area for Level 2
are given below (Refer Appendix C1 for Common Features for Level 2
KPA’s):

57
• The purpose of Organization Web Page is to share and disseminate
information and to provide the continuity of the communication between
the organization and its customers and users. Organization’s web site
involves planning the site, site design, interface design, writing and
publishing the pages, and site management.
Level 5 -Change Management
17. Technology Change Management16. Process Change Management
Level 4 - Integrated Web Services
15. Portal
14. Information/Document Management Systems13. Continuous E-Learning
12. Performance Measurement
Level 3 -Data/Information Standards and Standard Processes
11. Security Policy
10. Extranet9. Project Management Concepts
8. Inter-Organizational Training Techniques7. Customer Relationship Management System6. Data/Information Standards
Level 2 -e-Transformation Vision and Information Technology Capability
5. Information Technology Infrastructure4. Intranet
3. Organization Information Systems2. Vis ion and Policy Definition for E-Transformation Project1. Company Web Page
Level 1 - Initial
Figure 4.3 Key Process Areas of the e-CMM by Maturity Level
• The purpose of Vision and Policy Definition for e-Transformation
Project is to establish an improvement in the core operations of the
organization by adapting the business to changing conditions. With the
help of information technology, business is done more efficiently while

58
obtaining an economic return. e-Transformation strategy involves the
modernization in management, customer-focused service, social
transformation and qualified communication infrastructure. Whole and
balancing approach including the customer, organization and
government are taken into consideration all in once.
• The purpose of Organization Information Systems is to help the
managers take right decision at the right time focusing on internal
efficiency and effectiveness of operations. Organization information
systems involve the integration and standardization of the resources of
the organization.
• The purpose of Intranet is to facilitate the storage and communication
of data, information, knowledge, wisdom and ideas through out an
organization [81]. Intranet usage also facilitates group or team working
and every means of communication. Intranet involves establishing
effective top-down and bottom-up knowledge management and
creation mechanisms within the organization, ensuring that all the
individuals share their information with each other by using
transaction activities properly, conduct education and training activities
efficiently [12, 21, 50, 51].
• The purpose of Information Technology Infrastructure is to establish
systems and processes for directing and managing work. The
organization’s mission, vision, values and critical success factors form
basis to organizational infrastructure. The focus is on arranging the
management and decision making process, having standards to
maximize the data efficiency, information technology infrastructure
including both hardware and software.

59
The key process areas at Level 3 address organizational issues as the
organization identifies its core competencies. Descriptions of 6 key
process areas for Level 3 are given below (Refer Appendix C2 for
Common Features for Level 3 KPA’s):
• The purpose of Data/Information Standards is the organization of
information in a structured fashion for accurate recording, clear
processing and right evaluation of data. Data/Information Standards
involves diversification of entities according to user groups,
classification of data and data quality measurements [93].
• The purpose of Customer Relationship Management System is to
design the organization based on customer-centric capabilities and link
business processes from customers through suppliers by differentiation
of the organization [55]. Analysis of the customer data, profiles, and
history helps to get information about the customer and support in the
organization’s core processes [44].
• The purpose of Inter-Organizational Training Technologies is to ensure
that the individuals get the necessary information, ability and behavior
systematically to continuously perform their duties by training [34].
Inter-organizational training involves the establishment of the training
requirement of the individuals. Short and long term planning of skills,
evaluation of the individual during and at the end of the training, and
publishing the necessary publications and making available the
necessary resources are included in inter-organizational training [87,
88].
• The purpose of Project Management Concepts is to increase the
capabilities of the organization by using project management skills and
knowledge in dealing with planning, schedule, cost, scope, risk, human

60
resources and stakeholders properly [13]. Project management
activities involve the requirements describing the project deliverables or
products the customer expects, determining the general scope of the
project and risk identification.
• The purpose of Extranet is to link the organization’s operations with its
key partners to empower knowledge workers to make better business
decision autonomously by providing speedy and accurate information
access [54].The organizational improvement is satisfied by the help of
the discussion groups established in the extranet and benchmarking
based on the extranet data [26, 33]. Extranet involves establishing a
new system to an existing business process or a relationship. New
levels of service to business partners are developed by differentiating
the core product or process. It ensures that new system and new
levels are completed with all applicable laws and regulations and those
improvements are made that will enhance performance.
• The purpose of Security Policy is to ensure to have a secure
infrastructure that only the individuals who are authorized to use the
resources available in the system [4, 85] and define the things needed
to be protected. Security Policy involves rules and politics in using
hours of the system’ backup rules, easement, authorities and
restrictions, general risk assessment of the types of threats to the
system or site and consequences of these threats [38].
The key process areas at Level 4 focus on establishing a quantitative
understanding of the organizational processes. Descriptions of four key
process areas at this level are highly interdependent, as is described
below (Refer Appendix C3 for Common Features for Level 4 KPA’s):

61
• The purpose of Performance Measurement is to evaluate the
efficiency, effectiveness and results of integrated systems for both the
development and modernization of operations. Being a constantly
learning and improving organization, responsive to internal and
external customers and other businesses is possible by improved and
innovative services. Performance Measurement involves a set of
processes and methods to find the achievement rate to organizational
strategic objectives [61, 95]. The points adding value to the business
processes and work instructions are identified, parameters having
significant effect on process and/or product quality is identified, the
appropriate measures are defined. The corrective and preventive
action is taken into account after measuring the performance of the
products produced and/or processes in case of the deviation or a
probability of deviation from quality [73].
• The purpose of Continuous e-Learning is to get the information
throughout the organization to large numbers of people by using
internet technologies to provide large number of solutions that enhance
knowledge and performance [77]. Continuous e-learning involves
identifying the needs of the individuals are identified through a
centralized unit plans are developed for the creation of e-learning
activities, and improvements in the learned is done by evaluations [12,
57].
• The purpose of Information/Document Management Systems is to
deliver value to organization by disseminating the accurate and
complete information and give support when it is needed to adapt to
the changing environment to be efficient. The available and required
knowledge identified and analyzed with the development of the
knowledge assets by subsequent planning and control of actions [52].
The organization’ s capabilities are collected to create and use

62
knowledge, organize knowledge by adding value to create information,
build infrastructures that enable the effective management and
knowledge and disseminate and sell the value added product or
process to user [36].
• The purpose of Portal is to draw content from various sources and to
let the individual use navigational properties, reach to business
applications, searching, discussion and collaboration [17]. Citizen
services are satisfied by Portal that has personalized, dynamically
changing content, layout and navigation purposes responding to
individual’s personal preferences and mode of access to provide a
collection of information and services by keeping track of individual
preferences including knowledge and decision making purposes [81].
Content is the main source to make individual interested. Layout is
used to make the content visible and attractive by using fonts, color,
headers, and position of the links.
The key process areas at Level 5 address the continuous improvement
implementation of the processes. Descriptions of two key process areas
for Level 5 are given below (Refer Appendix C4 for Common Features for
Level 5 KPA’s):
• The purpose of Process Change Management is to continually improve
the business processes by increasing quality, efficiency and
productivity. Process Change Management is in coordination with the
Technology Change Management in case of incremental development
of current state or an innovative change.
• The purpose of Technology Change Management is to autonomy and
control of the resources that the organization has [25]. Technology
Change Management involves to the definition of centralized policy and

63
procedures, and the management of the consistent operational
disciplines [40]. Centralized policy and procedures are necessary for
the accuracy and reliability of the Technology Change Management
processes within and between the organizations.

64
5. CHAPTER 5
A CASE STUDY: e-CMM SURVEY
The previous chapter highlighted the properties of e-CMM model. In this
chapter, the questionnaire developed and the survey findings will be
discussed.
5.1. Research Methodology
5.1.1 Steps
While developing and justifying e-CMM model, we followed the following
steps:
Step-1: Survey Questionnaire Preparation
Step-2: Interview with selected individuals
Step-3: Representation of findings
The steps are explained below:
Step-1: Survey Questionnaire Preparation
Survey questionnaire were prepared regarding to potential factors
important for e-Transformation of the organization. Those factors given in

65
Appendix G, is identified from the extensive background research in
organizational transformation and e-government studies and the papers
and books [25, 27, 51]. After conducting a through research, selected
factors determined as having potential impact on transforming the
organizations.
The survey questionnaire presented in Appendix B is organized in three
sections:
Section one asked the interviewee to evaluate occurrence of the factors
within the organization. For the purpose of evaluation, 0 and 1 is used
where ‘0’ means ‘does not occur’ and ‘1’ means ‘occurs’.
In section two of the questionnaire, interviewees were asked to give the
numbers about the services given for their customer; number of workers,
computer and servers; number of the organizations having communication
in the electronic media and communication capacity per month.
Section three aimed at identifying the factors necessary for the
organizations to be an e-organization at the eye of interviewees different
from the e-CMM model constructed for that study.
Step-2: Interview with Selected Individuals.
Totally 30 government and private organizations were selected for this
survey. 27 of them are government and non-profit organizations, 3 of them
are private organizations. The names of the organizations are given in
Appendix A.
The organizations are selected by using directed sampling method. In
directed sampling, the individual uses his profession for the selection

66
samples, in other words, the samples in the population do not have equal
chance [66, 67].
A representative sample size should be determined from the general
population. There are various formulas for deciding the sample size. If
there is a difficulty in estimating the percentage or standards deviation of
the attribute of interest, the following formula could be used [76]:
n = NZ2 * 0.25 / [(d2 * (N – 1) + (Z2 * 0.25) (Equation 5.1)
where n = sample size required
N = total population size (known or estimated)
d = precision level
Z = number of standard deviation units of the sampling
distribution corresponding to the desired confidence level.
In that study, government organizations are prioritized for evaluation.
There are 120 government organizations. The necessary sample size is
determined as:
n = [120 * 1.55482 * 0.25] / [(0.122 * (120 – 1)) + (1.55482 * 0.25)] = 31.29
The necessary sample size is taken as 30 organizations at 88%
confidence level (d = 0.12, Z = 1.5548 from the cumulative standard
normal distribution table).
Survey questionnaires were delivered to information systems experts in a
face-to-face manner. Information systems experts were the executives
who are deeply involved in the development and improvement of
information technology and systems in the organizations.

67
Before the questionnaires are evaluated, respondents are given a five
minute presentation about the thesis subject and the aim of doing that
questionnaire. The presentation is aimed at making sure that respondents
are fully understood the subject.
Each interview took about 75 minutes. During the evaluation of the
questionnaires, respondents were encouraged to express their ideas
verbally to obtain real results.
Step-3: Representation of Findings.
The data obtained from interviews are evaluated by using relevant
packages. The factors given priority for organizations in e-Transformation,
the capability level of each KPA, satisfaction of each maturity level are
determined.
5.1.2 Potential Findings
A research is done to form the survey questions from various resources.
The factors are identified are given in Appendix G. By using these factors,
a questionnaire is developed for the assessment given in Appendix B. In
this section, the findings and the questions in the questionnaire is
discussed.
In order to develop an effective e-organization, it is imperative to possess
a sound knowledge of factors affecting organizational transformation.
Palmer and Hardy stated that organizational transformation is “the process
of fundamentally changing an organization’s processes in order to allow it
to better meet new challenges” (cited from [66]). Only after determining
factors effective in change, it would be possible for a model to suggest
proper e-transformation steps.

68
Started talking about globalization with Internet, changes in the way of
doing business occurred. Internet, Web and Information Communication
Technologies have revolutionized even the competition. In the past, when
there is a change, organizations were responding to changes by down-
sizing or reengineering. Now, the change is constant, other actions should
be taken to survive.
On the way to e-Transformation, organizations are experiencing a new
value-creation mechanism and a new competitive environment on the
basis of the network and information utilization. e-Transformation is
characterized by several factors:
• a rapid transfer of knowledge within the companies and across the
value chain,
• the participation of IT in every juncture,
• increased involvement of IT in business decision-making,
• the increased speed at which decisions are made about the products,
strategies, new technology implementation,
• individuals with a willingness to engage and act on new ideas and new
realities.
By information and internet technology, traditional value chain is extending
to the virtual value chain. In the virtual value chain, by using e-work and e-
transformation processes, customer responses are taken rapidly,
personalized product development is possible. All of these examples and
more make the business more competent to respond to market needs.
This also requires a change in the way of business done. The business
processes might be required to re-defined. For that case, a champion who
owns and believes the benefits of transformation is needed in the
organization. If nobody believes change, then change cannot occur. The

69
belief should be in organization-wide. Where the organization is wanted to
be is decided, called vision. Then according to that vision, the path to be
followed and the actions to be taken is determined by defining goals and
strategy.
For the transformation to be effective, IT changes must be integrated with
an organization’s core beliefs, processes and practices. In essence, going
through e-organization needs a massive culture change: change in the
way of work done, performance measurement, employee recruitment and
retaining. So the change begins with the organization’s most important
asset, its employee. With the help of training, clear communication and
incentives, the transformation process will be successful.
Training does not only occur with in-class; collect people and explain the
subject in a room. Training also can be done in electronic medium and in
organization. The training done in the electronic media is called e-Learning
where flexibility is in time and place of learning. In e-Learning, two kinds of
learning occur. First one is instructional learning that when an employee
needs any instruction for his business, he directly connects to the relevant
site and gets the necessary information. The second one is the information
management side of learning. The things in the employee head are
distributed to others to form a new knowledge. After the term internet
occurrence, organizations are talking about intranet, extranet and internet
portal. These three indicate different connections but similar meanings.
Such that, intranet is the internal connection within the organization for
individuals to transfer and share information, get training, get documents
and so on. Extranet is the site where the partners are connecting to each
other to make necessary data and information transformation. Portal is the
connection that personalized information is obtained by arranging
according to preferences. The point where is wanted to be is,
communicate with individuals according to their needs and expectations.

70
These three sites can be used for information flow between the individuals,
decrease in transaction costs and increase in productivity.
The way of providing communication with the communities outside of the
organization is constructing an organization web page. Web page is the
visual identity to someone in the electronic world. One way communication
is provided by static web pages, only informative data is given to
individuals about the market being, businesses doing, contact information.
Two way communication is provided by giving the possibility for the
“outside individuals”. The last step is integrated services and transactions
done on the web site. e-Government model aims that last step. In
traditional way, individuals go to government building, fill forms with
handwriting, approve to authorized person, and pay to some different
places so on. In e-Government, aim is integrate the services that, when an
individual enters his identity number, the related information is collected in
one place and give the individual to do all transactions from one site,
without traveling ‘physically’.
Customer Relationship Management (CRM) is organizes relations with the
internal and external customers. Internal customer is the ones within the
organization, external customer is others; customers, partners,
stakeholders. CRM has three components, the customer, the relationship
and the management. It is more than sending ‘happy anniversary’
messages. It is understanding the customer preferences, establishing the
relation between his preferences and his possible needs and managing
that relation effectively. That requires having customer-focused processes
to serve the customer.
To do all of these, a strong infrastructure, both in technical and social
terms, should be constructed. Between a firm’s information systems and
its business capabilities, there is a growing interdependence. As the

71
expectations change, strategy, rules and business capacities change in
parallel. This change requires changes in hardware, software, databases
and telecommunications. Organizations can only present their processes
within the constraints of the system capabilities. Information systems aim
the transfer of necessary data to the related individual for becoming
knowledge to help in decision making process. Individuals being “e”
accelerates the maturity if the organization. As discussed above, change is
also occurring in culture. If individuals do not interest in change, then it is
meaningless to talk about continuous improvement. In here, we are talking
about e-Worker. In that study, e-Worker is defined as the ones who are
using electronic medium to send every kind of document and notes to
each other.
If someone has something, then the security comes to point. With arise of
internet, hackers, viruses, attacks come into scene. As years pass, the
money spent on security increases with the increase in threats to the
systems. Figure 5.1 shows the damage in dollars occurred due to digital
attacks. However, the assets of the organization must be protected. The
data can be copied, stolen or changed or failures can occur in the system.
To prohibit these occurrences authorization for the entrance is determined
and necessary actions are taken for data losses in case of a failure.
The transformation should be managed, otherwise a chaotic environment
occurs. The changes in the business processes and technology should
support the core competencies of the organization. Such that, while
transferring a technology, needs assessment analysis and the workflow
should be defined. For example, when Enterprise Resource Planning
(ERP) systems evolved, nearly every organization got one; however, most
of them remained it idle or used for excel similar purposes. First of all,
technology implementation requires some changes in the way of business.
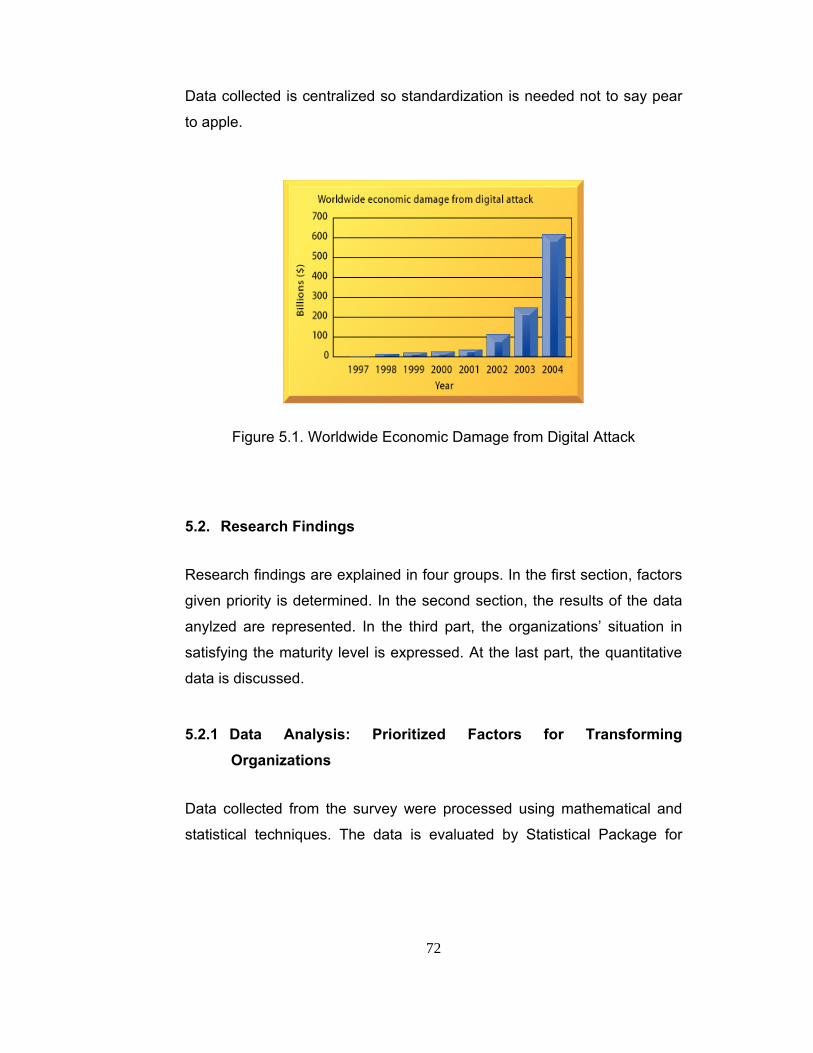
72
Data collected is centralized so standardization is needed not to say pear
to apple.
Figure 5.1. Worldwide Economic Damage from Digital Attack
5.2. Research Findings
Research findings are explained in four groups. In the first section, factors
given priority is determined. In the second section, the results of the data
anylzed are represented. In the third part, the organizations’ situation in
satisfying the maturity level is expressed. At the last part, the quantitative
data is discussed.
5.2.1 Data Analysis: Prioritized Factors for Transforming Organizations
Data collected from the survey were processed using mathematical and
statistical techniques. The data is evaluated by Statistical Package for

73
Social Sciences (SPSS) package Version 15.0. Prioritized factors obtained
from questionnaires are identified by Mean Importance Rating.
The main objectives of this data analysis are:
• determining the factors that effect transformation of organizations,
• determining the maturity levels of the organizations,
• reconstructing and justifying e-CMM model utilizing regression to
estimate weights and then testing the model’s accuracy.
For the first part of the questionnaire, a total of 97 questions were asked to
determine whether they have the factors asked or not. These factors are
important to determine the items given priority for the organization.
Responses are taken either “exists” or “not exists” for each factor. After the
responses are processed, the mean importance rating for each factor is
calculated.
The formula for calculating the mean importance rating is:
Rmean = 100*∑ni/30 (Equation 5.2)
Where ni = response given by ith organization i = 1, 2, 3..30
ni = 1 if the factor exists; otherwise
ni = 0
Mean importance rating is used to for the factors given priority among the
organizations for e-Transformation. In Table 5.1, the factors are ranked
according to their ratings.

74
Table 5.1. Factors Ranking According to Mean Importance Ratings
Factors Mean Internet connection availability 100.00% Intranet availability 93.33% TC identity number 93.33% e-Transformation project existence 90.00% Technology change is planned 90.00% Top level manager gives support to e-Transformation project 86.67% Organizational security policy availability 86.67% New technology application to organization 86.67% Every project has a team 83.33% Security level applications 83.33% Technology change management is supported by top management 80.00% Document sharing on intranet 76.67% e-Transformation team existence 73.33% Top level manager uses initiative for e-Transformation 73.33% Database is reached from database 73.33% Project development plan availability 73.33% e-Transformation project manager is top level 70.00% Training unit availability 66.67% Process improvement is supported by top management 66.67% Budget is available for e-Transformation 63.33% Organization applications are web-based 63.33% Which document is in which department is tracked 62.07% Computer based training availability 60.00% Training infrastructure availability 60.00% Training program content preparation 60.00% Technology change management has a team 60.00% Documents are scanned to put on computer 53.33% Customer dis/satisfaction measurement availability 50.00% Project risk assessment is done 50.00% Continuous process improvement plan availability 50.00% Organizational participation for process improvement 50.00% Committee availability for intranet content 46.67% Customer dis/satisfaction record keeping 46.67% Customer dis/satisfaction data storage 46.67% Reach products and services from web 46.67% Training program evaluation 46.67% Training program is tracked 46.67% Feedback is evaluated for training 46.67% Customer learning and training program availability 46.67% Customer dis/satisfaction data analysis 43.33% Training policy availability 43.33% Personnel is trained for process improvement 43.33% Formal internal communication is done on intranet 40.00% Extranet availability 40.00% Intranet is reachable from Internet 36.67%

75
Department managers are trained for process improvement 36.67% Written document for increase in technology capability 36.67% Management information system availability 36.67% SWOT analysis before transformation 33.33% Quality metrics are defined 33.33% Quality management applications are tracked by top manager 33.33% Personnel whom will measure and apply is trained 30.00% Quality management applications are tracked by project manager 30.00% erp_equipment resources module 30.00% Malzeme kodu standardi 30.00% e-Transformation project efficiency is measured 26.67% e-Transformation strategy policy document availability 26.67% Quality certification availability 26.67% Data mining is done on the document/information on hand 26.67% Portal availability 26.67% Customer satisfaction measurement method availability 26.67% erp_human resouces module 26.67% erp_finance module 26.67% Organization information systems is integrated 24.14% SMS availability 23.33% Decision support system availability 20.00% erp_project management module 20.00% Address standard 20.00% Customer demand is taken online 17.24% Personalized portal for customers 16.67% Quality management system is integrated with DMS 16.67% Intelligent search is applied 16.67% erp_quality management module 16.67% erp_service and maintenance module 16.67% Virtual meeting on intranet 13.33% Demands are taken online 13.33% Quality management system is integrated with organizational database 13.33% Portal structure evaluation 13.33% erp_production planning module 13.33% erp_sales and distribution module 13.33% e-Signature application availability 10.00% e-Learning is applied 10.00% e-Learning policy availability 10.00% e-Learning management unit availability 10.00% e-Learning infrastructure availability 10.00% Kiosk availability 10.00% Security certificate availability 6.90% Information systems and CRM is integrated 6.67% CRM project availability 6.67% e-Learning program is evaluated 6.67%
Table 5.1 (cont.)

76
e-Learning program is tracked 6.67% e-Learning content is prepared 6.67% e-Learning content is evaluated 6.67% e-Learning is measured by feedback 6.67% Digital TV availability 3.33%
All the organizations have internet connection and have a website, do not
matter whether it is static or dynamic. Table 5.2 shows the important
factors identified for the websites. These factors are taken from Genç’s MS
Thesis [29]. The evaluation is done structurally; no detailed analysis is
included in that study.
Table 5.2 Factor Rankings for Organization Website According to mean
importance ratings
Factors for Website Mean (%) Navigation properties on website 78.73 Download and visual performance of website 72.83 Information quality of the website 67.67 Understandability of the website 59.17 Interaction of the website 41.33 Organization identity information on website 39.83 Personalization of the website 27.90 Security properties of the website 23.00
Citizen sends mail for communication with organization and submission of
some forms are possible from Internet. Almost all organizations have
intranet. When asked whether the communication is provided with intranet,
they answered “yes, by e-mail” which indicates that individuals have not
realized the benefit of having intranet. TC identity number is used as a
standard within the organization that each person is going to have one
record.
Table 5.1 (cont.)

77
Existence of e-Transformation project indicates that organizations started
to do something for change; however, the project is managed by
Information Technology and Communication Departments. Surveys show
that this fault is done in the early stages of change, as if change is on the
response of only ITC Department. Even within the ITC Department, there
is no separate team for managing the transformation. Whole department is
responsible and the project managers are the department heads. Top level
managers seem to give support to e-Transformation project although it is
off-the-record said “let’s say they are giving”. Department heads are
dealing with the project.
Organizations have defined some unwritten policies for their security
systems. Almost none of the organizations have security certificate which
means auditing and improvement of the system is dependent on the
organization.
New technologies are applied to the organization but no planning is
indicated for usage of old technology and application of new technology.
The biggest gap is in the monitoring, measurement and documenting of
the processes. The metrics are not defined in the organizations to
measure the efficiency of the processes. Individuals cannot know what to
do if the processes or duties are not determined or written.
Organizations also have not realized the benefits of e-Learning. If
managers realize any necessity for training, either classes are organized
or individuals are sent to seminars or work shops.

78
5.2.2 Key Findings for e-Transformation and Observations
The data obtained from the survey is analyzed in two parts as raw findings
and findings refined. Raw findings represent the data that is directly used
by the interviewees. In the findings refined section, the raw data is
corrected by correlating the overall sayings of the individuals.
5.2.2.1 Raw Findings
Below, for each KPA, existing and missing points depending on the results
of the questionnaire are discussed.
The maturity of the organization is determined by the satisfaction of all
KPAs at that maturity level and levels below. In e-CMM model, 17 KPA are
identified for 5 maturity levels. For each maturity level, number of
questions are asked related for KPA of that level to determine whether
organization has ready to complete that KPA.
To determine the existing KPA situation of the organization, the first part of
the questionnaire is evaluated. In the first part, 97 questions were asked.
For the evaluation, the capability of each organization is determined for
each KPA. If there is one or more than one “exists” in the form, then that
KPA is accepted as “occurs” for that company. It must be remembered
that, this is the first evaluation of raw data so the situation of each KPA
could change when a detailed analysis is done. The analysis of raw data is
given in Figure 5.2. After the explanation of findings, measurement of
KPAs will be modified and the final figure will be formed in section 5.2.2.2.
KPA 1: Company Web Page
For the first evaluation, all of the organizations have at least a static
website. All of the companies have web pages. Within the scope of e-

79
government studies in Turkey, all of the evaluated government
organizations are standardized their web pages structurally. The profit
organizations’ designs are depend to each organization. One of the
organizations is a 3 page site that only describes the company briefly. The
websites are evaluated briefly under the titles of navigation, download,
information quality, understandability, interaction, identity, personalization
and security. If the structural evaluation is deepened, it is seen that:
Identity: The organization’s logo, address (sometimes with a
roadmap), phone and fax numbers are given in the web site. 80% of the
time, the head of the departments’ name are also reachable, however, if it
is needed to communicate with other workers, none of the time that
became possible.
Navigation: Loading time is speed enough that as soon as the
address is entered, the web page appears. None of the organizations have
animation or multimedia properties.
Interaction: All of the organizations have at least basic search
function. Only one of the organizations have advanced search. None of
the organizations have forum or chat facilities. Government organizations
support deficiency as saying if any citizen needs any information or
problem, then s/he fills a form in terms of “information law”.
Understandability: The highest grades are taken at that property.
Personalization and Content: There is no personalization for the
citizens or customers in the web pages yet. The web pages are used for
one-way communication at that moment.
Information Quality: In none of the sites, the update time or version
number can be seen.

80
Security: Lowest grades are obtained at that property.
0.00
10.00
20.00
30.00
40.00
50.00
60.00
70.00
80.00
90.00
100.00
PercentO
rgan
izat
ion
Web
page
Vis
ion
and
Pol
icy
Def
n. fo
r e-T
rans
. Pr.
Org
aniz
atio
n IS
Intra
net
IT In
frast
ruct
ure
Dat
a/In
form
atio
n S
tand
ards
Cus
tom
er R
elat
ions
hip
Man
agem
ent
Inte
r-org
aniz
atio
nal T
rain
ing
Tech
nolo
gies
Pro
ject
Man
agem
ent
Ext
rane
t
Sec
urity
Pol
icie
s
Per
form
ance
Mea
sure
men
t
Con
tinuo
us e
-Lea
rnin
g
Doc
./Inf
. Man
agem
ent S
yste
ms
Por
tal
Pro
cess
Cha
nge
Man
agem
ent
Tech
nolo
gy C
hang
e M
anag
emen
t
KPA
Figure 5.2 Organizations’ Existing KPA – First Draft
Websites are not used for transitive purposes. Sites are giving information
about the organization. Contact information to department heads is given;
however, in most of the sites it is not possible to the find the contact
81
information of ant staff. Most of sites have links to related sites. Nearly all
of them are talked about the projects done in the past and current ones.
KPA 2: Vision and Policy Definition for E-Transformation Project
All of the government organizations need to be transforming to be a part of
e-government with a circular from the prime minister in 2003. Due to this,
all of the organizations have different e-transformation projects.
Organizations, especially government organizations, do not have a
separate team who are only dealing with the transformation process.
During the questionnaire application, it is said that the staff in Information
and Technology Department are responsible with planning and
management of change. The most interesting finding is that 10% of the
companies do not have a project plan, but they formed a team.
Only 27% of the organizations prefer to measure the outcomes or the
success of the project. In Turkey, organizations still have hierarchical
organization structure, in other words, all of the departments and units are
directly coordinated from a decision maker at the top. During the interview,
it is indicated that 87% of the have organizations have support from the
top, however, 50% of the organizations were whispered unwilling about
that support. One of the outcomes besides the efficiency and effectiveness
is the transparency both in the inside and outside. In some cases,
transparency may cause to nearly 50% reduction in the worker number,
obtaining higher efficiencies. In Turkey, especially the government
organizations are full with relatives with unskilled or working at the
unrelated departments. Also, transformation means change, and there is
also a resistance to change.
Also, in government, no private budget is used for transformation. A share
is used from the main budget of the organization. The main problem is
nearly in all organizations and for each KPA, monitoring and measurement

82
of processes and activities do not held. There is a general saying that “if
you cannot measure, you cannot control”. Besides, there is a gap in the
documentation of the processes or having a written policy beneficial for the
determination of responsibilities and duties. For change environmental and
internal analysis is important. By that way the organization realizes its
weak and strong points and competition possibilities. To follow the change,
the needs for it should be determined. However, organizations have not
held such a process (Figure D.1 in Appendix D).
KPA 3: Organization Information System
Organizational information systems are important for managers for
planning and making decision. The business environment is complex and
dynamic. To be competitive, to survive or to satisfy the stakeholders’
needs, right decisions should be made at the right time. Information
systems used by managers help to analyze data and compare itself with
other organizations. For using information systems easily, accurate data
collection is necessary. In the decision making and management of the
resources from one source, there are important deficiencies. Both in the
governmental and profit organizations, only 37% of the organizations have
MIS and 20% of them have DSS. Organizations say that by simple reports
given to the heads at different intervals are enough for decision making.
Without having these systems, accuracy and the effectiveness of the
decisions are questionable since decision making still is in hierarchical
structure.
ERP packet or similar resource planning programs are necessary to
control the organizations’ resources. Public organizations are too big for
the number of workers, number of stakeholders, and volume of the
business and so on. In ERP, every department deals with its own business
with a different module using the common resource. For example, if ten

83
units of pen are sold, this is seen in the system instantaneously and then
the next decision is taken accordingly. Although the benefits these
systems have, using information systems in the organizations or
implementing a resource control system is too low in organizations
There are some misunderstandings in the perceived terms. In information
systems, when it is talking about getting the demands online, it refers to a
complete process, which means, from getting the customer order to
handling the order to the customer, the whole or part of the process flows
electronically. In the interview, while asking whether the demands get
electronically, the interviewees ‘answered yes, by mail’. Then the
remaining process continues as usual, by hand. Also, online ordering does
not include only mailing. 17% of the organizations get the orders online.
Remaining still do the workings by traditional paper usage. These
remaining also indicated that it is not possible for them to online ordering,
however, if the citizen would not taken into consideration, still every
organization is a customer to an other organization, also some of the
organization. There are hundreds of pages circulate between and in the
organizations. (Figure D.2 in Appendix D).
KPA 4: Intranet
Intranet’s main usage in the organization is to accelerate the information
dissemination and knowledge creation. In the organizations, intranet is an
electronic version of news wall. Internal communication is satisfied by
sending e-mail to individuals and groups. Staff could reach the database
within the limits of authorization. There are some organizations using e-
signature within the organization but the real and widespread application
will be within few months. Intranet, in the current situation exists; however,
with the developments in project management systems and

84
document/information management systems, the effective usage will be
started (Figure D.3 in Appendix D).
77% of the organizations share the files from intranet. It is believed that
that is only a simple sharing. The reason is that only 53% of the
organizations transferred the data in hand to a database and only 60% of
the organizations know which document is where within the organization.
There is still traditional hand-in-hand or simple electronic (mail etc) file
sharing and finding. Only nearly 30% of the organizations use data mining.
This shows that there are still unused or missed data somewhere within
the organization.
For an effective information sharing and knowledge production, intranet
usage should be parallel with information/document management system.
Intranet is a pool for workers to reach to necessary data to have decision
making. However, from the questionnaires, it can be concluded that
intranet usage is similar to simple web site presence. It is only used for
one way communication, yet. 46% of the organizations have Web-based
applications which makes them available to be manages from Internet in
the future.
In more than half of the organizations, the content of the intranet is
managed by someone working in the information communication
technologies department. There is not a team managing the content.
When these issues are taken into consideration, only 1/3 of the
organizations are using the intranet effectively. The KPA existence table
will be modified accordingly.

85
KPA 5: Information Technology Infrastructure
IT infrastructure is important firstly for the automation of the processes at
the beginning, then for following the change at the mature state. Building a
competitive IT infrastructure needs a high investment at the beginning
depending on the requirements of the organization. Everything should be
integrated and communicate with each other. For example, when the
customer orders are taken online, the workflow of the process should be
designed accordingly. The order should not be taken electronically, then
printed and given to the related departments by hand. There are gaps for
the integration process of the organization as can be seen in Figure D.4 in
Appendix D.
KPA 6: Data/Information Standards
Organizations indicated that they are using many standards for
compatibility to other organizations; however, the standards used for data
standardization is indicated as unknown.
KPA 7: Customer Relationship Management System
At the most mature state, process change management KPA requires
following the change and transforming the processes accordingly.
Customer requirements are changing everyday so designing customer-
centric processes will be necessary for the organizations. To do this,
knowing the customer and his requirements and forecasting the needs will
be required. Customer Relationship Management system manages the
relationship between the customer and the organization. At the moment,
especially public organizations, possibility due to the static structure of
doing business, do not give enough care to know the customer or citizen
better. Customer satisfaction measurements are applies at 50% of the
organizations; however, the required actions are not taken. Organizations

86
indicate that they collect the customer satisfaction data by that way: citizen
or customer send a mail indicating the satisfaction level and the
organization does the measurement accordingly (Figure D.5 in Appendix
D).
KPA 8: Inter-Organizational Training Techniques
Training is necessary for the organizations to identify and develop the
skills of the individuals depending on the career path. Nearly 60% of the
organizations are realized the importance of training. In 50% of these
organizations, primary aim is to make everybody have fundamental
computer literate. For some of the organizations, training means sending
employee to seminars for training since they are not giving any training
inside. As can be seen from Figure D.6 in Appendix D, the requirements of
the training in these organizations are satisfied.
KPA 9: Project Management Concepts
Project Management is an important issue to plan the tasks will be done
and budget, to identify the responsible individuals, milestones and
determine the risks. Having a project team and a manager is required for
the completion of the project within budget and on time with satisfying the
needs of the customer. Organizations are fairly good at managing the
projects; however, risk management issue is still ad hoc. If unexpected
situation occurs, they indicate that they apply the necessary action without
any plan (Figure D.7 in Appendix D).
KPA 10: Extranet
Extranet provides the organization to share data and communication
between the partners. Most of the organizations do not know what the
extranet is. After explanation, 40% of the organizations indicated that they

87
have extranet. Remaining organizations said that ‘yes, have an extranet
used for file sharing’. Managers indicate that they share the necessary
documents by e-mail.
Personalization in any area, either in the extranet, cannot be seen, yet.
Actually, every government organization is in communication with at least
10 of the other organizations. Personalization will help the organizations to
shorten the processes (Figure D.8 in Appendix D).
KPA 11: Security Policy
Security policies are important to secure the organizations’ physical assets
and system. Organizations defined the security policies and they are
applied but almost none of them have a certificate which forms a gap for
the auditing and improvement (Figure D.9 in Appendix D).
KPA 12: Performance Measurement
Performance measurement is important for monitoring and improvement of
the process and product. Quality certificate, independent to the business
being in, indicates whether the defined requirements are satisfied or not.
Once having that certificate, or making an improvement is not enough.
Necessary measurements should be done and the errors should be
corrected. However, measurement of any activity is still missing in the
organizations. Organizations still apply ad-hoc processes. The success
rate is not important, yet, whether the action is completed or not is taken
primarily. Quality standards are showing ways for the improvement in the
organizations. Things that are not measured cannot be improved.
However, in 23% of the organizations, there is a quality certificate. One of
the companies indicated that they do not have a quality certificate but they
defined their own metrics and apply it (Figure D.10 in Appendix D).

88
KPA 13: Continuous e-Learning
Continuous e-Learning is training that individual determines duration,
place and time. It requires flexibility; learning is possible in every time
when the individual requires. Organizations do not have e-Learning
infrastructure at the moment and in the short-term neither does. E-learning
do not have a major importance for organizations, they believe they do not
need that way of training. By using inter-organizational training,
organizations indicated that they give the necessary training (Figure D.11
in Appendix D).
KPA 14: Information/Document Management System
Organizations are at the starting point of document/information
management system. Documents are held electronically, but searching
which results to knowledge has not been occurred, yet. Intranet usage and
Information/Document Management System could be assessed together.
The lower the capability of intranet effects the efficiency of
Information/Document Management System (Figure D.12 in Appendix D).
KPA 15: Portal
Portal is the entrance point for the customer. As the organization matures,
personalized portals are formed. But at the moment, portal level is not
mature yet, some of the organizations have forum, FAQ, memberships for
news. Some of the organizations think that their website is enough.
Organizations prefer to use visual or printed services for the citizens for
briefing. Portals or other electronic service usage (SMS, digital TV etc) is
not widely used, yet (Figure D.13 in Appendix D).

89
KPA 16: Process Change Management
Process Change Management requires continuous improvement regards
to the needs of the changing environment. Within the e-Government
studies, organizations are trying to redefine their processes. There is again
a gap in having a written policy for change management; some of the
organizations indicated that they have it written in Power Point. This case
shows that something is planned by between somebody but that planning
is not applied to whole organization. To be applicable, workers should
have some reference points, these documents help that. For process
change management, only 37% of the organizations managers get
necessary trainings. This creates a conflicting point that nearly 70% of the
organizations indicated that their top manager support the change. In here,
it concludes that something is supported by saying ‘we are with you’, but
the action to start a process is not fast enough. (Figure D.14 in Appendix
D).
KPA 17: Technology Change Management
New technologies are adapted to organizations quickly. However, only
using of these technologies is not enough, it should be integrated with the
business to increase in efficiency. The change should be planned and
monitored. (Figure D.15 in Appendix D).
5.2.2.2 Findings Refined
Depending on the above explanations, Figure 5.3 is updated for new
existence level of each KPA.

90
0.00
10.00
20.00
30.00
40.00
50.00
60.00
70.00
80.00
90.00
100.00
Percent
Org
aniz
atio
n W
ebpa
ge
Vis
ion
and
Pol
icy
Def
n. fo
r e-T
rans
. Pr.
Org
aniz
atio
n IS
Intra
net
IT In
frast
ruct
ure
Dat
a/In
form
atio
n S
tand
ards
Cus
tom
er R
elat
ions
hip
Man
agem
ent
Inte
r-org
aniz
atio
nal T
rain
ing
Tech
nolo
gies
Pro
ject
Man
agem
ent
Ext
rane
t
Sec
urity
Pol
icie
s
Per
form
ance
Mea
sure
men
t
Con
tinuo
us e
-Lea
rnin
g
Doc
./Inf
. Man
agem
ent S
yste
ms
Por
tal
Pro
cess
Cha
nge
Man
agem
ent
Tech
nolo
gy C
hang
e M
anag
emen
t
KPA
Organizations' Existing KPAs
Figure 5.3. Organizations’ Existing KPA (Modified & Refined)
If Figure 5.2 and 5.3 is compared, it can be seen that there is a decrease
in the percentages in activities Intranet, IT Infrastructure,
Document/Management Information Systems, Process Change
Management and Technology Change Management. This change is due
to the reason that while evaluating the raw data only the existence and
non-existence of each KPA is evaluated. They are not detailed. But when
each KPA is examined one-by-one, it is observed that these four KPAs are
exists only structurally. The main usage is not started at all. The detailed
explanations and reasons for decrease are given in section 5.2.2.1.

91
5.2.3 Organizations in General
After the existence of each KPA is modified, the overall existence of each
KPA at each level is determined by calculating the simple average (Table
5.3). From the table, for Level 2, existence of organization website
increases the percentage of overall existence. If it is excluded from the
calculation, overall existence of Level 2 becomes 40%, which is a fairly
good result. These percentages indicate the capability of organizations to
become mature. Organizations have some missing points at Level 2 and
Level 3, such as CRM, organization IS and extranet. Most of the
organizations neither realized the benefits of these areas. The other KPAs
have some activities but efficiency in usage is not enough at the moment.
For organizations, being Level 3 organization will be much more easily
mature when compared with becoming mature at Level 4 and Level 5. For
Level 4 and Level 5, organizations still need some help in these KPAs.
Especially determining measures is a problem in organizations.
Productivity of the processes is not considered, yet.
There are various maturity level calculation methods are developed by
different studies. For the findings in that study, each of the organization
interviewed, the maturity level is calculated based on COBIT maturity level
assessment to determine the level of IT processes (Appendix E). Each
organizations maturity calculation is given in Appendix F. CMM based
maturity calculation is not possible in that case since only a pre-evaluation
of the organizations in terms of transformation is considered. CMM based
evaluation all of the common features should be taken into consideration.

92
Table 5.3. Overall Existence of each Level
KPA Existence (%)Overall Existence
Technology Change Management 20.00Process Change Management 23.33Portal 20.00Doc./Inf. Management Systems 10.00Continuous e-Learning 13.33Performance Measurement 26.67Security Policies 86.67Extranet 36.67Project Management 70.00Inter-organizational Training Technologies 60.00Customer Relationship Management 46.67Data/Information Standards 26.67IT Infrastructure 6.67Intranet 33.33Organization IS 33.33Vision and Policy Definition for e-Transformation Project 86.67Organization Webpage 100.00
52.00
Level 3
Level 2
21.67Level 5
Level 4
17.50
54.44
When the maturity levels of organizations are grouped, Table 5.4 is
obtained:
Table 5.4. Maturity Level Grouping
Maturity Level Intervals Number of Organizations
3.80 – 4.00 6
3.60 – 3.79 3
3.40 – 3.59 9
3.00 – 3.39 9
2.00 – 2.99 3
Table 5.3 and 5.4 supports each other in a way that in Table 5.4, 60% of
the organizations interviewed are stay between the intervals of 3.00 –
3.40. Since a detailed analysis has not been held at the moment,
downgrading the results are not possible. Consequently, it can be said that
organizations moving from Level 2 to Level 3 will be easy since at least

93
they are started to apply the activities at the basic level. As improvement
continues, being mature will be easier.
5.2.4 Quantitative Analysis
Hierarchical Level of Information Technologies and Communication Department
Government organizations organizational structure is hierarchical which
creates difficulty in especially decision making situations. At the top of
government organizations, secretary of state takes place. Then the
presidents and departments occur. Due to that reason, ITC Departments’
hierarchical level is determined as Level 3 or 4. That situation prohibits
decision taking, managing and improving the processes and activities
within the organization.
Table 5.5 Level of ITC Departments in Organizations
Hierarchical Level of ITC Department in the Organization
Number of Organizations
1 1
2 5
3 13
4 10
5 1
Number of PC/employee
A study is performed by United Nations [93] to determine the computer
number per 100 individuals for developed, transition and developing
countries. When the same analysis is done for that study, it is found that

94
23.47 computers are owned per 100 individuals. When the UN study is
examined in Table 5.6:
Table 5.6 Number of Computer Owned (Taken from United Nations [91])
Country Computer per 100
World 12.24
Developed countries 56.64
Transition countries 11.89
Developing countries 3.68
The analysis in that study results to higher average than the World, but
between the developed and transition countries.
Number of Server/ 1000 employee
Average number of servers per 1000 employee calculated as 22. When
the intervals are examined, it is seen that 70% of the organizations have
servers less than 20 (Table 5.7). Actually, 30% of the organizations are
having server number less than 5. Government organizations are large in
the number of employee, data held, and occurrence of transactions. So
the number of the servers should be increased especially when the
continuous improvement stage is taken into consideration.
Number of e-Worker in the organization
The organizations are evaluated by percentage to determine an interval for
the percentage of e-Worker. As stated above, e-Worker is defined as the
employee who uses electronic media for any kind of transfer such as

95
notes, documents etc. When the data is evaluated, it is seen that almost
50% of the organizations are still doing their work by traditional hand-held
methods (Table 5.8). The findings found above for KPAs as intranet,
document/information management system, extranet also supports that
situation. 25% of the organizations have employees being e-Worker. That
25% is mostly composed of profit organizations which may be concluded
as the profit organizations resistance to change is lower those government
organizations.
Table 5.7 Number of Servers Owned
Number of Servers per
1000
Number of Organizations
> 100 1
80 – 100 1
60 – 80 2
40 – 60 3
20 - 40 2
0 – 20 21
Table 5.8 Percentage of e-Workers for Organizations
Percentage of e-Workers
Number of Organizations
90 – 100 7
50 – 70 5
20 – 40 4
0 - 19 14

96
Communication capacity per month
Communication capacity data is not held by the organizations which
shows that how much data flows in and out of the organization is not in the
consideration of the organizations, yet.
Services given to citizens
Most of the organizations answered the number of services given to
citizens as unknowns. They said that they are serving lots of services on
their web pages. The average number of services presented is 8. The
organizations thought that the services given on the web is enough so no
need to serve more services.
Number of standards used in the organization
Heads of ITC Departments could not answer that question properly. Most
of them said that they are using lots of standards related with their sectors.
Number of electronically communicated organizations
When electronic communication between any parties is asked,
organizations understood it as communicating with e-mail. 30% of the
organizations have extranet service between its partners. Within those
30%, on the average each organization communicates with 3
organizations in the electronic medium and one of them is the
communication with the bank they work with.

97
6. CHAPTER 6
JUSTIFICATION
In the previous chapter, the findings held according to the analysis are
presented. In that chapter, the justification of e-CMM model will be
discussed based on the comparison of e-Government models analyzed in
Chapter 2, analysis performed for the dependency of KPAs to each other
and the last part of the questionnaire which asked the interviewees own
KPAs for each five of the maturity level determined for e-CMM.
6.1. Available Models Approach
In the e-Government step, the goal is to integrate all government services
so any citizen will not be dealt with any authority, complete the interaction
24/7 without waiting in lines. Just only entering a Web service, it would be
possible for the citizen to complete its work. Schellong indicates that for
the successful implementation of e-Government activities a network
oriented organization, collaboration between government levels, multi
channel options, a reengineering of public services and the underlying
laws are required [78].
Table 6.1 shows the comparison of e-Government Maturity Models based
on researches done. Some of the areas are left blank if nothing is said in
the model definition about that feature or if that feature is special for that
nation.

98
In e-Government, transiting from centralized, hierarchical and operating in
a physical economy to virtual, global, knowledge based and operating in a
digital economy government occurs. As can be seen from Table 6.1 and
the models explained in Chapter 2 Section 2, all models have different
maturity levels. However, that does not create any absences in the actions
taken to reach to mature level. At the initial levels, all of the models have
basic, informative, static websites. Information about the projects, laws
and rules and contact information is published. At the highest mature level,
transformation of the processes is completed. There is transformation
rather than automation meaning that web based processes is active. The
business processes are integrated with the services given. Most of the
actions are taken by using web enabled technologies among the citizen
without conducting face-to-face communication with the individuals. Of
course, the most mature state requires integration with other private and
public organizations. For example, if citizen have to pay some money for
any action, then it will be possible for him to make online payment to bank
that the bank immediately sends the payment data to government’s related
unit so the action of the citizen will be completed. Or if any document
related with the citizen is requested from any organization, then that
information will be sent automatically without a need to citizen’s extra
action. The most mature state indicates communication, collaboration,
integration and share any related data and information related with citizen.
Most of the models define four or five levels to reach to mature state.
Between the lowest and most mature levels, the activities should be taken
are distributed to levels. Through the way of maturity, organizations firstly
automate their processes and services by constructing adequate
technology infrastructure and then transform the processes by responding
the changing environment. It must be remembered that, for governments,
it is hard to adapt to new environment due to bureaucracy, economical
conditions, and resistance to change and so on. Between these maturity

99
levels, the way of adaptation to changing conditions are also defined step-
by-step. Even in the same model, different governments could present
different actions since the priorities are different. The government should
define its strategies continuously to follow the change. When the most
mature level is reached, responsibilities and processes are decentralized.
It is possible to reach all forms, news and information from one source, do
more work with less people, less time in smaller offices.
e-CMM model is put into consideration for the comparison other ten e-
Government maturity Models. Online payment feature is left blank since it
is not appropriate for our model. When the models and e-CMM model
compared within each other, it can be easily seen that some features are
at the lower or higher level than the other models. Such as features related
with 24/7 static web site, publication of contact information on the web and
policy document is taken at Level 2 where as the others considered at
Level 1. The reason is that, in e-CMM model, at Level 1, no KPA is
defined, it is assumed that every organization is at level 1; does not matter
what kind of activities it perform. In e-CMM model, all the KPAs are
evaluated and according to that evaluation, the maturity level of the
organization is determined.
The other difference occurs in the connection to other sites. That feature is
determined at Level 3 while others take at Level 2. In e-CMM model, level
2 is immature, yet, that the organizational processes are newly started to
be defined. It means that the organization could not organize its internal
processes so the construction of relationship between its internal and
external customers is started at level 3.

100
Table 6.1 e-Government Maturity Models – Comparison (Taken from Arifoğlu,
A. & Gür, M. H. [9])
Model M1 M2 M3 M4 M5 M6 M7 M8 M9 M10M11Features24/7 static web service 1 2 1 1 1 1 1 1 1 1 2Publishing the department list and contact information
1 1 1 1 1 1 2 1 1 1 2
Information sharing between departments
3 5 4 3 4 4 3
Integrated services 4 4 3 4 2 5 3 4 3 4Cross-ministry sharing of info 3 4 3 4 2 4 4 5 4Connection to other sites 2 2 1 2 3Connection deficiency in navigation
2 1 2 1
Request information or service via email
2 2 2 3 3 2 2
E-authentication 3 2Form and document download 3 2 1 1 2 2 1 1 2Ensuring the communication priority by phone
1 1 2 3 1
Transaction capabilities 3 3 3 2 2 4 3 3Citizen’s personalized portal 5 4 4 5Online payment 3 2 3Automated advice 4 2 2 2/4Automated procurement process 3 4 3 3Policy document 1 1 1 2Security 2 3 3Frequently asked questions, complaints
3 2 2 3
Search within the site 2 2 2 2 1 3Portals 3 4 4Basic account inquiry 5 2 3 3/4Self service HR administration 4 5 4Conducting web enabled government transactions 24/7
3 3 3 3 4 3
Web-based user interaction/questionnaire
2 3 2 2 3
Integration of web-based transactions with processes
4 4 3 5 3 4 4
Web-based training 3 4 4Web-based processes 5 6 5 5 5
M1: Accenture’s Five Stage Plateau Model of e-Government Maturity M2: Henderson/Venkatraman e-Government Alignment Model M3: Australian e-Government Maturity Model M4: LEMM e-Government Maturity Model M5: Utah e-Government Maturity Model M6: “eGoss” Initiative e-Government Maturity Model M7: e-Government Maturity Model for the British Columbia (BC) Government M8:Gartner Group’s Four Stages of e-Government M9: UN Approach M10: OECD e-Government Task Force Model M11: e-CMM: e-Organization Maturity Model

101
6.2. Dependency Analysis on Key Process Areas
In the e-CMM model, it is assumed, during the transformation process,
some of the KPA influences the other. To find the dependency, Chi-square
test is used. The SPSS package was used in the analysis of independency
between the two KPAs that influences the other KPA.
Significance values of two KPAs were found by evaluating all the KPAs
with each other. Lower the significance value shows that these two areas
are dependent to each other. During the test, significance value less than
0.05 is considered as significant. The significant values of dependent
KPAs determined are given in Table 6.2.
Table 6.2. Significance Values of KPAs
Dependent KPAs Significance Value
Vision and Policy Definition for e-Transformation Project – Document/Information Management System 0.032
Inter-Organization Training Technologies – Technology Change Management 0.033
Organization Information System – IT Infrastructure 0.038 Organization Information System – Data/Information Standards 0.004
Data/Information Standards - Extranet 0.009 CRM – Performance Measurement 0.007 CRM – Continuous e-Learning 0.022 Document/Information Management System – Process Change Management 0.025
Extranet – Process Change Management 0.044 Continuous e-Learning – Security Policies 0.02 Document/Information Management System – Security Policies 0.032
If Table 6.1 is organized, the KPAs at each maturity level and its
dependency can be seen easily. From Table 6.3, relationships between
KPAs could be summarized as:

102
Table 6.3. Dependency of KPAs
Document/Information Management System (Level 4) Security Policies (Level 3) Vision and Policy Definition for e-Transformation Project (Level 2) Process Change Management (Level 5) Document/Information Management System (Level 4) Extranet (Level 3) Technology Change Management (Level 5) Inter-Organization Training Technologies (Level 3) Organization Information Systems (Level 2) Information Technology Infrastructure (Level 2) Data/Information Standards (Level 3) Extranet (Level 3) Organization Information Systems (Level 2) Performance Measurement (Level 4) CRM (Level 3) Continuous e-Learning (Level 4) Security Policies (Level 3) CRM (Level 3)
In e-CMM model, it is said that to move to next maturity level, the KPAs
below that level should be satisfied completely. Table 6.2 verifies e-CMM
model defined at Chapter 4, such that document/information management
system at level 4 is effected from security policies at level 3 and vision and
policy definition for e-Transformation project at level 2. If these two
activities are satisfied completely, the satisfaction of document/information
management system will be easier since those two activities form a kind of
infrastructure for Level KPA.
6.3. Analysis of the Model Developed by Interviewees
On the last part of the questionnaire, it is asked to interviewees to indicate
their own e-Organization model having five maturity levels. The e-CMM
model developed in that study had not been shown not to influence the
responses. Most of the responses were similar with the e-CMM model.
There were slight differences that:

103
• One of the individuals indicated e-Signature at Level 2. e-Signature will
be used within few years due to law. Organizations started to build the
necessary infrastructure and done the applications for e-signature
usage within and between the organizations.
• One of the respondent indicated CRM at level 5; however, when the e-
Government models are examined, contact with the customer starts at
earlier phases. Earlier started to understand the customer, better
design the customer-centered processes or products.
These responses were came from few people that the results obtained
from that part of the study did not effect e-CMM model constructed in that
study.

104
7. CHAPTER 7
CONCLUSION & LIMITATIONS The research question which is tried to be answered in this thesis is:
Where are we in terms of e-transformation and how can we
increase our level of that?
To find an answer to that question, a new model including the steps should
be taken for e-Transformation for organizations is discussed in detail
throughout the thesis.
This chapter is organized with a summary of actions taken for the study,
contribution of e-CMM model to the organizations and presentation of
some future study.
7.1. Summary
In this study, a reference model called e-CMM model that could be used
for e-Transforming organizations are built. CMM reference model is taken
as a framework to define five maturity levels. Some key process areas are
defined to move from immature to mature state along the way of
transformation. These KPA definitions are assessed from various e-
Government surveys and maturity and process improvement models.
From these researches, important actions that should be taken for a
change in the processes and culture of the organization is determined.

105
According to these actions, a questionnaire is developed and submitted
face-to-face to Information Technology and Communication Department
heads. 26 government organizations, 1 hospital and 3 business
organizations are evaluated. While sampling these experts, it is assumed
that all the information within the organization is centralized in ITC
Departments. During about 75- minutes-interview, three kinds of data are
obtained. At the first part, qualitative answers are collected to determine
the level of transformation phenomena embedded to the organization
culture. It is tried to understand where the organizations are in terms of e-
Transformation. At the second part, quantitative answers related with the
level of ITC Department within the organization, number of PCs etc., are
recorded. At the last part of the questionnaire, what the experts
understood from e-Transformation generally is assessed. For the
assessment, organization of activities to five maturity levels according to
them is asked. A statistical package (SPSS) is used for the analysis of that
raw data. The maturity levels of organizations, the factors given
importance in terms of –Transformation and overall completion of each
level are determined. From these findings, both the e-CMM model is
justified and the process improvement results of participating organizations
are obtained.
7.2. Contribution
e-Transformation is talked too much with the development in the Internet
and Web services technology. However, organizations could not realize
the change for the whole organization. Change should be from top to
bottom; from processes to organizational culture. There are some models
that are describing the maturity of some activities important for the
organization but there is not such a model defining the organizational
activities for each maturity level. Major contribution of this thesis is to

106
propose an original model (e-CMM) which identifies the key areas for
organizational improvement for realizing e-Transformation.
7.3. Limitations
1. Sample size being more than 5% of the population is said to be
significant, since 27 out of 120 public organizations is used in the
survey. However, the model needs to be experimented with more
samples.
2. This study can also be interpreted as pilot study for testing the
questionnaire which needs slight improvements to get matured.
3. During the evaluation of the questionnaire, only simple average is
calculated. With the slight improvements of the questionnaire,
detailed analysis can be performed accordingly.
7.4. Future Work
1. e-CMM needs more samples to be used for process assessment. It
also needs to be applied to individual organizations for process
improvement to get mature. In the survey, e-CMM has not been
applied for the purpose of process improvement because of time
limitations.
2. e-CMM can be used as a base for further development of e-CMMI
after experimenting with more samples where the same approach
is followed in the development of original CMMI from CMM.
3. e-CMM can be extended with the economical impact of deficiencies
of key process areas in organizations while performing process

107
assessment. Hence some techniques such as ROI, IRR, NPV can
be added to process assessment part of e-CMM.
4. e-CMM can process assessment facility can be used as a research
tool to discover the variations and similarities among organizations
of the same domain such as of same economical segment of same
or different countries.
5. An automated tool supporting e-CMM can be developed to
accelerate the application of the model.

108
8. 9. REFERENCES
[1] Accenture. (2001, June). No pain, no gain: Solving the riddle of e-organization. Outlook. Special Edition: The eSeries IV. Retrieved August 13, 2005, from http://www.accenture.com/xdoc/en/ideas/Outlook/special2001_4/e_organization.pdf
[2] Accenture. (2005). eGovernment Leadership: High Performance,
Maximum Value. The Government Executive Series. Retrieved August 13, 2005, from http://www.accenture.com/NR/rdonlyres/D7206199-C3D4-4CB4-A7D8-846C94287890/0/gove_egov_value.pdf
[3] Accenture. (2005). Leadership in Customer Service: New
Expectations, New Experiences. Retrieved August 13, 2005, from http://www.accenture.com
[4] Akkurt, D. (2002, Ocak). Bilgi İşlem Sistemleri için Güvenlik Politikası.
Retrived May 10, 2006, from http://www.ak-kurt.com/kurumsalpolitikalar.html [5] Alt, R. & Puschmann, T. (2004, January 5-8). Successful Practices in
Customer Relationship Management. Proceedings of the 37th Annual Hawaii International Conference on System Sciences (HICSS'04).
[6] Aragones, A. & Hart-Davidson, W. (2002, September 17-20). Why,
When and How do Users Customize Web Portals. Professional Communication Conference, 2002. IPCC 2002. Proceedings. IEEE International, 375-388.

109
[7] Arazyan, H. (2003, April). E-Government Leadership: Engaging the
Customer (Report). Accenture. Retrieved August 13, 2005, from http://www.accenture.com/xdoc/en/newsroom/epresskit/egovernment/egov_epress.pdf
[8] Arifoğlu, A. (2004). E-Dönüşüm: Yol Haritası, Dünya, Türkiye. Sas
Bilişim Yayınları. [9] Arifoğlu, A. & Gür, M. H. (September, 2005). e-CMM: e-Kurum
Olgunluk Modeli. Proceedings of the 2nd National Symposium on Software Engineering (UYMS’05). Ankara.
[10] Bakry, S. H. (2004, September). Development of e-government: a
STOPE view. International Journal of Network Management, 14(5). Retrieved May 10, 2004, from http://delivery.acm.org/10.1145/1030000/1024517/p339-bakry.pdf?key1=1024517&key2=9734855511&coll=&dl=GUIDE&CFID=15151515&CFTOKEN=6184618
[11] Bamberger, J. (1997, June). Essence of the Capability Maturity
Model. IEEE Computer, 30(6),112-114. [12] Bersin, J. (2002, July). How to Measure E-Learning: The Nuts and
Bolts. Bersin & Associates. IQPC Keynote. Retrieved February, 2006, from http://www.berdin.com/presentations/July2002_iqpc.pdf
[13] Brandon, D. (2005). Project Management for Modern Information
Systems. IRM Press. Retrieved October 23, 2006, from ebrary database.

110
[14] Cisco-Network Security Policy: Best Practices White Paper. Network Security Policy: Best Practices White Paper. (Document ID: 13601). Retrieved November 1, 2006, from http://www.cisco.com/warp/public/126/secpol.pdf
[15] Close, W. S., Ferrara, C., Galvin, J., Hagemeyer, D., Eisenfield, B. L.
& Maoz, M. (2001, June 19). CRM at Work: Eight Characteristics of CRM Winners. Gartner Research (ID Number: AV-13-9791).
[16] COBIT from http://www.isaca.org/cobitonline [17] A Comparative Study: Corporate Information Portals and Corporate
Knowledge Portals. IEEE Recommended Practice for Internet Practices – Web Page Engineering – Intranet.
[18] Comstock, D. E. (1982). A Method for Critical Research.
Philadelphia, PA: Temple University Press. [19] Crosby, P. (1980). Quality is Free: The Art of Making Quality Certain.
USA: Penguin Books. [20] Curtis, B., Hefley, W. & Miller. S. (1995, September). People
Capability Maturity Model. Pittsburg, PA: Software Engineering Institute.
[21] Dalal, S., Temel, S., Little, M., Potts, M. & Webber, J. (2003, Jan-
Feb). Coordinating Business Transactions on the Web. Internet Computing, 7, 30-39.

111
[22] Davison, R., How should a Government go ‘e’? The Gov-2-eGov Challenge & Future eGov directions. Seminar Presentation, November 2004. From http://fabweb.cityu.edu.hk/is3037/Seminar%2010.ppt
[23] DMR Consulting and The National Office for the Information
Economy (NOIE). (2003, April). E-government Benefits Study. Case Study, Australia. Retrieved May 10, 2004, from http://www.agimo.gov.au/__data/assets/file/16032/benefits.pdf#search=%22%22E-government%20benefits%20study%22%22
[24] E-government from a User’s Perspective. Retrieved October 4, 2006,
from http://www.aoema.org/E-Government/Agency_citizen_models.htm [25] Esther, C. (2004). Making Sense of Change Management: A
Complete Guide to the Models, Tools and Techniques of Organizational Change. Kogan Page, Limited. Retrieved on August 16, 2006, from ebrary.
[26] Extranet Applications. IEEE Computer Society. IEEE Std 2001-1999. [27] Fingar, P., Kumar, H. & Sharma, T. (2000). Enterprise E-Commerce:
The Software Component Breakthrough for Business – to – Business Commerce. Tampa: Meghan-Kiffer Press.
[28] Gartner. (2001, February). Using Technology to Transform North
Carolina’s Governmental Services and Operations in the Digital Age. Report, Information Resource Management Commission. Retrieved on August 20, 2005, from http://www.its.state.nc.us/News/EGovernment/_Docs/EGovernmentReport2001.pdf
[29] Genç, A. Ş. (2006, September). Web Site Evaluation. MS Thesis
Informatics Institute, METU.

112
[30] Geylor, J. (2003). Managing Information Technology Projects:
Applying Project Management Strategies to Hardware, Software and Integration Initiatives. Retrieved on August 15, 2006, from ebrary.
[31] Grover, V. (1999, February). From Business Reengineering to
Business Process Change Management: A Longitudinal Study of Trends and Practices. IEEE Transactions on Engineering Management, 46, 36-46
[32] Goetsch, D. L. & Davis, S. B. (2006). Quality Management:
Introduction to Total Quality Management for Production, Processing, and Services. Pearson Prentice Hall.
[33] Goldmann, N. (1997, January). Extranet: The “Third Wave” in the
Internet Electronic Commerce. Retrieved on August 17, 2005, from http://www.arraydev.com/commerce/JIBC/9701-18.htm
[34] Gül, H. (2000). Türkiye’de Kamu Yönetiminde Hizmet İçi Eğitim.
Dokuz Eylül Üniversitesi Sosyal Bilimler Enstitüsü dergisi, 2. Retrieved on August 22, 2006, from http://www.sbe.deu.edu.tr/Yayinlar/dergi/dergi06/gul.html
[35] Heeks, R. (2006). Benchmarking eGovernment: Improving the
National and International Measurement, Evaluation and Comparison of eGovernment. (Paper no: 18). iGovernment Working Paper Series. Development Informatics Group, Manchester. Retrieved on September, 2006, from http://www. sed.manchester.ac.uk/idpm/publications/wp/igov/documents/iGWkPpr18_000.pdf
[36] Herbsleb, J., Carleton, A., Rozum, J., Siegel. J. & Zubrow, D. (1994,
August). Benefits of CMM-Based Software Process Improvement: Initial Results (Tech/ Rep. No. CMU/SEI-94-TR-013). Pittsburgh, PA: Software Engineering Institute.

113
[37] Heston, K. M. (2001). Using the Capability Maturity Model for
Software to Achieve Business Goals. Accenture Outlook Point of View. Retrieved on January 8, 2005, from http://www.accenture.com/Global/Research_and_Insights/Outlook/By_Alphabet/UsingGoals.htm
[38] Holbrook, P. & Reynolds, J. (1999, July). RFC 1244-Site Security
Handbook. Retrieved on November 1, 2006, from http://rfc.net/rfc1244.html
[39] Houghton, R. (2004). Technology Change Management (TCM).
Redemtech, Inc.Retrieved on August, 2006, from http://www.redemtech.com
[40] Houghton, R. (2006). Mission Imperative: Technology Change
Management. Gartner IT & Software Asset Management Summit. Redemtech, Inc.Retrieved on August, 2006, from http://www.redemtech.com
[41] Humphrey, W. S. (1988, March/April). Characterizing the Software
Process: A Maturity Framework. IEEE Software, 5(2), 73-79. [42] Humphrey, W. S. & Sweet W. L. (1987). A Method for Assessing the
Software Engineering Capability of Contractors (Tech. Rep. No. CMU/SEI-87-TR-23). Pittsburgh, PA: Software Engineering Institute.
[43] Humphrey, W. S. (1989). Managing the Software Process.
Massachusetts: Addison Wesley. [44] Imhoff, C., Loftis, L. & Geiger, G. J. (2001). Building the Customer-
Centric Enterprise: Data Warehousing Techniques for Supporting Customer Relationship Management. John Wiley & Sons, Inc.

114
[45] ISO (2000). ISO 9000:2000: Quality Management System – Fundamentals and Vocabulary.
[46] ISO/IEC JTC1/SC7. (1998). ISO/IEC TR 15504: Information
Technology – Software Process Assessment, 1998(b). [47] Kannan, S. Software firms need to upgrade to CMM-I level. (2003,
July 16). The Hindu. Retrieved on May 6, 2006, from http://www.hinduonnet.com/2003/07/16/stories/2003071602971600.htm
[48] Key Issues – Business Continuity/Disaster Recovery. Retrieved on
May 6, 2006, from http://www.ingenuityassociates.com/key-issues [49] Kim, S. (1999, August 20-28). The Roles of Knowledge Professionals
for Knowledge Management. 65th IFLA Council and General Conference. Bangkok, Thailand. Retrieved February 8, 2006, from http://www.ifla.org/IV/ifla65/papers/042-115e.htm
[50] Kostur, P. (1998, September 23-25).Building and Managing an
Intranet. Professional Communication Conference. IPCC 98. Proceedings. 1998 IEEE International, 2, 51-57.
[51] Laudon, K. C. & Laudon J. P. (2006). Management Information
Ssytems: Managing the Digital Firm. 9th ed., Prentice-Hall International.
[52] Leem, C. S., Suh, H. S., Kim, B. Y. & Park, N. (2003, December). A
study on e-Transformation effectiveness analysis with cases in manufacturing and retail industries. Production Planning & Control, 14, 798-809.

115
[53] Levine, L. (2000, January). Learning: The Engine for Technology Change Management. Crosstalk-The Journal of Defense Software Engineering, 13, 14-20.
[54] Liautaud, B. (2000). E-Business Intelligence: Turning Information into
Knowledge & Profit. McGraw-Hill Professional Book Group. Retrieved February, 2005, from ebrary database.
[55] Ling, R. & Yen, D. C. (2001). Customer Relationship Management:
An Analysis Framework and Implementation Strategies. Journal of Computer Information Systems, 41, 81-97.
[56] Marchese, M. (2002). A Participatory Design Approach for the
Development of Support Environments in eGovernment Services to Citizens. Technical Report, #DIT-02-0036, Trento University, Department of Information and Communication, Tranto, Italy. Retrieved on January 7, 2005, from http://eprints.biblio.unitn.it/archive/00000115/01/36.pdf
[57] Marshall, S. & Mitchell, G. An e-Learning Maturity Model? [58] Maynard, J. & Smith, V. (2004). A rolling stone gathers no moss:
maintaining the momentum of action research. Learning and Skills Development Agency from support for success (s4s) web site. Retrieved on January 7, 2005, from http://www.s4s.org.uk
[59] Orlikowski, W. T. & Baroudi, J. J. (1991). Studying Information
Technology in Organizations: Research Approaches and Assumptions. Information Systems Research, (2), 1-28.
[60] Meehan, M. (2000). Southwest Airlines Cracks $1 Billion mark in
Online Ticket Sales. Retrieved on August 1, 2006, from http://www.computerworld.com/cwi/story/0,1199,NAV47_5T050128,00.html

116
[61] Murdoch, J., Fernandes, K. J. & Astley, K. (2005, October 10-12). Role-based Measurement of Performance. Systems, Man and Cybernetics.
[62] Mutafelija, B. & Stromberg, H. (2003) Systematic Process
Improvement Using ISO 9001:2000 and CMMI. Artech House Publishers. Retrieved on January 7, 2005, from http://computerworld.com/managementtopics/management/project/story/0,10801,87882,00.html
[63] Myers, M. D. (1997, June). Qualitative Research in Information
Systems. MIS Quarterly, 21(2). Retrieved March 24, 2006, from www.qual.auckland.ac.nz
[64] Nasscom (National Association of Software and Service Companies)
(2002, March), List of Quality Certified Companies. Retrieved on January 7, 2005, from http://www.qaiindia.com/Resources_COList/res_listofco.htm
[65] Natarajan, G. & Dasgupta R. R. e-Transformation: The Do-How.
Retrieved on January 7, 2005, from http://www.zensar.com/pdfs/ebiz.pdf [66] Nielsen, P. A. (2006, July). Qualitative Research in IS: Part 1.
Presentation presented at PhD course on qualitative research methods in the Department of Computer Science, Aalborg University, Denmark.
[67] Non-probabilistic Sample Selection Methods. Retrieved on January 7,
2005, from http://www.ctp.bilkent.edu.tr/ãydogmus/sampling.doc [68] O’Regan, G. (2002). A Practical Approach to Software Quality. New
York: Springer-Verlag.

117
[69] OECD. (2003, April 3-4). The E-Government Imperative. OECD E-GOVERNMENT FLAGSHIP REPORT 27th Session of the Public Management Committee, Paris. Retrieved on August 21, 2006, from http://www.olis.oecd.org/olis/2003doc.nsf/3dce6d82b533cf6ec125685d005300b4/fab732e0b66bc780c1256ce7003015cb/$FILE/JT00140718.PDF
[70] Paulk, M. C., Weber, C. V., Garcia, S. M., Chrissis, M. B. & Bush, M.
(1993, February). Key Practices of the Capability Maturity Model for Software, Version 1.1 (Tech. Rep. No. CMU/SEI-93-TR-025 ESC-TR-93-178). Pittsburgh, PA: Software Engineering Institute.
[71] Perrin, L. & Powell, B. (2004), Short-Term Intervention, Long-Term
Gain: Using Action Research Projects for Quality Improvement in Adult and Community Learning. From the Learning and Skills Development Agency (LSDA) web site. Retrieved on May 20, 2005, from http://www.qualityacl.org.uk/quality/docs/shortInt.pdf
[72] Persse, J. R. (2001). Implementing the Capability Maturity Model.
New York: John Wiley & Sons, Inc. [73] Petkewitz, D. (2004, December). The Select Indicator. Retrieved on
May 20, 2005, from http://www.selecttoolcorp.com/images/pdfs/December%202004%20Select%20Indicator.pdf
[74] Planmatics, Inc. eGovernment Maturity Model. Retrieved on May 20,
2005, from http://www.planmatics.com/products/lemm.cfm [75] Ramos, I., Berry, D. M. & Carvalho, J. A. (2004, September).
Reqirements Engineering for Organizational Transformation. Retrieved August, 2006, from http://se.uwaterloo.ca/~dberry/FTP_SITE/reprints.journals.conferences/ramos.berry.carvalho.ist.pdf

118
[76] Renckly, R. T. (1996). Air University Sampling and Surveying Handbook. Internet Edition.
[77] Rosenberg, M. J. (2001). E-Learning: Strategies for Delivering
Knowledge in the Digital Age. McGraw-Hill. [78] Schellong, A. & Mans, D. (2004). Citizens preferences towards One-
Stop Government. ACM International Conference Proceeding Series Proceedings of the 2004 annual national conference on Digital government research. Retrieved on May 15, 2005, from http://www.dgrc.org/dgo2004/disc/posters/tuesposters/p_schellong.pdf
[79] SEI. (2000, July). The CMM Integration Model (CMMI). Technical
Report (CMMI SE/SW v1.02. CMM/SEI-2000/TR018). Software Engineering Institute, Carnegie Mellon University, Pittsburg.
[80] Singh, H., Das, A. & Joseph, D. (2004, December 12). Country-level
Determinants of e-Government Maturity. 1st pre-ICIS e-Government Workshop, Washington, D.C.
[81] Soon, L. A Comparative Study: Corporate Information Portals and
Corporate Knowledge Portals. Retrieved February, 2006, from http://ausweb.scu.edu.au/awos/papers/refereed/soon/paper.html
[82] Spoolstra, J. C. (1999, April 21). Designing a corporate intranet.
Retrieved November 17, 2005, from http://www.libsci.sc.edu/bob/class/clis724/SpecialLibrariesHandbook/intranet.html
[83] Stowers, G. N. L. Measuring the Performance of e-Government.
Retrieved on December, 2005, from http://www.businessofgovernement.org/pdfsp8493_Stowers_Report.pdf

119
[84] Şandor, S. D. Romanian E-Government. Retrieved on May 20, 2005, from http://unpan1.un.org/intradoc/groups/public/documents/UNTC/UNPAN003862.pdf
[85] Taylor, L. (2003, January 6). Security Policies 101. Intranet Journal.
Retrived March, 2006, from http://www.intranetjournal.com/articles/200301/ij_01_06_03a.html
[86] Taylor, M. (2003). e-BC Strategic Plan: Performance Measures.
British Columbia. Retrieved on May 20, 2005, from http://www.cio.gov.bc.ca/ebc/discussion/Performance_Measures_Report_Final.pdf
[87] Taymaz, H. (1981). Hizmet İçi Eğitim: Kavramlar, İlkeler, Yöntemler.
Ankara Üniversitesi Eğitim Fakültesi Yayınları, No: 94. Ankara: Sevinç Matbaası.
[88] Training program evaluation-training measurement techniques.
Retrieved on May 10, 2006, from http://www.busimessballs.com/trainingprogramevaluation.htm
[89] Tsekos, T. (2006, April 25-27). eGovernment and the Transitional
Countries. 10th NISPAee Annual Conference. Conference Presentation. Retrieved on May 20, 2005, from http://unpan1.un.org/intradoc/groups/public/documents/UNTC/UNPAN003853.pdf#search=%22UN%20Approach%20%22transactional%20web%20presence%22%22
[90] UN World Public Sector Report. (2003). Retrieved on May 20, 2005,
from http://unpan1.un.org/intradoc/groups/public/documents/un/unpan012733 [91] United Nations Publication. (2004, May 31-June 4). Implementing e-
Government: Report of the Regional Workshop. (ST/ESCAP/2342). Bangkok, Retrieved on May 20, 2005, from http://www.unescap.org/icstd/Pubs/st_escap_2342.pdf

120
[92] US Department of Commerce Office of the Chief Information Officer. Information Technology Investment Performance Measurement and Performance Reporting Policy. Retrieved on October 23, 2006, from http://www.osec.doc.gov/cio/oipr/IT_Performance_Measurement
[93] Vaccari, L., Ivanyuckovich, A., Marchese, M. (2005, October 28-30).
A Service Oriented Approach for Geographical Data Sharing. I3E’2005 Conference. Retrieved on May 20, 2005, from http://www.kti.ae.poznan.pl/conferences/i3e/papers/L_Vaccari.pdf#search=%22egoss%20egovernment%20%20Marchese%22
[94] Windley, P. J. (2002, April 25). Annual Technology Report, Utah,
USA. From http://www.utah.gov/cio/docs/2001AnnualReport.doc [95] Wu, L. & Song, Y. (2005). Measuring Integrated Supply Chain
Performance. Services Systems and Services Management. Proceedings of ICSSSM’05. 2005 International Conference on 1, 91-96.

121
APPENDICES
APPENDIX A. LIST OF INTERVIEWED ORGANIZATIONS
Organization Name Adalet Bakanlığı Çalışma ve Sosyal Güvenlik Bakanlığı Devlet Demiryolları Devlet Personel Başkanlığı Devlet Planlama Teşkilatı Devlet Su İşleri Dış Ticaret Müsteşarlığı Emekli Sandığı Emniyet Genel Müdürlüğü Eximbank Gama Holding Gümrük Müsteşarlığı Hazine Müsteşarlığı İşkur Kültür ve Turizm Bakanlığı Merkez Bankası MESA Holding Milli Prodüktivite Merkezi Numune Hastanesi Orta Doğu Teknik Üniversitesi Öğrenci Seçme ve Yerleştirme Merkezi Radyo Televizyon Üst Kurulu Rekabet Kurumu Sağlık Bakanlığı Sermaye Piyasası Kurumu Tapu ve Kadastro Telekominasyon Üst Kurulu Türk Standartları Enstitüsü Ulaştırma Bakanlığı Yibitaş Lafarge

122
APPENDIX B. e-CMM INTERVIEW QUESTIONNAIRE
Düzey 1 Kurum Web Sayfası
Kurum internet baglantisi var mı Kimlik bilgileri Yükleme ve görünüm (erişim hızı, animasyon...) Dolaşım yeteneği (ileri, geri...) Etkileşim (arama, forum, chat...) Anlaşılırlık Kişiselleştirme ve içerik Bilgi kalitesi ve güncellik Güvenlik Degerlendirme yapiliyor mu
2 e-Dönüşüm Stratejileri e-dönüşüm projesi proje planının varlığı e-dönüşüm ekibinin varlığı Proje yöneticisi üst düzey mi? Proje etkinliği konusunda ölçüm yapılıyor mu Üst yönetim desteği BİM'in kurum içindeki hiyerarşisi Üst yönetim insiyatif kullanıyor mu e-dönüşüm projesi için fon/kaynak ayrılmış mı
SWOT veya benzeri bir analiz değişim kararından önce yapıldı mı E-dönüşüm strateji politika belgesi var mı
3 Kurum Bilgi Sistemleri Kurum Bilgi Sistemleri Karar Destek Sistemi Bilgi Belge Yönetim Sistemi Yönetim Bilgi Sistemi Müşteri İlişkileri Yönetim Sistemi Kurumsal Kaynak Planlama Sistemi İnsan Kaynakları
Malzeme Kaynakları Finans Kaynakları Üretim planlama Satış ve dağıtım Kalite yönetimi Önleyici bakım Proje yönetim sistemi Kurum Bilgi sistemleri bütünleşik mi?

123
Düzey
4 Intranet
Kurum intraneti var mı Resmi iç haberleşme intranet yoluyla mı yapılıyor Dosya paylaşımı var mı Sanal toplantı yapılıyor mu Veritabanına ulaşma imkanı var mı Kurum uygulamaları web tabanlı mı İçerik için komite var mı Internetten ulaşım var mı e-imza uygulaması var mı
5 Kurum Altyapısı Kurumdaki kişisel bilgisayar sayısı Kurumdaki sunucu sayısı Kurumdaki e-çalışan sayısı Çalışan sayısı Kurum Bilgisayar okur yazarlık oranı
6 Veri Bilgi Standartları Kurumda Kullanılan veri/bilgi standardı sayısı T.C Kimlik NO Malzeme Kodu Standardı Adres Standardı Diğer Standartlar
7 Müşteri İlişkileri Yönetim Sistemi
Müşteri memnuniyeti/şikayeti araştırması/ölçümlendirilmesi yapılıyor mu Müşteri memnuniyeti/şikayeti kayıt sistemi var mı Müşteri memnuniyeti/şikayeti veri toplama sistemi var mı Veri analizi yapılıyor mu IS ve CRM bütünleşik mi Sipariş emirleri elektronik ortamdan mı alınıyor Ürün ve servislere webden erişim var mı CRM projesi var mı e-commerce yapılıyor mu
8 Kurum içi Eğitim Teknolojileri Kullanımı Bilgisayar destekli eğitim var mı Politika var mı Yönetsel birim var mı Altyapı var mı Program değerlendirmesi yapılıyor mu Program izleniyor mu İçerik hazırlanması yapılıyor mu İçerik değerlendirmesi yapılıyor mu Geri bildirimlerle ölçümleme yapılıyor mu

124
Düzey 9 Proje Yönetim Yaklaşımı
Proje gelişim planı var mı Proje risk değerlendirmesi yapılıyor mu Her projenin grubu var mı
10 Ekstranet Kurum ekstraneti var mı Müşteriler için kişiselleştirilmiş portaller var mı Dış kurumlarla bilgisayar ortamında iletişim sayısı Bilgisayar iletişimi olan kurum sayısı Bilgisayar iletişimi olmayan kurum sayısı Aylık iletişim sığası
11 Güvenlik Politikaları Güvenlik sistemleri Kurumsal güvenlik politikaları Güvenlik düzeyi uygulamaları Güvenlik sertifikası (TSE, ISO)
12 Performans Ölçümü Kalite belgesi var mı Nereden Kalite metrikleri tanımlı mı
Kalite güvence sistemi bilgi/belge yönetim sistemi ile entegre mi
Ölçüm ve uygulamaları yapacak personel eğitimi yapılıyor/yaptırılıyor mu
Kalite yönetim uygulamaları proje yöneticisi tarafından takip ediliyor mu
Kalite yönetim uygulamaları üst yönetim tarafından takip ediliyor mu 13 Devamlı E-Öğrenme
Uzaktan eğitim var mı e-öğrenme politikası var mı Yönetsel birim var mı Altyapı var mı Program değerlendirmesi yapılıyor mu Program izleniyor mu İçerik hazırlanması yapılıyor mu İçerik değerlendirmesi yapılıyor mu Geri bildirimlerle ölçümleme yapılıyor mu
14 Bilgi Belge Yönetim Sistemi Hangi evrağın hangi dairede olduğu tutuluyor mu Bilgiler taranarak bilgisayar ortamına aktarıldı mı Eldeki bilgi/belge üzerinde veri madenciliği yapılıyor mu Akıllı arama özellikleri kullanılıyor mu Kalite güvence sistemi kurumsal veritabanı ile entegre mi

125
Düzey 15 Vatandaş Servisleri
Kurum ana kapısı varlığı Kurum ana kapı düzeyi Kurum ana kapısının biçimsel değerlendirilmesi Verilen Servisler Bilgilendirme Servis Sayısı İşlem yapan servis Sayısı Verilmesi gereken toplam servis sayısı Vatandaş bilgilendirme ve eğitim programlarının varlığı
Vatandaş memnuniyetini ölçecek yöntem ve mekanizmaların varlığı Diğer elektronik servisler SMS Kiosk Sayısal TV
16 Süreç Değişim Yönetimi Devamlı süreç iyileştirme planlaması var mı Süreç iyileştirme hareketine kurumsal bazda katılım var mı Üst yönetim süreç iyileştirme hareketine destek veriyor mu
Süreç iyileştirme hareketi için bölüm yöneticileri eğitim alıyorlar mı
Yöneticiler çalışanlarına iyileştirme eğitimi imkanı sunuyorlar mı 17 Teknoloji Değişim Yönetimi
Teknoloji değişimleri için planlama yapılıyor mu Yeni teknolojiler kuruma uygulanıyor mu Teknolojik yeterliliği arttırabilmek için yazılı politika var mı
Teknolji değişim yönetimi üst yönetim tarafından destekleniyor mu Teknoloji değişim yönetim hareketi için ekip var mı

126
APPENDIX C1: e-CMM LEVEL 2 KEY PRACTICES
Organization Web Page a key process area for Level 2: e-Transformation Vision and Information Technology Capability The purpose of Organization Web Page is to share and disseminate information and to provide the continuity of the communication between the organization and its customers and users. An organization web page has content, layout and navigation purposes. Content is the main source of the web page. Layout is the format including font, color, header, footer and the positioning of the links. Navigation is a structure that makes individual move from one page to another. Organization’s web site involves planning the site, site design, interface design, writing and publishing the pages, and site management. The process of the web site is initiated by the site planning that is consistent with the business strategy or organization type. A project management plan which includes team, budget and time table is formed. Site design involves the information architecture of the site having both the information that conveys meaningful facts and ideas from basic text to animation and functionally to support the interactive services. Interface design is the visual identity of an organization in the virtual world. It includes an easy to use and consistent screens, and combination between colors, design elements and navigation. Writing and publishing involves programming the pages with an appropriate language to view the texts and animation to the user and making the files available in the internet with a suitable standard. Site management includes monitoring the traffic and evaluating the effectiveness when necessary by documenting the problem and developing and tracking an improvement plan.

127
An effective web site begins with the definition of the short- and long-term goals of the site and the description of the intended users. Updating of the web site is periodically made to fit to the environmental and business change.
Goals
Goal 1 The organization develops short-term and long-
term plan for the web site. Goal 2 Information is shared between the other
organizations and users. Goal 3 Accessibility to the organization by publishing
organization’s communication data is increased. Goal 4 The resources for the web site to perform the role
assigned are made available.
Commitment to perform
Commitment 1 The organization follows a documented policy for
coordinating the development and improvement of the organization’s web-site activities.
This policy typically specifies that:
1. The web-site will support the business strategy and organization type.
Examples of organization type include: - individuals, - companies, - education,

128
- government agencies, - non-profit organizations, and - publishers.
Examples of the business strategy for the web-site
include: - want to share opinion with other businesses or
audiences, - promote or sell a product, - promote or sell a service, - access to an information, or - access to a service.
2. The web-site strategy and associated activities
comply with all relevant laws and regulations. 3. Importance of being in a virtual environment that
supports communication flow and transaction.
4. Within wise limits, the resources needed for web-site development will be identified and made available.
5. Requirements for continuous communication and
transaction between the organization and other organizations and users.
6. Requirements for being in the internet world.
7. Requirements for updating the content.
8. Opportunities for being in contact with other
groups and individuals.
9. Effectiveness of the web-site is to be measured,
10. Appropriate web-site management procedures will be defined, documented and used for:
- identifying infrastructure needs to design,
publish and manage the site, - identifying these responsible for solving the
problems of web-site users,

129
- periodically discuss the web-site effectiveness and possible improvements,
- documenting and acting on development needs,
- handling performance and security problems, and
- developing access and security of the web site.
Ability to perform
Ability 1 Individuals responsible for the development and
improvement of the web-site receive the necessary training.
Examples of training related to the web-site include:
- laws and regulations related with web-site content and management, and
- how to use new hardware and software. Refer to the Inter-Organizational Training Program key process area at the Data/Information Standards and Standard Processes level for a description of these practices.
Ability 2 Within wise limits, adequate resources and
funding are provided.
1. Experienced individuals in the design and programming of the web-site are made available.
2. Hardware and software to support web-site design
activities are made available.

130
Activities performed Activity 1 Responsible individuals plan and coordinate the
web-site development and improvement activities in terms of documented policies and procedures.
Activity 2 A project management plan is established for the
design of the web-site.
Project management plan include: - number of staff needed, - staff time needed, - milestones to be met, - cost to be objected, - user satisfaction, - services to be provided, - content to be provided, and - changes in the business structure.
Activity 3 A team to coordinate the development and
improvement of the web-site exists. Activity 4 The members of the team receive training. Activity 5 Information architecture planning for the site
content is planned.
1. The information content from basic text to animation is designed.
2. The functionality that provides interactive services
between the organization and user is discussed. Examples of interactive services include: - chat rooms, - forums, - community, - search engines, - e-mail discussion list,

131
- surveys, and - success stories.
The information content lists:
a logo or branding design in terms of a memorable, cohesive company image according to the target market,
the reason for the users coming to the site, the actions that the users can take, the things to be and not to be included in the
site, leveling between the pages.
Activity 6 Screens in terms of content, organization and
appearance is designed.
1. The information in the web-site is ensured being useful for the audience.
2. The company’s web-site is having links to other
web-sites of the same theme.
3. The colors used in the background and texts are reviewed in terms of readability.
4. Navigation tools are arranged that find and use
easily.
5. The layout of images, text, links and animation is easy to read and understand.
Activity 7 The web site is published as search engine
friendly.
A search engine friendly web site should be easily found in the search engine. Actions that are appropriate are coordinated.

132
The search engine friendly web site has: keywords at the title tag, intelligent meta tags, submitted to relevant search engine, context on every page.
Activity 8 Contact information for users is provided. Examples of contact information include:
- e-mail address of the workers, - company address, - call numbers of the workers, and - fax number of the company.
1. Confirmation from the communication or transaction actions is maintained according to a documented procedure.
The procedure may include: - what kind of confirmation message, - who has access to the action, - how the received messages will be kept, - how the data is collected, - which data is collected, and - how the documentation may be used.
Activity 9 A documented site improvement plan is
developed.
1. The improvement plan lists: 1. the hardware problem(s) that must be
corrected, 2. the software problem(s) that must be
corrected, 3. the security problem(s) that must be
corrected, 4. the actions to be taken to correct these, 5. the expected results in correcting the
problem(s),

133
6. the consequences in case of failure in improvement,
7. log monitoring, 8. traffic monitoring, 9. updating.
2. The site improvement plan is documented. 3. Usability monitoring is done including:
10. how successfully users are interacting with the site,
11. how well the site meeting the needs. Activity 10 User feedbacks and problems are evaluated in
terms of the documented policies and procedures. Measurement and analysis Measurement 1 Measurements are made and used to determine
the effectiveness of the web-site.
Examples of measurements include: - number of incoming links to the site, - time to load a page, - number of visitors visiting the site, - number of visitors doing transaction, - number of visitors to see a particular page, - percent of visitors who click on a particular link, - where visitors click next, - number of repeat visitors, - number of unique visitors, - average time spent on any one page, - how fast users move off site, - ranking of the site in search engines, - number and nature of questions coming to help desk, - attractiveness of the site.
Measurement 2 Measurements are made and used to determine
the functionality and quality of the web-site.

134
Examples of measurements include:
- decrease in cost of paper documentation, - change in the transaction cost, - usage rate of interactive services, - allocated requirements summarized by category (e.g.,
security, usefulness, functionality and appreciation). Verifying implementation Verification 1 The development and improvement activities for
organization’s web-site are reviewed with senior management on a periodic basis.
The aim of periodic reviews by senior management is to obtain a
parallel structure between the company’s business processes and the web-site.
1. The results obtained from technical, cost, staffing
and schedule conditions and performances are reviewed.
2. The old and current situation in the way of doing
business is verified.
3. Trends related with web-site issues are discussed.
4. Project risks are addressed.
5. The number of raised and resolved internal and external problems is reviewed.
Verification 2 A responsible individual(s) verifies that activities
related to the web-site development and

135
improvement are conducted according to the organization’s documented policies.
1. Intended users are reviewed. 2. Project risks are addressed.
3. Critical resource usage is reviewed.
4. Web-site development and improvement activities
comply with the organization’s stated values, policies, and documented procedures are reviewed.
Verification 3 Experts independent from the company
periodically review and evaluate the design and effectiveness of the web-site.

136
Vision and Politics Definition for e-Transformation Project a key process area for Level 2: e-Transformation Vision and Information Technology Capability The purpose of Vision and Politics Definition for e-Transformation Project is to establish an improvement in the core operations of the organization by adapting the business to changing conditions. With the help of information technology, business done is done more efficiently while obtaining an economic return. e-Transformation project involves the modernization in management, customer-focused service, social transformation and qualified communication infrastructure. Whole and balancing approach including the customer, organization and government are taken into consideration all in once. Establishing effective e-transformation project begins with assimilating the transformation goals effectively from top-down and bottom-up within the organization. The transformation strategy is ensured that the strategies comply with all laws and regulations. New facilities and tools are made available to reach the goals. Improvements in the business processes are identified and prioritized. Resistances to the changes are minimized.
Goals
Goal 1 Future state of the organization is determined. Goal 2 The way to get from current state to future state is
defined. Goal 3 Organization readiness for the transformation is
built. Goal 4 Business processes are standardized.

137
Commitment to perform Commitment 1 A project manager is designated for the
development of the e-transformation project. Commitment 2 The organization follows a documented policy for
coordinating the e-transformation activities. This policy typically specifies that:
1. e-Transformation project’s commitments are negotiated between:
the project manager, and executive manager.
2. The values of the organization are clarified. 3. The culture of the organization for the readiness to
change is determined.
4. The roles and the responsibilities of the organization are identified.
5. Milestones to be satisfied are determined.
6. Metrics to determine the level of goals reached are
explained.
7. Feedback methods are identified.
Ability to perform
Ability 1 Individuals responsible for the e-Transformation
development and improvement receive the necessary training.
Ability 2 Individuals in the organization receive training for
the development and implementation of e-Transformation project.

138
Activities performed Activity 1 Responsible individuals plan and coordinate the
e-transformation strategy development and improvement activities in terms of documented policies and procedures.
This procedure typically specifies that:
1. Current business situation is evaluated based on:
benchmarking studies, shareholder interviews, questionnaires to customers, and teams formed for inside evaluation.
2. Scenarios are formed based on:
shareholder interviews, and similar project evaluations.
3. Scenarios are evaluated based on:
workshops, and shareholder interviews.
Activity 2 e-Business applications are developed.
1. Business to Business (B2B) activities are developed. Data transformation should be obtained.
Virtual private network (VPN) may be established for the cost effective communication between the parties.
2. B2C (Business to Customer) catalogs are designed.
3. B2G (Business to Government) catalogs are
designed.
Activity 3 Investment to human resources is done.
1. Computer literacy rate is increased.

139
2. Portability of the workers is maintained.
Portability includes: - terminals to reach to information, and - virtual environment.
Measurement and analysis Measurement 1 Measurements are made and used to determine
the effectiveness of e-Transformation project.
Verifying implementation Verification 1 The development and improvement activities for
organization’s e-Transformation processes are reviewed with senior management on a periodic basis.
Verification 2 A responsible individual(s) verifies that activities
related to the e-Transformation are conducted according to the organization’s documented policies.

140
Organization Information Systems a key process area for Level 2: e-Transformation Vision and Information Technology Capability The purpose of Organization Information Systems is to help the managers take right decision at the right time focusing on internal efficiency and effectiveness of operations. Organization information systems involves the integration and standardization of the resources of the organization.
Goals Goal 1 Right decision making is determined. Goal 2 Communication with the data with the related
individual is determined.
Commitment to perform
Commitment 1 A manager is designated for the development of
the information systems within the organization. Commitment 2 The organization follows a documented policy for
coordinating the information systems activities. This policy typically specifies that:
1. The kind of data transformed is determined.
2. The position of the individuals using the data is identified.
3. Kind of reporting is determined.

141
4. Feedback methods are identified.
Ability to perform
Ability 1 Individuals responsible for the information
systems development and improvement receive the necessary training.
Ability 2 Adequate resources and funding is provided for
the construction of information systems. Activities performed
Activity 1 Responsible individuals plan and coordinate the
information systems development and improvement activities in terms of documented policies and procedures.
Activity 2 Information technology infrastructure is
developed.
1. Necessary hardware for the inside and outside communication is developed.
2. Necessary software for the inside and outside
communication is developed.
Activity 3 Business strategies are changed and developed.
1. For the integration of the business systems enterprise resource planning (ERP) system is used.
2. Modules of the ERP system are integrated for data
communication.

142
3. Customer relationship management (CRM) system is used, if necessary, for better product or services development by centralizing to the customers.
Activity 4 e-Business applications are developed.
1. Business to Business (B2B) activities are developed. Data transformation should be obtained.
Virtual private network (VPN) may be established for the cost effective communication between the parties.
2. B2C (Business to Customer) catalogs are designed.
3. B2G (Business to Government) catalogs are
designed.
Activity 5 Investment to human resources is done.
1. Computer literacy rate is increased.
Measurement and analysis
Measurement 1 Measurements are made and used to determine
the effective usage of information systems. Verifying implementation Verification 1 The development activities for organization’s
information systems are reviewed with senior management on a periodic basis.
The aim of periodic reviews by senior management is
to obtain a parallel structure between the company’s business processes and the web-site.

143
1. The results obtained from technical, cost, staffing and schedule conditions and performances are reviewed.
2. The old and current situation in the way of doing
business is verified.
3. The number of raised and resolved internal and external problems is reviewed.

144
Intranet a key process area for Level 2: e-Transformation Vision and Information Technology Capability The purpose of intranet is to facilitate the storage and communication of data, information, knowledge, wisdom and ideas through out an organization [81]. Intranet usage also facilitates group or team working and every means of communication. Intranet involves establishing effective top-down and bottom-up knowledge management and creation mechanisms within the organization, ensuring that all the individuals share their information with each other by using transaction activities properly, conduct education and training activities efficiently [21, 50, 51]. Establishing effective intranet begins with integrating the values, policies and procedures of the organization. Business processes and workflow become clear due to the movement of workload through seamless processes that individuals might have responsibilities of the different parts of the processes [82].
Goals
Goal 1 The information used and individuals’ and groups’
needs are analyzed. Goal 2 Individuals share knowledge by publishing the
information. Goal 3 Individuals access the corporate holdings,
archives of corporate data. Goal 4 An efficient communication channel is provided. Goal 5 Business information and processes and
knowledge are centralized.

145
Goal 6 Intranet is used as a supporting tool for inter-organizational training and continuous e-learning requirements.
Commitment to perform
Commitment 1 The organization follows a documented policy for
the successful creation, development, implementation, adoption and usage of information.
This policy typically specifies that:
1. The mission of the organization in using the site. 2. Business, processes are integrated with site
identified mission.
3. The content of the publication is determined.
4. The content is renewed.
5. Content owners are identified.
Examples for content owners include: - business groups, - IT sections, - authors, - senior management, - end users, - steering committee.
6. The way of individuals to share and use knowledge for work.

146
7. The way of individuals to report, share workload and build a reliable work relationship with the other individuals in the organization.
8. The way of individuals treated as knowledge work.
Refer to the Information/Document Management System key process area at the Integrated Web Services level for a description of these practices.
9. Statements about the page formats generated are described.
Examples of page formats include: - Hyper text markup language, - cascading style sheets, - extensible markup language, - graphic formats, - scripting limitations, - bandwidth considerations.
10. Expiration and/or revision of information are
described.
11. Life cycle duration of the intranet is estimated.
12. Management of the site during the active life cycle is planned.
Examples of the management of the site include: - date of issue, - scope, - approval authoring, - schedules, - estimates,

147
- resources, - responsibilities, - risks, - quality control measures, - cost, - interface design, - training, - glossary, and - change procedures and history.
13. Permanent archival of the content is identified.
14. Changes in the technology in devices’
communication way and screen display area is considered for minimizing the reengineering of the site.
Examples of devices changing technologically include: - personal digital assistants (PDAs), - video enhanced telephones, - tv devices with web interfaces, and - mobile devices.
Examples of communication way include: - satellite links, and - wireless channel bandwidth . - mobile devices.
15. Privacy considerations are defined.
Examples of privacy considerations include: - individual’s personal data, and - end-user data collection . - mobile devices.

148
16. Site or page relocation situations are described.
17. Maintenance of the site during the active life cycle is planned.
Examples for the maintenance activities include: - eliminating obsolete information or services, - updating the status of information of services’ - periodically validating links, - periodically updating of the content in compliance
with applicable standards, - considering individuals preferences on presentation
of the site, - backups, and - archiving.
18. A point of contact for the site is provided for the individuals using the site in case of a problem for the site or content.
19. Header information for publishing the page is defined.
Examples of header information include: - page title to distinguish the content, and - metadata for cataloguing and indexing the pages .
20. The way of satisfying the authentication and integrity of the page application is described. 21. Organizational security characteristics of the page content is indicated.

149
Examples of security characteristics of the page content
include: - security banners, - passwords, and - encryption.
22. Ownership of the published document is defined.
Ability to perform
Ability 1 Responsible group(s) is determined for the
creation and maintenance of the intranet.
Examples of group members who should assist on the creation and maintenance of the intranet include: - web developer from the library staff, - information designer from the library staff, and - consultant.
Ability 2 Adequate resources and funding are provided for
performing intranet activities.
1. An editor for the design stage is determined for editing.
2. The client environment of target-individual using
the intranet is evaluated.
Examples of client environment include:
- diversity of browsers, - script usage, - graphic usage, - display devices’

150
- bandwidth connectivity.
3. Security of the content is defined to keep the data and
information safe from outside intruders. 4. Hardware and software requirements are
maintained to satisfy the client/server network. 5. Adequate funding is made available for intranet-
related activities. Ability 3 Individuals using the intranet activities are trained.
Activities performed
Activity 1 Documents are designed for online use.
1. Information is divided into smaller modules for the easy access to information and manageability and reusability of information.
2. Pieces of information is arranged for easy to read.
Examples of arrangement include: - short paragraphs,
- sub-headings, - white spaces, and - lists.
3. Levels of information is arranged hierarchically. Activity 2 Design standards and guidelines are designed
consistently for the easy access of the individual(s) and / or groups.

151
1. Design standards are determined by the organization.
2. Template is created. 3. The project is evaluated and discussed for future applications.
Activity 3 The homepage is designed to reach to intranet.
1. Information is grouped logically.
2. Textual descriptions are added to help the selection.
3. Web-site map is designed.
4. Add facilities to search for specific information in
the site.
5. Information is filtered by assigning individual logging on to the site that only the relevant information for the individual is seen.
6. A prototype is created to check the work of the
overall layout and the meaning of the flow of pages.
7. A usability test with actual users is done to confirm
the validity of the layout, flow of the pages and information architecture.
8. Design is refined until completing the interface.
Activity 4 Knowledge map is designed to indicate the design of departments.
Activity 5 Document management system is constructed to
manage large numbers of documents with version control, revision tracking, search and retrieval purposes.

152
Activity 6 Information exchange medium is established by forms and search engines.
Activity 7 Intranet is used as a project management tool.
1. Workflow processes are automated. 2. Automatic responses are given by indicating the
next steps to be followed.
3. Requests are logged in the database.
4. The individual working in a certain project is queried.
5. The individual(s) updates the database by entering
the required information about the new project.
6. Status of the project is tracked from the database. Activity 8 Transactional activity is increased. Examples of transactional activities include:
- collaboration between the users by participating in discussion groups and using online whiteboards ,
- add and change information, - e-learning activities, - conducting transactions by means of submitting forms,
and - access to other systems used within the organization.
Activity 9 User support team is established.
User support team helps user’s while using the intranet activities if user faces with a problem
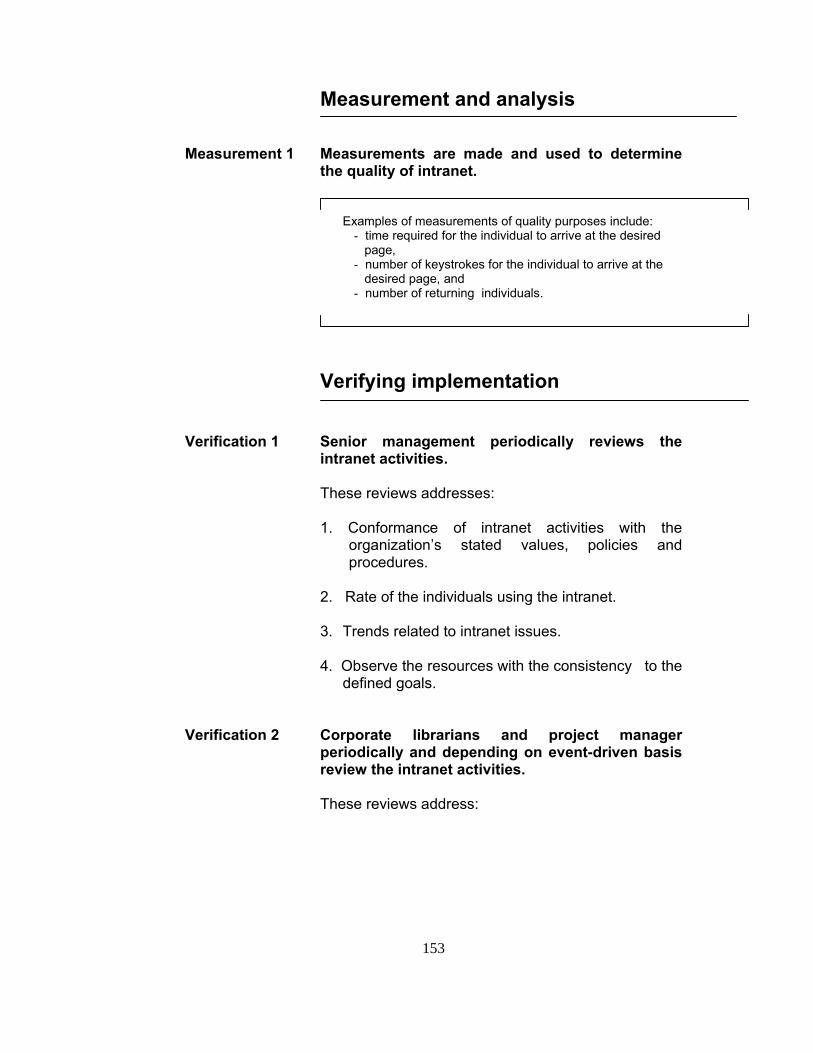
153
Measurement and analysis Measurement 1 Measurements are made and used to determine
the quality of intranet.
Examples of measurements of quality purposes include: - time required for the individual to arrive at the desired page, - number of keystrokes for the individual to arrive at the desired page, and - number of returning individuals.
Verifying implementation Verification 1 Senior management periodically reviews the
intranet activities. These reviews addresses:
1. Conformance of intranet activities with the organization’s stated values, policies and procedures.
2. Rate of the individuals using the intranet.
3. Trends related to intranet issues.
4. Observe the resources with the consistency to the defined goals.
Verification 2 Corporate librarians and project manager
periodically and depending on event-driven basis review the intranet activities.
These reviews address:

154
1. Conformance of the delivery and dissemination information and services to individuals.
2. Conformance of the quality of data.
3. Consistency of the intranet across sections.
4. Status of content.
Verification 3 User feedbacks are collected periodically and
evaluated to improve and upgrade the intranet materials and services.
Examples of the collection of user feedbacks include: - survey questionnaire, - small group focus session - design walkthrough - email lists, - usability test, and - detailed statistical analysis of use patterns.

155
Information Technology Infrastructure a key process area for Level 2: e-Transformation Vision and Information Technology Capability The purpose of Information Technology Infrastructure is to establish systems and processes for directing and managing work. The organization’s mission, vision, values and critical success factors form basis to organizational infrastructure. The focus is on arranging the management and decision making process, having standards to maximize the data efficiency, information technology infrastructure including both hardware and software by having a structured approach. Organization infrastructure involves strategy, systems, measurements and rewards [75]. It is ensured that the business information is delivered on the right time to the right person to take the right decision. It is important to have standardizing on software, hardware acquisition, performance assessment of hardware and software and consistent system administration.
Goals
Goal 1 Communication between the individuals is
satisfied. Goal 2 Interoperability between the systems and
applications are provided. Goal 3 Technology infrastructure is provided on reduced
number of platforms.
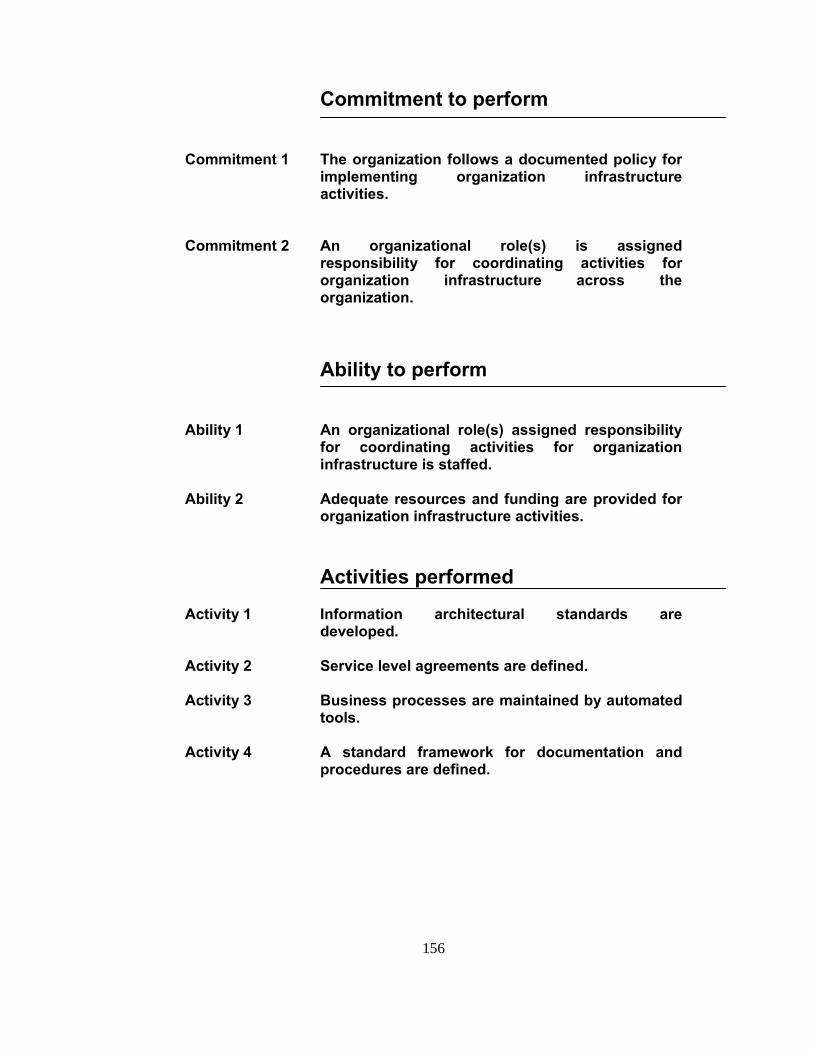
156
Commitment to perform
Commitment 1 The organization follows a documented policy for
implementing organization infrastructure activities.
Commitment 2 An organizational role(s) is assigned responsibility for coordinating activities for organization infrastructure across the organization.
Ability to perform
Ability 1 An organizational role(s) assigned responsibility
for coordinating activities for organization infrastructure is staffed.
Ability 2 Adequate resources and funding are provided for
organization infrastructure activities.
Activities performed
Activity 1 Information architectural standards are
developed. Activity 2 Service level agreements are defined. Activity 3 Business processes are maintained by automated
tools. Activity 4 A standard framework for documentation and
procedures are defined.

157
Measurement and analysis Measurement 1 Measurements are made and used to determine
the status of activities for organization infrastructure.
Verifying implementation Verification 1 A responsible individual(s) verifies that
infrastructure development activities are conducted according to plan and the organization’s documented policies.
Verification 2 The organization’s effectiveness in infrastructure
implementation is periodically reviewed by senior management.

158
APPENDIX C2: e-CMM LEVEL 3 KEY PRACTICES
Data/Information Standards a key process area for Level 3: Customer/Citizen Centered and Data Standards The purpose of Data/Information Standards is the organization of information in a structured fashion for accurate recording, clear processing and right evaluation of data. Data/information standards involves diversification of entities according to user groups, classification of data and data quality measurements [93].
Goals
Goal 1 Data quality is provided. Goal 2 Acquire increase in system performance. Goal 3 Data redundancy is reduced.
Commitment to perform
Commitment 1 The organization follows a documented policy for the
improvement, identification and correction of faulty data.
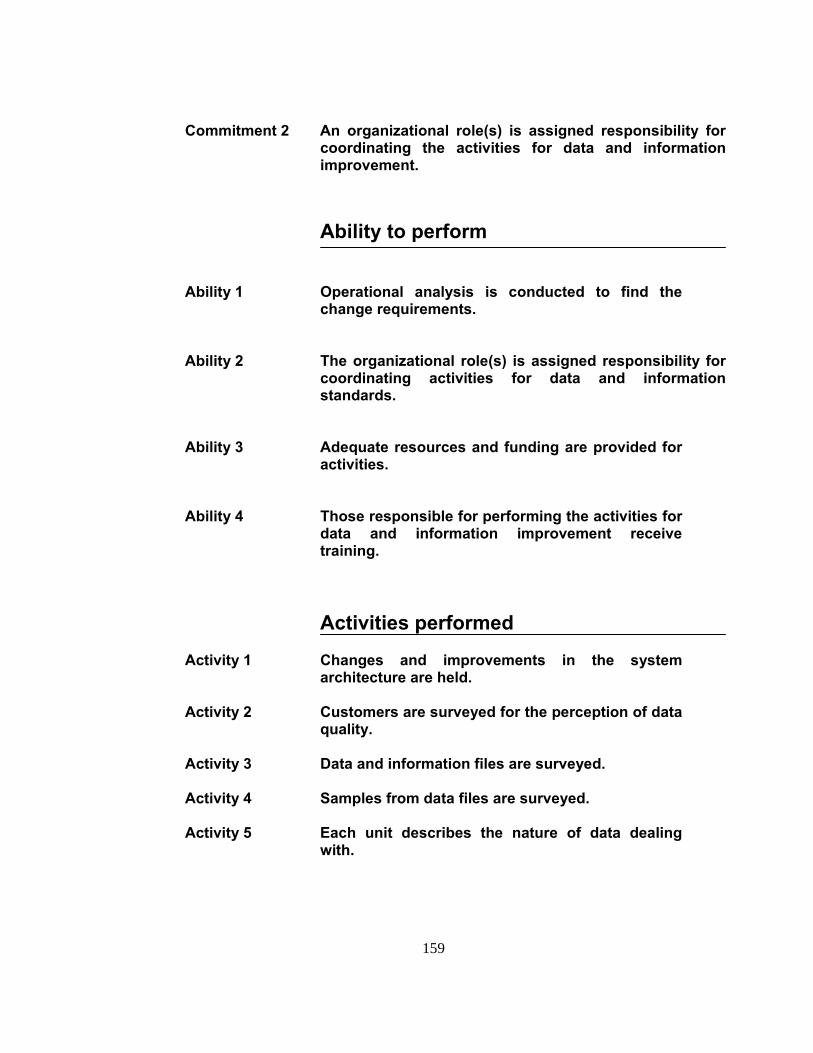
159
Commitment 2 An organizational role(s) is assigned responsibility for
coordinating the activities for data and information improvement. Ability to perform
Ability 1 Operational analysis is conducted to find the
change requirements. Ability 2 The organizational role(s) is assigned responsibility for
coordinating activities for data and information standards.
Ability 3 Adequate resources and funding are provided for
activities. Ability 4 Those responsible for performing the activities for
data and information improvement receive training.
Activities performed
Activity 1 Changes and improvements in the system
architecture are held. Activity 2 Customers are surveyed for the perception of data
quality. Activity 3 Data and information files are surveyed. Activity 4 Samples from data files are surveyed. Activity 5 Each unit describes the nature of data dealing
with.

160
Measurement and analysis Measurement 1 Measurements are made and used to determine
the improvements in data quality. Verifying implementation Verification 1 The organization’s effectiveness in implementing
activities for data and information standards is periodically reviewed by senior management.
Verification 2 A responsible individual(s) verifies that activities
for data and information standards are conducted according to the organization’s documented policies.

161
Customer Relationship Management System a key process area for Level 3: Customer/Citizen Centered and Data Standards The purpose of Customer Relationship Management System (CRMS) is to design the organization based on customer-centric capabilities and link business processes from customers through suppliers by differentiation of the organization [55]. Analysis of the customer data, profiles, and history helps to get information about the customer and support in the organization’s core processes [44]. Customer Relationship Management is a long term project to gain the customer loyalty to the organization. CRM project requires step-wise evolution, organizational redesign, integrated system architecture of standard components, change management and top management support [5]. CRM requires cross-functional working which requires change in the way of doing business and culture. That barrier needs to be handles carefully for the organizational success. CRM begins the customer identification. Internal and external customers of the organization might benefit from customer centric activities. CRM processes involve customer life cycle analysis and knowledge management [15]. Customer life cycle analysis defines the relationship between the customer behavior and the services provided to the customer by the organization. For a successful customer-organization interact, the data obtained for customer should be converted to information by adding context and facts to data. Decision makers use that information to determine personalization capabilities. That knowledge occurred is converted to corporate wisdom to by taking actions for application.

162
Goals
Goal 1 Provide personalized products and value added
services. Goal 2 Acquire and retain customers by providing them
value. Commitment to perform
Commitment 1 The organization follows a documented policy for
coordinating the development and implementation of the customer focused and oriented activities.
This policy typically specifies that:
2. The CRM strategy and associated activities comply with all relevant laws and regulations.
3. Within wise limits, the resources needed for CRM project development will be identified and made available.
4. CRM vision and strategy.
5. Requirements for interaction within the
organization. 6. The distinction between the application areas and
the activities to be performed.
Fayerman (as cited in [5]) makes a distinction between
three areas for CRM implementation: - Operational CRM to support the front office
processes; such that, call center, help desk. - Analytical CRM makes analysis and produce
information for the customer segment and behavior by the help of statistical methods.
- Collaborative CRM focuses on the customer integration by using organization’s services.

163
7. The precautions to be taken for the resistance for
the changes in the organization culture. 8. Improvement in the organizational processes and
technology.
Refer to Process Change Management key process area and Technology Change Management key process area at the Change Management level for a description of these practices.
9. The phases of the implementation of CRMS. 10. CRM activities are centralized and standardized.
11. Handling customer requests.
12. Measurement system to determine the efficiency
of the applications on customers.
13. Quantified CRM effects. Commitment 2 An organizational role(s) is assigned responsibility for
coordinating the activities for customer centered activities across the organization.
Examples of how the customer centered activities might be coordinated across the organization include: - a committee reviewing recommendations
submitted by customers for improvements in the products or services,
- specialists researching to build a market position against competitors depending on customer requirements, personalization activities and communications through customers,

164
- a team of experts to develop innovative practices.
Ability to perform
Ability 1 Business analysis is conducted to find the change
requirements. Ability 2 All the units in the organization are coordinated
for CRM project. Ability 3 The organizational role(s) is assigned responsibility for
coordinating activities for customer centered activities is staffed.
The role(s) coordinates and helps to:
1. Review suggested improvements by customers. 2. Acquire and install new technologies and practices
related with CRM.
3. Communicate and coordinate with researchers on new developments in the products or services and technologies that may have potential benefit for communicating with customer.
Ability 4 Adequate resources and funding are provided for
the planned activities for customer centered activities.
1. Experienced individuals with expertise in specialized areas are available to help in evaluating, planning and supporting customer centered practices.
2. Tools to support CRMS are made available.

165
Examples of tools to support CRMS include: - software, - design technology - communication technology, - data storage and analysis technology.
3. Time and support is made available for evaluating suggestions and conducting trial efforts.
4. Funding and resources are available to support the
infrastructure needed to install and maintain advanced CRM practices and technology.
Ability 5 Those responsible for performing the activities for
CRM receive training in relevant evaluation methods and continuous improvement techniques.
Examples of relevant methods and techniques include: - continuous improvement techniques, - change management, - technology evaluation, - advanced data analysis techniques.
Ability 6 Individuals receive training or orientation in CRM
practices and technologies adopted by the organization.
Activities performed
Activity 1 Changes and improvements in the system
architecture are held.
1. Customer database is centralized.
2. Customer focused applications are integrated.

166
3. Portals are integrated. Activity 2 Customer contact points are managed.
Examples of the customer contact point include: - telephone, - e-mail, - face-to-face, - letter, and - portal.
Activity 3 Customer focused processes are redesigned to
provide efficient and true customer data. Activity 4 High-level plan or architecture is created to define
the ultimate product or the environment for service operations.
In CRM operations, the high-level roadmap is called Corporate Information Factory (CIF). CIF delivers “business intelligence and business management capabilities driven by data provided from business operations [44]. CIF has three business functions: - Business Operations: are the collection of
systems that are used for the core operational systems to run day-to-day business processes. Examples of business operations include:
- billing systems, - product systems, - order entry systems, - accounting systems, - enterprise resource systems (ERP), - call center systems.
Also external sources such as competitors’ data, demographic data, and notes are included to business operations. The data used in business operations should be rich and accurate for successful analysis.
- Business Intelligence: is the ability to analyze data and information to support strategic decision. Data warehouse systems, data marts, decision support interface and the

167
- processes used for data entry and data exit are the components of business intelligence.
- Business Management: Operational data store (ODS) which is accessible from anywhere in the organization is used for integrated and updated data. With the help of these data, tactical decision making occurs.
Activity 5 Implementation, development and improvement of
CRMS is taken as a project.
1. Customer-focused business strategies are set and distributed through the whole organization.
2. CRM activities are planned. 3. Evaluation criteria for CRMS are defined.
Examples of the evaluation criteria include: - functionality, - product maturity, - integration capability, - modularity of the solution.
4. Appropriate software is selected for the analyses of customer information and implementation of CRM project.
5. Pilot studies are run out to evaluate the efficiency if
the steps taken for customer focused processes. Activity 6 Transformation map and standards relating to
each unit’s workings are designed.
Studies show that marketing, sales and service activities of the organization is most vulnerable to changes in case of a CRM project.

168
Activity 7 Customer feedback is determined.
Examples of getting customer feedback include: - request letters, - e-mail, - survey, - questionnaires, - requests from web sites, - feedback.
1. Customer data are collected. 2. Data obtained is analyzed and segmented to
define the customer relationship with the business.
Examples of data obtained include: - type of activity, - volume of activity, - socio-demographic data, - geographical data.
Examples of customer behavior include: - needs, - preferences.
Examples of data analysis methods include: - data warehouse - data marts. Data warehouse is the central point of data integration. Life time value of a customer is obtained by the analysis of customer, product, and usage data. Data mart is customized and/or summarized data derived from data warehouse. Patterns and next best action information is obtained by using data mart.

169
3. Knowledge is gained from data segmentation is combined with customer touch-points.
4. Responsibility for the customers of each unit is
redesigned depending on the customer segmentation.
5. Customer behavior is predicted. 6. Necessary precautions to eliminate the unsatisfied
points are taken.
7. Satisfied points are improved. Activity 8 Automatic response is generated for customers
waiting for a service. Activity 9 Information obtained from customer analysis is
used for forecasting. Activity 10 Ways for customer communication is identified.
Ways of communication changes depending on the market and the business of the organization. Examples of ways of customer communication include: - offering sales at certain products at certain
times, - tracking of the customer in the portal to
promote sales or give detailed information about the product requested,
- handling transactions. Activity 11 Customer centric processes are developed. Activity 12 Customer centric processes are integrated into
daily operations. Activity 13 Transformation in the culture, structures and
behaviors of the individuals in the organization is planned.

170
Activity 14 To make CRM applications successful, data and information management and supporting IT infrastructure is needed.
Refer to Information/Document Management System key process area at the Integrated Web Services level for a description of data and information management practices.
Activity 15 Training of CRM team is focused on on-self-
training and online documentation.
Measurement and analysis Measurement 1 Measurements are made and used to determine
the effects of CRM activities to the organization.
Examples of measurements include: - reduction in throughput time, - higher efficiency in operations, - increase in customer satisfaction, - reduction in the number of complaints,.
Measurement 2 Measurements are made and used to determine
the value of activities for CRM.
Examples of measurements to determine the value of CRM
practices and technologies include: - the impact of improvements in the organization’s position in the market; - the impact of each CRM activities on improving the efficiency of customer centered activities;

171
- the impact of each CRM activity on increasing the organization’s capability in one or more of its core competencies.
Verifying implementation Verification 1 The organization’s effectiveness in implementing
activities for CRM is periodically reviewed by senior management.
These reviews verify the:
1. Appropriateness of the activities for CRM. 2. Progress in performing the activities for CRM.
3. Results from reviews of the activities for CRM
activities against the organization’s stated values and appropriate policies.
4. Status of resolution for noncompliance issues.
Verification 2 A responsible individual(s) verifies that activities
for CRM are conducted according to the organization’s documented policies.
These reviews verify that:
1. The activities for CRM comply with the organization’s policies and stated values.
2. Noncompliance items are handled appropriately.
3. All actions related to CRM activities are
periodically reviewed to ensure that they conform to all relevant laws and regulations.

172
Inter-Organizational Training Technologies a key process area for Level 3: Customer/Citizen Centered and Data Standards The purpose of Inter-Organizational Training Technologies is to ensure that the individuals get the necessary information, ability and behavior systematically to continuously perform their duties by training [34]. Inter-organizational training involves the establishment of the training requirement of the individuals. Short and long term planning, evaluation of the individual during and at the end of the training, and publishing the necessary publications and making available the necessary resources are included in inter-organizational training [87, 88]. Organizations establish an education unit to provide organize and evaluate the training activities [88].
Goals
Goal 1 Individuals are brought to a position to perform
their duties better. Goal 2 The need for inter-organizational training is
obtained.
Commitment to perform
Commitment 1 The organization follows a documented policy for
its inter-organizational training activities.

173
This policy typically specifies that:
1. Inter-organizational training goals, benefits and results are defined.
2. Priorities in the inter-organizational training
programs are identified for the short and long term planning.
3. The levels in the organization, the degree of duties and responsibilities and the relationship between them is defined.
4. Necessary skills and requirements for the positions
are identified.
5. The professional and individual characteristics of the individuals for each level of the organization is defined.
6. Training activities serve the business objectives
and stated values of the organization.
Commitment 2 An organizational role(s) is assigned responsibility for assisting and advising units on training activities.
Examples of individuals who might assist or advise units
on training activities include: - members of the training staff,
- managers, - supervisors, - specialists, - consumers, and - members of the professional institutions.

174
Ability to perform
Ability 1 The requirement for the inter-organizational
training is obtained.
The requirement definition is done to eliminate the difference between the individuals’ presently having and for the individual to gain necessary competencies.
Examples of requirements for the inter-organizational training
include: - getting a new individual to the organization,
- promotion of the individual, - change in the production materials equipment, and - change in the individuals job or position.
1. The requirements for the inter-organizational
training are obtained from the records and reports.
Examples of records and reports that could be helpful in the requirement definition of the inter-organizational training include: - related rules, regulations and instructions, - audit reports, - manager’ s end-of year reports, - maintenance and repair reports, - accidents and health reports, - correspondences related to individuals, - complaints and requests, - production and consumption reports, - research reports, and - discipline events and decisions.

175
Ability 2 Each unit’s responsibility for the training is determined.
Ability 3 Adequate resources and funding are provided for
implementing the inter-organizational training activities.
1. Experienced individuals are made available for
conducting training and/or training-related activities.
Experienced individual responsible with the inter-organizational training is responsible with: - the indication of the definition, principle and properties, benefits and constraints of inter-organizational training - the definition and analysis of the job description with the related departments, - and/ or units, - choosing and applying of the proper training techniques, - the preparation of the short-and long-term training program, - making the environment suitable for the application of the training program by using human and material resources, - evaluation of the training program and trained individual, - reporting the results of the training program.
2. The requirements of the individuals and experienced individuals are satisfied.
Examples of the requirements of the individuals and experienced individuals include: - feeding, and
- social activities.
3. Tools and instruments to support training activities are made available.
4. Adequate facilities are made available.

176
Examples of facilities for training include: - buildings constructed or bought for training purposes, - classes - laboratories, - workshops, - dormitories, and - dining hall.
5. Transfer expenses are made available.
In some cases, individuals get the necessary training from outside of the organization, in or out of the country. In that case scholarship for in-home or abroad training, wage and living experiences should be identified.
Ability 4 Training time for each training program is
determined. Ability 5 Training time is made available for each
individual. Ability 6 The individuals getting the training are
determined.
1. The necessary announcements are done 2. The individuals are grouped accordingly. Activities performed
Activity 1 Critical skills required for performing activities are
identified for the individuals in the organization.

177
For the identification of the critical skill; the steps specified are:
1. Identification individual’s duties or position title,
2. Separation of the individual’s duties of areas,
3. Identification of the jobs and duties for each area,
4. Ordering of the steps needed for each duty,
5. Identification of the basic knowledge, skill and
behavior for each duty. Activity 2 Short and long-term plans are developed to
satisfy the individuals training requirements Activity 3 Training programs are prepared and developed.
1. Assessment of the qualifications necessary for the position and qualifications of the individual.
2. Assessment for the necessities for inter-
organizational training. 3. Evaluation of the methods and tools for training.
4. Planning and development of training program.
Examples for the way of the development of the training
program include: - examination and review of written resources, - questionnaire to managers, - interview with the trained individuals, - tracking and asking the individual for the way of
doing work, and - observing of the individual doing the work.
____________________________________________ 5. Pre-evaluation of the training for development.
6. Evaluation of the individual.

178
Activity 4 Individuals responsible for training are developed training program.
The training program typically develops as:
1. Obtain the necessities for inter-organizational training.
Obtaining the necessities of training, beneficial steps to
be followed are:
- Analysis of the short and long- term strategies of the organization,
- Gap analysis between the qualifications having and should have of the individuals
- Reporting two needs assessment for training after gap analysis
___________________________________________ 2. Preparation of the training plan and program.
Works done during the preparation include: - determine the funds and resources , - prepare the annual content, - determine the scope of job and profession - determine the individuals for giving training, and - cooperation with the units need training.
___________________________________________
Funds and resources are determined for: - investments, - scholarships, and - current accounting.
___________________________________________ 3. Application of the training program
During the application of the program include: - satisfying necessary resources - starting application of the training program, - pre-evaluating and measuring of the program and
content, - supporting the individuals morale,

179
- provide the continuation of the individuals to the training program,
- copying and distributing necessary resources. - cooperation with the units need training.
___________________________________________ 4. Evaluation of the training.
Examples for the evaluation includes: - feedback of the individuals trained, - determining the level of the aim achieved, - determining the missing and faults, and - coordination of the modifications.
___________________________________________ Activity 5 Inter-organizational training methods are
identified. Examples for inter-organizational training method
include: - classroom instructions, - discussions, - demonstrations, - on the job/ on the site training, - group discussion method, - case study evaluation method, - in-basket method, - role playing, - practice programs, - forums, - symposiums, and - panels.
___________________________________________
Measurement and analysis Measurement 1 Measurements are made and used to determine
the status of training activities within each unit. Examples of measurements include: - determine the success and development of trained
individuals,

180
- determine the differences before and after training , in terms of the individuals gained competences,
- evaluate the feedbacks of the individuals trained and related,
- individuals, - identify the extent of the training needs objectives
achieved, - identify the extent of the individuals objectives
achieved, and - identify the degree of success of the individuals in implementing the learning , - determine the number of classes taught, - determine the new knowledge occurred, - determine the increase in skills, - determine the trained satisfaction with training, - determine the unit cost per number of trained
individual. ___________________________________________
Examples of measurement methods include: - written tests, - oral tests, - performance tests, and - observation tests.
Examples of evaluation instruments include: - reaction of the individuals about the program, - questionnaire, and - grades.
Measurement 2 Unit measures of training status are collected and
aggregated at the organizational level.
1. Passive usage of the system is tracked and analyzed in a historical database
2. Training data are periodically analyzed to
determined trends.

181
Measurement 3 Individual(s) responsible with the training are evaluated the training process after the completion of the program.
These evaluations verify that:
1. Implementation of the learning after the training of the individual are supported.
2. Cost-value effectiveness of the training is
assessed. Verifying implementation Verification 1 A responsible individual(s) verifies that training
activities are conducted according to the units plan and the organization’s documented policies.
These reviews verify that:
1. Training needs identification and objectives comply with the organizations short and long-term plans.
2. Training activities are performed according to the
units plans and selected methods. Verification 2 The individual(s) responsible with the training
periodically reviews the training needs and program application.
These reviews verify:
1. The maintenance of support in the planning and implementation of the program.
2. The introduction and maintenance of evaluation systems.
3. The introduction of regular reports to senior
management.

182
Verification 3 Senior management periodically reviews the need
and value of training to the organization. These reviews verify that:
1. The amount and effectiveness of the training provided.
2. The support of the training plans.
3. Results of the regular summary reports and
evaluations.
4. Organizational policy and strategic decisions based on evaluation results.

183
Project Management Concepts a key process area for Level 3: Customer/Citizen Centered and Data Standards The purpose of Project Management Concepts is to increase the capabilities of the organization by using project management skills and knowledge in dealing with planning, schedule, cost, scope, risk, human resources and stakeholders properly to deliver the projects on time, within budget containing the solutions for customer satisfaction [13]. Project management activities in e-Transforming organizations involve the requirements describing the project deliverables or products the customer expects, determining the general scope of the project and risk identification.
Goals
Goal 1 Ensure that the customer requirements are
satisfied within the constraints. Goal 2 Project activities are controlled.
Commitment to perform
Commitment 1 The organization follows a documented policy for
it project management activities. This policy typically specifies:
1. Project management activities serve the business objectives
and stated values of the organization.

184
2. Project management activities are to be included in the strategic and long-term plans of the organization.
3. Teams are formed to accomplish the project management activities.
Refer to the Team Building at Level 4: Managed of P-CMM for key process area adapting team to project management.
4. Project charter is signed by the project manager.
Project charter is an illegal, internally signed document prepared by project management and a senior individual to give the project manager the authority to initiate the project [30].
Commitment 2 An organizational rule(s) assigned responsibility for coordinating project management activities across the organization are staffed.
Responsibility assigned staff’s duty specifies:
1. Understand the project’s intent.
2. Communicating the project to the interested parties.
Examples interested parties include:
- outsiders, - top management, - functional departments, - clients, and - members of the project team.
3. Solve problems and crises.
4. Deal with threatening or cajoling subcontractors.

185
5. Solve interpersonal conflict between project team members.
6. Direct project related activities.
7. Spend the budget within preset limits.
Commitment 3 Executive management establishes and
communicates a set of values for the organization regarding the development and management of its projects.
Examples project development and management issues that
can be covered in the organization’s values include: - emphasis on teamwork, and - communication to individuals.
Refer to the Communication at Level 2: Repeatable of P-CMM for key process area .
Ability to perform
Ability 1 The organizational rule(s) assigned responsibility
for project management activities is staffed. Ability 2 Individuals being in the project team have been
trained in relevant project management objectives, techniques and skills.

186
Training activities specify: 1. Inter-organizational training is planned for the project management objectives, techniques and skills. 2. Continuous e-learning techniques are applied by knowledge sharing. 3. Being participated in project management benchmarking forum. 4. Being partnered with educational and professional project management organizations.
Ability 3 Adequate resources and funding are provided to carry out the project plan.
1. Experienced individuals who have expertise
planning, budgeting, communication skills and team management are made available.
2. Support for implementing improvements is
made available.
3. Tools for supporting project management activities are made available.
Examples of tools to sport project management activities
include: - gantt chart, - cost analysis packages, - spreadsheets, - knowledge and skills analysis tools, and - textual and graphical reporting tools.

187
4. Technology for use in both the production and in the processing.
Activities performed
Activity 1 Project management activities are planned in the organization’s and unit’s strategic and long term business plans.
Activity 2 The organization designs and maintains an
approved set of project structures and processes for application in appropriate situations.
According to Project Management Institute (PMI) [13], a
project is in a temporary endeavor undertaken to create a unique product or service. Key characteristics of a project include: - temporary endeavor with a beginning and an end,, - often broken into subprojects or phases, - creates a unit product or service, - done for a purpose, - has interrelated activities (tasks), - is an instrument of change.
1. The organization analyses the needs, interests, expectations and priorities to obtain a satisfied result from the project.
According to [13] key stakeholders are divided into two:
“performing organization” if organization and people doing work is included and “benefiting organization” if people or organization benefiting from the work, usually paying for that wok.

188
Examples of key stakeholders include:
- project manager, - project sponsor, - organization, and - external partners.
According to PMI, project management is “the application of knowledge, skills, tools and techniques to project activities in order to meet or exceed stake holder needs and expectations from a project”. In project management, planning, control of all phases of a project is included. The time, cost, quality, safety and performance criteria should be satisfied at the end of the project.
Activity 3 A project manager is determined to the project as
a leader of the team.
Examples of roles of project manager include:
- identify the requirements and risks, - making plans and organizing the effort, - qualifying and possibly selecting project team, vendors and other participants, - communication among team, management, stakeholders, - assessing the probability of occurrence of problems, - ensuring that progress occurs according to the plan, - deliverable management, - running meetings, - acquiring resources for the project, - influencing the organization, - leading and team building, and - internal and external resolution.
Activity 4 Project is tracked and controlled periodically and
if necessary reused.

189
1. The project’ a actual results are compared with the estimated plans.
2. Corrective actions are taken if actual results
significantly from the plan.
3. Changes are agreed on all by individuals that are effected from changes.
Activity 5 Project tracking and control of activities are
documented. Activity 6 Project requirements are stated clearly. Activity 7 Milestones of the project are set properly. Activity 8 Team morale and the moral of other stakeholder
are monitored. Activity 9 Team morale and the morale of other stakeholders
are monitored.
Examples of monitoring for team morale and morale of
stakeholders include: - questionnaires, and, - surveys.
1. During the study of high risk projects, and/ or for the application of project management skills, incentives are determined for the project team members.
Examples of incentives include:
- bonuses, and, - stock options.
2. Team based success is supported by team-based
pay.

190
Activity 10 Potential risks to the project is identified, quantified and lowered.
Activity 11 Information network is built and maintained
between the customers, vendors, suppliers and team members.
1. Customer complaints and satisfactions are
recorded in a database. 2. Department head criticism is recorded.
3. Vendor’s changes and delays are evaluated.
4. Supplier changes and delays are evaluated.
5. Team member’s experiences are recorded.
6. Phase of the project is recorded.
Activity 12 Product or process release is planned.
1. Accurate projection of project completion time is determined.
2. Accurate projection of project cost is
determined.
3. Problems during the project implementation are highlighted.
4. The work done is dividing into tasks.
5. Requirements of the product or process are
defined.
6. General spoke of the project is determined.
Scope of the project has two parts: Project scope and product scope. Project scope supports all the activities needed

191
to develop the product and product scope is specific and the focus in on the product or process only.
7. Number and types of resources needed for the
project is estimated.
8. Feasibility analysis is done to determine whether the resources or technical capability to meet the customer needs.
9. Architecture of the system is evaluated.
Items of system architecture involve:
- requirements, - design of alternatives, - evaluation, - formulation of the selected alternative.
Activity 13 Root causes of the problems, if any, are defined.
Examples of tools finding problems include:
- fishbone diagram, - pareto chart, - check sheet, - histogram, - scatter diagram, and - cumulative defects diagram.

192
Measurement and analysis Measurement 1 Measurements are made and used to determine
the status of the organization’s project management activities.
1. Critical ratio of the project is measured.
Critical ratio (CR) indicates the “health” of the project, in other means, shows that whether the project is done within the limits of budget and time. CR=(actual progress/scheduled progress)*(budgeted cost/actual cost)
If CR is greater than one, than the project is good; if smaller than one, than it is bad.
2. Team morale and the miracle of the stakeholders
are measured.
Measurements of the team morale and the morale of the
stakeholders are include: - number of complaints about the project and assignments, - rate of project team member turnover, - number of unplanned overtime, - rate of productivity, and - rate of poor attitudes.
3. Project changes for the benefit of the project and
resulting product is evaluated by the ratio of approved change orders to the total requested change orders.
In case of the approval of the majority of change order requests shows that scope of the project is not well-defined. Then the methodology of doing the project is re-evaluated.

193
Methodology includes requirements analysis, design, development, documentation, testing and monitoring.
3. Quality dimensions of the end product or process is measured.
Examples for the quality dimensions include:
- Usability, - Reliability, - Robustness, - Responsiveness, - Efficiency, - Capacity, - Performance, - Portability, - Consistency with adopted standards.
Measurement 2 Measurements are made and used to determine
the value of project management activities.
Examples of measurements to determine the value of project
management activities include: - increases in the number of the incentives given to the project team members, - increases in the number of projects done by cost saving with finished on time - increases in the speed which change orders are processed, - increases in the speed of incorporating the changes into the project, - increase in personal interviews and dialog as the project continues, - increases in the number of stakeholder participation, - increases in the number of project milestone and budget reviews.

194
Verifying implementation Verification 1 Executive management periodically tracks and
controls the organization’s project management activities to determine if they comply with its documented activities.
These reviews verify:
1. Status of problems and improvement plans about the project. 2. Quality of the project development processes. 3. Project risk identification. 4. Organization satisfaction with project delivered services.
Verification 2 A responsible individual(s) verifies that project
management activities are conducted according to the organization’s documented policies.
These reviews verify:
1. Project management activities are performed according to the unit’s plans and selected methods.
2. All actions related to the development and implementation of project improvement plans are periodically reviewed to ensure that they conform to documented policies.
3. Noncompliance items are handled appropriately. Verification 3 Experts independent from the company
periodically review and evaluate the design and effectiveness of the web-site.
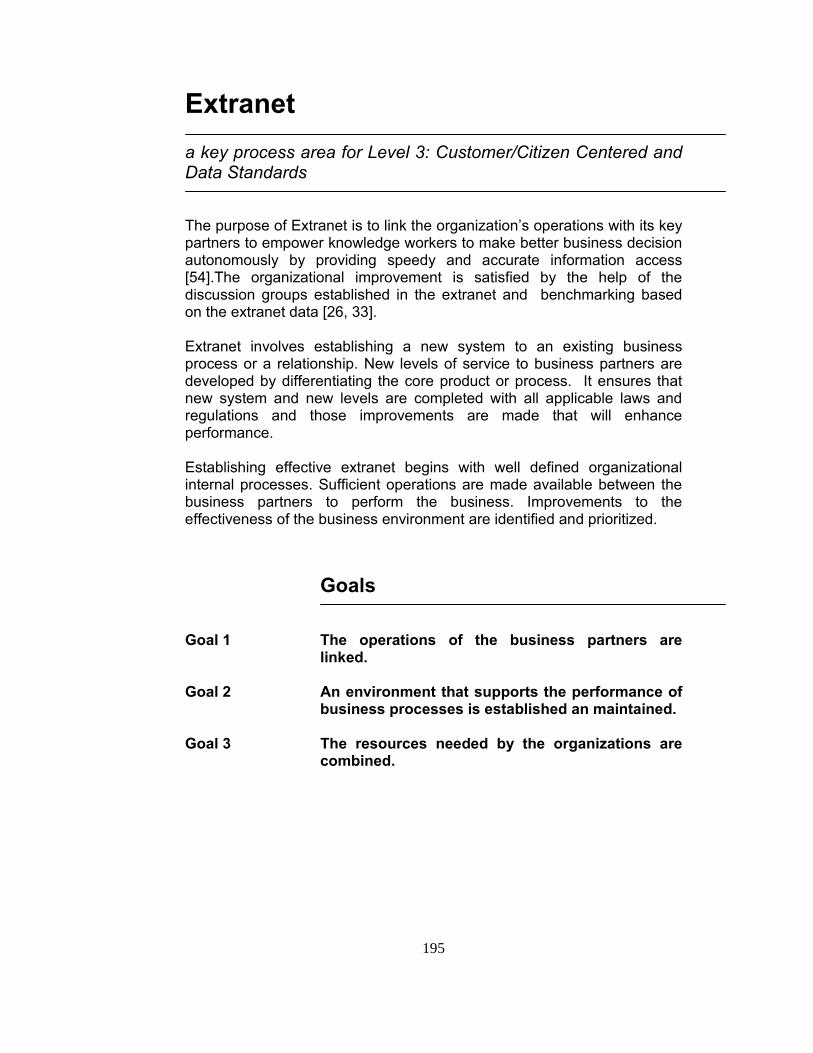
195
Extranet a key process area for Level 3: Customer/Citizen Centered and Data Standards The purpose of Extranet is to link the organization’s operations with its key partners to empower knowledge workers to make better business decision autonomously by providing speedy and accurate information access [54].The organizational improvement is satisfied by the help of the discussion groups established in the extranet and benchmarking based on the extranet data [26, 33]. Extranet involves establishing a new system to an existing business process or a relationship. New levels of service to business partners are developed by differentiating the core product or process. It ensures that new system and new levels are completed with all applicable laws and regulations and those improvements are made that will enhance performance. Establishing effective extranet begins with well defined organizational internal processes. Sufficient operations are made available between the business partners to perform the business. Improvements to the effectiveness of the business environment are identified and prioritized.
Goals
Goal 1 The operations of the business partners are
linked. Goal 2 An environment that supports the performance of
business processes is established an maintained. Goal 3 The resources needed by the organizations are
combined.

196
Commitment to perform
Commitment 1 The organization follows a documented policy for
the successful creation, development, implementation, adoption and usage of information.
Ability to perform
Ability 1 Organization is partnered to build and
improvement the extranet capabilities.
Examples of partners include: - system integrators,
- applications system providers(ASP), and - extranet service providers(ESP).
Ability 2 Adequate resources and funding are provided for
performing extranet activities.
Activities performed
Activity 1 A home page is built for the organization.
Organization’s home page introduces the organizational features of the work being done and provides a login possibility for the business partners.
___________________________________________ Examples of the business partners include: - partners, - suppliers, and - customers.
____________________________________________________

197
1. Business partners logs in.
2. A personalized environment with the information serving their needs is defined.
3. Business partner is provided with functions to do
the business.
Examples of the functions provided to the business include:
- Internal reporting, and - Query and analysis of the organization’s datawarehouse.
____________________________________________________ Activity 2 The organization’s data stores are opened to
business partners. Activity 3 Security technologies are used for an efficient
extranet to provide the business partner’s privacy.
Examples of security technologies include: - firewall server management, - insurance, - digital certificates, - user authentication, - encryption of messages, and - establishment of virtual private network.
____________________________________________________ Activity 4 Organization(s) use web based platforms to
enable the business partners to access and analyze the organization’s data through a browser.
Activity 5 Information exchange between the organizations
is done in electronic medium. Activity 6 System tracks the business partner’s operations
of a particular product or service. Activity 7 When the business partner uses extranet, the
system provides the previous operations.

198
Activity 8 Data is provided to the business partner’s delivery
vehicle. Examples of delivery vehicle include:
- web-enabled telephones, and - handheld wireless devices.
Activity 9 The performance of the customer is tracked the
customer data with the aggregate view of the customer base or with external market information to improve the performance of customer’s operations.
1. Customer data is collected.
2. Customer’s business processes are defined.
3. The customer data is compared with the aggregate
view of customer base or with external market information to obtain metrics.
4. Customer’s business processes and metrics are
analyzed. Activity 10 Discussion area is provided that is used exchange
ideas and share information and membership lists between the business partners to solve problems and continuous service improvement.
Activity 11 Applications between the organizations are
processed electronically. Examples of applications include: - order processing, - database access, - customer service and support, - manufactory,

199
- sales and marketing, - distance learning, - e-commerce, and - inventory.
1. Business partner selects the application that is wanted to operate.
2. Fill the form electronically and submit.
3. The form goes to the related department of the
organization.
4. The form is approved by the organization automatically.
5. The approval or reject message sent to the
business partner automatically. Measurement and analysis Measurement 1 Measurements are made and used to determine
the quality of the extranet. Verifying implementation Verification 1 Senior management periodically reviews the
extranet activities.
1. The reliability of data.
2. Trends related to extranet issues.
3. Conformance of extranet activities with the organization’s stated values, policies and procedures.

200
4. Results from the analysis of the business partners’ performance.
5. The amount and effectiveness of improvements in
the performance. Verification 2 User feedbacks are collected periodically and
evaluated to improve and upgrade the extranet materials and screens.
Examples for collection of user feedback include: - discussion area, - email links, - questionnaire, - surveys, - guest books, and - detailed statistical analysis of use patterns.
____________________________________________________

201
Security Policy a key process area for Level 3: Customer/Citizen Centered and Data Standards The purpose of security policy is to ensure to have a secure infrastructure that only the individuals who are authorized to use the resources available in the system [4, 85] and define the things needed to be protected. Security Politics involves rules and politics in using hours of the system backup rules, easement, authorities and restrictions, general risk assessment of the types of threats to the system or site and consequences of these threats [38]. Security Policy activities begin with the risk assessment of network and work place to threats and vulnerabilities and build a team to respond. A security change management practice is implemented and the security for violations is monitored. Existing policy is reviewed periodically and lessons learned are adapted following [14].
Goals
Goal 1 Have information is not destroyed, modified or
subverted during the storage or in transmission. Goal 2 Avoid the interception of the information and
properties by unauthorized parties.
Commitment to perform
Commitment 1 The organization follows a documented policy for
its activities that support development of security politics.

202
This policy typically specifies that:
1. Security Policy serves the business objectives and stated values of the organization.
2. Responsibilities and authorities of all individuals
are in the organization are identified. 3. Adaptation between the purchasing policy and
procedures and the security policy is performed to satisfy the properties of hardware bought to security rules.
4. Legal and moral confidentiality conditions are defined.
Examples to legal and moral confidentiality conditions
include: - reading e-mails by third parties, - reading documents by third parties, and - saving user transactions
5. Accessible user resources and rules followed during the usage of resources are described. 6. Rules should be obeyed by the technical staff are defined.
7. Responsibilities and duties of users’, managers’ and technical staff are described during an attack. 8. Reporting of the problems and attacks are defined. 9. Forming and management of user accounts,
password management rules are described.
10. Maintenance and repair of the system is stated.

203
Examples of maintenance and repair include: - backup of the system,
- protection of the backup environment, and - problem removal.
11. Results of the violation of rules are described.
12. Applications to remove the weaknesses of the system are proposed.
13. Rules to be followed for technology systems are
described.
Examples of technology systems include: - encryption mechanism,
- access control devices, - authentication systems, - virtual private networks, - firewalls, - messaging systems, - anti-virus systems, - web sites, - gateways, - mission critical applications, - end-user desktops, - DNS servers - routers, and - switchers.
14. Things to be protected are defined to be protected
from what is defined.
15. The individuals allowable to use the resources are
identified.

204
16. The authorization of grant access and approve usage is defined.
17. The rights and responsibilities of the system
administrator are defined. 18. The protection of sensitive information is
determined.
The authorization specifies: the individual(s) authorized to grant access to
services. the type of access permitted to be given. the access distribution from a centralized
point or at various points is determined.
19. Action, to be taken during an incident is prioritized.
Prioritization in action specifies:
human life and safety. sensitive data. prevent damage to system.
20. Security conditions requiring backup is
determined. 21. Conducting security and availability of backups
are defined.
22. Basic policies are defined for security.
Basic policy specifies:
Acceptable user policy defining the user duties and responsibilities in using the network, hardware and software.
Access policy defining user authority to
reach to information. Firewall policy to protect the system from
attacks, increase performance authorization.

205
Firewall policy efficiency increases using with: - proxy, - anti-virus solutions, - content filtering, - virtual private network, and - intrusion detection system.
Internet policy defining the rules of internet usage.
Password management defining the
security of password usage.
Physical security policy.
23. The organization’s requirements are identified.
The items to be protected are defined.
Examples of items to be protected include: - hardware, - software, and - documents.
Protection from the kind of items is determined.
Protection methods of the information are
defined.
The way of backup is defined.
Responsibilities and the duties of the users are defined.

206
25. Responsibilities of the computer and system users at the organization are defined.
Examples of responsibilities include: - password administration ,
- fixing security holes, - auditing, and - control.
Ability to perform
Ability 1 All individuals in the organization using network
are trained in relevant methods and techniques according to their roles and responsibilities of using the system.
1. User education specifies:
Usage of the account or workstation. Management of user account and
workstation.
Examples of management of account and workstation include:
- protection of the files stored on the system, - the ways to log out, and - the ways to lock the terminal or workstation.
Detection of unauthorized access to user’s
account.
2. Host administrator education specifies: management of the accounts. installation of a system. backup. recovery procedures.

207
Ability 2 A cross-functional security team is formed.
1. Team members are chosen from each operational areas of the organization.
2. Team members are aware of the security policy.
3. Team members deal with the technical aspects of security design and implementation.
4. Team member deal with troubleshooting and fixing
the violation. Ability 3 Adequate resources and funding are provided for
the security policy analysis and implementation activities.
1. Experienced individuals who have expertise in the
organization’s computer networks are made available for developing the security policy.
Examples of individuals with expertise relevant to
security policy include: - director of information security, - director of information auditor, - chief information officer, - information technology technical staff, - director of information technology, - managers, - user representatives, and - legal advisor.
___________________________________________ 2. Tools for supporting security policy planning
activities are made available. 3. Time, resources, and needed access for analyzing
the network are made available.

208
Activities performed Activity 1 User accounts are used only by authorized
individuals. Activity 2 System maintenance and repair are done
systematically. Activity 3 Resources are evaluated.
Examples of resources include: - hardware, - software , - data, - users, - documents, and - equipments.
___________________________________________
1. Functional priorities of the resources in the system are defined.
2. Functionality of the resources is provided. 3. Important sub-system is provided to operate in
case of crisis situations. Activity 4 Possible problems and attacks resources are
determined.
The problems and attacks specify that: 1. Unauthorized and unwanted individuals using the
resources.
2. Partial or full loss of valuable data.
3. Partially or fully down of the system. Activity 5 Probability of the occurrence of the problem and
attack are determined by considering the passive and similar activities.

209
1. Possible problems and attacks are defined.
2. Classification, rating and weighing study is done to
determine the priorities of the problems and attacks.
Activity 6 Organization’s goal and direction is determined to
take cost effective precautions into consideration.
1. Services that are wanted to given are determined.
2. Ease of use and the cost of security are calculated.
3. Applicable security precautions are defined.
4. Balance between the services, cost and applicability is satisfied.
Activity 7 Risk analysis is done to determine to things to be
protected, what it is protected from and the way to protect.
1. All the things that could be effected by a security
problem is categorized and listed
Examples of categories include: - hardware, - software , - data, - people, - documentation, and - suppliers.
___________________________________________
2. All of the risks are examined. Examples of risks include: - unauthorized access,

210
- disclosure of information, and - denial of service.
___________________________________________
3.These risks are ranked by the level of security.
Examples of risk levels include: - low risk, - medium risk, and - high risk.
4. Vulnerability points are determined.
Examples of vulnerability points include: - access points, - misconfigured systems, - software bugs, and - user threats.
___________________________________________
5. The types of users of the system is identified.
Examples of types of users include: - administrators, responsible for network resources, - privileged, users with a need for greater access, - internal users with general access, - partners, external user with a need to access some
resources, and - external users, - customers.
6. The way to protect the system is defined.
Examples of way to protect the system include:

211
- Control sets, - Common sense, - Combine mechanisms, - Physical security, and - System use monitoring.
___________________________________________
Activity 8 Security policy is understood and discussed
among users. Activity 9 Logging is used to determine the usage patterns
for the system to monitor the unauthorized activity
1. Log files are examined regularly. 2. Login histories of users are examined. 3. Unusual error messages are determined.
Activity 10 Security of hardware, software and resources is
prevented.
1. Firewall is used to provide a point of resistance for unauthorized entry.
2. Confidentiality is acted for information storage on a
computer system, during transmission of information to another system, and during the storage of information of backup tapes.
3. Encryption of a document to convert from readable
form to non-readable form. 4. Originator of the message indicated by
authentication.
5. Information is verified to be complete, correct and unchanged from the last time.
6. Network access to users is limited.
Activity 11 Individuals are notified in case of an incident
occurring. Examples of individuals notified include: - technical, - administrative, - response team,
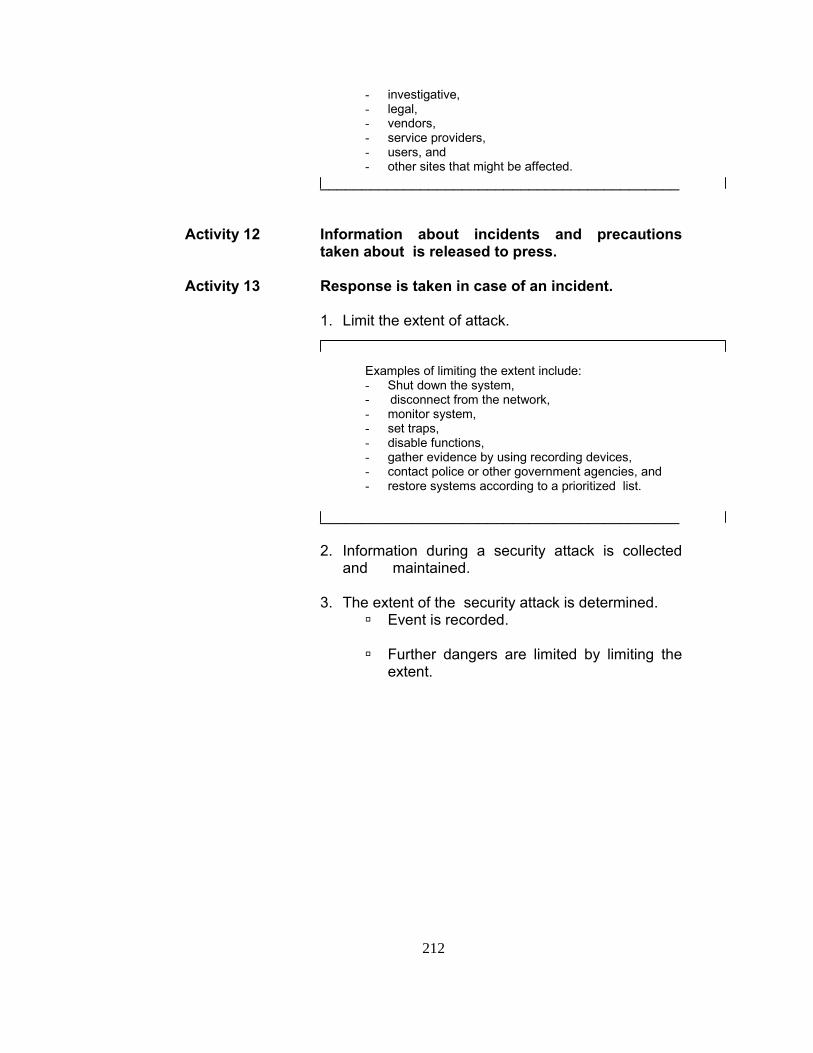
212
- investigative, - legal, - vendors, - service providers, - users, and - other sites that might be affected.
___________________________________________
Activity 12 Information about incidents and precautions taken about is released to press.
Activity 13 Response is taken in case of an incident.
1. Limit the extent of attack. Examples of limiting the extent include: - Shut down the system, - disconnect from the network, - monitor system, - set traps, - disable functions, - gather evidence by using recording devices, - contact police or other government agencies, and - restore systems according to a prioritized list.
___________________________________________ 2. Information during a security attack is collected
and maintained. 3. The extent of the security attack is determined.
Event is recorded. Further dangers are limited by limiting the
extent.

213
Detailed analysis of the damage and kind of attack is determined.
Other systems and accounts are checked to
look whether they are affected from the attack or not.
External violations are followed.
4. Disks containing infected files are cleaned. 5. A follow-up report is written about the incident for
future reference. The follow-up report specifies:
the things happened. the happened time. amount of damage performance of the staff for the incident. things could be done for the next time.
Activity 14 Security changes are defined as equipment or an
individual’s position changes that will affect the organizational security.
1. The changes are indicated in security policy
2. Security policy requirements are written in non-technical terms. 3. Changes, threats and problems are reported to senior manager.
Activity 15 Security team reviews the system regularly.
1. Passwords to network devices are changed regularly.

214
2. Access to network devices is restricted with an approved list of personnel.
3. Security configuration requirements are reviewed
to satisfy the compliance of any change in the equipment or the environment of the organization.
Measurement and analysis Measurement 1 Measurements are made and used to determine
the status and performance of security level.
Examples of measurements include: - number of attacks, - frequency of changes, and - number of break downs.
Verifying implementation Verification 1 Security policies are updated regularly.
1. Consistency of security policy with the new infrastructure is checked as new technology is deployed by retiring old systems.
2. New equipment is configured to meet the security
requirements.
3. Things are improved every time when a weakness is found.

215
Verification 2 A responsible individual(s) verifies that security policy as conducted according to the organization’s plan and documented policies.
1. Security policy conform to the organizations
policies, rules, regulations and the laws. 2. It is ensured that the policy stated is disseminated
to users.
3. The users’ needs are reviewed to identify the configurations or design issues to meet the requirements.
4. Trends related with security issues are reviewed
regularly.
5. Security of the system and environment is tested annually.
Examples of tests include: - Penetrate to network, - Penetrate the environment, and - Security response of the organization.
Verification 3 Senior management periodically reviews the
security policy activities to determine if they comply with the organizations documented policies.
These reviews address:
1. Conformance of security policy activities with the organization’s stated values, policies and procedures.
2. Status of resolution for noncompliance issues.

216
3. Rate at which serious threat activities to the system are being reduced.
4. Trends related to security issues.
5. The number of grievances and issues raised and
the rate of resolving them.
6. Conformance of grievance resolution with the organization’s documented procedure.
7. Continual awareness to security issues.

217
APPENDIX C3: e-CMM LEVEL 4 KEY PRACTICES Performance Measurement a key process area for Level 4: Integrated Web Services The purpose of Performance Measurement is to evaluate the efficiency, effectiveness and results of integrated systems for both the developmental and modernization of operations. Being a constantly learning and improving organization, responsive to internal and external customers and other businesses is possible by improved and innovative services. Performance Measurement involves a set of processes and methods to find the achievement rate to organizational strategic objectives [61,95]. The points adding value to the business processes and work instructions are identified, parameters having significant effect on process and/or product quality is identified, the appropriate measures are defined. The corrective and preventive action is taken into account after measuring the performance of the products produced and/or processes in case of the deviation or a probability of deviation from quality [73]. Performance Measurement includes analyzes the environment surrounding the organization and determination of the strong and the weak sides of the organization [92]. The organization strategy is defined and objectives are set. The performance drivers are defined for achieving the objectives and the necessary measurement is done.
Goals
Goal 1 Improvement in the processes, activities and
products is implemented. Goal 2 The things working and not working is tracked. Goal 3 Performance problems are managed.

218
Goal 4 Outstanding performance is recognized.
Commitment to perform
Commitment 1 The organization follows a written policy for its
performance measurement activities. This policy typically specifies that:
1. Performance measurement activities serve business objectives and stated values of the organization.
_________________________________________
Examples of type of measured entity include:
- organization, - business unit, - business function, - process, - project, - service development activity, - job performer, - supporting product or service, - final delivered product or service.
2. Performance measurement activities comply with
all applicable laws and regulations.
3. Performance measurement of all the resources of the organization is evaluated.
4. Performance of the activities is measured against
objective criteria.
5. Appropriate performance measurement procedures will be defined, documented and used for:

219
identify those responsible for providing performance feedback,
developing performance criteria, periodically discussing business performance
and possible improvements, providing formal performance feedback at least
as often as a specified minimum frequency, resolving disagreements about formal
performance feedback, documenting and acting on development
needs, documenting performance feedback, handling performance problems.
6. Performance requirements for all processes are
defined. 7. Performance measures are actively used to
improve services.
8. Measurable and simple performance measures are developed.
9. Characteristics used for the evaluation of the
systems are defined.
Examples of characteristics [95] include:
- inclusiveness indicating the measurement of all related aspects,
- universality allowing for comparison under various operating conditions,
- measurability for requiring measurable data, - consistency to measure the consistency to
organizational goals, - benchmarking for the identification of improvement
opportunities.

220
Ability to perform
Ability 1 A group responsible for the organization's performance measurement activities exists.
A group is the collection of departments, managers, and individuals who have responsibility for a set of tasks or activities. A group could vary from a single individual assigned part time, to several part-time individuals assigned from different departments, to several individuals dedicated full time. Considerations when implementing a group include assigned tasks or activities, the size of the project, the organizational structure, and the organizational culture.
1. Decision-making and actions are informed through
the results of measurements. 2. Purposeful actions are taken for the improvement
process.
3. Future states of the actions are evaluated while deciding on the actions.
4. Uncertainty and risk is evaluated.
Ability 2 Adequate resources and funding are provided for
the performance measurement activities.
1. Experienced individuals who have expertise in performance measurement methods are made available for guidance in these activities.
_________________________________________
Examples of expertise in performance measurement
include: - definition of performance criteria, - laws, regulations, policies and procedures governing
performance measurement.

221
2. Tools and instruments to support performance
measurement activities are made available.
_________________________________________
Examples of tools and instruments include: - repositories of previously defined performance criteria, - templates with categories for recording performance
information, - standard forms for documenting performance
measurement activities.
1. Tools and instruments to present the findings are made available. _________________________________________
Examples of tools and instruments include:
- spreadsheets, - statistical packages, - visual aids.
2. Adequate staff time is allocated for performance
measurement activities. Ability 3 Members of the group responsible for the
organization's performance measurement activities receive required training to perform these activities.
Examples of training include:
- benefits of measurement, - benefits of resultant cost saving,
Refer to the Inter-Organizational Training and Continuous e-Learning key process area.

222
Ability 4 Members of the organization receive required training to for the cause of errors and corrective and preventive actions.
Refer to the Inter-Organizational Training and Continuous e-Learning key process area.
Ability 5 Benchmarking activities is endured in the related areas of performance measurement.
Benchmarking is a comparison of the current situation of an organization with another organization that is superior in its area on the time being or the comparison of the resources of the organization within itself based with some baseline.
Examples of some comparisons within the organization may include:
- previous year activities, - accepted professional standards, - projected targets.
Activities performed
Activity 1 Type of the performance measures are determined.
Types of measurements of the organization include [92]: - input measures for the resources that go into
providing services, - output measures for the products, processes and
services produced, - activity or process measures for measuring the
activities used to produce outputs, - efficiency and productivity measures, - service quality measures, - outcome measures to determine the desired
results of providing the service.

223
Activity 2 Performance measurements are categorized.
Examples of categorization include:
- quality, - time, - flexibility, - cost.
Activity 3 Objective performance criteria are established for each process.
Examples of objective performance criteria include:
- measurable goals to be achieved, - work products to be produced, - milestones to be met, - quantitative quality targets to be achieved, - customer/user satisfaction, - costs to be saved, - cycle time to be reduced, - increased integration with cooperating units, - services to be provided - supplier performance.
Activity 4 The performance criteria are periodically reviewed
to determine their appropriateness under changing business or organizational conditions and, if necessary, revised.
Activity 5 Performance measures are developed conforming
to the organizational goals.
1. The scope of the performance of the processes, systems and products are identified.
2. Customer’s, developer’s, supplier’s role is
identified.
3. Measurable concepts are established.

224
Activity 6 Performance results are periodically documented.
1. Measurements for progress of the work in terms of the plan and the resources consumed to determine the conformity to management of tasks.
2. Measurements for the effectiveness of the
designed process, plan or activity to determine the state of improvement in process design and planning.
3. Measurements for achieving end goals.
4. Measurements to determine the value of the
current goal for possible revisions in the future.
5. Measurements for information technology projects.
Earned Value Management System (EAMS) is
a performance measurement tool used for the project and resource planning to actual cost and schedule measurement [92]. The cost and schedule performance is evaluated together. The deviations from the plans, forecasts about the completion time and taking corrective action with EAMS is being possible to make the monitor and control of the projects efficient.
6. Measurements for web services of the
organization.
Examples of web services include:
- web site, - intranet, - extranet, and - portal.
Activity 7 A consistent method is defined and documented
for providing formal feedback on products and/or performances on a periodic or event-driven basis.

225
1. Documentation from the performance feedback process is systematically maintained according to a documented procedure.
Issues covered in the procedure may include:
- what information will be documented, - how long documentation will be retained, - who has access to the documentation, - how documents may be inspected and
challenged, - how documentation will be kept secure, and - how the documentation may be used.
Activity 8 Performance of the investments is evaluated by the project managers.
The current performance of the operational
portion of an investment is examined with the help of the operational analysis method [94]. Investment performance is evaluated with the established set of performance criteria, afterwards, the opportunities for possible improvement in the performance is questioned. Being within the time and budget limits are important factors.
The ways to meet the investment objectives
better and cost saving is analyzed.
Refer to the Process Change Management key process area.
Activity 9 Corrective and preventive actions are taken for
the improvement of products and/or processes.

226
1. Data relating to various areas are collected regularly using consistent research methologies and data collection methods..
Examples of data collection methods include:
- paper written format surveys, - web-based pop-up surveys, - page-based clickable “opt-in” web surveys, - web monitoring software and administrative data
from records.
2. Both web/technology measures and service-based
measures are used.
Web/technology measures are related with the application development and hardware set-up costs, amount of any kind of transactions and processes done by using web applications and measurements accessibility of the site. Service-based measures include the improvement costs, access to any information and response rates, and user satisfaction.
3. The collected data is analyzed.
4. Non-conformities in the product and/or system are determined.
5. The re-occurance of non-conformity is eliminated
by finding the potential causes(s).
_________________________________________
Examples of cause of errors include: - problems in procedures, - working conditions, - training.

227
6. Effectiveness of the preventive actions is evaluated.
7. The reason and actions taken for the non-
conformity is documented. Activity 10 Performance measurements are kept on a regular
basis to monitor the performance and make necessary changes.
Measurement and analysis Measurement 1 Measurements are made and used to determine
the status and effectiveness of business activities and processes within each unit.
Examples of critical processes include: - quantity of products or services provided, - methodology of products or services provided.
Measurement 2 Measurements are made and used to determine
the status and effectiveness network system of the organization.
Examples of measurement index of network include: - CPU utilization, - memory utilization, - usability, - bandwidth, - throughput, - utilization, - end-to-end delay, - packet losing rate, - response time.
Measurement 3 Measurements are made and used to determine
the conformity of the product and /or service to the specifications.

228
Examples of measurements include: - trends in customer complaints, - number of rejections, - volume of rework, - number of overdue orders, - time lost due to breakdowns, - compliance with specifications, - supplier performance.
Measurement 4 Measurements are made and used to determine
the immediate results obtained by e-organization efforts.
Examples of measurements include: - number of hits on web site of the organization, - number of user contact sessions, - number of document downloads, - amount of time users spend on a site, - number of transactions completed, - dollar amounts processes through each site, - time required for e-mail response, - number of e-mails sent to the organization, - number of e-commerce applications accessed, - number of times multimedia presentations are played, - amount of feedback on multimedia presentations, - number of times databases are accesses, - frequency of which information in databases is accessed, - accuracy of the information provided, - level of user satisfaction with e-organization services
both within and outside of the organization, - response time for requests, - accessibility to services, - frequency of web page errors, - percentage of web site down, - increase in security, - increase in privacy.
Measurement 5 Measurements are made and used to determine
the consequences of transformation of the services and processes electronically.

229
Examples of end results to be measured include: - cost savings by the organizational transformation, - staff time savings, - frequency of new knowledge occurrence, - trust developed for the organization - ratio of cost of providing each service electronically to
cost of providing each service traditionally, - cost per transaction, - total cost per user session, - cost-benefit analysis.
Measurement 4 Unit measures of performance status are collected
and aggregated at the organizational level.
1. A historical database of performance criteria and performance data is maintained.
2. Performance data are periodically analyzed to determine trends.
Verifying implementation Verification 1 Senior management periodically reviews the
organization’s performance measurement activities to determine if they comply with the organization’s documented policies.
These reviews verify:
1. Status of the quality system established. 2. Effectiveness of the performance measurement activities. 3. Appropriateness of performance criteria.
4. Status of resolution for noncompliance issues.

230
5. Status of performance problems and improvement plans.
6. Status of the achievement in quality objectives and
goals written in the policy.
7. Results of the auditing process.
8. Initiation of the corrective and preventive actions. Verification 2 Quality audits periodically reviews the
implementation of the quality systems and the effectiveness of the system.
These reviews verify:
1. Status of meeting the customer expectations and needs.
2. Identification of errors.
3. Effectiveness of processes and procedures.
Verification 3 A responsible individual(s) verifies that
performance measurement activities are conducted according to the organization’s documented policies.
These reviews verify that:
1. Performance measurement activities comply with applicable laws and regulations, and with the organization’s policies and stated values.
2. Performance measurement activities are
performed according to the plans and selected methods.
3. All actions related to the development and
implementation of performance improvement plans are periodically reviewed to ensure that they conform to the documented policies.
4. Noncompliance items are handled appropriately.

231
Continuous e-Learning a key process area for Level 4: Integrated Web Services The purpose of Continuous e-Learning is to get the information throughout the organization to large numbers of people by using internet technologies to provide large number of solutions that enhance knowledge and performance[77]. e-Learning may occur in two circumstances. One of them is in the instructional way that when an individual needs a specific information about an activity, for example, a staff working in the call center needs to know how to evaluate the customer request; and secondly by knowledge management in which case continuous e-Learning takes place. Continuous e-learning involves identifying the needs of the individuals are identified through a centralized unit plans are developed for the creation of e-learning activities, and improvements in the learned is done by evaluations [12, 57]. E-learning includes mechanisms for the development and access to various e-learning services with a supportive technology behind. The e-learning sources and technology platform is periodically reviewed against the technological and the global change and reused when necessary [53].
Goals
Goal 1 Instant updating, storage, retrieval, distribution
and sharing of information or instruction is provided.
Goal 2 Training opportunities are made available across
geographic and organizational boundaries. Goal 3 Individuals receive training whenever and
wherever they need via a computer using standard internet technologies.

232
Goal 4 Knowledge delivery is made available between the individuals.
Commitment to perform
Commitment 1 The organization follows a documented policy for
it continuous e-learning activities. This policy typically specifies that:
1. Learning activities by courseware and business simulations are integrated with informational databases and performance support tools.
2. Learning activities serve the business objectives
and the organization’s learning efforts. 3. Learning requirements for creating learning culture and change management are provided. 4. The adoption of the organization and business model is defined.
Ability to perform
Ability 1 Adequate resources and funding are provided for
implementing the planned training activities.
1. Access to learning activities is made available.
Examples of access include: - technology, and
- authority to retrieve and use the information. __________________________________________

233
Technological solutions are necessary for the information to reach to the right one at the right time.Examples of technology include:
- infrastructure, -intranet, and - internet.
___________________________________________ Ability 2 Training time is made available to each individual.
The schedules of the training is accommodated according to the individual and enough time is made available to the individual to obtain, review, absorb and learn the information:
___________________________________________ Ability 3 A centralized e-learning development groups are
formed within the organization.
In case of the small company size forming e-learning development groups, may be costly. The organization can be benefit from online training course in the generic contents. Examples of online training courses are included: - subscription to an online course, - purchasing, and - leasing In specific contents, an individual dealing with e-learning on that subject should be hired.
___________________________________________ Ability 4 The individual learning need is determined.
The individual may need training or information given about a product and/ or process. The balance and difference between training and information should be determined.
___________________________________________

234
Ability 5 Rewarding is planned for knowledge sharing. Ability 6 The goals of the program are focused on benefits
for the individuals.
While designing the goals of the program the authenticity of the self motivation of the program should be taken into account.
___________________________________________ Ability 7 Individual(s) accessed to internet and/ or
corporate internet to get to programs.
Ability 8 Special access units to e-learning activities are
made available for individual(s) who doesn’t use a computer on the job.
Examples of special access units are include: - kiosks, - workstations, - learning centers as close to work places, and - access at home.
___________________________________________ Ability 9 An e-learning portal is established.
E-learning portal is set for individuals to access to the e-learning resources on the internet and/ or corporate intranet.
___________________________________________
Examples of resources include: - information, - programs, and - courses.
___________________________________________

235
Ability 10 Technical requirements are satisfied.
Examples of technical requirements include: - broad access.
___________________________________________
Activities performed
Activity 1 Online training methods are identified and
applications are updated when necessary.
Examples of methods include: - simulation technics, - expert models, - time-life stories.
___________________________________________ Activity 2 State of the business is determined. Activity 3 The organization’s expectations are explained to
individuals. Activity 4 Individual(s) are organized depending on their job
positions and organization’s expectations the content of e-learning is continuously updated.
Activity 5 The learning program is designed with the similar qualifications of a classroom program.
Examples of classroom program include: - introduction of concepts, - response to questions, - evaluation of performance, - facilitating role-plays, and - provision of quality feedback.
___________________________________________

236
Examples of evaluation of performance include: - feedback throughout simulation, - interactive games, - puzzles, and - quizzes.
___________________________________________
Activity 6 E-learning portal is personalized depending on the individual(s) need, and interests.
1. Individual(s) enter the user profiles for
personalization. 2. Organization pushes the necessary corporate an
organizational content to the portal. Activity 7 Learning management system is setup to manage
the interaction between users and learning resources.
Learning management system gives information about the individual what he is learning, and the number of qualified or certified individuals. Besides, it is possible for the individual to plan, access and manage the e-learning activity on its own.
___________________________________________ The system specifies: 1. A common online course catalog.
Examples of catalog include: - course information, - course content, - duration, - target audience, - change to pay, - place,
- prerequisite. ___________________________________________ 2. A common online registration system.

237
3. Tools to access the level of individuals before starting to e-learning activities.
4. Tools to access the level of individuals during and
at the end of the e-learning activities.
5. Download the learning material.
6. Track the individual(s) taking e-learning activity by the manager.
7. The integration with the other systems that is
available in the corporate.
Examples of other systems include: - Human resources, - Enterprise resources planning, - Firm’s e-mail, - Producting software, - Schedules software
___________________________________________
Activity 8 A documented plan is developed and maintained
to satisfy e-learning needs. The documented plan typically specifies:
1. The analysis of the current situation.
Analysis includes:
Alignment with goals, The change in business direction and causes, Current stage of e-learning in the organization, Current state of the technology,
Examples of technology include: - infrastructure,

238
- web access, - internet, and - intranet.
___________________________________________
adequacy or inadequacy of funding for e-learning,
talent on e-learning.
2. The description of desired situation. The description includes:
Mission and the goals of the business, Role of e-learning, Competitors doing in e-learning, Best practice in e-learning for the organization, Aim of e-learning Important points in implementation of e-
learning.
3. The detailed specification for the gaps between the current and desired situation.
4. The examination of the solutions for closing the
gaps between the current and desired situation.
5. The examination of the entire organization in terms
of the strength, weaknesses, opportunities and threats.
6. An action plan is defined and implemented for the
application of the e-learning strategies. The action plan specifies: Findings from the analysis, Actions to be taken, Critical success factor, Timetable and milestones, Barriers for e-learning implantation, The appropriate change management issues, The way for the implantation of the plan.

239
Measurement and analysis Measurement 1 Measurements are made and used to determine
the status of e-learning activities, performance of e-learning activities and the goals achieved.
Examples of measurements include: - number of the enrolments, - rate of the activities used, - rate of the completion of the activities, - application of learned skills or knowledge or behaviors in job performance, - time of completion, - rate of satisfaction from the content, - improvement in employee satisfaction.
Measurement 2 Measurements are made to determine the
efficiency of the organization.
Examples of measurements include:
- increase in volume, - increase in productivity, - increase in turnover rate,
- decrease in defect level, - increase in service level, and - decrease in service time.
Verifying implementation Verification 1 A responsible individual verifies that e-learning
activities are conducted according to the organization’s goals and the organizations documented plan.
These reviews verify that:

240
1. E-learning activities comply with the organization’s policies and stated values.
2. All actions related to the development and implementation of e-learning plans are periodically reviewed to ensure they conform to documented policies. 3. Noncompliance items are handled appropriately.
Verification 2 Senior management periodically reviews the
organization’s e-learning activities to determine if they comply with its document policies.
These reviews verify:
1. The duration and effectiveness of the e-learning activities
2. Status of resolution for noncompliance issues.
3. Trends related to e-learning needs.
4. Effectiveness in the organization’s performance.
241
Information/Document Management Systems a key process area for Level 4: Integrated Web Services The purpose of Information/Document Management Systems is to deliver value to organization by disseminating the accurate and complete information and give support when it is needed to adopt to the changing environment to be efficient. The available and required knowledge identified and analyzed with the development of the knowledge assets by subsequent planning and control of actions [52]. The organization’s capabilities are collected to create and use knowledge, organize knowledge by adding value to create information, build infrastructures that enable the effective management and knowledge and disseminate and sell the value added product or process to user [36]. The organizational processes has a balance between the information technologies combining data and information processing capacity, used and shared information environment and creative and innovative individuals. This balance is maintained by document management, information creation, sharing and management of knowledge and enterprise intelligence [83].
Goals
Goal 1 Knowledge resources and capabilities of the
organization are brought together. Goal 2 Knowledge is accessible to individual to right
thing. Goal 3 Individual’s potential for creativity is leveraged to
create new unprecedented levels.

242
Goal 4 Individuals with different backgrounds are coordinated with each other.
Commitment to perform
Commitment 1 The organization follows a documented policy for
establishing and maintaining knowledge creating and sharing environment.
This policy typically specifies that:
1. Knowledge activities serve the business objectives and stated values of the organization.
2. Knowledge required to perform the organization’s
business processes are identified. 3. Knowledge activities will be conducted on a
periodic and event-driven (as needed) basis to maintain and update the knowledge profiles.
4. An inventory at knowledge profiles in the
organizations core competencies is maintained.
5. There are defined procedures for maintaining and using the inventory, including who has access and for what purposes.
Commitment 2 An organizational role(s) is assigned
responsibility for coordinating knowledge across the organization.

243
Ability to perform
Ability 1 The stakeholders effected from e-learning
activities are determined.
Examples of stakeholders who might be affected from e-learning activities include: - the teacher/ facilitator for classroom components, - a developer for learning components, - a manager of the individuals, and - individuals
___________________________________________ Ability 2 A group going to work together as teams of
knowledge partners are performed.
Examples of members of knowledge partners include: - knowledge professionals,
- users, and - technology experts.
___________________________________________
Examples of knowledge professionals include: - librarians,
- record managers, - archivists, and - information specialists.
___________________________________________

244
Users are the individuals in the organization acting for creating and using knowledge.
___________________________________________
Examples of users include: - professionals,
- technologists, and - managers.
___________________________________________
Examples of technology experts include: - system analysts,
- system designers , - software engineers, - programmers, - data administrators, - network managers.
___________________________________________
1. Users help for the organization to learn, make
discoveries, and create innovations.
2. Quality and accessibility of knowledge is maintained.
3. A knowledge infrastructure is maintained to
provide the flow and transaction of knowledge, and processing of data and messages.
Ability 3 Adequate resources and funding are provided for
implementing knowledge and document management activities.
Ability 4 Individuals responsible in the organization are
trained in methods relevant to their responsibilities for improving knowledge creation and usage.
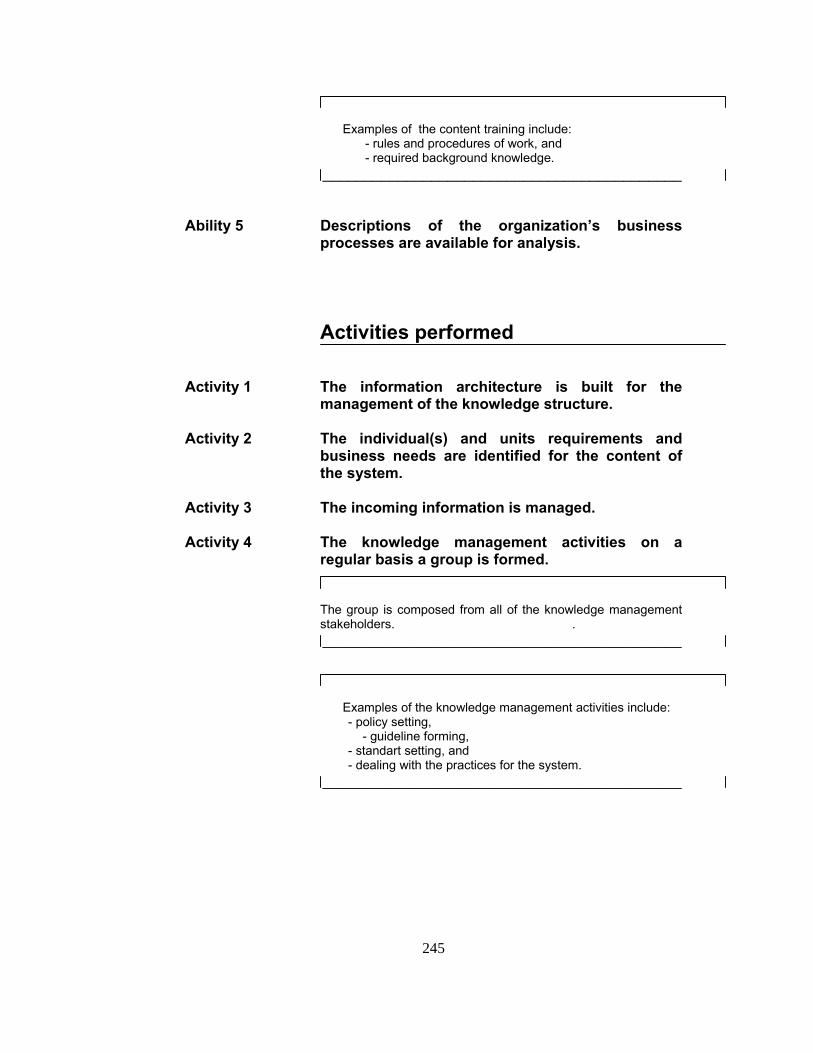
245
Examples of the content training include: - rules and procedures of work, and
- required background knowledge. ___________________________________________
Ability 5 Descriptions of the organization’s business
processes are available for analysis. Activities performed
Activity 1 The information architecture is built for the
management of the knowledge structure. Activity 2 The individual(s) and units requirements and
business needs are identified for the content of the system.
Activity 3 The incoming information is managed. Activity 4 The knowledge management activities on a
regular basis a group is formed.
The group is composed from all of the knowledge management stakeholders. .
___________________________________________
Examples of the knowledge management activities include: - policy setting,
- guideline forming, - standart setting, and - dealing with the practices for the system.
___________________________________________

246
Activity 5 Data and information is managed properly according to the organization’s management policy.
This policy typically specifies:
1. The way of establishing a knowledge structure. 2. The processes of content contribution and content
removal.
3. How the formatting guidelines will be done.
4. The prioritization rules.
5. The community definitions.
6. The editorial rules.
7. Check of the relevancy complete and up- to-date content.
Activity 6 Individual(s) are constantly informed about
changes in the business.
Examples of business include: - customers
- products - competitors.
___________________________________________
1. Training activities are hold in the launch of a new product or a
competitor.
Refer to Inter-Organizational Training Technologies key process area.
___________________________________________

247
2. Knowledge communities around products and technologies are established by the intranet.
A knowledge community is one that could be used to share such as information, data, problem, knowledge, idea, support, experience based on the individuals expertise and interests.
___________________________________________
A method and procedures database is formed.
Examples of the database include: - searching,
- tagging, and - customizable interface.
___________________________________________
Information is pushed to individuals depending on their needs.
An information push is one that if a specific information
related with the information depending on the individual’ s job need is
determined by the system, that information appears on the computer screen of the individual.
___________________________________________ Activity 7 E-learning is integrated with traditional classroom
training programs.
1. Need assessment analysis is conducted by analyzing the targeted individuals and units to determine the performance gaps.
2. Duration to develop the required skills and
competencies for the individuals is determined.
3. Knowledge and information is moved to the web.

248
4. Application of the knowledge and information in teams is enforced.
5. Classroom is used to bring people face-to-face.
Activity 8 Individual(s) is kept informed about the e-learning
activity. Activity 9 Individual(s) is kept in touch with other individuals
who are in the e-learning activities. Activity 10 Existing knowledge is made accessible to the
organization. 1. A web site is provided for the individuals to
network with each other. 2. Knowledge management strategy is defined to
identify the valuable knowledge for the organization.
3. Individuals’ expectations are documented.
4. Existing collection of data and the relationship
between the data is analyzed.
Examples of analyses include: - advanced statistical methods,
- linguistic methods, - artificial intelligence techniques, - knowledge discovering databases, - data-mining.
___________________________________________
5. Rewarding on giving an incentive for knowledge sharing and penalizing for knowledge hoarding is defined.
Activity 11 Users are participated in the identification and
communication of knowledge needs.

249
Activity 12 A sharing culture in the organization is performed
1. The meaning and benefits offering of knowledge management is explained
2. Knowledge management activities are integrated
into everyday working practices. Activity 13 Knowledge and document management concept
is communicated and transferred to individuals in the organization.
1. Knowledge infrastructure consisting of technology,
structure and culture is defined. 2. Knowledge process architecture consisting of acquisition, conversion, application and protection of knowledge is defined.
Structure refers to norms and trust mechanisms, culture refers
to shared contexts to create and share knowledge and technology refers to technology-enabled infrastructure that exists in the organization.
___________________________________________ 3. Available knowledge is organized.
User needs are analyzed in detail.
Search engines are used for document retrieval.
Keywords are set for consistent search.
Activity 14 Strategic knowledge resources of the organization
is identified. Activity 15 Knowledge is transferred through the individual(s)
in the organization and customers.

250
1. Appropriate knowledge is transferred by filtering. Depending on the position or the role of the individual in the organization.
2. Transfer medium is defined to receive the
knowledge on time.
3. Form of presentation of knowledge is defined for the proper listening or reading.
4. Opportunity is created for employees to improve
their communication skills. Activity 16 Knowledge management team is performed. The knowledge management team:
defines the knowledge management vision into implemental strategies and methods.
coordinates and facilitates knowledge sharing within the organization.
motivates individuals to turn their knowledge and experience into organizational knowledge.
___________________________________________
Knowledge is maintained by: 1. Backup is taken for security concerns to prevent
the knowledge loss.
Examples of security concerns include: - hackers, and
-accidental deletes. ___________________________________________
2. The kind of knowledge maintenance is described.
Content and the structure of knowledge are
described.

251
Chance in terms in announced that the meaning of terms may change.
The knowledge in the heads of the employees
is maintained with knowledge management considerations.
Activity 17 Knowledge sharing about a business process,
product or a problem solving is done by e-learning.
Activity 18 Knowledge is assessed for the usefulness use of
individual.
1. Documents in a repository are rated according to their quality and usefulness for individual.
Examples of rating dimensions include: - accuracy - comprehensiveness,
- timelines, and - relevance.
2. Intellectual capital covering knowledge processes, organizational culture, relationships with customers, suppliers and partners are measured.
Results of the intellectual capital indicate: - align organizational practices with strategy, - monitor the performance of organizational practices, and
-transparency for stakeholders. ___________________________________________ Activity 19 Collection and use of knowledge about customers
as improved. Activity 20 Management of the documents in the organization
is defined.

252
1. Existing paper documents are sent to electronic media.
2. Metadata of documents providing additional
information about the content is managed.
Examples of metadata include: - author name, - keywords describing the content,
-date of creation of document, - reviews about the document, and - quality ratings given to document ___________________________________________ 3. Versioning of the document is managed. Activity 21 Effectiveness of creating and integrating
knowledge is maintained.
Examples of creating and integrating knowledge include: - employing creativity techniques,
- attending conferences, - close cooperation with industry, and - close cooperation with scientific partners.
___________________________________________ Activity 22 Knowledge of employees is kept up-to-date,
retired and preserved through training. Measurement and analysis Measurement 1 Measurements are made and used to determine
the knowledge quality.

253
Examples of measurements of knowledge quality include:
- satisfaction rate with quality of knowledge , - satisfaction rate with quantity of knowledge, - knowledge search capabilities, - knowledge management system functionalities, - incentives for knowledge contribution, and - overall organizational management of knowledge.
Measurement 2 Measurements are made and used to determine
the level of knowledge sharing.
Examples of measurements of level of knowledge include:
- communication level within the organization, - intention to knowledge sharing, - organizational learning level, - commitment to organizational flexibility, and - knowledge and document management system
quality. Verifying implementation Verification 1 Senior management periodically reviews the
knowledge and document management activities. These reviews address:
1. Conformance of knowledge management activities with the organization’s stated values, policies and procedures.
2. Identification of knowledge important to the
organization.
3. Focus on the knowledge that adds value to the organization.

254
4. Status of resolution for noncompliance issues.
Verification 2 The definition and use of data on knowledge and
skills are periodically audited. Verification 3 User feedbacks are collected periodically and
evaluated to improve the knowledge and document management implementation.

255
Portal a key process area for Level 4: Integrated Web Services The purpose of Portal is to draw content from various sources and to let the individual use navigational properties, reach to business applications, searching, discussion and collaboration [17]. Portal are presented by a Web service called Portal. Portal has personalized, dynamically changing content , layout and navigation purposes responding to individual’s personal preferences and mode of access to provide a collection of information and services by keeping track of individual preferences including knowledge m and decision making purposes [81]. Content is the main source to make individual interested layout is used for content visible and attractive by using fonts, colors, headers, fosters and position of the links. Navigation is used to make individual to move from one page to another. Portal involves personalization of the site to meet the information needs of the individual excluding the information and tools that are not necessary for the individual depending on the authorization, needs and profiles of the individual [6,81]. Content management is included for quick development and deployment with content while keeping the information up-to-date with the integration of new content, databases and applications.
Goals
Goal 1 Portal is personalized according to the
individual’s needs. Goal 2 Information is disseminated or communication is
facilitated from one point.

256
Goal 3 Content is structured for resource recovery for the creation of business intelligence and competitive advantage.
Goal 4 Use of retrieved information is used for problem
solving and decision making. Goal 5 Data from multiple sources are shared and
aggregated.
Commitment to perform
Commitment 1 The organization follows a documented policy for
implementing portal. This policy typically specifies:
1. Relationship of the portal activities to the business objectives and documented values of the organization.
2. Importance of maintaining an open environment
that supports information and knowledge flow in all directions.
3. Requirement for obtaining information in all
individuals and groups.
Ability to perform
Ability 1 Adequate technological infrastructure are
provided for implementing the portal activities.

257
Ability 2 Use interface tools are identified for highly authorized and integrated view of applications.
Ability 3 Content management is delivered for the creation,
management and delivery of the structured and unstructured data types.
Examples of structured and unstructured data types
include: - Research result, - Organizational history, - project history, - documentation, - presentation, - office documents, and - multimedia files.
_____________________________________________________
1. Content input and creation from internal and
external sources and systems are provided. 2. Content is managed through out the portal life
cycle.
3. Dynamic content distribution and deployment is satisfied to individuals and external systems.
Ability 4 Security of the portal is maintained. Ability 5 Protocols are enabled to satisfy the individual
preferences.
Activities performed
Activity 1 Core applications are web-enabled. Activity 2 The information is structured on the site.

258
Examples of information include:
- specifications, - features, - options, - independent reviews, - links, - discussion boards, - favorites, - forms, - email, - message board facilities, - electronic diary, and - games.
Activity 3 Information on the site is checked regularly.
1. New information is added
2. Obsolete information is discarded.
3. Existing information is updated Activity 4 Updated information is used as an interaction
between the portal owner and its customers and suppliers.
1. Individuals working in the organization add the
information they have. 2. Targeted information is delivered.
3. Additional information is collected and correlated.
4. Available new information is disseminated to
individuals. Activity 5 Activities of the registered individual in the site is
tracked.
Tracking of the activities is used for the re-personalization of the individuals navigation.
1. Individual profile information is identified.
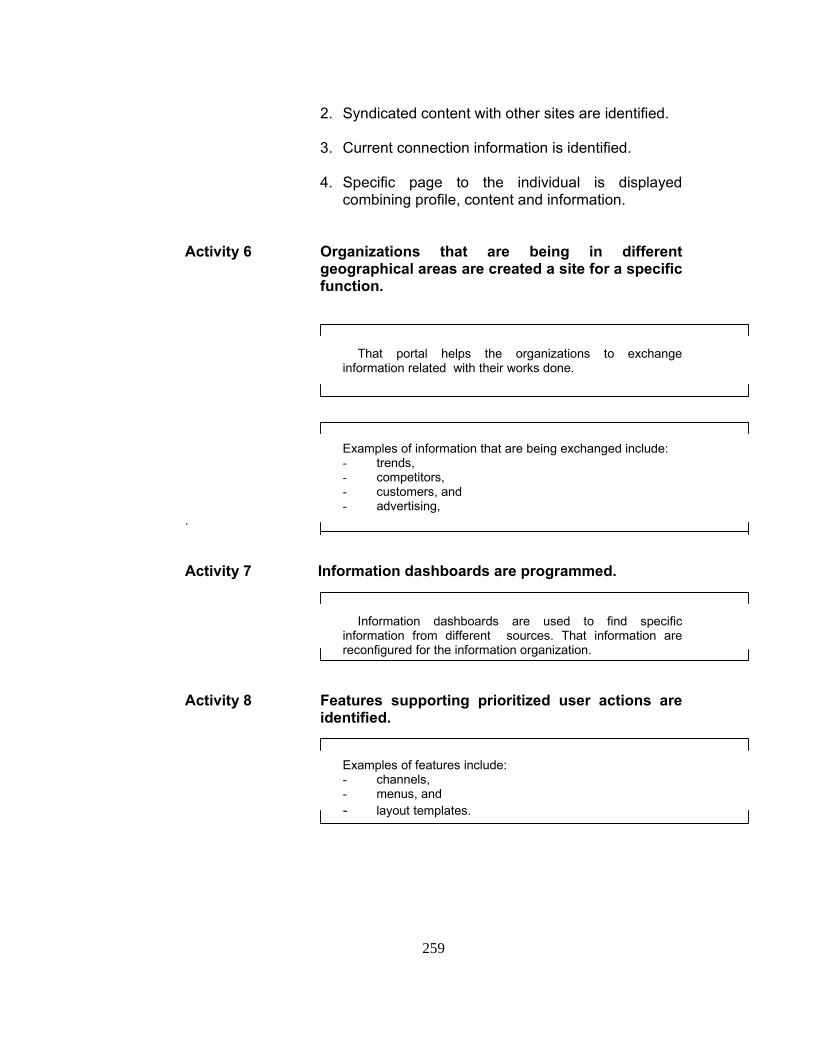
259
2. Syndicated content with other sites are identified.
3. Current connection information is identified.
4. Specific page to the individual is displayed
combining profile, content and information.
Activity 6 Organizations that are being in different
geographical areas are created a site for a specific function.
That portal helps the organizations to exchange
information related with their works done.
Examples of information that are being exchanged include:
- trends, - competitors, - customers, and - advertising,
. Activity 7 Information dashboards are programmed.
Information dashboards are used to find specific
information from different sources. That information are reconfigured for the information organization.
Activity 8 Features supporting prioritized user actions are
identified.
Examples of features include:
- channels, - menus, and - layout templates.

260
Activity 9 Knowledge is managed by structuring the content for resource recovery.
Activity 10 Critical and useful information is captured for the
right person to reach the right information to make the right decision.
Activity 11 For the different types of individuals, usage of the
information type is planned and decided.
1. Individuals click the links on portals to enter sub-portals to perform specific work tasks.
2. The identification and password of individuals are consolidated to permit access. 3. The type of information, system application and databases to be used by the individuals is identified by the system.
Activity 12 E-learning service is included. Activity 13 Content management is done for the combination
of content, navigation description and layout templates.
1. Syndicated content with external systems is
maintained.
Examples syndicated content include:
- news sources, and - professional publications.
2. Content is created.
3. Content is maintained
4. Content is structured and organized for access through browsing, searching and other applications.

261
5. Layout choices are defined to response to the individual’s preferences.
Activity 14 Accessibility from multiple browsers on multiple
platforms are maintained. Activity 15 Personalized portal is maintained.
1. Profiling is maintained to identify the site visitor.
Profiling includes the individual’ s information entered to portal and information supplied during browsing the site.
.
2. Content of the subject visited by the individual is marked or tagged.
3. Personalized content is delivered. Measurement and analysis Measurement 1 Measurements are made and used to determine
the individual’s preferences for the personalization of the portal.
Examples of measurements include: - reason of personalization, - time of personalization, - the way of personalization, - the percentage of individuals personalizing the content, - the way of content personalization, - the number of content revision, and - the percentage of web sites given..
Measurement 2 Measurements are made and used to determine
the usability of personalized features.

262
Examples of measurements include:
- error rates, - percentage of individuals getting lost, - rate of individuals getting lost, and - percentage of satisfied individuals.
Measurement 3 Measurements are made and used to determine
the quality of portal.
Examples of measurements include:
- number of broken links, - number of under construction page, and - up-to-date information.
Verifying implementation Verification 1 A responsible individual(s) verifies that portal
activities are conducted according to the organization’s documented policies.
These reviews verify that:
1. Portal activities comply with the organizations stated values, policies and documented procedures.
2. Noncompliance items are handled appropriately. Verification 2 Senior management periodically reviews the
organization’s portal activities to determine if they comply with the organization’s documented policies.

263
These reviews address:
1. Conformance of portal activities with the organization’s stated value, policies and procedures.
2. Status of resolution for noncompliance issues.
3. Rate of the information and knowledge maintained.
4. Trends related to portal activity issues.
Verification 3 Project manager periodically and on event-driven
basis reviews the organization’s portal activities. Verification 4 User feedbacks are periodically collected and
evaluated.

264
APPENDIX C4: e-CMM LEVEL 5 KEY PRACTICES Process Change Management a key process area for Level 5: Change Management The purpose of Process Change Management is to compete in the market being with the increasing competition especially gained by globalization. When the rapid and continuous development of technology integrated with the continuously changing expectations of internal and external customers, problems in planning, have not satisfied customers, increase in cost occurred. To eliminate these and much of the problems, continuous improvement in the processes are required. Process Change Management includes the development of the system; giving rapid response to changes; having a system view of business; elimination of works that are not adding value; coordination, integration and communication between the units and functions, prohibit the internal competition within the company but supports competition against outside and standardization of processes. Process change management involves five aspects [31]: Change management, project management, continuous process management, strategic planning, and technology management. Change management includes change in communication aspects, rewarding employees depending on their success, encouraging involvement to changing environment and encouraging creativity. Project management involves the planning, managing and reinforcing the change occurring in the organization by using project management tools, organizing project teams and monitoring the processes. Continuous process management is continuously evaluating and monitoring of processes.

265
Strategic planning involves setting goals for the organization for change by planning the change and setting strategic direction from the top manager. Technology management is selecting technologies and developing information architectures for the application of plans.
Goals
Goal 1 Continuous process improvement is planned. Goal 2 Customer is focused. Goal 3 Participation in improving the processes is
organization-wide.
Commitment to perform
Commitment 1 The organization follows a documented policy for
implementing process improvement activities. This policy typically specifies that:
1. The organization has quantitative, measurable goals for process improvement and tracks performance against these goals.
2. The organization’s process improvements are
directed toward improving service and product quality, increase in productivity by decreasing cycle times.
3. The organization evaluates promising technologies
for effective use.

266
4. All of the organization’s staff and managers are expected to participate in improving the processes.
Commitment 2 Senior management supports the organization’s
process improvement activities. Senior management:
1. Establishes the organization’s long-term goals and plans for process improvement.
2. Allocates resources for process improvement activities.
3. Coordinates with the unit managers to ensure they have reasonable and effective process improvement goals and plans.
4. Monitors process improvement performance against goals.
5. Maintains consistent priority focus on process improvement in the face crisis.
6. Rewards employee participation in the process improvement activities.
Ability to perform
Ability 1 Senior management receive the necessary
training for process management and improvement.
Examples of training include: - managing technological and
organizational change, - team building, - determining the main processes, - determining the prioritized processes.

267
Refer to the Inter-organizational Training Program key process area at Level 3.
Ability 2 Individuals in the organization receive informative
and extensive process change and improvement training.
Ability 3 The managers and team members of process
improvement team receive required training for the development and improvement of the processes.
Ability 2 Adequate resources and funding are provided for
process improvement activities.
5. Experienced individuals with expertise in defining and analyzing processes are available to help in evaluating, planning and supporting process development and management.
6. Tools to support process improvement are made
available.
Examples of tools to support improvement tools include: - statistical analysis tools, - database systems, - process automation tools, and - process modeling tools.
7. Resources are allocated to:
- Lead, guide and support the process improvement activities,
- Maintain the process improvement records, - Develop, control and disseminate process
changes,

268
- Establish and operate the administrative and human resources functions to conduct the communications, motivation, and recognition activities needed to maintain a high level of employee participation.
8. Funding and resources are available to support the
infrastructure needed to process improvement.
Activities performed
Activity 1 A process improvement program is established
which empowers the members of the organization to improve the processes of the organization.
Activity 2 The group responsible for the process
improvement coordinates the improvement activities.
1. Critical processes are evaluated. 2. Process map is evaluated.
3. Weak points in the processes are determined.
Activity 3 The organization develops and maintains a plan
for process improvement according to a documented procedure.
Activity 4 The process improvement activities are performed
in accordance with the process improvement plan. Activity 5 Members of the organization actively participate in
teams to develop process improvements for assigned areas.

269
Activity 6 The organization establishes a program for evaluating process improvement activities and technologies.
Measurement and analysis Measurement 1 Measurements are made and used to determine
the status of process improvement activities. Verifying implementation Verification 1 The activities for process improvement are
reviewed with senior management on a periodic basis.
Verification 2 The process quality assurance group reviews
and/or audits the activities and products or services for process improvement and reports the results.

270
Technology Change Management a key process area for Level 5: Change Management The purpose of Technology Change Management is to autonomy and control of the resources that the organization has [25]. Technology Change Management involves to the definition of centralized policy and procedures, and the management of the consistent operational disciplines [40]. Centralized policy and procedures are necessary for the accuracy and reliability of the Technology Change Management processes within and between the organizations. Technology Change Management includes privacy and environmental compliance, adherence to control standards, data integration, software asset management and license compliance.
Goals
Goal 1 Improvement in the coordination and
communication of the system. Goal 2 Better management of technology deployment,
management and asset recovery. Goal 3 Reuse of asset is satisfied.

271
Commitment to perform
Commitment 1 The organization follows a written policy for
improving its business capability. This policy typically specifies that:
1. Goals for establishing quality objectives are identified and documented. _____________________________________________
Examples for quality objectives include: - internal customer satisfaction, - external customer satisfaction, - continuous improvement, - efficiency.
2. Allocates resources for performance measurement
activities. Commitment 2 Senior management sponsors the organization's
activities for performance measurement. Senior management: 1. Helps to define a strategy that addresses the
organization's goals for product quality, productivity, and cycle time for product development.
2. Identifies metrics for the performance
measurement activities. 3. Sets goals for the improvement for each metric.

272
Ability to perform
Ability 1 A group responsible for the organization's
technology change management activities exists.
________________________________________ A group is the collection of departments, managers, and individuals who have responsibility for a set of tasks or activities. A group could vary from a single individual assigned part time, to several part-time individuals assigned from different departments, to several individuals dedicated full time. Considerations when implementing a group include assigned tasks or activities, the size of the project, the organizational structure, and the organizational culture.
1. Potential areas for applying new technology is
explored. 2. New technologies are acquired, installed, and
customized.
3. Technology change management activities are communicated and coordinated with related research and development activities within the organization.
4. Problems and enhancements are communicated
with the technology suppliers. Ability 2 Technologies are selected and acquired for
coordinating the business transactions on the Web according to a documented procedure.
This procedure typically specify:
1. Requests for the acquisition of new technologies are documented.

273
Management approval is required for technologies with projected expenses above a predefined level.
2. Components that share data are decided. 3. Transaction completion support is defined.
definition of conformation of the completed
work, definition of cancellation of the completed work.
Ability 3 Adequate resources and funding are provided to
establish and staff a group responsible for the organization's technology change management activities.
1. Experienced staff members with expertise in specialized areas are available to this group to help in evaluating, planning, and supporting initiatives for technology change management.
2. Tools to support technology change management
are made available. Ability 4 Members of the group responsible for the
organization's technology change management activities receive required training to perform these activities.
________________________________________ Examples of training include: - technology transfer and change management, - business process improvement, - tools and methods used by the organization, - analytical and support facilities available to the organization, - cost analysis techniques, and - principles of statistical quality control.

274
Refer to the Inter-Organizational Training and Continuous e-Learning key process area.
Activities performed
Activity 1 The organization develops and maintains a plan
for technology change management. This plan: 1. Covers the assigned responsibilities and resources
required, including staff and tools. 2. Defines the long-term technical strategy for
automating and improving the organization's standard business process and enhancing the organization's market position.
3. Identifies the procedures to be followed in
performing the organization's technology change management activities.
4. Describes the approach for introducing new
technologies to address specific needs of the organization and projects.
Process areas that are potential areas for technology changes are identified.
Approaches for identifying opportunities for technology changes are identified.
The specific planned or candidate technologies are identified.

275
Where appropriate, the life span for the planned technologies is estimated, from introduction to replacement.
The make/buy tradeoff studies are documented.
Approaches for assessing unproven candidate technologies are defined.
5. Is reviewed by affected managers.
Activity 2 Integration of systems and processes between the
business’ key partners is provided.
1. Information technology infrastructure is enabled for the application integration.
2. Interfaces are designed to support business
applications.
3. Security system is made available for the integration of applications.
Activity 3 Key business processes between the business
partners are improved and automated. Activity 4 Management of business assets are addressed.
1. Current asset inventory is performed. 2. Purchasing procedures are developed.
3. Installation and configuration procedures are developed.
4. Replacement and disposition strategy is
developed. Activity 5 Business transaction activities are managed.
1. A web service having a context for business transactions is created.

276
2. A coordinator is dealt with the management of the context of the web site and transaction completion support.
3. An initiation starts a business transaction by
sending message to the coordinator.
4. The transaction work is done by the help of the
web services. Activity 6 Inventory control of the equipments is done
regularly. 1. Life cycle of the equipments is evaluated. 2. Reuse of mid-life idle equipment is preferred
instead of the procurement of new equipment.
3. Stockpiling idle assets is eliminated. Activity 7 Project management activities are implemented
together with the technology change management activities.
Activity 8 Technologies are selected and acquired for the
organization and according to a documented procedure.
This procedure typically specifies that:
1. Requests for the acquisition of new technologies are
documented.
Management approval is required for technologies with projected expenses above a predefined level.
2. Preliminary cost/benefit analyses are performed for
the potential technology changes.

277
3. Predefined and approved selection criteria are used to identify the highest potential benefits.
4. Requirements and plans for the selected technology
changes are defined and documented.
Where practical, the expected life cycle and plans for replacement/upgrade are estimated.
Where appropriate, tradeoff studies are
performed, reviewed, and documented to determine whether the technology should be developed internally or procured externally.
Where appropriate, the plan provides for installing the new technology on a pilot basis to determine its effectiveness and economic benefits.
The requirements and plans are reviewed by
the managers of the affected groups and the group responsible for technology change management activities.
Activity 9 Technology Change Management activities are
outsourced, if necessary.
Outsourcing is contracting with another company or person to do a particular function to gain efficiency in operations and decrease in costs. Also, by outsourcing, a part of the risk is shared with the outsourced partner.

278
Measurement and analysis Measurement 1 Measurements are made and used to determine
the reliability of critical processes.
Example of critical processes include: - data destruction.
Variance from the goals set is determined. Measurement 2 Measurements are made and used to determine
the return on information technology assets.
Return on Information Technology Assets (ITROA) indicates the value of assets. ITROA is an estimation technique used to calculate the benefits of managing an IT infrastructure. ITROA =($Output value – $TCO)*%Utilization [39]. Output value is the workforce percentage of knowledge workers multiplied by total enterprise revenue. Total Cost of Ownership (TCO) is the total IT spent annually both on the hardware and software costs. Utilization is the percentage of IT assets.
Measurement 3 Measurements are made and used to determine
the status of the organization's activities for technology change management.
Examples of measurements include: - the overall technology change activity, including number,
type, and size of changes; and

279
- the effect of implementing the technology change, compared to the goals.
Verifying implementation Verification 1 The status of the technology change management
activities are reviewed with senior management to determine if they comply with its documented policies.
These reviews:
1. Summarize the activities for technology change management.
2. Identify needed strategy changes.
3. Result in the resolution of issues.
4. Result in the approval of revisions to the plans for
technology change management, as appropriate.

280
APPENDIX D. KEY PROCESS AREA ANALYSIS
Level 2- Vision and Policy Definition for eTransformation Project
0102030405060708090
100P
roje
ct p
lan
occu
ranc
e
eTra
nsfo
rmat
ion
team
Top
leve
l pro
ject
man
ager
Effi
cien
cym
easu
rem
ent
Top
leve
lsu
ppor
t
Top
leve
lin
itiat
ive
Fund
ing
SW
OT
eTra
nsfo
rmat
ion
stra
tegy
docu
men
t
Percent
Figure D.1 Evaluation of Vision and Policy Definition for e-Transformation
Project at Level 2
Level 2- Organization Information Systems
0
5
10
15
20
25
30
35
40
Decision supportsystem
Managementinformation system
ERP
Percent
Figure D.2 Evaluation of Organization Information System at Level 2

281
Level 2-Intranet
0102030405060708090
100
Intra
net
Form
al in
ter-
com
mun
icat
ion
File
sha
ring
Virt
ual m
eetin
g
Dat
abas
eac
cess
Web
bas
edap
plic
atio
ns
Com
mitt
ee fo
rth
e co
nten
t
Inte
rnet
acc
ess
to in
trane
t
eSig
natu
reus
age
Per
cent
age
Figure D.3 Evaluation of Intranet at Level 2
Level 2-IT Infrastucture
0
5
10
15
20
25
Inte
grat
edin
form
atio
nsy
stem
s
Onl
ine
cust
omer
dem
and
Percent
Figure D.4 Evaluation of IT Infrastructure at Level 2

282
Level 3-Customer Relationship Management System
0102030405060
Cus
tom
erun
/sat
isfa
ctio
n
Cus
tom
erun
/sat
isfa
ctio
n
Cus
tom
erun
/sat
isfa
ctio
n
Dat
a an
alys
is
IS-C
RM
inte
grat
ion
Sel
ling
orde
rfro
m e
lect
roni
c
Pro
duct
/pro
cess
acce
ss fr
om
CR
M p
roje
ct
eCom
mer
ce
Perventage
Figure D.5 Evaluation of Customer Relationship Management System at
Level 3
Level 3-Inter-Organizational Training Technologies
0
1020
3040
5060
70
Com
pute
rba
sed
educ
aito
n
Politi
cs
Educ
atio
nal
unit
Infra
stru
ctur
e
Prog
ram
eval
uatio
n
Prog
ram
track
ing
Con
tent
prep
arat
ion
Con
tent
eval
uatio
n
Feed
back
mea
sure
men
t
Percantage
Figure D.6 Evaluation of Inter-Organizational Training Technologies at
Level 3

283
Level 3-Project Management Concept
0102030405060708090
Proj
ect
evol
utio
npl
an
Proj
ect r
isk
asse
ssm
ent
Team
per
proj
ect
Percentage
Figure D.7 Evaluation of Project Management Concept at Level 3
Level 3-Extranet
0
10
20
30
40
50
Extranet Personalized portals
Percentage
Figure D.8 Evaluation of Extranet at Level 3

284
Level 3 - Security Policies
0102030405060708090
100
Organizationalsecurity policies
Security levelapplication
Security certificate
Per
cent
age
Figure D.9 Evaluation of Security Policies at Level 3
Level 4-Performance Measurement
05
101520253035
Qua
lityce
rtific
atio
nav
aila
bility
Qua
litym
etric
s ar
ede
fined
Qua
litym
anag
emen
tsy
stem
isin
tegr
ated
Pers
onel
train
ing
for
mea
sure
men
t
Qua
litym
anag
emen
tap
plic
atio
nsar
e tra
cked
Percentage
Figure D.10 Evaluation of Performance Management at Level 4

285
Level 4-Continuous eLearning
02468
1012
e-Le
arni
ng is
appl
ied
Pol
icy
avai
labi
lity
Man
agem
ent
unit
avai
labi
lity
Infra
stru
ctur
eav
aila
bilit
y
Pro
gram
isev
alua
ted
Pro
gram
istra
cked
Con
tent
ispr
epar
ed
Con
tent
isev
alua
ted
Mea
sure
men
tby
feed
back
Per
cent
age
Figure D.11 Evaluation of Continuous e-Learning at Level 4
Level 4-Document/Information Management Systems
010203040506070
Whi
ch d
ocum
ent
is in
whi
chde
partm
ent i
stra
cked
Doc
umen
ts a
resc
anne
d to
put
on
com
pute
r
Dat
a m
inin
g is
done
on
the
docu
men
t/inf
orm
atio
n on
han
d
Inte
llige
nt s
earc
his
app
lied
Qua
lity
man
agem
ent
syst
em is
inte
grat
ed w
ithor
gani
zatio
nal
Figure D.12 Evaluation of Document/Information Management System at
Level 4

286
Level 4-Portal
05
101520253035404550
Por
tal
avai
labi
lity
Por
tal l
evel
Por
tal
stru
ctur
eev
alua
tion
Cus
tom
erle
arni
ng a
ndtra
inin
gpr
ogra
m
Sat
isfa
ctio
nm
easu
rem
ent
met
hod
avai
labi
lity
Percentage
Figure D.13 Evaluation of Portal at Level 4
Level 5-Process Change Management
0
1020
30
40
5060
70
Con
tinuo
uspr
oces
sim
prov
emen
tpl
anav
aila
bilit
y
Org
aniz
atio
nal
parti
cipa
tion
for p
roce
ssim
prov
emen
t
Sup
porte
d by
top
man
agem
ent
Dep
artm
ent
man
ager
s ar
etra
ined
Per
sone
l is
train
ed
Perc
enta
ge
Figure D.14 Evaluation of Process Change Management at Level 5

287
Level 5-Technology Change Management
0102030405060708090
100
Pla
nnin
g
New
tech
nolo
gyap
plic
atio
n
Writ
ten
docu
men
tatio
n
Sup
porte
d by
top
man
agem
ent
Hav
e a
team
Per
cent
age
Figure D.15 Evaluation of Technology Change Management at Level 5

288
APPENDIX E. MATURITY LEVEL OF ORGANIZATIONS*
ORGANIZATION Maturity
Level Dış Ticaret Müsteşarlığı (DTM) 3.52 Rekabet Kurumu 3.47 İşkur 3.55 Hazine Bakanlığı 3.01 Emniyet Müdürlüğü 3.84 Türk Standartları Enstitüsü (TSE) 3.54 Milli Prodüktivite Merkezi (MPM) 2.75 Ortadoğu Teknik Üniversitesi (ODTU) 3.8 Sermaye Piyasası Kurumu (SPK) 3.4 Emekli Sandığı 3.34 Devlet Planlama Başkanlığı 3.57 Yibitas Lafarge 3.5 Devlet Su İşleri (DSI) 3.49 Öğrenci Seçme ve Yerleştirme Merkezi (OSYM) 3.04 Calisma Bakanlığı 3.78 Merkez Bankası 3.74 Devlet Planlama Teşkilatı (DPT) 3.25 Sağlık Bakanlığı 3.24 MESA 3.88 GAMA 3.67 Telekomunikasyon Kurumu 2.9 Radyo Televizyon Ust Kurulu (RTUK) 2.64 Numune Hastanesi 3.84 Tapu ve Kadastro 3.31 Adalet Bakanlığı 3.49 Ulastirma Bakanlığı 3.35 Gümrük Müsteşarlığı 3.52 Devlet Demiryolları (DDY) 3.83 Eximbank 3.25 Kültür ve Turizm Bakanlığı 3.82
* Depending on COBIT calculation

289
APPENDIX F. MATURITY LEVEL DETERMINATION OF EACH ORGANIZATION
DTM
A B A/B A/sum A
Maturity Level
Sum of statements compliance
values
Number of maturity level statements
Maturity level compliance
value
Normalized compliance
values Contribution 2 12 24 0.50 0.215 0.43 3 19 27 0.70 0.303 0.91 4 14 27 0.52 0.223 0.89 5 6 10 0.60 0.258 1.29
TOTAL 2.32 1.000 3.52
REKABET KURUMU A B A/B A/sum A
Maturity Level
Sum of statements compliance
values
Number of maturity level statements
Maturity level compliance
value
Normalized compliance
values Contribution 2 15 24 0.63 0.332 0.66 3 12 27 0.44 0.236 0.71 4 3 27 0.11 0.059 0.24 5 7 10 0.70 0.372 1.86
TOTAL 1.88 1.000 3.47
ISKUR A B A/B A/sum A
Maturity Level
Sum of statements compliance
values
Number of maturity level statements
Maturity level compliance
value
Normalized compliance
values Contribution 2 13 24 0.54 0.224 0.45 3 22 27 0.81 0.337 1.01 4 7 27 0.26 0.107 0.43 5 8 10 0.80 0.331 1.66
TOTAL 2.42 1.000 3.55

290
HAZINE MÜSTEŞARLIĞI A B A/B A/sum A
Maturity Level
Sum of statements compliance
values
Number of maturity level statements
Maturity level compliance
value
Normalized compliance
values Contribution 2 11 24 0.46 0.389 0.78 3 12 27 0.44 0.378 1.13 4 2 27 0.07 0.063 0.25 5 2 10 0.20 0.170 0.85
TOTAL 1.18 1.000 3.01
EMNİYET MÜDÜRLÜĞÜ A B A/B A/sum A
Maturity Level
Sum of statements compliance
values
Number of maturity level statements
Maturity level compliance
value
Normalized compliance
values Contribution 2 6 24 0.25 0.109 0.22 3 21 27 0.78 0.338 1.02 4 10 27 0.37 0.161 0.64 5 9 10 0.90 0.392 1.96
TOTAL 2.30 1.000 3.84
TSE A B A/B A/sum A
Maturity Level
Sum of statements compliance
values
Number of maturity level statements
Maturity level compliance
value
Normalized compliance
values Contribution 2 9 24 0.38 0.238 0.48 3 13 27 0.48 0.305 0.91 4 6 27 0.22 0.141 0.56 5 5 10 0.50 0.317 1.58
TOTAL 1.58 1.000 3.54

291
MPM
A B A/B A/sum A
Maturity Level
Sum of statements compliance
values
Number of maturity level statements
Maturity level compliance
value
Normalized compliance
values Contribution 2 6 24 0.25 0.360 0.72 3 10 27 0.37 0.533 1.60 4 2 27 0.07 0.107 0.43 5 0 10 0.00 0.000 0.00
TOTAL 0.69 1.000 2.75
ODTU A B A/B A/sum A
Maturity Level
Sum of statements compliance
values
Number of maturity level statements
Maturity level compliance
value
Normalized compliance
values Contribution 2 8 24 0.33 0.174 0.35 3 14 27 0.52 0.271 0.81 4 7 27 0.26 0.136 0.54 5 8 10 0.80 0.419 2.09
TOTAL 1.91 1.000 3.80
SPK A B A/B A/sum A
Maturity Level
Sum of statements compliance
values
Number of maturity level statements
Maturity level compliance
value
Normalized compliance
values Contribution 2 17 24 0.71 0.359 0.72 3 10 27 0.37 0.188 0.56 4 8 27 0.30 0.150 0.60 5 6 10 0.60 0.304 1.52
TOTAL 1.98 1.000 3.40
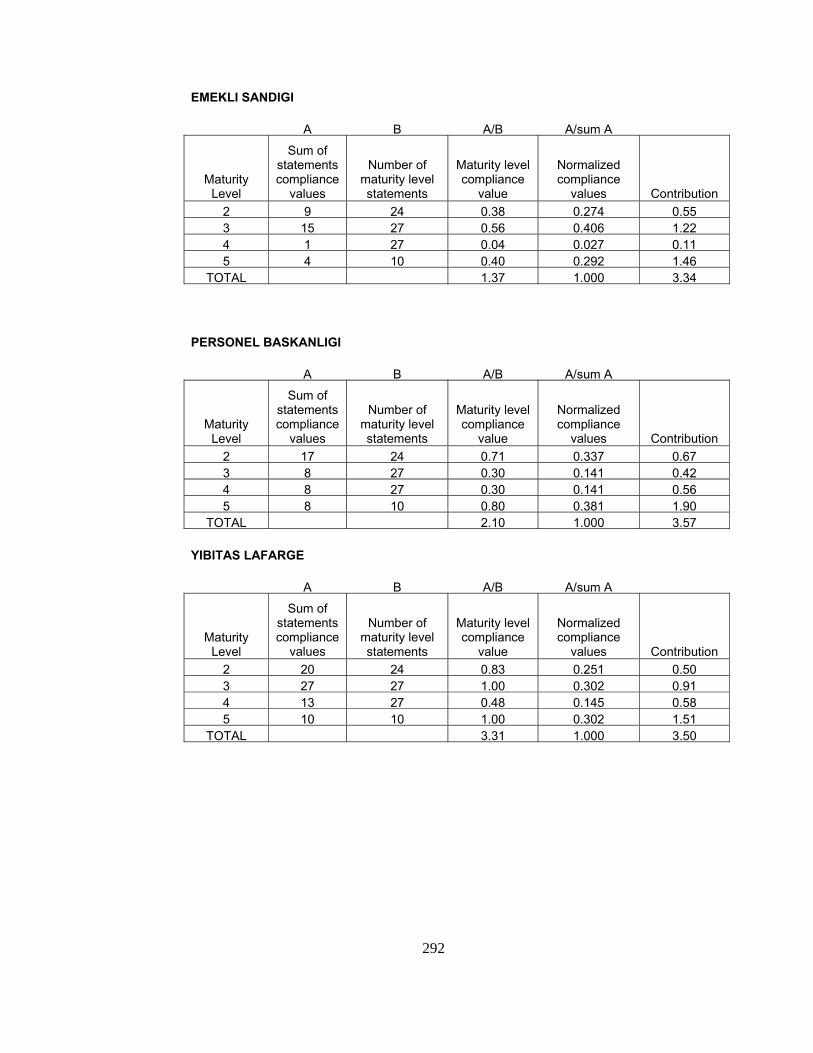
292
EMEKLI SANDIGI A B A/B A/sum A
Maturity Level
Sum of statements compliance
values
Number of maturity level statements
Maturity level compliance
value
Normalized compliance
values Contribution 2 9 24 0.38 0.274 0.55 3 15 27 0.56 0.406 1.22 4 1 27 0.04 0.027 0.11 5 4 10 0.40 0.292 1.46
TOTAL 1.37 1.000 3.34
PERSONEL BASKANLIGI A B A/B A/sum A
Maturity Level
Sum of statements compliance
values
Number of maturity level statements
Maturity level compliance
value
Normalized compliance
values Contribution 2 17 24 0.71 0.337 0.67 3 8 27 0.30 0.141 0.42 4 8 27 0.30 0.141 0.56 5 8 10 0.80 0.381 1.90
TOTAL 2.10 1.000 3.57
YIBITAS LAFARGE
A B A/B A/sum A
Maturity Level
Sum of statements compliance
values
Number of maturity level statements
Maturity level compliance
value
Normalized compliance
values Contribution 2 20 24 0.83 0.251 0.50 3 27 27 1.00 0.302 0.91 4 13 27 0.48 0.145 0.58 5 10 10 1.00 0.302 1.51
TOTAL 3.31 1.000 3.50

293
DSI A B A/B A/sum A
Maturity Level
Sum of statements compliance
values
Number of maturity level statements
Maturity level compliance
value
Normalized compliance
values Contribution 2 16 24 0.67 0.266 0.53 3 20 27 0.74 0.296 0.89 4 8 27 0.30 0.118 0.47 5 8 10 0.80 0.320 1.60
TOTAL 2.50 1.000 3.49
OSYM A B A/B A/sum A
Maturity Level
Sum of statements compliance
values
Number of maturity level statements
Maturity level compliance
value
Normalized compliance
values Contribution 2 14 24 0.58 0.465 0.93 3 9 27 0.33 0.266 0.80 4 1 27 0.04 0.030 0.12 5 3 10 0.30 0.239 1.20
TOTAL 1.25 1.000 3.04
CALISMA BAKANLIĞI A B A/B A/sum A
Maturity Level
Sum of statements compliance
values
Number of maturity level statements
Maturity level compliance
value
Normalized compliance
values Contribution 2 11 24 0.46 0.243 0.49 3 8 27 0.30 0.157 0.47 4 9 27 0.33 0.177 0.71 5 8 10 0.80 0.424 2.12
TOTAL 1.89 1.000 3.78

294
MERKEZ BANKASI A B A/B A/sum A
Maturity Level
Sum of statements compliance
values
Number of maturity level statements
Maturity level compliance
value
Normalized compliance
values Contribution 2 10 24 0.42 0.187 0.37 3 20 27 0.74 0.332 1.00 4 2 27 0.07 0.033 0.13 5 10 10 1.00 0.448 2.24
TOTAL 2.23 1.000 3.74
DPT A B A/B A/sum A
Maturity Level
Sum of statements compliance
values
Number of maturity level statements
Maturity level compliance
value
Normalized compliance
values Contribution 2 14 24 0.58 0.499 1.00 3 3 27 0.11 0.095 0.29 4 2 27 0.07 0.063 0.25 5 4 10 0.40 0.342 1.71
TOTAL 1.17 1.000 3.25
SAGLIK BAKANLIĞI A B A/B A/sum A
Maturity Level
Sum of statements compliance
values
Number of maturity level statements
Maturity level compliance
value
Normalized compliance
values Contribution 2 15 24 0.63 0.364 0.73 3 15 27 0.56 0.323 0.97 4 1 27 0.04 0.022 0.09 5 5 10 0.50 0.291 1.46
TOTAL 1.72 1.000 3.24

295
MESA
A B A/B A/sum A
Maturity Level
Sum of statements compliance
values
Number of maturity level statements
Maturity level compliance
value
Normalized compliance
values Contribution 2 9 24 0.38 0.201 0.40 3 10 27 0.37 0.198 0.59 4 6 27 0.22 0.119 0.48 5 9 10 0.90 0.482 2.41
TOTAL 1.87 1.000 3.88
GAMA A B A/B A/sum A
Maturity Level
Sum of statements compliance
values
Number of maturity level statements
Maturity level compliance
value
Normalized compliance
values Contribution 2 16 24 0.67 0.331 0.66 3 6 27 0.22 0.110 0.33 4 6 27 0.22 0.110 0.44 5 9 10 0.90 0.448 2.24
TOTAL 2.01 1.000 3.67
TELEKOMINIKASYON ÜST KURUMU A B A/B A/sum A
Maturity Level
Sum of statements compliance
values
Number of maturity level statements
Maturity level compliance
value
Normalized compliance
values Contribution 2 14 24 0.58 0.441 0.88 3 8 27 0.30 0.224 0.67 4 12 27 0.44 0.336 1.34 5 0 10 0.00 0.000 0.00
TOTAL 1.32 1.000 2.90

296
RTUK A B A/B A/sum A
Maturity Level
Sum of statements compliance
values
Number of maturity level statements
Maturity level compliance
value
Normalized compliance
values Contribution 2 6 24 0.25 0.360 0.72 3 12 27 0.44 0.640 1.92 4 0 27 0.00 0.000 0.00 5 0 10 0.00 0.000 0.00
TOTAL 0.69 1.000 2.64
NUMUNE HASTANESİ A B A/B A/sum A
Maturity Level
Sum of statements compliance
values
Number of maturity level statements
Maturity level compliance
value
Normalized compliance
values Contribution 2 11 24 0.46 0.271 0.54 3 7 27 0.26 0.153 0.46 4 2 27 0.07 0.044 0.18 5 9 10 0.90 0.532 2.66
TOTAL 1.69 1.000 3.84
TAPU KADASTRO A B A/B A/sum A
Maturity Level
Sum of statements compliance
values
Number of maturity level statements
Maturity level compliance
value
Normalized compliance
values Contribution 2 11 24 0.46 0.233 0.47 3 23 27 0.85 0.433 1.30 4 7 27 0.26 0.132 0.53 5 4 10 0.40 0.203 1.02
TOTAL 1.97 1.000 3.31

297
ADALET BAKANLIĞI A B A/B A/sum A
Maturity Level
Sum of statements compliance
values
Number of maturity level statements
Maturity level compliance
value
Normalized compliance
values Contribution 2 20 24 0.83 0.251 0.50 3 25 27 0.93 0.278 0.84 4 18 27 0.67 0.200 0.80 5 9 10 0.90 0.271 1.35
TOTAL 3.33 1.000 3.49
ULASTIRMA BAKANLIĞI A B A/B A/sum A
Maturity Level
Sum of statements compliance
values
Number of maturity level statements
Maturity level compliance
value
Normalized compliance
values Contribution 2 7 24 0.29 0.198 0.40 3 21 27 0.78 0.529 1.59 4 0 27 0.00 0.000 0.00 5 4 10 0.40 0.272 1.36
TOTAL 1.47 1.000 3.35
GUMRUK MÜSTEŞARLIĞI A B A/B A/sum A
Maturity Level
Sum of statements compliance
values
Number of maturity level statements
Maturity level compliance
value
Normalized compliance
values Contribution 2 15 24 0.63 0.239 0.48 3 22 27 0.81 0.312 0.94 4 10 27 0.37 0.142 0.57 5 8 10 0.80 0.306 1.53
TOTAL 2.61 1.000 3.52
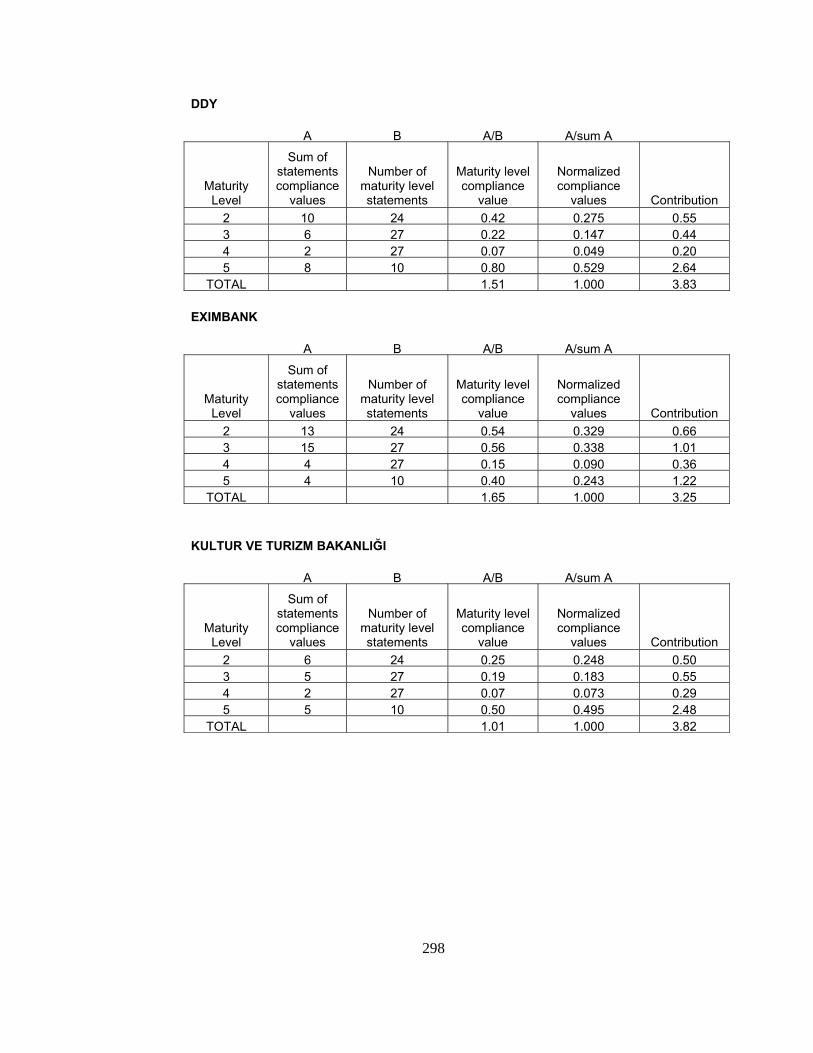
298
DDY A B A/B A/sum A
Maturity Level
Sum of statements compliance
values
Number of maturity level statements
Maturity level compliance
value
Normalized compliance
values Contribution 2 10 24 0.42 0.275 0.55 3 6 27 0.22 0.147 0.44 4 2 27 0.07 0.049 0.20 5 8 10 0.80 0.529 2.64
TOTAL 1.51 1.000 3.83
EXIMBANK A B A/B A/sum A
Maturity Level
Sum of statements compliance
values
Number of maturity level statements
Maturity level compliance
value
Normalized compliance
values Contribution 2 13 24 0.54 0.329 0.66 3 15 27 0.56 0.338 1.01 4 4 27 0.15 0.090 0.36 5 4 10 0.40 0.243 1.22
TOTAL 1.65 1.000 3.25
KULTUR VE TURIZM BAKANLIĞI A B A/B A/sum A
Maturity Level
Sum of statements compliance
values
Number of maturity level statements
Maturity level compliance
value
Normalized compliance
values Contribution 2 6 24 0.25 0.248 0.50 3 5 27 0.19 0.183 0.55 4 2 27 0.07 0.073 0.29 5 5 10 0.50 0.495 2.48
TOTAL 1.01 1.000 3.82

299
APPENDIX G. POTENTIAL FACTORS THAT INFLUENCE ORGANIZATIONAL TRANSFORMATION
Some factors are determined that are important for e-Transformation.
These factors are matched with relevant key process areas defined in e-
CMM model.
GENERAL FEATURES AFFECTING ORGANIZATIONAL
TRANSFORMATION INCLUDED IN THE
KEY PROCESS AREA OF
1 Leader who owns the e-transformation process and spearhead during the process Planning
2 Vision developed by the senior management and his team Planning, Project Management
3 Corporate culture created by open and honest communications, vertically and horizontally, across the company.
Information Management
4 A plan to define the roles and responsibilities Project Management
5 Communications strategy for the insiders of the organization and for feedback
Information Management
6 Compliance and quality defining criteria to assess the organization's capacity to ensure its information holdings are not compromised
Information Management, Security
7 Compliance and quality includes information quality, security, privacy, business continuity and compliance Security
8 Technology integrated across the organization to support the delivery of information, programs and services
Technology Management
9 Principles, policies and standards should exist, understood and applied Infrastructure
10 Change Management mechanisms to facilitate the adoption of change
Change Management
11 Individual and organizational learning Training, Information Management

300
12 Intranet for communication, employee self-service, collaboration and knowledge management
Intranet, Training, Information Management
13 Enterprise portals to provide users with seamless access to relevant content, tools and applications through a personalized, user-driven experience
Portals, Information Management
14 Collaboration for structured cooperation among employees around business processes, tasks and documents to further business objectives.
Project Management, Change Management
15 Information sharing Information Management
16 Communities of practice-groups of people within an organization to solve a common class of problems
Project Management
17 Evaluation and measurement of processes or services provided Performance Measurement
18 Serve customer expectations and needs Customer Relationship Management
19 Achieving process change Change Management
20 Changing the information culture Change Management
21 Create new forms of partnership and new types of organization
Change Management, Information Management, e-Transformation
22 Develop close partnerships Information Management
23 Reduce the need for agents and intermediaries by providing employee or customer self-service facilities
Change Management, Information Management
24 Achieve functionality
Change Management, Information Management
25 Globalization of operations
Change Management, Information Management, Training, Project Management, e-Transformation

301
26 Produce better information, with a greater level of detail Information Management, Training
27 Make information available to allow better decisions to be madeInformation Management, Training
28 Increase the opportunity for flexible working place and time
Change Management, Information Management, e-Transformation, Intranet
29 Increase the value of skills and knowledge by sharing information
Information Management
30 Ability to examine, visualize and communicate the value offered by emerging information technology
Planning, Change Management
31 Relate all employees to information technology and the way it can transform business processes
Change Management, Training
32 Data management Information Management
33 Manage outsourced services by evaluating potential service options, manage the transition to outsourced services and manage service levels and service evaluation
Planning
34 Technology transfer of successful applications, platforms and services
Change Management
35 Existence of electronic links with the organization's customers Change Management, Infrastructure
36 Existence of electronic links with the organization's suppliers Change Management, Infrastructure
37 Restructuring of business processes, where appropriate, through out the organization
Change Management
38 Visualizing organizational activities through out the organization Performance Measurement
39 Learn and explore functionality of installed information technology tools and applications
Training, Infrastructure, Change Management
40 Integrate the business and IT strategic planning
Planning
41 Appropriateness of data architecture Infrastructure

302
42 Appropriateness of network architecture Infrastructure
43 Need for knowledge integration Infrastructure
44 Support learning by doing - communication, coordination and collaboration - in an interactive mode
Training, Infrastructure, Information Management
45 Take the advantage of knowledge integration and transfer across organizations and communities
Planning, Infrastructure, Information Management
46
Transitional governance having experienced individuals about technology, e-business and/or venture capital for a perspective on online initiative and decision making for funding transformation initiatives for annual budgeting
Planning
47 Implement processes and structures to enable the exchange of information between different business divisions without making “e” and “non-e” distinction.
Change management
48 Cross-company teamwork and communication
Planning, Infrastructure, Information Management