measuring learning outcomes in higher education using the
TRANSCRIPT
Listening. Learning. Leading.®
Measuring Learning Outcomes in Higher Education Using the Measure of Academic
Proficiency and Progress (MAPP)
Ou Lydia Liu
September 2008
ETS RR-08-47
Research Report
September 2008
Measuring Learning Outcomes in Higher Education Using the Measure of Academic
Proficiency and Progress (MAPP)
Ou Lydia Liu
ETS, Princeton, NJ

Copyright © 2008 by Educational Testing Service. All rights reserved.
ETS, the ETS logo, and LISTENING. LEARNING. LEADING. are registered trademarks of Educational Testing
Service (ETS).
SAT is a registered trademark of the College Board.
As part of its nonprofit mission, ETS conducts and disseminates the results of research to advance
quality and equity in education and assessment for the benefit of ETS' constituents and the field.
ETS Research Reports provide preliminary and limited dissemination of ETS research prior to
publication. To obtain a PDF or a print copy of a report, please visit:
http://www.ets.org/research/contact.html
IMPORTANT NOTICE (August 17, 2010) – The following research report was conducted using
the instrument formerly known as MAPP (the Measure of Academic Proficiency and Progress). In
August of 2009, the MAPP test was renamed the ETS® Proficiency Profile. Although the test is
now known by a different name, no changes have been made to the form or content of this
instrument. Therefore, MAPP and ETS Proficiency Profile should be considered in all ways the
same assessment, and the following research based on the test known as MAPP is equally relevant
to the test known as the ETS Proficiency Profile.

i
Abstract
The Secretary of Education’s Commission on the Future of Higher Education emphasizes
accountability in higher education as one of the key areas of interest. The Voluntary System of
Accountability (VSA) was developed to evaluate the effectiveness of general public college
education. This study examines how student progress in college, indicated by the performance
difference between freshmen and seniors after controlling for admission scores, can be measured
using the Measure of Academic Proficiency and Progress (MAPP) test. A total of 6,196 students
from 23 institutions were included in this study. Results indicated that MAPP was able to
differentiate the performance between freshmen and seniors after controlling for SAT®/ACT
scores. The institutions were classified into 10 groups on the basis of the difference in the actual
vs. expected MAPP performance. This study provides an example of how MAPP can be used to
evaluate value-added performance in college education. Issues such as student sampling and test-
taking motivation are discussed.
Key words: Higher education, MAPP, outcome assessment, value-added, voluntary system of
accountability

ii
Acknowledgments
This study was a collaborative effort between the Research and Development and the Higher
Education and School Assessments divisions at ETS. The Data Collection and Scoring,
Reporting, & Technology groups were also involved in this process. The following personnel (in
alphabetical order) at ETS made a significant contribution to the completion of this study: Luis
Acosta, Brent Bridgeman, Lawrence McFarlane, Steve Meshanko, Kathy Miller, Kathy O’Neil,
David Payne, Kathi Perlove, Vanessa Thompson (intern), Namrata Tognatta, Sailesh Vezzu,
Michael Walker, Cathy Wendler, William Wynne, John Young, Mary Ann Zaborowski, and
Wenmin Zhang. The author is also grateful to the 23 institutions for their participation in this
study.

1
As the No Child Left Behind Act (NCLB; No Child Left Behind Act of 2001, 2002)
brought unprecedented attention to accountability in K–12 education, the call for accountability
in higher education has also received increasing levels of attention. The urgency to evaluate the
effectiveness of college education and demonstrate student learning is symbolized by the
formation of a Commission on the Future of Higher Education, founded by Secretary of
Education Margaret Spellings, in September 2005. Accountability is one of the four key areas
emphasized in the Commission’s first report released in September 2006 (U.S. Department of
Education, 2006), with the other three being access, affordability, and the standards of quality in
instruction. The report commented on the nation’s “remarkable absence of accountability
mechanisms to ensure that colleges succeed in educating students” (p. x) and pointed out that
accountability is vital to ensuring the success of reforms in the other three key areas. This report
called for solid evidence of how much students have learned in colleges and emphasized that the
evidence should be comparable across institutions.
Accountability in higher education is needed for both internal and external reasons. As
tuition costs and other college expenses continue to climb, students, parents, and policy makers
want to know whether their investment is paying off and if the money can be spent more
effectively. Internally, institutions need the evaluation to correct shortcomings in instruction and
to better prepare students for the global marketplace. Externally, accountability results are
needed for transparency and public credibility.
Against this backdrop, the American Association of State Colleges and Universities
(AASCU) and the National Association of State Universities and Land-Grant Colleges
(NASULGC) developed an initiative, the Voluntary System of Accountability (VSA;
http://www.voluntarysystem.org), to evaluate core educational outcomes in higher education and
improve public understanding of how universities and colleges operate. The AASCU and the
NASULGC are two leading organizations in public higher education. Collectively they have
more than 525 member institutions representing 7.5 million students in the United States, and
they award 70% of bachelor's degrees in the United States each year.
To measure the learning outcomes of general college education, VSA selected three
standardized assessments to evaluate student abilities in critical thinking, analytical reasoning, and
written communication. These three assessments are the Collegiate Assessment of Academic
Proficiency (CAAP), the Collegiate Learning Assessment (CLA), and the Measure of Academic

2
Proficiency and Progress (MAPP). These instruments were carefully selected from 16 candidate
instruments because they were believed to adequately measure improvement in the core skill areas
emphasized by VSA. The focus of VSA is on institutional-level learning outcomes when students
enter an institution and graduate from an institution, as well as on the learning gained through the
college years. The change occurring between entering and exiting is referred to as the value-added.
The method VSA adopts to calculate value-added is based on the methodology employed by the
Council for Aid to Education (CAE), the organization that offers the CLA, and VSA requires that
the same method be used to measure value-added for the CAAP, CLA, and MAPP.
Purpose of This Study
The purpose of this study is to examine the capability of MAPP in measuring value-
added outcomes using the method recommended by VSA. In the following section, the analysis
method is described at greater length. This study also introduces the MAPP test, samples
included in the analysis, and key findings.
Method
Instrument
The MAPP is an integrated test of general education skills that measures college-level
skills in critical thinking, reading, writing, and mathematics. It is designed to measure the
academic skills developed through general education rather than focusing on the knowledge
taught in specific courses. The test has two forms: the standard form and a short form. The
standard form has 108 items with 27 items in each of the four skill areas it measures and takes
two hours to complete. The short form has 36 items and takes about 40 minutes to complete. All
items are in multiple-choice format, and each item is associated with a particular academic
context: humanities, social sciences, or natural sciences. Both the standard form and the short
form are suitable for VSA because institutions can receive summaries for each skill area from
both forms. The reliabilities of all four MAPP skills scores are in the .80 to .89 range, even for
the short form. Both forms of the MAPP are delivered via a paper/pencil format or an online
version. Scores from the two delivery formats are equated so that the scores are comparable
(ETS, 2007).
Eight scaled scores are reported for students who take the standard form, including a total
MAPP score, four skills subscores (critical thinking, reading, writing, and mathematics), and

3
three content-based subscores (humanities, social sciences, and natural sciences). Similar
information is provided at the group level for students who take the short form but not at the
individual student level in order to achieve acceptable scale reliability.
Sample
A total of 6,196 students from 23 institutions were included in the analysis. The sample
consisted of 4,373 freshmen and 1,823 seniors. The freshmen and seniors were not the same
groups of students. Therefore, the design of this study was cross-sectional instead of
longitudinal. Thirty-nine institutions were contacted to participate in this study. These
institutions were considered because they (a) belonged to the VSA target institutions (e.g., 4-year
public colleges and universities), (b) had administered MAPP to at least 50 freshmen and 50
seniors, and (c) had admission scores (e.g., SAT, ACT) for the students who took MAPP. Of the
39 institutions that were contacted, 23 expressed interest in participation. Students who took the
MAPP test between 2006 and 2008 were recruited by each institution primarily on a voluntary
basis. The MAPP scores were obtained from ETS, the organization responsible for the
development, administration, and scoring of MAPP. The admission test scores were provided by
an institution administrator.1
Analysis
Value-added is required by VSA to be computed based on the learning differences
between entering freshmen and graduating seniors for each institution after controlling for the
SAT/ACT scores.2 As mentioned earlier, the current method adopted by CAE for their CLA is
recommended for use in calculating VSA value-added. Following the CAE method (Council for
Aid to Education, 2007), an ordinary least squares regression model is estimated between mean
SAT scores and mean MAPP scores for freshmen and seniors, respectively. Note that the unit of
analysis is at the institutional level instead of at the student level, so the outcome variable is the
mean of the MAPP scores.
Based on differences between expected and actual MAPP scores, five performance levels
were constructed for freshmen and seniors, respectively. These five levels were Well Above
Expected, Above Expected, At Expected, Below Expected, and Well Below Expected (see the
appendix). Institutions with actual scores within one standard error from their expected scores
were categorized as being At Expected. Institutions with actual MAPP scores larger than one but

4
less than two standard errors from their expected scores were categorized as being either Above
Expected or Below Expected. Institutions with actual MAPP scores larger than two standard
errors from their expected scores were categorized as being either Well Above Expected or Well
Below Expected. Because the VSA focuses on writing and critical thinking abilities, this study
examined only these two skill areas as well as the MAPP total score.
The differences between actual versus expected score differences between freshmen and
seniors were referred to as the final value-added. Institutions were classified into 10 decile
groups on the basis of value-added. If an institution was in Decile Group 5, it performed better
than 40% of the 4-year institutions included in this analysis. Similarly, if an institution was in
Decile Group 10, it scored higher than 90% of the 4-year institutions included in this analysis.
Results
Descriptive Statistics and Correlations
Table 1 presents the descriptive statistics for the MAPP total test, the two MAPP
subscales, and the SAT. The mean MAPP scores of this sample were compared to the mean
MAPP scores calculated using all MAPP users. The mean (standard deviation) was 438.69 (7.62)
for MAPP freshmen and 448.99 (9.58) for MAPP seniors. No significant score difference existed
in the means between these samples and the MAPP general population (p = .11 for freshmen and
p = .08 for seniors). It was assumed that these samples were representative of the general users.
Table 1
Descriptive Statistics of the Measure of Academic Proficiency and Progress (MAPP) Total
Score, MAPP Subscales, and SAT
Freshmen
(N = 4,373) Seniors
(N = 1,823) Mean SD Mean SD D
MAPP total 438 7.30 448 9.30 1.20 Critical thinking 110 1.90 113 2.30 1.40 Writing 113 1.70 115 1.80 1.10 SAT 1,001 72 1,049 94 0.57
Table 1 shows that seniors performed better than freshmen on the total MAPP test and on
the critical thinking and writing scores. Note that seniors also had a higher mean SAT score than
freshmen, which is probably because students with lower admission test scores dropped out of

5
college. An effect size is provided for each comparison, indicating the magnitude of the
performance difference. The effect size was calculated by dividing the mean difference by the
pooled standard deviation. In social science contexts, effect sizes between .50 and .80 are
considered medium, while effect sizes larger than .80 are considered large (Cohen, 1988).
According to this rule, the performance difference in SAT between freshmen and seniors is a
medium effect, while the differences in MAPP performance is a large effect at both the test and
skill levels.
Table 2 summarizes the Pearson correlations between MAPP scores and the SAT at the
student and institution levels. At the student level, for freshmen the correlation between MAPP
scores and SAT ranged from .50 to .72. The correlation was slightly higher for senior students,
ranging from .54 to .77. As expected, the institution level correlations were substantially higher
than student level correlations since the within-institution variation was ignored when the
correlation was computed at the school level. The correlation between MAPP and SAT scores
ranged from .83 to .93 for freshmen and from .80 to .93 for seniors.
Table 2
Pearson Correlations Between Measure of Academic Proficiency and Progress (MAPP) and
SAT Scores
Institution level Student level Freshmen Seniors Freshmen Seniors
MAPP total .93 .93 .72 .77 Writing .83 .80 .50 .59 Critical thinking .85 .88 .54 .54
Value-Added
Figures 1 to 3 show the predictive relationship between mean SAT scores and the mean
MAPP total score, mean MAPP writing score, and mean MAPP critical thinking score. In
general, after controlling for the admission scores, seniors performed better on MAPP total than
freshmen. The performance difference between these two classes was fairly similar across all
possible mean SAT scores so that the two regression lines were almost parallel. This pattern was
also true for student performance on MAPP critical thinking. Results on MAPP writing were
somewhat different. Figure 2 shows that entering freshmen with high SAT scores (i.e., higher
than 1,200) performed as well as seniors with the same SAT scores on MAPP writing.

6
415
425
435
445
455
465
475
800 900 1000 1100 1200 1300 1400
Mean SAT (or Converted ACT) Score
Mea
n M
AP
P S
core
FreshmenSeniorsLinear (Freshmen)Linear (Seniors)
Seniors [intercept=351.25, slope=.092, SE=8.06, R-Square=.87]
Freshmen [intercept=343.31, slope=.094, SE=8.37, R-Square=.86]
Figure 1. Relationship between MAPP performance and college admission scores.
105
107
109
111
113
115
117
119
800 900 1000 1100 1200 1300Mean SAT (or Converted ACT) Score
Mea
n M
AP
P W
ritin
g S
core
FreshmenSeniorsLinear (Freshmen)Linear (Seniors)
Seniors [intercept=98.38, slope=.016, SE=2.69, R-Square=.64]
Freshmen [intercept=93.45, slope=.020, SE=2.89, R-Square=.69]
Figure 2. Relationship between MAPP writing performance and college admission scores.

7
104
106
108
110
112
114
116
118
120
800 900 1000 1100 1200 1300
Mean SAT (or Converted ACT) Score
Mea
n M
APP
Crit
ical
Thi
nkin
g Sc
ore
FreshmenSeniorsLinear (Freshmen)Linear (Seniors)
Seniors [intercept=90.18, slope=.022, SE=2.67, R-Square=.78]
Freshmen [intercept=87.15, slope=.023, SE=3.05, R-Square=.73]
Figure 3. Relationship between MAPP critical thinking performance and college
admission scores.
SAT mean score was a significant predictor of MAPP mean total score, writing mean
score, and critical thinking mean score. SAT mean scores accounted for 87%, 64%, and 78% of
the variance in mean MAPP total mean, writing mean, and critical thinking mean scores.
Table 3 presents an example of a value-added summary for MAPP total scores. In this
example, seniors had a higher mean SAT score than freshmen (1,088 vs. 1,081). Based on the
regression equation in Figure 1, the freshmen were expected to score 445 on MAPP. Their actual
mean MAPP performance was 443. The difference in standard errors was -.90, which placed the
freshmen at the At Expected performance level. Similarly, the seniors were expected to score
452 on the MAPP test, and their actual mean MAPP score was 453, resulting in a standard error
of .40. This residual also placed the seniors at the At Expected level. The difference in the
residual in standard errors between freshmen and seniors was 1.3 (.40 to -.90), which determined
that this institution was in Decile Group 9 and suggested that it would perform better on MAPP
than 80% of the other institutions included in the analysis. Note that a school can be placed in a
lower decile group even if its seniors performed better than its freshmen. If the score gain in an
institution is not as large as the score gains in other institutions, it is likely that the institution will
have a lower value-added number. Therefore, the value-added is relative to other institutions.
That is, the performance rank of any institution depends on the performance of the other

8
institutions in the cohort. A similar example is also provided for MAPP writing and critical
thinking scores in Tables 4 and 5.
Table 3
Sample Institutional Report for Freshmen, Seniors, and Value-Added Based on Total
Measure of Academic Proficiency and Progress (MAPP) Score
Freshmen Seniors Value-added Mean SAT (or converted ACT) score 1,081 1,088 Expected MAPP score 445 452 7 Actual MAPP score 443 453 10 Actual versus expected a (difference in score points) -2.3 1.3 3.6
Actual versus expected b (difference in standard errors) -0.9 0.4 1.3
Well Above Well Above 10 Expected Expected 9
Above Above 8 Expected Expected 7
6 At Expected
At Expected 5
Below Below 4 Expected Expected 3
Well Below Well Below 2
Performance level c
Expected Expected 1
Note. The shading represents the performance level of that institution. a This is the residual, which equals the scaled score difference between actual and expected
MAPP scores. b This is the standardized residual, which is the residual divided by the standard
error of the residual. c See the appendix for an explanation of performance levels.

9
Table 4
Sample Institutional Report for Freshmen, Seniors, and Value-Added on Writing Score
Freshmen Seniors Value-added Mean SAT (or converted ACT) score 950 990 Expected MAPP writing score 112 114 2 Actual MAPP writing score 113 114 1 Actual versus expected a (difference in score points) 0.9 0.2 -0.6
Actual versus expected b (difference in standard errors) 0.9 0.2 -0.7
Well Above Well Above 10 Expected Expected 9
Above Above 8 Expected Expected 7
At At 6 Expected Expected 5
Below Below 4 Expected Expected 3
Well Below Well Below 2
Performance level c
Expected Expected 1
Note. The shading represents the performance level of that institution. a This is the residual, which equals the scaled score difference between actual and expected
MAPP scores. b This is the standardized residual, which is the residual divided by the standard
error of the residual. c See the appendix for an explanation of performance levels.

10
Table 5
Sample Institutional Report for Freshmen, Seniors, and Value-Added on Critical
Thinking Score
Freshmen Seniors Value-added Mean SAT (or converted ACT) score 1043 1107 Expected MAPP critical thinking score 111 114 3 Actual MAPP critical thinking score 110 114 4 Actual versus expected a (difference in score points) -1.0 -0.7 0.3
Actual versus expected b (difference in standard errors) -1.0 -0.6 0.4
Well Above Well Above 10 Expected Expected 9
Above Above 8 Expected Expected 7
6 At Expected
At Expected 5
4 Below Expected
Below Expected 3
Well Below Well Below 2
Performance level c
Expected Expected 1
Note. The shading represents the performance level of that institution. a This is the residual, which equals the scaled score difference between actual and expected
MAPP scores. b This is the standardized residual, which is the residual divided by the standard
error of the residual. c See the appendix for an explanation of performance levels.
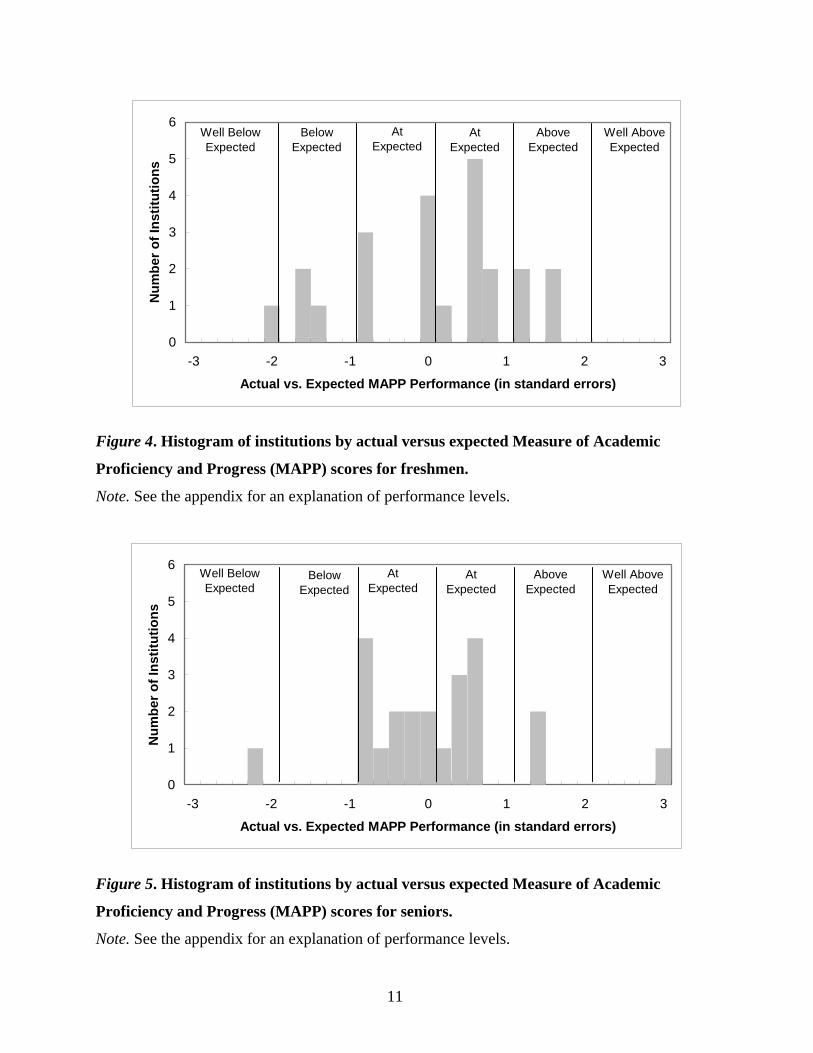
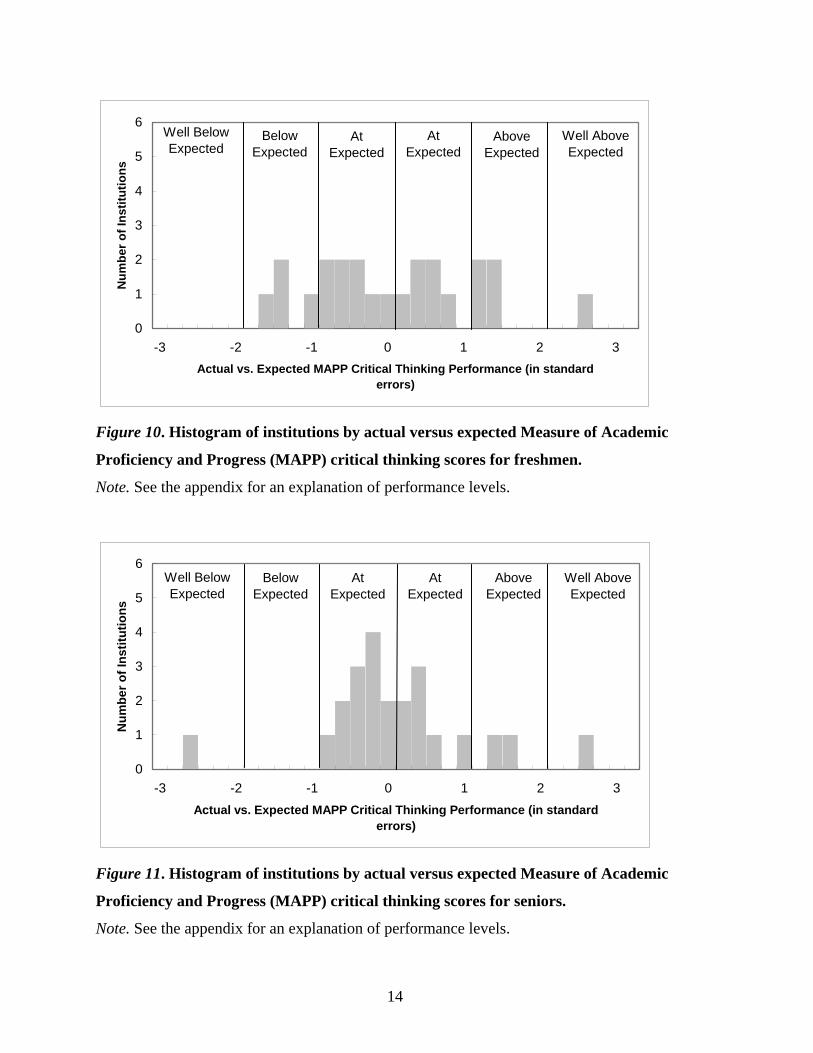
Histograms of numbers of institutions in terms of actual versus expected MAPP
performance for freshmen, seniors, and for value-added performance are provided in Figures 4 to
6. The performance of the freshmen and seniors in most institutions was at the At Expected level,
with fewer schools at the Above Expected or Below Expected levels and very few institutions at
the Well Above Expected and Well Below Expected levels. Similar graphs are provided for
MAPP writing and critical thinking (see Figures 7 to 12).
11
0
1
2
3
4
5
6
-3 -2 -1 0 1 2 3
Actual vs. Expected MAPP Performance (in standard errors)
Num
ber o
f Ins
titut
ions
Well Below Expected
Below Expected
At Expected
At Expected
Above Expected
Well Above Expected
Figure 4. Histogram of institutions by actual versus expected Measure of Academic
Proficiency and Progress (MAPP) scores for freshmen.
Note. See the appendix for an explanation of performance levels.
0
1
2
3
4
5
6
-3 -2 -1 0 1 2 3
Actual vs. Expected MAPP Performance (in standard errors)
Num
ber o
f Ins
titut
ions
Well Below Expected
Below Expected
At Expected
At Expected
Above Expected
Well Above Expected
Figure 5. Histogram of institutions by actual versus expected Measure of Academic
Proficiency and Progress (MAPP) scores for seniors.
Note. See the appendix for an explanation of performance levels.

12
0
1
2
3
4
5
6
-3 -2 -1 0 1 2 3
Actual vs. Expected Value-added Performance (in standard errors)
Num
ber o
f Ins
titut
ions
Well Below Expected
Below Expected
At Expected
At Expected
Above Expected
Well Above Expected
Figure 6. Histogram of institutions by actual versus expected value-added Measure of
Academic Proficiency and Progress (MAPP) performance.
Note. See the appendix for an explanation of performance levels.
0
1
2
3
4
5
6
-3 -2 -1 0 1 2 3
Actual vs. Expected MAPP Writing Performance (in standard errors)
Num
ber o
f Ins
titut
ions
Well Below Expected
Below Expected
At Expected
At Expected
Above Expected
Well Above Expected
Figure 7. Histogram of institutions by actual versus expected Measure of Academic
Proficiency and Progress (MAPP) writing scores for freshmen.
Note. See the appendix for an explanation of performance levels.

13
0
1
2
3
4
5
6
-3 -2 -1 0 1 2 3
Actual vs. Expected MAPP Writing Performance (in standard errors)
Num
ber o
f Ins
titut
ions
Well Below Expected
Below Expected
At Expected
At Expected
Above Expected
Well Above Expected
Figure 8. Histogram of institutions by actual versus expected Measure of Academic
Proficiency and Progress (MAPP) writing scores for seniors.
Note. See the appendix for an explanation of performance levels.
0
1
2
3
4
5
6
-3 -2 -1 0 1 2 3
Actual vs. Expected Value-added Performance (in standard errors)
Num
ber o
f Ins
titut
ions
Well Below Expected
Below Expected
At Expected
At Expected
Above Expected
Well Above Expected
Figure 9. Histogram of institutions by actual versus expected value-added Measure of
Academic Proficiency and Progress (MAPP) writing performance.
Note. See the appendix for an explanation of performance levels.
14
0
1
2
3
4
5
6
-3 -2 -1 0 1 2 3Actual vs. Expected MAPP Critical Thinking Performance (in standard
errors)
Num
ber o
f Ins
titut
ions
Well Below Expected
Below Expected
At Expected
At Expected
Above Expected
Well Above Expected
Figure 10. Histogram of institutions by actual versus expected Measure of Academic
Proficiency and Progress (MAPP) critical thinking scores for freshmen.
Note. See the appendix for an explanation of performance levels.
0
1
2
3
4
5
6
-3 -2 -1 0 1 2 3Actual vs. Expected MAPP Critical Thinking Performance (in standard
errors)
Num
ber o
f Ins
titut
ions
Well Below Expected
Below Expected
At Expected
At Expected
Above Expected
Well Above Expected
Figure 11. Histogram of institutions by actual versus expected Measure of Academic
Proficiency and Progress (MAPP) critical thinking scores for seniors.
Note. See the appendix for an explanation of performance levels.

15
0
1
2
3
4
5
6
-3 -2 -1 0 1 2 3
Actual vs. Expected Value-added Performance (in standard errors)
Num
ber o
f Ins
titut
ions
Well Below Expected
Below Expected
At Expected
At Expected
Above Expected
Well Above Expected
Figure 12. Histogram of institutions by actual versus expected value-added Measure of
Academic Proficiency and Progress (MAPP) critical thinking performance.
Note. See the appendix for an explanation of performance levels.
Discussion
This study described an investigation on how MAPP can be used to measure value-added
performance in 4-year public colleges and universities. The method used to calculate value-
added in this study was the method used by CAE (Council for Aid to Education, 2007), because
VSA requires that all testing agencies use the same methodology to compute value-added to
participate in the initiative. The current method used the institution as the unit of analysis. The
results might have varied if students had been used as the unit of analysis. In addition, the design
of this study was cross-sectional. It would be interesting to investigate the possibilities of a
longitudinal study.
The institutional level analysis assumed that students sampled in this study were
representative of the entire student body at each institution. The generalizability of the results
depended on the extent to which random sampling was implemented in the data collection
process. Establishing a trajectory for value-added performance is a long-term effort both within
and across institutions. It takes more than one data collection phase to establish a value-added

16
performance trajectory. Also, efforts should be made to increase the likelihood of random
sampling in each institution.
Student motivation could be another issue for low-stakes tests like MAPP. Banta (2008)
was rightfully concerned about whether outcomes from the standardized tests could accurately
reflect a student’s true performance given that they are frequently enticed, particularly by some
monetary incentives, to take the test. However, the high correlation between MAPP scores and
SAT scores seems to provide some evidence that students did not randomly respond to the
MAPP test. Otherwise, the relationship between these two tests would be far less tangible given
that the SAT is an extremely high-stakes test. Students appear to have had some reason for
treating the MAPP test seriously. Although the test result will not have any direct impact on
individual students, the outcome may affect the general public’s perception of the quality of the
students’ institution, thus affecting the perceived quality of their diploma.
Finally, the readers and MAPP users are cautioned about the interpretation of the value-
added results. The categorization of institutions into 10 decile groups only represents each
institution’s relative performance gain between freshmen and seniors, as compared to other
institutions included in this analysis. The current decile ranking serves as a reference for each
institution to compare with other institutions for the time being. The decile ranking is subject to
change as more students are sampled and as more institutions are included in this study.
Note that the method described in this study is just one of a number of possible methods
that could be used to calculate value-added. Other methods should be explored as the discussion
continues regarding how college effectiveness might be adequately measured and represented.
For example, the current study used a cross-sectional design in that the freshmen and seniors
included in the analysis were not the same group of students. A longitudinal study is of interest
to see if results vary when the same group of students is tracked for 4 years and tested twice,
once in their freshman and once in their senior year.
Furthermore, more discussion should be generated on whether freshmen should be
included in the value-added calculation. According to the current method, the lower the
admission scores for freshmen in an institution, the more likely this institution is going to be
placed at a higher performance category, even if seniors at this institution achieve the same
performance as seniors in other colleges. If this method is going to be adopted for value-added
computation, it appears to be more reasonable to compare institutions with similar levels of

17
admission scores to monitor the growth in learning. This way, the very selective institutions are
not penalized for the high admission scores of their freshmen or for the relatively small gain
between freshmen and seniors due to the pyramid effect.
An alternative method of calculating value-added could just involve seniors, with value-
added being the actual versus expected senior MAPP mean scores. This method excludes the
freshmen from the calculation of value-added and makes sense because their MAPP
performance, either above or below expected, cannot really be attributed to the institution they
just enrolled in.
Conclusions
In summary, MAPP has been shown to be a suitable measure for value-added
performance in higher education. These scores are reasonably well correlated with SAT or
converted ACT scores, and the test is also able to differentiate performance between freshmen
and seniors. More importantly, MAPP scores provide an opportunity for institutions to examine
the learning progress students make through general college education. Scores from MAPP can
also serve as one criterion for institutions to evaluate the effectiveness of their instructional
system as compared to other institutions.

18
References
Banta, T. (2008). Trying to clothe the emperor. Assessment Update, 20(2), 3–4, 16–17.
Cohen, J. (1988). Statistical power analyses for the behavioral sciences. Mahwah, NJ: Lawrence
Erlbaum Associates.
Council for Aid to Education. (2007). CLA institutional report 2006–2007. New York: Author.
ETS. (2007). MAPP user’s guide. Princeton, NJ: Author.
Marco, G. L., Abdel-fattah, A. A., & Baron, P. A. (1992). Methods used to establish store
comparability on the enhanced ACT assessment and the SAT (College Board Research
Rep. No. 92-03). New York: College Board.
No Child Left Behind Act of 2001, 20 U.S.C. § 6301 et seq. (2002).
U.S. Department of Education. (2006). A test of leadership: Charting the future of U.S. higher
education. Washington, DC: Author.

19
Notes
1 Voluntary System of Accountability (VSA) requires that all students included in the learning
outcome evaluation be full-time, nontransfer students. Transfer students are those students
who have transferred more than 30 credits from a previous institution to their current
institution. Transfer students were excluded from this study.
2 ACT scores were converted to SAT scores using a concordance table (Marco, Abdel-fattah, &
Baron, 1992).
20
Appendix
The performance levels, shown in Tables 3-5 and Figures 4-12, are based on actual versus
expected difference in standard errors, as follows:
• Well Above Expected—more than +2.00 standard errors from the expected score
• Above Expected—between +1.00 and +2.00 standard errors from the expected score
• At Expected—between -1.00 and +1.00 standard errors from the expected score
• Below Expected—between -1.00 and -2.00 standard errors from the expected score
• Well Below Expected—more than -2.00 standard errors from the expected score