measuring impacts and enabling investments in energy-smart
TRANSCRIPT

A. FLAMMINI, S. BRACCO, R. SIMS, J. COOKE, M. GOMEZ SAN JUAN
Measuring Impacts and Enabling Investments in Energy-Smart Agrifood Chains
ROME, 2019
FINDINGS FROM FOUR COUNTRY STUDIES

FAO and GIZ. 2019. Measuring Impacts And Enabling Investments In Energy-Smart Agrifood Chains
Findings From Four Country Studies. Rome. 312 pp. Licence: CC BY-NC-SA 3.0 IGO
The designations employed and the presentation of material in this information product do not imply the
expression of any opinion whatsoever on the part of the Food and Agriculture Organization of the United
Nations (FAO) or Deutsche Gesellschaft für Internationale Zusammenarbeit GmbH concerning the legal or
development status of any country, territory, city or area or of its authorities, or concerning the delimitation
of its frontiers or boundaries. The mention of specific companies or products of manufacturers, whether or
not these have been patented, does not imply that these have been endorsed or recommended by FAO
or GIZ in preference to others of a similar nature that are not mentioned.
The views expressed in this information product are those of the author(s) and do not necessarily reflect
the views or policies of FAO or GIZ.
ISBN 978-92-5-131371-8 (FAO)
© FAO, 2019
Some rights reserved. This work is made available under the Creative Commons Attribution-Non
Commercial-ShareAlike 3.0 IGO licence (CC BY-NC-SA 3.0 IGO; https://creativecommons.org/licenses/
by-nc-sa/3.0/igo/legalcode).
Under the terms of this licence, this work may be copied, redistributed and adapted for non-commercial
purposes, provided that the work is appropriately cited. In any use of this work, there should be no
suggestion that FAO endorses any specific organization, products or services. The use of the FAO logo
is not permitted. If the work is adapted, then it must be licensed under the same or equivalent Creative
Commons license. If a translation of this work is created, it must include the following disclaimer along with
the required citation: “This translation was not created by the Food and Agriculture Organization of the
United Nations (FAO). FAO is not responsible for the content or accuracy of this translation. The original
English edition shall be the authoritative edition.”
Disputes arising under the licence that cannot be settled amicably will be resolved by mediation and
arbitration as described in Article 8 of the licence except as otherwise provided herein. The applicable
mediation rules will be the mediation rules of the World Intellectual Property Organization http://www.
wipo.int/amc/en/mediation/rules and any arbitration will be in accordance with the Arbitration Rules of
the United Nations Commission on International Trade Law (UNCITRAL)
Third-party materials. Users wishing to reuse material from this work that is attributed to a third party, such
as tables, figures or images, are responsible for determining whether permission is needed for that reuse
and for obtaining permission from the copyright holder. The risk of claims resulting from infringement of any
third-party-owned component in the work rests solely with the user.
Sales, rights and licensing. FAO information products are available on the FAO website (www.fao.org/pu-
blications) and can be purchased through [email protected]. Requests for commercial use should
be submitted via: www.fao.org/contact-us/licence-request. Queries regarding rights and licensing should be
submitted to: [email protected].
This information product was funded by GIZ.

FINDINGS FROM FOUR COUNTRY STUDIES
Published bythe Food and Agriculture Organization of the United Nations and Deutsche Gesellschaft für Internationale Zusammenarbeit (GIZ) GmbH
ROME, 2019
A. FLAMMINI, S. BRACCO, R. SIMS, J. COOKE, M. GOMEZ SAN JUAN
Measuring Impacts and Enabling Investments in Energy-Smart Agrifood Chains

ABOUT PAEGC
In 2012, The United States Agency for International Development (USAID), the Swedish International Development Cooperation Agency (SIDA), the Federal Ministry for Economic Cooperation and Development (BMZ), Duke Energy Corporation, and the United States Overseas Private Investment Corporation (OPIC) (collectively, the “Founding Partners”) combined resources to create the Powering Agriculture: An Energy Grand Challenge for Development (PAEGC) initiative. The objective of PAEGC is to support new and sustainable approaches to accelerate the development and deployment of clean energy solutions for increasing agricultural productivity and/or value for farmers and agribusinesses in developing countries and emerging regions that lack access to reliable, affordable clean energy.
PAEGC utilizes the financial and technical resources of its Founding Partners to support its innovator cohort’s implementation of clean energy technologies and business models that: (i) Enhance agricultural yields/productivity; (ii) Decrease post-harvest loss; (iii) Improve farmer and agribusiness income generating opportunities and revenues; and/or (iv) Increase energy efficiency and associated savings within the operations of farms and agribusinesses - while stimulating low carbon economic growth within the agriculture sector of developing countries and emerging regions.
For more information, visit PoweringAg.org
ii

Contents
BACKGROUND . . . . . . . . . . . . . . . . . . . . . . . . . . . . . . . . . . . . . . . . . . . . . . . . . . . . . . . . . . . . . . . . . . . . . . . . . ivACKNOWLEDGEMENTS. . . . . . . . . . . . . . . . . . . . . . . . . . . . . . . . . . . . . . . . . . . . . . . . . . . . . . . . . . . . . . . . . viTABLES . . . . . . . . . . . . . . . . . . . . . . . . . . . . . . . . . . . . . . . . . . . . . . . . . . . . . . . . . . . . . . . . . . . . . . . . . . . . . . . . . viiiFIGURES . . . . . . . . . . . . . . . . . . . . . . . . . . . . . . . . . . . . . . . . . . . . . . . . . . . . . . . . . . . . . . . . . . . . . . . . . . . . . . . . xiACRONYMS AND ABBREVIATIONS . . . . . . . . . . . . . . . . . . . . . . . . . . . . . . . . . . . . . . . . . . . . . . . . . . . . . . xivEXECUTIVE SUMMARY . . . . . . . . . . . . . . . . . . . . . . . . . . . . . . . . . . . . . . . . . . . . . . . . . . . . . . . . . . . . . . . . . . xvii
1 FROM INTERVENTION-LEVEL TO COUNTRY-LEVEL ASSESSMENT. . . . . . . . . . . . . . . . . . . . . . 1
2 METHODOLOGY FOR A COST-BENEFIT ANALYSIS AT COUNTRY LEVEL . . . . . . . . . . . . . . . 9 2.1 Gender-sensitive value chain approach . . . . . . . . . . . . . . . . . . . . . . . . . . . . . . . . . . . . . . . . . . . . . . 12 2.2 Impact indicators for country-level assessment. . . . . . . . . . . . . . . . . . . . . . . . . . . . . . . . . . . . . . . . 15 2.2.1 Environmental impacts . . . . . . . . . . . . . . . . . . . . . . . . . . . . . . . . . . . . . . . . . . . . . . . . . . . . . . . 16 2.2.2 Socio-economic impacts . . . . . . . . . . . . . . . . . . . . . . . . . . . . . . . . . . . . . . . . . . . . . . . . . . . . . 17 2.2.3 Relevance of impact indicators for Sustainable Development Goals . . . . . . . . . . . . . . . . 23 2.3 Limitations of the methodology. . . . . . . . . . . . . . . . . . . . . . . . . . . . . . . . . . . . . . . . . . . . . . . . . . . . . 24
3 COST-BENEFIT ANALYSIS AT THE COUNTRY LEVEL . . . . . . . . . . . . . . . . . . . . . . . . . . . . . . . . . . . 27 3.1 Milk value chain . . . . . . . . . . . . . . . . . . . . . . . . . . . . . . . . . . . . . . . . . . . . . . . . . . . . . . . . . . . . . . . . . . 32 3.1.1 Tunisia: Energy interventions in the milk chain . . . . . . . . . . . . . . . . . . . . . . . . . . . . . . . . . . . 33 3.1.2 Tanzania: Energy interventions in the milk chain . . . . . . . . . . . . . . . . . . . . . . . . . . . . . . . . . 63 3.1.3 Kenya: Energy interventions in the milk chain . . . . . . . . . . . . . . . . . . . . . . . . . . . . . . . . . . . . 96 3.2 Vegetable value chain . . . . . . . . . . . . . . . . . . . . . . . . . . . . . . . . . . . . . . . . . . . . . . . . . . . . . . . . . . . . . 136 3.2.1 Kenya: Energy interventions in the vegetable chain . . . . . . . . . . . . . . . . . . . . . . . . . . . . . . . 137 3.3 Rice value chain . . . . . . . . . . . . . . . . . . . . . . . . . . . . . . . . . . . . . . . . . . . . . . . . . . . . . . . . . . . . . . . . . . 162 3.3.1 Philippines: Energy interventions in the rice chain . . . . . . . . . . . . . . . . . . . . . . . . . . . . . . . . 163
4 INSTRUMENTS TO OVERCOME BARRIERS AND DELIVERY MODELS. . . . . . . . . . . . . . . . . . . . 199 4.1 Main thematic policy and regulatory areas . . . . . . . . . . . . . . . . . . . . . . . . . . . . . . . . . . . . . . . . . . . 201 4.2 Financing instruments to hedge risks . . . . . . . . . . . . . . . . . . . . . . . . . . . . . . . . . . . . . . . . . . . . . . . . 204 4.3 Barriers, support interventions and business models to encourage energy
interventions for the selected value chains and technologies . . . . . . . . . . . . . . . . . . . . . . . . . . . . 207 4.3.1 Milk value chain . . . . . . . . . . . . . . . . . . . . . . . . . . . . . . . . . . . . . . . . . . . . . . . . . . . . . . . . . . . . . 207 4.3.2 Vegetable value chain . . . . . . . . . . . . . . . . . . . . . . . . . . . . . . . . . . . . . . . . . . . . . . . . . . . . . . . . 214 4.3.3 Rice value chain . . . . . . . . . . . . . . . . . . . . . . . . . . . . . . . . . . . . . . . . . . . . . . . . . . . . . . . . . . . . . 218 4.4 Discussion . . . . . . . . . . . . . . . . . . . . . . . . . . . . . . . . . . . . . . . . . . . . . . . . . . . . . . . . . . . . . . . . . . . . . . . 224
5 LESSONS LEARNED FROM THE CASE STUDIES . . . . . . . . . . . . . . . . . . . . . . . . . . . . . . . . . . . . . . . 229 5.1 Instruments to prioritize energy interventions based on their net co-benefits . . . . . . . . . . . . . 229 5.2 Instruments to determine level of public support . . . . . . . . . . . . . . . . . . . . . . . . . . . . . . . . . . . . . 236 5.3 Gender analysis for clean energy interventions in agrifood chains . . . . . . . . . . . . . . . . . . . . . . . . 242 5.4 Data availability. . . . . . . . . . . . . . . . . . . . . . . . . . . . . . . . . . . . . . . . . . . . . . . . . . . . . . . . . . . . . . . . . . . 247 5.5 Instruments to foster investments. . . . . . . . . . . . . . . . . . . . . . . . . . . . . . . . . . . . . . . . . . . . . . . . . . . 249
6 POLICY RECOMMENDATIONS . . . . . . . . . . . . . . . . . . . . . . . . . . . . . . . . . . . . . . . . . . . . . . . . . . . . . . . 255
REFERENCES AND FURTHER READING. . . . . . . . . . . . . . . . . . . . . . . . . . . . . . . . . . . . . . . . . . . . . . . . . . . 261Annex: Organizations and people met during the data collection missions. . . . . . . . . . . . . . . . . . . . . . . . 272
iiiMEASURING IMPACTS AND ENABLING INVESTMENTS IN ENERGY-SMART AGRIFOOD CHAINS

MEASURING IMPACTS AND ENABLING INVESTMENTS IN ENERGY-SMART AGRIFOOD CHAINS
BACKGROUND
This report summarizes the analysis and main findings from Phase 2 of the project “Investing in Sustainable Energy Technologies for the Agrifood Sector” (INVESTA), targeting to measure impacts and enable investments in energy-smart agrifood chains.
The Food and Agriculture Organization of the United Nations (FAO) has been working together with the Deutsche Gesellschaft für Internationale Zusammenarbeit (GIZ) GmbH and the partners of the international initiative Powering Agriculture: An Energy Grand Challenge for Development (PAEGC) on energy-smart agrifood chains since 2014. The PAEGC partners are The German Federal Ministry for Economic Cooperation and Development (BMZ), the United States Agency for International Development (USAID), the Swedish International Development Agency (Sida), the United States Overseas Private Investment Corporation (OPIC) and Duke Energy. PAEGC supports the development and deployment of clean energy innovations that increase agriculture productivity and stimulate low carbon economic growth in the agriculture sector of developing countries to help end extreme poverty and extreme hunger.
In 2015, the report “Opportunities for Agrifood Chains to become Energy-Smart” was co-published by FAO and USAID with the support of GIZ. The study highlighted more than 100 possible technologies and measures that could be introduced to make the milk, rice and vegetable value chains cleaner and less dependent on fossil fuels. The findings showed that the current dependence on fossil fuel inputs by the agrifood industry results in around 7 to 8 percent of greenhouse gas (GHG) emissions. Under business as usual, even with steady technological development and energy efficiency improvements, the total energy needed to power agriculture will be 8 percent higher in 2030, compared to 2012 (FAO and USAID, 2015). Emissions can be reduced by both improved energy efficiency along the agrifood chain and the deployment of renewable energy systems. Various co-benefits associated with these energy solutions were identified, including saving water.
The INVESTA project went one step further by devising a methodology to assess the costs and benefits of energy interventions in the agrifood chain. This methodology was applied to specific case studies that involved a range of clean technologies in selected countries. A first report, “Costs and Benefits of Clean Energy Technologies in the Milk, Vegetable and Rice Value Chains – Intervention Level”, was co-published by FAO and GIZ in 2018. The study summarized the results of Phase 1 of the INVESTA project, explaining the methodology and the set of indicators used to quantify non-monetized co-benefits. It drew findings from applying the methodology to six case studies at intervention level of the farmer or processor.
iv

MEASURING IMPACTS AND ENABLING INVESTMENTS IN ENERGY-SMART AGRIFOOD CHAINS v
This second report builds upon this work and presents an extension of the methodology to the country level. The indicators presented in Phase 1 were adapted to this macro- analysis. Specific case studies were drafted: Milk value chain technologies are considered for Kenya, Tanzania and Tunisia; interventions in the vegetables value chain are considered for Kenya; and rice technologies are analysed for the Philippines. Thereby, the different technologies presented in Phase 1 are assessed where appropriate. In each country-specific value chain, the technical potential to adopt a certain clean energy technology was estimated, to then calculate the associated investment together with the investment’s net economic benefits (beyond financials). Aimed at policy makers, international finance institutions (IFIs) and investors, the report focuses on identifying the main barriers impeding the full deployment of clean energy technologies in the case study countries and recommends possible solutions to overcome them.

vi MEASURING IMPACTS AND ENABLING INVESTMENTS IN ENERGY-SMART AGRIFOOD CHAINS
ACKNOWLEDGEMENTS
The report summarizes the work carried out in the context of Phase 2 of the FAO project “An Enabling Environment to Foster Investments in Sustainable Energy Interventions in the Agrifood Sector” (GCP/GLO/667/GER) (INVESTA). The project was funded by GIZ on behalf of BMZ as an in-kind contribution to the initiative PAEGC.
The report was prepared by Alessandro Flammini, Natural Resources Officer, FAO Investment Centre; Stefania Bracco, Expert in Energy-Smart Food, Economist, FAO Climate and Environment Division; Ralph Sims, Professor of Sustainable Energy, Massey University; Jeanette Cooke, Gender Expert, FAO; and Marta Gómez San Juan, Agricultural Engineer, FAO Climate and Environment Division. It was completed under the overall supervision of Olivier Dubois, Leader of the FAO Energy Team and under the technical supervision of Alessandro Flammini. Mkani David Waziri and Thomas P. Mkunda, FAO Consultants, contributed to the preparation of the report.
A special thanks goes to GIZ staff and PAEGC partners who provided backstopping to the project and reviewed the study, including Katharina Meder, Hub Manager East Africa, GIZ; Maria Weitz, Project Coordinator, GIZ; Mischa Bechberger, Advisor, GIZ; Macben Makenzi, Project Advisor, East Africa Hub, GIZ; Robert Schultz, Advisor, GIZ; Kerstin Lohr, Advisor, GIZ; Hannah Posern, Advisor, GIZ; Janna Schneider, Junior Advisor, GIZ; Laura Jakobeit, freelancer, as well as the several FAO colleagues and stakeholders who provided useful inputs (in particular Sanne Castro, SimGas; Chiraz Loukil, GIVLAIT; Ben Salem Mondher, Institut National de la Recherche Agronomique de Tunisie (INRAT); Evgenia Sokolowa, Actikera Co.; Feddy Tesha, Tanzania Milk Processors Association (TAMPA); and Sana Zitouni, Office de l’Elevage et des Paturages (OEP)).
The findings of the report build extensively upon the information collected during field missions in the four case-study countries: Tunisia, Tanzania, Kenya and the Philippines. The authors would like to thank the several national experts, government representatives, organizations operating in the agrifood sector and FAO colleagues who have participated in the national stakeholder meetings and contributed to the discussion around the findings of this study.
In Tunisia: Marwa Abdelli, Union Tunisienne de l’Agriculture et de la Pêche (UTAP); Moumni Ahlem, Ministère de l’Agriculture, des Ressources Hydrauliques et de la Pêche (MARHP); Mohamed Amrani, FAOSNE (FAO Subregional Office for North Africa); Afef Ben Abda, FAOSNE; Ali Ben Abdellah, GIZ; Ayadi Ben Aïssa, Tunesian engineering Services Company (TESCO); Adel Besbes, OEP; Mohamed Bougacha, FAOSNE; Maher Bouzaien, Banque de Financement des Petites et Moyennes Enterprises (BFPME); Mouna Challouf, MARHP/BPEH; Dalila Dalhoumi, Agence de Promotion des Investissements Agricoles (APIA); Mannoubi Darghouth, Syndicate National des agriculteurs de Tunisie (SYNAGRI); Adel Ezzine, MARHP; Sharma Fitomi, TESCO; Jean Jaques Franc De Ferriere, FAOSNE; Donoizi Halima, MARHP; Monia Hammani, MARHP; Selim Kanzari, Methania; Kouki Kaouther, Agence de Promotion des investissements Agricoles (APIA); Yasmine Karoui, Zitouna Tamkeen; Ben Salem

viiMEASURING IMPACTS AND ENABLING INVESTMENTS IN ENERGY-SMART AGRIFOOD CHAINS
Lornia, OEP; Rafaa Marouki, African Development Bank (BAD); Ben Salem Mondher, INRAT; Ben Amor Noura, Reseau Entreprendre Tunisie (RET); Karim Nefzi, Agence Nationale pour la Maitrise de l’Energie (ANME); Oussama Ouedrani, Methania; Belkhiriya Yacin, SYNAGRI; Dhraief Zied, INRAT; Tarek Zrelli, Ministere de l’Environment et du Developpement Durable; and Mohamed Ikbal Souissi, SYNAGRI.
In Tanzania: Abubakar Faraji, Milkcom Dairies Ltd; Herry John, TAMPA; Fred Kafeero, FAO Representative in United Republic of Tanzania (FAOTZ); Nelson Kilongozi, Tanzania Dairy Board (TDB); Doreen Maro, Tanzania Milk Producers Association (TAMPRODA); Eunice R. Mbwambo, Tanzania Agricultural Development Bank Limited (TADB); Nathaniel Mbwambo, Ministry of Agricultural Livestock and Fisheries (MALF); Thabit Mikidadi Kitamu, National Gender Sustainable Energy Network; Deogratius Mlay, TDB; Devongusa Mmari, TAMPA; Andrew Muguwa, African Development Bank (AfDB); Fabian Mwakatuma, Fabian and Family Co. Ltd; Henry M. Mwimbe, Tanzania Federation of Cooperatives (TFC); Salim Nahdi, Milkcom Dairies (T) Ltd; Druean Rusule, Rural Energy Agency (REA); Alicia Rutajubukilsoa, Erosol Ltd; Ajuaye Sigalla, FAOTZ; Mayasa A. Simba, TDB; and Feddy P. Tesha, TAMPA.
In Kenya: James Eason, Aldelano/GCCA; Stephen Karekesi, Afrepren/FWSS; Samuel Karongo, Horticulture Crops Directorate (HCD); Peter Kiboi, New Kenya Co-operative Creameries Ltd (New KCC); Chris Murunga, National Irrigation Board (NIB); Johnson Mwove, Egerton University; Bernard Ngetich, Winrock International; Okisegere Ojepat, Fresh produce exporters association of Kenya (FPEAK)/TFC; Chris Webo, CARE Kenya; and Chris Wilson, Kilifi plantation/Biopower/Kenya Private Sector Alliance (KEPSA).
In the Philippines: A.S. Bello, Philippine Statistics Authority (PSA); Jay Bermas, Bureau of Agricultural Research (BAR); Gigi Calica, Philippine Center for Postharvest Development and Mechanization (PhilMech); Edgardo C. De Guzman, Land Bank of the Philippines (LBP); Raymond De La Cruz, Full Advantage Phils International; Tamara Palis Duran, FAO Philippines (FAOPH); Ron Lester S. Durante, Department of Energy (DOE); José Luis Fernandez, FAOPH; Martin Gummert, International Rice Research Institute (IRRI); Arnold Juliano, Philippine Rice Research Institute (PhilRice); Ferdinand Larona, GIZ Philippines; Jasmine E. Magtibay, FAOPH; Jessie M. Manalili, Full Advantage Phils International; Amelita Salvador, PhilMech; Bernardo D. Tadeo, Full Advantage Phils International; Michael Vemuri, GIZ Philippines; Myrna C. Vollah, PSA; Grace Yeneza, Asian Development Bank (ADB); and Arnulfo Zabala, Department of Energy (DOE).
Finally, we would like to acknowledge the important synergies with other projects which contributed to strengthen and validate the results of this study, namely the FAO project GCP/RNE/004/ITA “Food Loss and Waste Reduction and Value Chain Development for Food Security in Egypt and Tunisia”, the project “Business Cases for Clean Energy Cooling Solutions in Dairy Value Chains” by the Renewable Energy and Energy Efficiency Partnership (REEEP), and the Institute of Agricultural Engineering of the University of Hohenheim work in pilot testing solar milk cooling systems in Kenya and Tunisia.
A full list of stakeholders interviewed during the field work is reported in the Annex.

viii MEASURING IMPACTS AND ENABLING INVESTMENTS IN ENERGY-SMART AGRIFOOD CHAINS
Tables
Table ES.1 Summary of indicators for the CBA assessment at intervention level, at country level, and related SDG targets. . . . . . . . . . . . . . . . . . . . . . . . . . . . . . . . . . . . . . . . . . . . . . . . . xviii
Table ES.2. Value chains and technologies considered in the study . . . . . . . . . . . . . . . . . . . . . . . . . . . . xixTable ES.3. Comparative analysis of impacts on gender issues of the 11 energy interventions
assessed. . . . . . . . . . . . . . . . . . . . . . . . . . . . . . . . . . . . . . . . . . . . . . . . . . . . . . . . . . . . . . . . . . . . xxixTable 2.1. Summary of indicators for the CBA assessment at intervention level, at country
level, and related SDG targets. . . . . . . . . . . . . . . . . . . . . . . . . . . . . . . . . . . . . . . . . . . . . . . . . 24Table 3.1. Value chains and technologies considered in the study. . . . . . . . . . . . . . . . . . . . . . . . . . . . 28Table 3.2. Distribution of cattle farmers according to number of cows. . . . . . . . . . . . . . . . . . . . . . . 33Table 3.3. Energy interventions considered for the milk value chain in Tunisia. . . . . . . . . . . . . . . . . 42Table 3.4. Technology potential of biogas for power generation plants from
manure in Tunisia. . . . . . . . . . . . . . . . . . . . . . . . . . . . . . . . . . . . . . . . . . . . . . . . . . . . . . . . . . . . 43Table 3.5. Environmental and socio-economic impacts associated with the technical
potential of biogas for power generation from manure in Tunisia. . . . . . . . . . . . . . . . . . . 45Table 3.6. Financial and economic CBA of biogas for power generation from
manure in Tunisia. . . . . . . . . . . . . . . . . . . . . . . . . . . . . . . . . . . . . . . . . . . . . . . . . . . . . . . . . . . . 47Table 3.7. Data sources for the CBA of biogas for power generation from manure. . . . . . . . . . . . 51Table 3.8. Key barriers to the adoption of biogas for power generation from
manure in Tunisia. . . . . . . . . . . . . . . . . . . . . . . . . . . . . . . . . . . . . . . . . . . . . . . . . . . . . . . . . . . . 53Table 3.9. Technology potential of solar milk coolers in Tunisia. . . . . . . . . . . . . . . . . . . . . . . . . . . . . . 54Table 3.10. Price and value added along the milk value chain due to milk loss reduction. . . . . . . . . 56Table 3.11. Environmental and socio-economic impacts associated with the technical
potential of solar milk coolers in Tunisia. . . . . . . . . . . . . . . . . . . . . . . . . . . . . . . . . . . . . . . . . 57Table 3.12. Financial and economic CBA of solar milk coolers in Tunisia. . . . . . . . . . . . . . . . . . . . . . . 59Table 3.13. Data sources for the CBA of solar milk coolers in Tunisia. . . . . . . . . . . . . . . . . . . . . . . . . 62Table 3.14. Key barriers to the adoption of solar milk coolers in Tunisia. . . . . . . . . . . . . . . . . . . . . . . 63Table 3.15. Performance of processing plants in Tanzania according to size. . . . . . . . . . . . . . . . . . . . 68Table 3.16. Electricity tariffs by TANESCO. . . . . . . . . . . . . . . . . . . . . . . . . . . . . . . . . . . . . . . . . . . . . . . . 72Table 3.17. Fees and administration costs of a power purchase agreement in Tanzania. . . . . . . . . . 73Table 3.18. Energy interventions considered for the milk value chain in Tanzania. . . . . . . . . . . . . . . . 75Table 3.19. Technology potential of biogas domestic milk chillers in Tanzania. . . . . . . . . . . . . . . . . . . 76Table 3.20. Environmental and socio-economic impacts associated with the technical
potential of biogas domestic milk chillers in Tanzania. . . . . . . . . . . . . . . . . . . . . . . . . . . . . 78Table 3.21. Financial and economic CBA ofiogas domestic milk chillers in Tanzania. . . . . . . . . . . . . . 80Table 3.22. Data sources for the CBA of biogas domestic milk chillers in Tanzania. . . . . . . . . . . . . . 84Table 3.23. Key barriers to the adoption of biogas domestic milk chillers in Tanzania. . . . . . . . . . . . 85Table 3.24. Technology potential of solar powered milk coolers in Tanzania. . . . . . . . . . . . . . . . . . . . 86Table 3.25. Average prices of fresh milk along the value chain and profits. . . . . . . . . . . . . . . . . . . . . 87Table 3.26. Environmental and socio-economic impacts associated with the technical
potential of solar milk coolers in Tanzania. . . . . . . . . . . . . . . . . . . . . . . . . . . . . . . . . . . . . . . 89Table 3.27. Financial and economic CBA of one solar milk cooler in Tanzania. . . . . . . . . . . . . . . . . . . 90Table 3.28. Data sources for the CBA of solar milk coolers in Tanzania. . . . . . . . . . . . . . . . . . . . . . . . 94Table 3.29. Key barriers to the adoption of solar milk coolers in Tanzania. . . . . . . . . . . . . . . . . . . . . . 95Table 3.30. Membership of dairy co-operative societies and number of dairy societies
and unions in Kenya, 2006–2012. . . . . . . . . . . . . . . . . . . . . . . . . . . . . . . . . . . . . . . . . . . . . . . 105Table 3.31. Energy interventions considered for the milk value chain in Kenya. . . . . . . . . . . . . . . . . . 105Table 3.32. Technology potential of biogas for power generation plants from
manure in Kenya. . . . . . . . . . . . . . . . . . . . . . . . . . . . . . . . . . . . . . . . . . . . . . . . . . . . . . . . . . . . . 106

ixMEASURING IMPACTS AND ENABLING INVESTMENTS IN ENERGY-SMART AGRIFOOD CHAINS
Table 3.33. Environmental and socio-economic impacts associated with the technical potential of biogas for power generation from manure in Kenya. . . . . . . . . . . . . . . . . . . . 108
Table 3.34. Financial and economic CBA of biogas for power generation from manure in Kenya. . . . . . . . . . . . . . . . . . . . . . . . . . . . . . . . . . . . . . . . . . . . . . . . . . . . . . . . . . . . 109
Table 3.35. Data sources for the CBA of biogas for power generation from manure in Kenya. . . . . . . . . . . . . . . . . . . . . . . . . . . . . . . . . . . . . . . . . . . . . . . . . . . . . . . . . . . . . 113
Table 3.36. Key barriers to the adoption of biogas for power generation from manure in Kenya.. . 114Table 3.37. Technology potential of biogas domestic milk chillers in Kenya. . . . . . . . . . . . . . . . . . . . . 116Table 3.38. Value added along the milk value chain due to evening milk entering the
formal channels. . . . . . . . . . . . . . . . . . . . . . . . . . . . . . . . . . . . . . . . . . . . . . . . . . . . . . . . . . . . . . 117Table 3.39. Environmental and socio-economic impacts associated with the technical
potential of biogas domestic milk chillers in Kenya. . . . . . . . . . . . . . . . . . . . . . . . . . . . . . . . 118Table 3.40 Financial and economic CBA of biogas domestic milk chillers in Kenya. . . . . . . . . . . . . . 120Table 3.41. Data sources for the CBA of biogas domestic milk chillers in Kenya. . . . . . . . . . . . . . . . . 123Table 3.42. Key barriers to the adoption of biogas domestic milk chillers in Kenya. . . . . . . . . . . . . . 125Table 3.43. Dairy business units with an installed capacity between 300 and 600 litres
in Kenya. . . . . . . . . . . . . . . . . . . . . . . . . . . . . . . . . . . . . . . . . . . . . . . . . . . . . . . . . . . . . . . . . . . . 126Table 3.44. Environmental and socio-economic impacts associated with the technical
potential of solar milk coolers in Kenya. . . . . . . . . . . . . . . . . . . . . . . . . . . . . . . . . . . . . . . . . 128Table 3.45. Financial and economic CBA of solar milk coolers in Kenya. . . . . . . . . . . . . . . . . . . . . . . . 131Table 3.46. Data sources for the CBA of solar milk coolers in Kenya. . . . . . . . . . . . . . . . . . . . . . . . . . 134Table 3.47. Key barriers to the adoption of solar milk coolers in Kenya. . . . . . . . . . . . . . . . . . . . . . . . 135Table 3.48. Energy interventions considered for the vegetable value chain in Kenya. . . . . . . . . . . . . 141Table 3.49. Production area, output and value of green beans and tomatoes at national
level and in main producing counties, in 2014. . . . . . . . . . . . . . . . . . . . . . . . . . . . . . . . . . . . 142Table 3.50. Technology potential of solar cold storage systems for vegetables in Kenya. . . . . . . . . . 143Table 3.51. Price of tomato considered at each stage of the value chain.. . . . . . . . . . . . . . . . . . . . . . . 144Table 3.52. Price of green beans considered at each stage of the value chain. . . . . . . . . . . . . . . . . . . 145Table 3.53. Value added from avoided loss at farm and retail level in the tomato value chain. . . . . 145Table 3.54. Value added from avoided loss at farm level in the green bean value chain. . . . . . . . . . 146Table 3.55. Environmental and socio-economic impacts associated with the technical
potential of solar cold storage systems for vegetables in Kenya. . . . . . . . . . . . . . . . . . . . . 146Table 3.56. Financial and economic CBA of solar cold storage systems for vegetables in Kenya. . . 148Table 3.57. Data sources for the CBA of solar cold storage systems for vegetables in Kenya. . . . . . 151Table 3.58. Key barriers to the adoption of solar cold storage systems for vegetables in Kenya. . . 152Table 3.59. Technology potential of solar-powered irrigation systems for vegetables in Kenya. . . . 154Table 3.60. Environmental and socio-economic impacts associated with the technical
potential of solar-powered water pumps in Kenya. . . . . . . . . . . . . . . . . . . . . . . . . . . . . . . . 155Table 3.61. Financial and economic CBA of solar-powered water pumps in Kenya.. . . . . . . . . . . . . . 157Table 3.62. Data sources for the CBA of solar-powered water pumps for vegetables
in Kenya. . . . . . . . . . . . . . . . . . . . . . . . . . . . . . . . . . . . . . . . . . . . . . . . . . . . . . . . . . . . . . . . . . . . 160Table 3.63. Key barriers to the adoption of solar-powered water pumps for vegetables
in Kenya. . . . . . . . . . . . . . . . . . . . . . . . . . . . . . . . . . . . . . . . . . . . . . . . . . . . . . . . . . . . . . . . . . . . 161Table 3.64. Paddy production in the Philippines per year. . . . . . . . . . . . . . . . . . . . . . . . . . . . . . . . . . . . 164Table 3.65. Status of energization in the Philippines, in 2016. . . . . . . . . . . . . . . . . . . . . . . . . . . . . . . . . . 167Table 3.66. Energy interventions considered for the rice value chain in the Philippines. . . . . . . . . . . 170Table 3.67. Rice husk data for the Philippines. . . . . . . . . . . . . . . . . . . . . . . . . . . . . . . . . . . . . . . . . . . . . . 171Table 3.68. Palay production in off-grid provinces in the Philippines, 2013–2015. . . . . . . . . . . . . . . . . 171Table 3.69. Technology potential of rice husk gasification in off-grid areas of the Philippines. . . . . . 172Table 3.70. Approximate rice prices in the Philippines. . . . . . . . . . . . . . . . . . . . . . . . . . . . . . . . . . . . . . 175

x MEASURING IMPACTS AND ENABLING INVESTMENTS IN ENERGY-SMART AGRIFOOD CHAINS
Table 3.71. Environmental and socio-economic impacts associated with the technical potential of rice husk gasification in the Philippines. . . . . . . . . . . . . . . . . . . . . . . . . . . . . . . 175
Table 3.72. Financial and economic CBA of rice husk gasification in the Philippines. . . . . . . . . . . . . . 176Table 3.73. Data sources for the CBA of rice husks gasification in the Philippines. . . . . . . . . . . . . . . 183Table 3.74. Key barriers to the adoption of rice husk gasification in the Philippines. . . . . . . . . . . . . . 185Table 3.75. Sample technology data of solar-powered domestic rice processing systems. . . . . . . . 186Table 3.76. Technical potential of solar-powered domestic rice processing technology
in off-grid areas of the Philippines. . . . . . . . . . . . . . . . . . . . . . . . . . . . . . . . . . . . . . . . . . . . . . 187Table 3.77. Number of farm holdings served by one solar-powered domestic rice
processing system in off-grid areas of the Philippines. . . . . . . . . . . . . . . . . . . . . . . . . . . . . 187Table 3.78. Approximate price at the paddy, wholesale and retail levels. . . . . . . . . . . . . . . . . . . . . . . 188Table 3.79. Environmental and socio-economic impacts associated with the technical
potential of solar-powered domestic rice processing in the Philippines. . . . . . . . . . . . . . 189Table 3.80. Financial and economic CBA of solar-powered domestic rice processing
systems in the Philippines. . . . . . . . . . . . . . . . . . . . . . . . . . . . . . . . . . . . . . . . . . . . . . . . . . . . . 191Table 3.81. Data sources for the CBA of solar-powered domestic rice processing in
the Philippines. . . . . . . . . . . . . . . . . . . . . . . . . . . . . . . . . . . . . . . . . . . . . . . . . . . . . . . . . . . . . . 195Table 3.82. Key barriers to the adoption of solar-powered domestic rice processing
in the Philippines. . . . . . . . . . . . . . . . . . . . . . . . . . . . . . . . . . . . . . . . . . . . . . . . . . . . . . . . . . . . 197Table 4.1. Main thematic policy and regulatory areas for removing barriers to the
deployment of clean energy technologies along the agrifood chain. . . . . . . . . . . . . . . . . 201Table 4.2. Policy support interventions to overcome barriers to deployment of biogas
for power generation from manure. . . . . . . . . . . . . . . . . . . . . . . . . . . . . . . . . . . . . . . . . . . . 208Table 4.3. Suitability of various business models for deployment of biogas for power
generation from manure. . . . . . . . . . . . . . . . . . . . . . . . . . . . . . . . . . . . . . . . . . . . . . . . . . . . . 209Table 4.4. Policy support interventions to overcome barriers to deployment of biogas
domestic milk chillers. . . . . . . . . . . . . . . . . . . . . . . . . . . . . . . . . . . . . . . . . . . . . . . . . . . . . . . . 210Table 4.5. Suitability of various business models for deployment of biogas domestic milk chillers. . . . 211Table 4.6. Policy support interventions to overcome barriers to deployment of solar
milk coolers. . . . . . . . . . . . . . . . . . . . . . . . . . . . . . . . . . . . . . . . . . . . . . . . . . . . . . . . . . . . . . . . . 212Table 4.7. Suitability of various business models for deployment of solar milk coolers. . . . . . . . . . 213Table 4.8. Policy support interventions to overcome barriers to deployment
of solar cold storage for vegetables. . . . . . . . . . . . . . . . . . . . . . . . . . . . . . . . . . . . . . . . . . . . 215Table 4.9. Suitability of various business models for deployment of solar cold
storage for vegetables. . . . . . . . . . . . . . . . . . . . . . . . . . . . . . . . . . . . . . . . . . . . . . . . . . . . . . . . 216Table 4.10. Policy support interventions to overcome barriers to deployment of
solar-powered water pumps. . . . . . . . . . . . . . . . . . . . . . . . . . . . . . . . . . . . . . . . . . . . . . . . . . 217Table 4.11. Suitability of various business models for deployment of solar-powered
water pumps. . . . . . . . . . . . . . . . . . . . . . . . . . . . . . . . . . . . . . . . . . . . . . . . . . . . . . . . . . . . . . . . 218Table 4.12. Policy support interventions to overcome barriers to deployment of rice husk gasifiers. 219Table 4.13. Suitability of various business models for deployment of rice husk gasifiers. . . . . . . . . . 220Table 4.14. Policy support interventions to overcome barriers to deployment of
solar-powered domestic rice processors. . . . . . . . . . . . . . . . . . . . . . . . . . . . . . . . . . . . . . . . 222Table 4.15. Suitability of various business models for deployment of solar-powered
domestic rice processors. . . . . . . . . . . . . . . . . . . . . . . . . . . . . . . . . . . . . . . . . . . . . . . . . . . . . 223Table 4.16. Main support interventions identified for each technology group. . . . . . . . . . . . . . . . . . . 225Table 5.1. Comparative analysis of the impact on gender issues of the 11 clean
energy interventions assessed. . . . . . . . . . . . . . . . . . . . . . . . . . . . . . . . . . . . . . . . . . . . . . . . . 243Table 5.2. Main barriers to financial service provision for clean energy technologies
and possible solutions. . . . . . . . . . . . . . . . . . . . . . . . . . . . . . . . . . . . . . . . . . . . . . . . . . . . . . . . 251

xiMEASURING IMPACTS AND ENABLING INVESTMENTS IN ENERGY-SMART AGRIFOOD CHAINS
Figures
Figure ES.1. Estimated financial and economic performance of the energy interventions assessed, at country level (example of Solar-powered domestic rice processing in the Philippines). . . . . . . . . . . . . . . . . . . . . . . . . . . . . . . . . . . . . . . . . . . . . . . . . . . . . . . . . . . . xx
Figure ES.2. Distribution of benefits in the 11 case studies analysed in this study in Kenya (KEN), Tunisia (TUN), Tanzania (TAN) and the Philippines (PHI). . . . . . . . . . . . . . . . . . . . . . . . . xxii
Figure ES.3. Financial and economic returns of the 11 energy interventions assessed for 1 US$ of initial investment. . . . . . . . . . . . . . . . . . . . . . . . . . . . . . . . . . . . . . . . . . . . . . . . . . . . xxiv
Figure ES.4. Greenhouse gas mitigation costs of the 11 energy interventions assessed. . . . . . . . . . . xxvFigure ES.5. Contribution of the 11 energy interventions assessed to SDG 8. . . . . . . . . . . . . . . . . . . xxviFigure ES.6. National cost of feed-in tariff for the case study ‘biogas for power generation from
dairy cattle manure’ in Tunisia and financial IRR. . . . . . . . . . . . . . . . . . . . . . . . . . . . . . . . . . xxviiFigure ES.7. National cost of price premium for cooled milk for the case study ‘solar milk
coolers’ in Tunisia and financial IRR. . . . . . . . . . . . . . . . . . . . . . . . . . . . . . . . . . . . . . . . . . . . xxviiiFigure ES.8. Sources of data used for the CBAs in the 11 case studies assessed. . . . . . . . . . . . . . . . . xxxiFigure 1.1. The CBA process when introducing an energy solution at I) the intervention
level typically for farmers and food processors and II) at the country level for policy-makers and financial institutions. . . . . . . . . . . . . . . . . . . . . . . . . . . . . . . . . . . . . . . . . 4
Figure 2.1. Connection between the technical potential of a clean energy technology and the value chain characteristics. . . . . . . . . . . . . . . . . . . . . . . . . . . . . . . . . . . . . . . . . . . . . . . . . 11
Figure 2.2. Moving from assessing impacts of clean energy interventions at intervention level (Phase I) to impacts at country level (Phase II). . . . . . . . . . . . . . . . . . . . . . . . . . . . . . 12
Figure 2.3. Example of traditional roles of men and women in a milk value chain and impacts of introducing a clean energy technology. . . . . . . . . . . . . . . . . . . . . . . . . . . . . . . . . . . . . . . . 15
Figure 3.1. Daily average quantity of milk collected and rejected at MCCs in Tunisia. . . . . . . . . . . . 36Figure 3.2. Gender roles along the milk value chain in Tunisia. . . . . . . . . . . . . . . . . . . . . . . . . . . . . . . . 37Figure 3.3. Distribution of MCCs and transformation units in Tunisia. . . . . . . . . . . . . . . . . . . . . . . . . 41Figure 3.4. Financial and economic cumulative discounted costs and benefits over 20 years
of a biogas for power generation plant in Tunisia. . . . . . . . . . . . . . . . . . . . . . . . . . . . . . . . . 48Figure 3.5. Financial NPV for a biogas for power generation plant from manure in Tunisia
according to the dry digestate price. . . . . . . . . . . . . . . . . . . . . . . . . . . . . . . . . . . . . . . . . . . . 49Figure 3.6. Cumulative economic costs and benefits of biogas for power generation from
manure in Tunisia at national level after 20 years. . . . . . . . . . . . . . . . . . . . . . . . . . . . . . . . . 50Figure 3.7. Input data for the assessment of the technology potential of biogas for power
generation from manure in Tunisia. . . . . . . . . . . . . . . . . . . . . . . . . . . . . . . . . . . . . . . . . . . . . 51Figure 3.8. Financial and economic cumulative discounted costs and benefits over 20 years
of a solar milk cooler in Tunisia. . . . . . . . . . . . . . . . . . . . . . . . . . . . . . . . . . . . . . . . . . . . . . . . 60Figure 3.9. Cumulative economic costs and benefits of solar milk coolers in Tunisia at
national level after 20 years. . . . . . . . . . . . . . . . . . . . . . . . . . . . . . . . . . . . . . . . . . . . . . . . . . . 61Figure 3.10. Input data for the assessment of the technology potential of solar milk coolers
in Tunisia. . . . . . . . . . . . . . . . . . . . . . . . . . . . . . . . . . . . . . . . . . . . . . . . . . . . . . . . . . . . . . . . . . . 61Figure 3.11. Improved dairy cattle population in Tanzania by Region, 2008/2009. . . . . . . . . . . . . . . . 66Figure 3.12. Gender roles along the milk value chain in Tanzania. . . . . . . . . . . . . . . . . . . . . . . . . . . . . . 71Figure 3.13. Financial and economic cumulative discounted costs and benefits over
10 years of a biogas domestic milk chiller in Tanzania. . . . . . . . . . . . . . . . . . . . . . . . . . . . . 82Figure 3.14. Cumulative economic costs and benefits of biogas domestic milk chillers in
Tanzania at national level after 10 years. . . . . . . . . . . . . . . . . . . . . . . . . . . . . . . . . . . . . . . . . 83

xii MEASURING IMPACTS AND ENABLING INVESTMENTS IN ENERGY-SMART AGRIFOOD CHAINS
Figure 3.15. Input data for the assessment of the technology potential of biogas domestic milk chillers in Tanzania. . . . . . . . . . . . . . . . . . . . . . . . . . . . . . . . . . . . . . . . . . . . . . . . . . . . . . . 83
Figure 3.16. Financial and economic cumulative discounted costs and benefits over 20 years of a solar milk cooler in Tanzania, if the system is owned by a) a dairy cooperative or b) a dairy processor. . . . . . . . . . . . . . . . . . . . . . . . . . . . . . . . . . . . . . . . . . . . . . . . . . . . . . . 92
Figure 3.17. Cumulative economic costs and benefits of solar milk coolers in Tanzania at national level after 20 years. . . . . . . . . . . . . . . . . . . . . . . . . . . . . . . . . . . . . . . . . . . . . . . . . . . 93
Figure 3.18. Input data for the assessment of the technology potential of solar milk coolers in Tanzania. . . . . . . . . . . . . . . . . . . . . . . . . . . . . . . . . . . . . . . . . . . . . . . . . . . . . . . . . . . . . . . . . 94
Figure 3.19. Share of raw milk production by main dairying regions in Kenya. . . . . . . . . . . . . . . . . . . . 96Figure 3.20. Main milk marketing pathways in Kenya. . . . . . . . . . . . . . . . . . . . . . . . . . . . . . . . . . . . . . . . . 98Figure 3.21. Dairy business units in Kenya. . . . . . . . . . . . . . . . . . . . . . . . . . . . . . . . . . . . . . . . . . . . . . . . . . 99Figure 3.22. Gender roles along the milk value chain in Kenya. . . . . . . . . . . . . . . . . . . . . . . . . . . . . . . . . 102Figure 3.23. Electricity grid distribution in Kenya in 2017. . . . . . . . . . . . . . . . . . . . . . . . . . . . . . . . . . . . . 103Figure 3.24. Financial and economic cumulative discounted costs and benefits over
20 years of a biogas for power generation plant in Kenya. . . . . . . . . . . . . . . . . . . . . . . . . . 110Figure 3.25. Financial NPV for a biogas for power generation plant in Kenya according to
the wet digestate price. . . . . . . . . . . . . . . . . . . . . . . . . . . . . . . . . . . . . . . . . . . . . . . . . . . . . . . 111Figure 3.26. Cumulative economic costs and benefits of biogas for power generation from
manure in Kenya at national level after 20 years. . . . . . . . . . . . . . . . . . . . . . . . . . . . . . . . . . 112Figure 3.27. Input data for the assessment of the technology potential of biogas for power
generation from manure in Kenya. . . . . . . . . . . . . . . . . . . . . . . . . . . . . . . . . . . . . . . . . . . . . . 112Figure 3.28. Financial and economic cumulative discounted costs and benefits over
10 years of a biogas domestic milk chiller in Kenya. . . . . . . . . . . . . . . . . . . . . . . . . . . . . . . 121Figure 3.29. Cumulative economic costs and benefits of biogas domestic milk chillers in
Kenya at national level after 10 years. . . . . . . . . . . . . . . . . . . . . . . . . . . . . . . . . . . . . . . . . . . 122Figure 3.30. Input data for the assessment of the technology potential of biogas domestic
milk chillers in Kenya. . . . . . . . . . . . . . . . . . . . . . . . . . . . . . . . . . . . . . . . . . . . . . . . . . . . . . . . . 122Figure 3.31. Financial and economic cumulative discounted costs and benefits over 20 years
of a solar milk cooler in Kenya. . . . . . . . . . . . . . . . . . . . . . . . . . . . . . . . . . . . . . . . . . . . . . . . . 132Figure 3.32. Cumulative economic costs and benefits of solar milk coolers in Kenya at national
level after 20 years. . . . . . . . . . . . . . . . . . . . . . . . . . . . . . . . . . . . . . . . . . . . . . . . . . . . . . . . . . 133Figure 3.33. Input data for the assessment of the technology potential of solar milk coolers
in Kenya. . . . . . . . . . . . . . . . . . . . . . . . . . . . . . . . . . . . . . . . . . . . . . . . . . . . . . . . . . . . . . . . . . . . 133Figure 3.34. Gender roles along the vegetables value chain in Kenya. . . . . . . . . . . . . . . . . . . . . . . . . . . 139Figure 3.35. Financial and economic cumulative discounted costs and benefits over 20 years
of a solar cold storage system for vegetables in Kenya. . . . . . . . . . . . . . . . . . . . . . . . . . . . 149Figure 3.36. Cumulative economic costs and benefits of solar cold storage systems for
vegetables in Kenya at national level after 20 years. . . . . . . . . . . . . . . . . . . . . . . . . . . . . . . 150Figure 3.37. Input data for the assessment of the technology potential of solar cold storage
systems for vegetables in Kenya. . . . . . . . . . . . . . . . . . . . . . . . . . . . . . . . . . . . . . . . . . . . . . . . 150Figure 3.38. Dynamic head and population in agricultural areas in Kenya. . . . . . . . . . . . . . . . . . . . . . . 153Figure 3.39. Financial and economic cumulative discounted costs and benefits over 10 years
of a solar-powered water pump for vegetables in Kenya. . . . . . . . . . . . . . . . . . . . . . . . . . 158Figure 3.40. Cumulative economic costs and benefits of solar-powered water pumps for
vegetables in Kenya at national level after 10 years. . . . . . . . . . . . . . . . . . . . . . . . . . . . . . . 159Figure 3.41. Input data for the assessment of the technology potential of solar-powered
water pumps for vegetables in Kenya. . . . . . . . . . . . . . . . . . . . . . . . . . . . . . . . . . . . . . . . . . . 160Figure 3.42. Rice value chain in the Philippines. . . . . . . . . . . . . . . . . . . . . . . . . . . . . . . . . . . . . . . . . . . . . . 163

xiiiMEASURING IMPACTS AND ENABLING INVESTMENTS IN ENERGY-SMART AGRIFOOD CHAINS
Figure 3.43. Gender roles along the rice value chain in the Philippines. . . . . . . . . . . . . . . . . . . . . . . . . 166Figure 3.44. Financial and economic cumulative discounted costs and benefits over
10 years of a rice husk gasification system in the Philippines. . . . . . . . . . . . . . . . . . . . . . . 178Figure 3.45. Financial and economic NPV for the 1-shift and 2-shifts scenarios according
to rice husk price. . . . . . . . . . . . . . . . . . . . . . . . . . . . . . . . . . . . . . . . . . . . . . . . . . . . . . . . . . . . 179Figure 3.46. Financial and economic NPV for the 2-shifts scenario with SAGR according to
rice husk price. . . . . . . . . . . . . . . . . . . . . . . . . . . . . . . . . . . . . . . . . . . . . . . . . . . . . . . . . . . . . . 179Figure 3.47. Financial and economic NPV for the 1-shift scenario according to diesel price. . . . . . . . 180Figure 3.48. Financial and economic NPV for the 2-shifts scenario with SAGR scenario
according to diesel price. . . . . . . . . . . . . . . . . . . . . . . . . . . . . . . . . . . . . . . . . . . . . . . . . . . . . . 181Figure 3.49. Cumulative economic costs and benefits of rice husk gasification in the Philippines
at national level after 10 years. . . . . . . . . . . . . . . . . . . . . . . . . . . . . . . . . . . . . . . . . . . . . . . . . 182Figure 3.50. Input data for the assessment of the technology potential of rice husk
gasification in the Philippines. . . . . . . . . . . . . . . . . . . . . . . . . . . . . . . . . . . . . . . . . . . . . . . . . . 183Figure 3.51. Financial and economic cumulative discounted costs and benefits over 20 years
of a solar-powered domestic rice processing unit in the Philippines. . . . . . . . . . . . . . . . . 193Figure 3.52. Cumulative economic costs and benefits of solar-powered domestic rice
processing in the Philippines at national level after 20 years. . . . . . . . . . . . . . . . . . . . . . . 194Figure 3.53. Input data for the assessment of the technology potential of solar-powered
domestic rice processing technology in the Philippines. . . . . . . . . . . . . . . . . . . . . . . . . . . . 195Figure 4.1. Percentage of adults (> 15 years) in rural areas borrowing and savings
in 2014 (Global). . . . . . . . . . . . . . . . . . . . . . . . . . . . . . . . . . . . . . . . . . . . . . . . . . . . . . . . . . . . . 227Figure 4.2. Percentage of adults (> 15 years) in rural areas borrowing and savings in 2014
(Sub-Saharan Africa). . . . . . . . . . . . . . . . . . . . . . . . . . . . . . . . . . . . . . . . . . . . . . . . . . . . . . . . . 227Figure 5.1. Distribution of benefits in the 11 case studies analysed in this study in Kenya,
Tunisia , Tanzania and the Philippines. . . . . . . . . . . . . . . . . . . . . . . . . . . . . . . . . . . . . . . . . . . 230Figure 5.2. Financial and economic returns of the 11 energy interventions assessed for
1 US$ of initial investment. . . . . . . . . . . . . . . . . . . . . . . . . . . . . . . . . . . . . . . . . . . . . . . . . . . . 232Figure 5.3. Greenhouse gas mitigation costs of the 11 energy interventions assessed. . . . . . . . . . . 233Figure 5.4. Contribution of the 11 energy interventions assessed to SDG 8. . . . . . . . . . . . . . . . . . . 234Figure 5.5. Contribution of the 11 energy interventions assessed to specific SDGs. . . . . . . . . . . . . 235Figure 5.6. Financial NPV of biogas for power in Tunisia according to the cost of grid
electricity. . . . . . . . . . . . . . . . . . . . . . . . . . . . . . . . . . . . . . . . . . . . . . . . . . . . . . . . . . . . . . . . . . 236Figure 5.7. Financial NPV of biogas for power in Tunisia according to the price paid for
electricity produced by the biogas plant. . . . . . . . . . . . . . . . . . . . . . . . . . . . . . . . . . . . . . . . 237Figure 5.8. National cost of feed-in tariff for the case study ‘biogas for power from dairy
cattle manure’ in Tunisia and financial IRR. . . . . . . . . . . . . . . . . . . . . . . . . . . . . . . . . . . . . . . 238Figure 5.9. Financial NPV of solar milk coolers in Tunisia according to milk price. . . . . . . . . . . . . . . . 239Figure 5.10. National cost of a price premium for cooled milk for the case study ‘solar
milk coolers’ in Tunisia and financial IRR. . . . . . . . . . . . . . . . . . . . . . . . . . . . . . . . . . . . . . . . 240Figure 5.11. National cost of a price premium for cooled milk for the case study ‘solar milk
coolers’ in Tanzania and financial IRR. . . . . . . . . . . . . . . . . . . . . . . . . . . . . . . . . . . . . . . . . . . 241Figure 5.12. National cost of a price premium for cooled milk for the case study ‘solar milk
coolers’ in Kenya and financial IRR. . . . . . . . . . . . . . . . . . . . . . . . . . . . . . . . . . . . . . . . . . . . . 241Figure 5.13. Sources of data used for the CBAs in the 11 case studies assessed. . . . . . . . . . . . . . . . . 248Figure 5.14. Sources of data used for the CBAs in the 7 milk value chain case studies assessed. . . . 248

xiv MEASURING IMPACTS AND ENABLING INVESTMENTS IN ENERGY-SMART AGRIFOOD CHAINS
ACRONYMS AND ABBREVIATIONSADB Asian Development BankAFC Agricultural Finance Cooperation AfDB African Development BankANME Agence Nationale pour la Maitrise
de l’EnergieBAS Bureau of Agricultural StatisticsBDMC Biogas Domestic Milk ChillerBIR Bureau of Internal Revenue BMZ Federal Ministry for Economic
Cooperation and DevelopmentCAMARTEC Centre for Agriculture Mechanization
and Research of TechnologiesCBA Cost-benefit analysisCES Clean energy solutionsCOPD Chronic obstructive pulmonary diseaseDANIDA Denmark’s Development CooperationDX Direct expansionEADD East Africa Dairy Development projectERC Energy Regulatory CommissionEWURA Energy and Water Utilities Regulatory
AuthorityFAO Food and Agriculture Organization of
the United NationsFiT Feed-in TariffFNME Fonds National de Maîtrise de l’EnergieGACC Global Alliance for Clean CookstovesGBEP Global Bioenergy PartnershipGCCA Global Cold Chain AllianceGHG Greenhouse gasGIS Geographic Information SystemsGIVLAIT Groupement Interprofessionnel
des Viandes Rouges et du LaitGIZ Deutsche Gesellschaft für
Internationale Zusammenarbeit GmbHGPS Global Positioning Systems GSE Gestore Servizi Energetici GSMA Green Power for Mobile AssociationGVEP Global Village Energy PartnershipHAP Household air pollutionHCD Human-centred designIBI International Biochar InitiativeICARDA International Center for Agricultural
Research in the Dry AreasICEX Instituto Español de Comercio ExteriorIEA International Energy AgencyIFAD International Fund for Agricultural
Development
IFI International Finance InstitutionsIISD International Institute for Sustainable
DevelopmentILO International Labor OrganizationILRI International Livestock Research
Institute INRAT Institut National de la Recherche
Agronomique de TunisieINVESTA Investing in Sustainable Energy
Technologies in the Agrifood Sector IPCC Intergovernmental Panel for Climate
ChangeIPPs Independent Power ProducersIRENA International Renewable Energy
AgencyIRR Internal rate of returnIRRI International Rice Research InstituteJRC Joint Research CentreKAVES Kenya Agriculture Value Chain
EnterprisesKCC Kenya Co-operative Creameries KDB Kenya Dairy BoardKES Kenyan ShillingKFIE Kenya Feed the Future Innovation
EngineKNBS Kenya National Bureau of StatisticsKPLC Kenya Power and Lighting CompanyKRA Kenya Revenue AuthorityKSSI Kenya Smallholder Solar Irrigation
ProjectKTA Kenya Transporters AssociationLCA Life-cycle assessmentLME Liquid milk equivalentMALF Ministry of Agriculture, Livestock and
Fisheries (Tanzania)MARHP Ministère de l’Agriculture, des
Ressources Hydrauliques et de la PêcheMCC Milk collection centreMEM Ministry of Energy and Minerals MFI Micro financial institutionsMLFD Ministry of Livestock and Fisheries
DepartmentMMA Match Maker Associates NAFIS National Farmers International ServiceNBS National Bureau of StatisticsNFA National Food AuthorityNGO Non-Governmental Organization

xvMEASURING IMPACTS AND ENABLING INVESTMENTS IN ENERGY-SMART AGRIFOOD CHAINS
NPC National Power CorporationNPC-SPUG National Powered Corporation
Small-power Utilities GroupNPV Net present valueNREL National Renewable Energy LaboratoryODI Overseas Development Institute OEP Office de l’Elevage et des Pâturages ONAGRI Observatoire National de l’AgricultureONFP Office National de la Famille et de la
Population PAEGC Powering Agriculture: An Energy
Grand Challenge for DevelopmentPAF Population attributable fractionPEF Post-Harvest Education FundPHP Philippine PesoPIDS Philippine Institute for Development
StudiesPPA Power purchase agreementPPP Purchasing power parityPSA Philippines Statistics AuthorityPSS Project Support Services Ltd PV PhotovoltaicRCREE Regional Center for Regional
Renewable Energy and Energy Efficiency
RE Renewable EnergyREA Rural Energy AgencyREEEP Renewable Energy and Energy
Efficiency PartnershipREFiT Renewable Energy Feed-in TariffREMB Renewable Energy Management
BureauRHG Rice Husk GasificationSACCO Savings and Credit Cooperatives SAGR Subsidized approved generation rateSCC Social cost of carbonSDG Sustainable Development GoalSEAI Sustainable Energy Authority of IrelandSEEA System of Environmental-Economic
AccountingSEEA-AFF System of Environmental-Economic
Accounting for Agriculture, Forestry and Fisheries
SEEA-CF System of Environmental-Economic Accounting Central Framework
SIS System impact studySNV Netherlands Development
OrganizationSPIS Solar Powered Irrigation SystemsSPUG Small Power Utilities GroupSTEG Société Tunisienne de l’Electricité et
du GazSTIR Société Tunisienne des Industries
de RaffinageTANESCO Tanzania Electric Supply Company TBS Tanzania Bureau of StandardsTDB Tanzania Dairy BoardTDBP Tanzania Domestic Biogas ProgrammeTDCU Tanga Dairy Cooperative UnionTIC Tanzania Investment CentreTLMI Tanzania Livestock Modernization
Initiative TND Tunisian DinarTOU Time of useTRA Tanzania Revenue AuthorityTZS Tanzanian ShillingsUHT Ultra-high temperatureUN United NationsUNEP United Nations Environment
Programme UNFCCC United Nations Framework
Convention on Climate ChangeUSAID United States Agency for International
DevelopmentUSEPA United States Environment Protection
AgencyUS$ United States DollarUTAP Union Tunisienne de l’Agriculture et
de la PêcheVAT Value added taxVC Value chainWB World BankWEE Women’s Economic EmpowermentWHO World Health Organization WTO World Trade OrganizationWTP Willingness to pay

xvi MEASURING IMPACTS AND ENABLING INVESTMENTS IN ENERGY-SMART AGRIFOOD CHAINS

xviiMEASURING IMPACTS AND ENABLING INVESTMENTS IN ENERGY-SMART AGRIFOOD CHAINS
EXECUTIVE SUMMARYThe target audience for this report includes policy makers, project developers, financing agencies, donors and private investors. The study aims to measure impacts and enable investments in energy-smart agrifood chains by identifying the main barriers impeding the full deployment of clean energy technologies in four case study countries and recommending possible solutions to overcome them.
The study shows how to apply the methodological approach developed in the PAEGC study “Costs and Benefits of Clean Energy Technologies in the Milk, Vegetable and Rice Value Chains” (FAO and GIZ, 2018) at country level. The methodology provides guidelines for a sound and comprehensive cost-benefit analysis (CBA) of clean energy interventions in agrifood value chains and compares the economic net benefits (including hidden costs and co-benefits) with a simple financial analysis to inform investors. The environmental and socio-economic indicators and impacts were identified for this level of analysis. After assessing the impacts at the individual intervention level on environmental, social and economic aspects (as presented in FAO and GIZ, 2018), the technical potential of a technology is estimated for a given country, using, when possible, national data on agricultural production and agrifood processing.
The rationale for enlarging the scope from the intervention level to the country level is to provide decision-makers with an indication of socio-economic costs and benefits related to the introduction of specific energy technologies in the milk, vegetable and rice value chains associated with investments at scale. It aims to answer the following questions:
• How can specific clean energy interventions in the agrifood chain be fostered at the national level?
• Which conditions conducive for investments should be introduced, given the specific context?
• Which factors for successful deployment have been experienced by investors and can be useful lessons for others?
Cost-benefit analysis of clean energy interventions at country level
The set of indicators presented in FAO and GIZ (2018) for evaluating the environmental and social impacts of selected technologies in the CBA was modified and adapted for this macro-analysis at country level. Indicators used for intervention-level and country-level assessments are summarised in Table ES.1, as well as related targets of the Sustainable Development Goals (SDGs). Due their scalability energy technologies for agrifood are an effective ‘instrument’ to contribute to achieving the SDGs in time.
The indicators not measured at country level are soil quality, indoor air pollution, and water quality, whereas health risk due to indoor pollution and fossil fuel consumption are introduced as new country-level indicators to measure the impacts that cannot be monetized.

xviii MEASURING IMPACTS AND ENABLING INVESTMENTS IN ENERGY-SMART AGRIFOOD CHAINS
TABLE ES.1 Summary of indicators for the CBA assessment at intervention level, at country level, and related SDG targets.
Indicators for intervention-level assessment
Indicators for country-level assessment
SDG targets linked to the indicators for country-level assessment
Envi
ronm
enta
l im
pact
s
Soil quality – –
Fertilizer use and efficiency Fertilizer use Target 12.4; Target 15.5
Indoor air pollution – –
Water use and efficiency Water use and efficiency Target 6.4; Target 12.2
Water quality – –
Food loss Food loss Target 2.1, 2.2; Target 12.2
Land requirement Land requirement Target 15.5
GHG emission GHG emission Target 13.2
Soci
o-e
cono
mic
impa
cts Time saving Time saving Target 2.3; Target 5.8; Target 8.2
Employment Employment Target 5.8; Target 8.3
Access to energy Access to energy Target 7.1
Household income Household income Target 2.3; Target 8.2
– Health risk due to indoor air pollution
Target 3.9
– Fossil fuel consumption Target 7.2; Target 12.2
Note: The SDG targets are described in FAO and GIZ (2018) with the exception of Target 7.2 (by 2030, increase substantially the share of renewable energy in the global energy mix), which is relevant for the new country-level indicator “fossil fuel consumption”.
Source: Authors.
The technologies for replacing fossil with renewable energy sources or with potential for reducing energy demand in the milk value chain were considered for deployment in the case study countries of Kenya, Tanzania and Tunisia; in the vegetable value chain for Kenya; and in the rice value chain for the Philippines (Table ES.2). Not all technologies were evaluated in each country value chain, since those showing a low adoption potential were excluded.

xixMEASURING IMPACTS AND ENABLING INVESTMENTS IN ENERGY-SMART AGRIFOOD CHAINS
TABLE ES.2. Value chains and technologies considered in the study
Value chain
Energy technology
Energy technology descriptionM
ilk v
alue
cha
in
Biogas for power generation from dairy cattle manure
The plant has a 650 m3 anaerobic digester and uses cattle manure mixed with crop residues as feedstock, linked with a gas engine to power a generator of 150 kWel nominal power capacity. The plant is connected to the national grid.
Biogas domestic milk chiller
The domestic-scale biogas digester and milk chiller is a technology suitable for smallholder dairy farmers with few cows since it can only cool up to 10 litres of milk per day. The technology allows chilling milk, producing digestate slurry/manure as a fertiliser and using surplus biogas as a fuel for clean cook-stoves.
Solar milk cooler The system can chill and store 500 to 2,000 litres of milk per day relying just on solar power. The system is a complete milk collection and chilling station including a milk receiving and testing section, a rapid milk chilling section and a milk storage section. The system can cool milk to 4 °C in less than 1 hour, whereas less efficient, conventional direct expansion (DX) chillers can take up to 3 to 4 hours, thus improving the milk quality by reducing bacteria growth.
Vege
tabl
e va
lue
chai
n
Solar cold storage
The 25 m3 refrigerated cold storage system, designed for tomatoes and green beans, is powered by electricity from a 11 kWp solar PV array. The system is built in a 20 feet shipping container.
Solar-powered water pumping
The water pump used for the case study is equipped with an 80 Wp panel for pumping up to 1,200 litres per day from a maximum depth of 8 metres and is suitable for irrigating 0.2 ha of vegetable cropland.
Ric
e va
lue
chai
n
Rice husk gasification
The 100 kWel rice husk gasifier is connected to a rice mill. The technology used for the case study is a gasifier with dry ash removal and dry gas filter technology. The system consumes up to 120 kg of biomass per hour, which represents about a third of the typically available husk left over from milling.
Solar-powered domestic rice processing
The solar-powered domestic-scale rice processing and milling equipment can process up to 120 kg per day. The technology improves the rice quality if compared to common diesel-powered mills due to lower damage of grains.
Note: More details on the technologies listed can be found in the case studies analysed in FAO and GIZ (2018).
The results of the CBA for the country case studies include the initial investment required at country level, the investment horizon (over the expected lifetime of the technology), the financial attractiveness (in terms of internal rate of return (IRR) and net present value (NPV)), and the economic NPV including hidden costs and co-benefits (Figure ES.1). The non-monetized impacts are shown as circles and were quantified where possible.

xx MEASURING IMPACTS AND ENABLING INVESTMENTS IN ENERGY-SMART AGRIFOOD CHAINS
Barriers to technology adoption and support interventions
During field visits in the case study countries and meetings with national stakeholders, specific national data (including official data) and information on the energy technologies and the value chains under analysis were collected. For each clean energy intervention assessed in a specific value chain, the main barriers to technology adoption and possible solutions were presented and discussed during national stakeholder meetings organized in each of the four countries. The following categories of barriers to technology adoption have been identified:
• knowledge and information;
• organization/social;
• regulations/institutions;
• support services/structures;
FIGURE ES.1. Estimated financial and economic performance of the energy interventions assessed, at country level (example of solar-powered domestic rice processing in the Philippines)
Mill
ion
US$
15
10
20
5
0
25
30
35
40Financial net bene�ts
GHG emissions
Employment
Access to energy
Value added along the VC
8.02
10.69
2.04
10.03
–9.11
US$ 17.6 millionFor 3,600 systems
INITIAL INVESTMENTOVER 20 YEARS
US$ 39.9 millionECONOMIC NPV
FINANCIAL IRR
16%
US$ 9.1 millionFINANCIAL NPV
Water use and ef�ciency7,763millionl/year
Fossil fuel consumption244,000GJ/year
Time saving
Note: The sum of the financial NPV and the economic co-benefits and costs is the economic NPV.
Colour code for non-monetized impacts: Positive impact Variable impact Negative impact
Source: Authors.

xxiMEASURING IMPACTS AND ENABLING INVESTMENTS IN ENERGY-SMART AGRIFOOD CHAINS
• financial returns; and
• access/cost of capital.
Possible support interventions to overcome each barrier, led by governments, donors, private sector actors, investors, international financial institutions (IFIs) and NGOs, were subsequently identified and classified as:
• target setting;
• “sticks”: regulatory schemes based on legal responsibility and jurisdiction;
• “carrots”: financial incentive schemes including guarantees; and
• guidance: knowledge and education schemes.
Guarantees supporting energy interventions play an important role in financial incentive schemes to mitigate the risk for small farmers and processors. They are usually issued by public entities such as governments and international finance institutions (IFIs) to address political, policy, credit and currency risks. These can be tailored to the needs of small farmers and processors (e.g. pay-as-you-grow or leasing fee financing schemes). They can be combined with new technology systems such as mobile banking, Gobal_Positioning_Systems (GPS) and weather stations in order to include clients without a credit track record or even a bank account. Such systems are significantly changing the flow of information available to all VC value chain actors, including financers.
The wealth of information on possible business models and financing instruments to hedge against investment risks was considered in the analysis conducted in this study, informing the formulation of general lessons learned to develop supporting interventions and instruments.
Instruments to prioritize energy interventions based on their net co-benefits
The CBA methodology devised for the INVESTA project can be a powerful tool for policy makers, project developers, financing agencies, donors and private investor. By showing how economic benefits (financial benefits and co-benefits) and hidden costs are distributed, it focuses their impact investments and determines the level of public support needed to achieve development objectives. The distribution of economic benefits was analysed for the 11 case studies (Figure ES.2). Each clean energy intervention could have only benefits (from 0 to 100%) or only costs (0 to –100%). Net benefits are positive if the share above 0 is larger than the share below 0. The blue bar represents the financial benefit (or cost).

xxii MEASURING IMPACTS AND ENABLING INVESTMENTS IN ENERGY-SMART AGRIFOOD CHAINS
FIG
UR
E E
S.2
. D
istr
ibut
ion
of b
enefi
ts in
the
11
case
stu
dies
ana
lyse
d in
thi
s st
udy
in K
enya
(K
EN),
Tuni
sia
(TU
N),
Tanz
ania
(TA
N)
and
the
Phili
ppin
es (
PHI).
100% 80%
60%
40%
20% 0%
– 20%
– 40%
– 60%
Wat
er u
se a
nd e
ffici
ency
Food
loss
GH
G e
mis
sion
sLa
nd r
equi
rem
ent
Subs
idie
s an
d ta
xes
Fina
ncia
l net
ben
efits
Foss
il fu
el c
onsu
mpt
ion
Acc
ess
to e
nerg
y
Valu
e ad
ded
alon
g
the
valu
e ch
ain
Empl
oym
ent
Tim
e sa
ving
Hou
seho
ld in
com
eFe
rtili
zer
use
Hea
lth r
isk
due
to
indo
or a
ir p
ollu
tion
Biogas for power generation – TUN
Biogas for power generation – KEN
Solar milk cooler – TAN
Domestic biogas milk chiller – KEN
Domestic biogas milk chiller – TAN
Solar milk cooler – TUN
Solar cold storage – KEN
Solar-powered water pumping – KEN
Rice husk gasification – PHI
Solar rice milling – PHI
Solar milk cooler – KEN
Not
e: T
he s
hare
s re
port
ed h
ere
take
into
acc
ount
onl
y th
e m
onet
ized
impa
cts.
Non
-mon
etiz
ed im
pact
s ca
n be
pos
itiv
e ,
can
have
an
unce
rtai
n im
pact
,
or b
e ne
gati
ve
.
Sour
ce: A
utho
rs.

xxiiiMEASURING IMPACTS AND ENABLING INVESTMENTS IN ENERGY-SMART AGRIFOOD CHAINS
It is interesting to note that, depending on the country conditions and on the choice of benchmarks, the impact of the same energy intervention can be significantly different (see for example biogas for power generation in Tunisia and Kenya, or solar milk coolers in Tunisia, Kenya and Tanzania). Although the actual benefits can be significantly different in absolute terms, such a representation helps identify priorities for interventions in order to maximize a certain benefit. For example, if the objective of a donor or a development practitioner is to maximize the impact of investments on employment, interventions prioritized would be solar milk coolers in Tunisia, or rice husk gasification in the Philippines or solar-powered water pumping in Kenya. Likewise, a government actor may want to identify the energy intervention or technology that can maximize the impact on value added down the value chain in the country. In the case of Kenya, the choice would fall on solar milk coolers, followed by domestic biogas milk chillers and solar cold storage for tomatoes and beans.
The approach can be useful to investments in (or support for) clean energy interventions in the agrifood chains to give an indication of net co-benefits and therefore to prioritize different options.
Another analytical tool (Figure ES.3) highlights the difference between the financial returns (blue bars) and economic returns (orange bars) for each energy intervention as analysed. The returns have been divided by the initial investment. Therefore, the graph highlights the returns for one unit of money invested (in this case 1 US$ in year 0). As regards interventions such as solar milk coolers, biogas for power generation in Tunisia, rice husk gasification and solar rice milling in the Philippines, economic returns (including net co-benefits) largely exceed financial benefits. In certain cases, such as rice husk gasification in the Philippines, solar milk coolers and biogas for power generation in Tunisia, each US$ invested corresponds to a negative return in financial terms at the end of the investment timeframe whereas the economic return is positive. This can be the case when the energy intervention leads to co- products or services (e.g. a soil amendment or the possibility to power small appliances in the household) which are not sold or traded (so have no financial value).

xxiv MEASURING IMPACTS AND ENABLING INVESTMENTS IN ENERGY-SMART AGRIFOOD CHAINS
FIG
UR
E E
S.3
. Fi
nanc
ial a
nd e
cono
mic
ret
urns
of t
he 1
1 en
ergy
inte
rven
tions
ass
esse
d
for
1 U
S$ o
f ini
tial i
nves
tmen
t.
–2.0
–1.0
1.0
2.0
3.0
4.0
5.0
6.0
Wat
er u
se a
nd e
ffici
ency
ECO
NO
MIC
RET
UR
NS
FOR
1
US$
INV
EST
EDFo
od lo
ssFI
NA
NC
IAL
RET
UR
NS
FOR
1
US$
INV
EST
EDG
HG
em
issi
ons
Land
req
uire
men
tFo
ssil
fuel
con
sum
ptio
nA
cces
s to
ene
rgy
Empl
oym
ent
Tim
e sa
ving
Hou
seho
ld in
com
eFe
rtili
zer
use
Hea
lth r
isk
due
to
indo
or a
ir p
ollu
tion
Sola
r ri
ce m
illin
g –
PHI
Ric
e hu
sk g
asifi
catio
n –
PHI
Sola
r-po
wer
ed w
ater
pu
mpi
ng –
KEN
Sola
r co
ld s
tora
ge –
KEN
Dom
estic
bio
gas
milk
chi
ller
– TA
N
Dom
estic
bio
gas
milk
chi
ller
– K
EN
Sola
r m
ilk c
oole
r –
TAN
Sola
r m
ilk c
oole
r –
KEN
Sola
r m
ilk c
oole
r –
TU
N
Biog
as fo
r po
wer
ge
nera
tion
– K
EN
Biog
as fo
r po
wer
ge
nera
tion
– T
UN
0.0
Not
e: N
on-m
onet
ized
impa
cts
can
be p
osit
ive
, ha
ve u
ncer
tain
impa
ct
, or
be
nega
tive
.
Sour
ce: A
utho
rs.

xxvMEASURING IMPACTS AND ENABLING INVESTMENTS IN ENERGY-SMART AGRIFOOD CHAINS
The information used for the CBA can also be used to measure the mitigation costs of the energy interventions (Figure ES.4) and their contribution to a specific SDG (Figure ES.5). The methodology highlights the link between impact indicators and the specific targets under each SDG (see also Table ES.1). As such, it is possible to conclude that, if an energy intervention has a positive or negative impact on one indicator, it will also impact on the related SDGs. As an example, the impact of each energy intervention assessed in this study on SDG 8 (Promote sustained, inclusive and sustainable economic growth, full and productive employment and decent work for all) is shown in Figure ES.5. It highlights the share of total environmental and social benefits as well as costs associated with the implementation of an energy intervention with impact on SDG 8 (e.g. with biogas for power generation in Tunisia, 38% of the benefits is linked to SDG 8 while the remaining 62% is not). If targets under SDG 8 are to be promoted, the interventions ‘solar milk coolers’ in Tunisia and Tanzania, ‘solar cold storage’ for vegetables in Kenya and rice husk gasification in the Philippines should be prioritized12.
1 The impact on SDG 8 of ‘solar milk coolers’ in Kenya is less relevant than in Tanzania and Tunisia since in Kenya it is assumed that this technology is introduced in existing MCCs, therefore no direct job is created along the value chain (see Section 3.1.3 Solar milk cooler).
FIGURE ES.4. Greenhouse gas mitigation costs of the 11 energy interventions assessed.
300
200
100
0
–100
Biog
as fo
r pow
er
gene
ratio
n – T
UN
Biog
as fo
r pow
er
gene
ratio
n –
KEN
Solar
milk
coo
ler –
KEN
Dom
estic
bio
gas
milk
chi
ller –
KEN
Dom
estic
bio
gas
milk
chi
ller –
TAN
Solar
col
d st
orag
e –
KEN
Solar
-pow
ered
wat
er
pum
ping
– K
EN
Rice
hus
k
gasifi
catio
n –
PHI
Solar
rice
milli
ng –
PH
I
–200
–300
– 400
US$
/t C
O2e
q
Source: Authors.

xxvi MEASURING IMPACTS AND ENABLING INVESTMENTS IN ENERGY-SMART AGRIFOOD CHAINS
Instruments to design public support for positive economic returns
The methodology can also be used to determine the level of support for an energy intervention required to make the investment attractive from a financial point of view and still bring positive net economic returns. From a sustainable development perspective, this is useful information to determine, for example, the amount of matching grants for investments or public support.
EXAMPLE: FEED-IN TARIFF FOR BIOGAS FOR POWER FROM CATTLE MANURE IN TUNISIAIn Tunisia, the retail price for grid electricity is around US$ 0.07/kWh (TND 0.15/kWh) since the electricity is heavily subsidized. By removing the direct subsidy of US$ 0.06/kWh (Alcor, 2014), the price paid would be around US$ 0.13/kWh (2016 data). With this non-subsidized price of electricity, the NPV for a biogas plant would be around US$ 38,000 with a 9% IRR. However, other implications of removing subsidies, such as potential social unrest, should be taken into consideration.
A feed-in tariff (FiT), which is a cost in terms of public expenditures, would be justified as long as the cost remains below the net co-benefits brought by the adoption of the
FIGURE ES.5. Contribution of the 11 energy interventions assessed to SDG 8.
100%
90%
80%
70%
60%
50%
40%
30%
20%
10%
0%
Biog
as fo
r po
wer
gene
ratio
n - T
UN
Biog
as fo
r po
wer
gene
ratio
n - K
ENSo
lar m
ilk c
oole
r - T
UN
Solar
milk
coo
ler
- KEN
Solar
milk
coo
ler
- TAN
Dom
estic
bio
gas
milk
chi
ller
- KEN
Dom
estic
bio
gas
milk
chi
ller
- TAN
Solar
col
d st
orag
e - K
ENSo
lar-p
ower
ed w
ater
pum
ping
- KE
NRi
ce h
usk
gasifi
catio
n - P
HI
Solar
rice
milli
ng -
PHI
SDG 8 Others
Note: SDG 8 is: “Promote sustained, inclusive and sustainable economic growth, full and productive employment and decent work for all”. This analysis only takes into account the monetized environmental and social impacts.
Source: Authors.

xxviiMEASURING IMPACTS AND ENABLING INVESTMENTS IN ENERGY-SMART AGRIFOOD CHAINS
technology. In Tunisia the net co-benefits were estimated to be worth US$ 86 million. Therefore, a FiT up to US$ 0.185/kWh could be justified, corresponding to a financial IRR of 10% and a financial NPV of US$ 19,132 which would make the investment moderately attractive for investors13 (Figure ES.6).
By way of comparison, in the case of Kenya, there is already an existing FiT for electricity from biogas for power generation of US$ 0.10/kWh. With a FiT slightly above US$ 0.11/kWh, the IRR would be higher than the discount rate for Kenya of 11%. This would make the investment viable, however, the cost to society would be about US$ 2.8 million/year, which is higher than the co-benefit value of the technology (import duty, digestate use, GHG emission and employment creation). Therefore, the investment would be even less interesting from an economic point of view.
EXAMPLE: PRICE PREMIUM FOR QUALITY COOLED MILK IN TUNISIAWithout a price premium for cooled milk, farmers in Tunisia receive US$ 0.336/litre (TND 0.776/litre), and the investment in a solar milk cooler does not pay back. Once a price premium for cooled milk leads to a price paid at the collection centre of above US$ 0.341/litre, the financial NPV of the investment turns positive. With a price premium of about US$ 0.015/litre, the payback time is reduced to about 10 years and the IRR becomes 14%.
The IRR varies with the milk price premium (Figure ES.7). If increased to US$ 0.049/litre (green background), the total cost for the country would still be lower than the economic co-benefits of US$ 43.2 million in terms of employment only, and US$ 4.4 million in terms
2 Please note that in this and the following examples, the non-monetized impacts are not taken into account.
FIGURE ES.6. National cost of feed-in tariff for the case study ‘biogas for power generation from dairy cattle manure’ in Tunisia and financial IRR.
120
100
80
60
40
20
0
Nat
iona
l cos
t (m
illio
n U
S$ o
ver
20 y
ears
)
0.02
0.00
0.07 0.09 0.11 0.13 0.15 0.17 0.19 0.21 0.23 0.25
0.06
0.04
0.10
0.08
0.12
0.14
IRR
%
Electricity selling price (US$/kWh)
The FiT cost is NOT justifi ed in economic terms
The FiT cost is justifi ed in economic terms
National cost IRR
Note: The case study project installed 73 biogas systems.
Source: Authors.

xxviii MEASURING IMPACTS AND ENABLING INVESTMENTS IN ENERGY-SMART AGRIFOOD CHAINS
of value added along the chain. This would make the investment extremely attractive. Similar analyses for other clean energy interventions, with a low financial profitability but positive economic net benefit, are reported in chapter 5. This type of analysis can help decision-makers to get a clearer picture as to what extent a support subsidy for a given kind of energy intervention is justified in economic terms, and therefore inform investment decisions and planning.
Gender analysis for clean energy interventions in agrifood chains
A comparative analysis of the case studies was performed to assess the gender groups which would be most impacted (positively or negatively) by the energy interventions. Each intervention is implemented at a certain step of the value chain but can also have impacts before or after that particular step. Where and what type of impact a given clean energy intervention would have for women and/or men is summarized in Table ES.3, showing the gender balance of participants in the steps of each value chain analysed. Social impact indicators used for the CBA such as health risk due to indoor health pollution; access to energy; time saving; and employment, are provided disaggregated by gender when data availability allowed.
FIGURE ES.7. National cost of price premium for cooled milk for the case study ‘solar milk coolers’ in Tunisia and financial IRR.
30
25
20
15
10
5
0
Nat
iona
l cos
t (m
illio
n U
S$ o
ver
20 y
ears
)
5
0
0.0 0.03 0.6 0.9 1.2 1.5 1.8 2.1 2.3
15
10
25
20
IRR
%
Price premium (US$ cent/I)
The price premium is NOT justifi ed in economic terms
The price premium is justifi ed in economic terms
National cost million US$ Financial IRR (%)
45
40
35
Note: The case study project installed 580 solar milk coolers.
Source: Authors.

xxixMEASURING IMPACTS AND ENABLING INVESTMENTS IN ENERGY-SMART AGRIFOOD CHAINS
Value chain
Energy intervention Value chain steps
Inputs Production Transport & Collection
Storage & Handling
Processing Outside the Vc
Milk
Biogas for power generation from dairy cattle manure – Tunisia
+ EMP men
Biogas for power generation from dairy cattle manure – Kenya
+ EMP men
Solar milk cooler – Tunisia
+ HHY MEN & women
+ EMP men
Solar milk cooler – Tanzania
+ HHY MEN & women
+ EMP men
Solar milk cooler – Kenya
+ HHY women & men
+ EMP men
Biogas domestic milk chiller – Tanzania
– TSV women
+ AEN women & men + HHY MEN & women
+HLT/AEN/TSV women + EMP men
Biogas domestic milk chiller – Kenya
– TSV women
+ AEN women & men + HHY WOMEN & men
+HLT/AEN/TSVwomen+ EMPmen
Vege
tabl
e
Solar cold storage – Kenya
+ HHYMEN & women
– TSVMEN & women
+ EMPmen
Solar powered water pumping – Kenya
+ TSVmen
+ HHYmen
+ AENmen+ EMPmen
Ric
e
Rice husk gasification – Philippines
+ EMPmen
Solar powered domestic rice processing – Philippines
+ HHYWOMEN & men
+ TSVwomen
+ HHYwomen & men– TSVwomen
+ AENmen+ EMPmen
Note: Colour code showing the gender balance in the steps of each value chain:
Only male participants
Equal number of male and female participants
Only female participants
Mainly male and fewer female participants
Mainly female and fewer male participants
The impact indicators affected by the energy intervention and whether they affect men and/or women are identified and shown in the relevant step of the value chain. Positive and negative impacts are presented by a plus and a minus sign, respectively. If the impact only affects one gender, only men or women are mentioned. If the impact affects both genders, both are mentioned. If the impact notably affects one gender more than the other, it is expressed in bold type. The impact indicators are abbreviated: HLT – Health risk due to indoor air pollution; AEN – Access to energy; HHY – Household income; TSV – Time saving; EMP – Employment.
Source: Authors.
TABLE ES.3. Comparative analysis of impacts on gender issues of the 11 energy interventions assessed.

xxx MEASURING IMPACTS AND ENABLING INVESTMENTS IN ENERGY-SMART AGRIFOOD CHAINS
Women farmers are commonly under-targeted and underserved in traditional and clean energy interventions. Yet, female customers, like male customers, represent business, financial and social sense to the private sector, development agencies and the government. Women account for almost half of the agricultural labour force in developing countries. In some rural areas the out-migration of men is leaving increasing numbers of women in charge of the farm and hence purchasing decisions. Women are also the fastest growing group of entrepreneurs and business owners in developing countries (Gill et al., 2012). Many investors require businesses and projects looking for funding to mainstream gender considerations throughout their operations and to monitor and report on gender outcomes.
In addition to this comparative analysis, chapter 5.2 provides a summary of the gender impacts of each energy intervention assessed. Further, the policy recommendations point out specific recommendations to support gender equality for energy-smart agrifood chains.
Data availability
An additional objective of the INVESTA project was to assess the available data needed to perform the analysis in order to make the methodology replicable. Ideally, it would be possible to perform the assessment using country-specific data taken from publicly available databases such as FAOSTAT, UN DATA, ILOSTAT or the World Bank Open Data database. However, the publicly available data, and even the official data that could be retrieved during field missions, was only a minor share of the data needed.
Figure ES.8 reports the share of data used in the case studies obtained from international databases (using official data), official data available in the country, literature and expert opinion – disaggregated by value chain and, for the milk value chain case studies, by country (see Figure 5.14). Only around 30% of all data needed could be retrieved from an international database and around 40% had to be sourced from the available literature.
There are significant gaps in available data from open shared data and statistics. These gaps are progressively being filled by international initiatives such as the System of Environmental-Economic Accounting Central Framework (SEEA-CF)14, which aims to aggregate and put in relation environmental and economic statistics (e.g. in a single relational database).
Instruments to foster investments
The main findings from the field visits and meeting concerning instruments to foster investments stress the importance of training and raising awareness of clean energy solutions among smallholders and food processors. However, also other value chain actors benefit from clean energy solutions. Collaboration and value chain linkages are crucial for improving access to markets and financial services.
3 See https://unstats.un.org/unsd/envaccounting/seea.asp for more information on the SEEA.

xxxiMEASURING IMPACTS AND ENABLING INVESTMENTS IN ENERGY-SMART AGRIFOOD CHAINS
One important conclusion from the national stakeholder meetings is that credit alone will not improve productivity unless it is combined with relevant technical proposals. The weaknesses and risks found in agriculture are not solved by financial institutions with financial products. Credit by itself does not make the wheat grow taller, and agricultural insurance does not stop the weather from destroying the crop. To have an impact on the agrifood sector, financial services must be structured to induce farmers and processors to make innovations in their operations. The key elements to innovative agricultural finance are (Jessop et al., 2012):
(i) reduced delivery costs (efficient lending methodologies, technology);
(ii) adaptation to agricultural growth patterns and cash flow cycles; and
(iii) use of value chains to ensure proper loan repayment (credit is used for the intended purpose when it results in increased productivity, which the farmer sells to the intended buyer, for a fair price allowing repayment).
Regarding the third key element, the value chain is central to nearly all agrifood finance innovations and key to risk management by banks. Credit risk is reduced by a viable sales contract and implicit technology transfer. The trigger in value chain finance is the linking of the value chain partners. Likewise, most successful examples of agricultural credit guarantees or insurance cover aim to make value chains operate smoothly. By mitigating performance and price risks, producers and buyers can efficiently collaborate in the value chain (HLPE, 2013).
FIGURE ES.8: Sources of data used for the CBAs in the 11 case studies assessed.
100%
90%
80%
70%
60%
50%
40%
30%
20%
10%
0%
International source Official data from Government Other literature Expert opinion
Total 3 VCs Total Milk Total Vegetables Total Rice
Source: Authors.

xxxii MEASURING IMPACTS AND ENABLING INVESTMENTS IN ENERGY-SMART AGRIFOOD CHAINS
Another important lesson learned from the INVESTA project is that renewable energies (RE), and in particular solar photovoltaic (PV) products at the small/pico scales, are experiencing a remarkable and unprecedented diffusion in developing countries. This stands in contrast to the donor and government-driven model of rural electrification. In sub-Saharan Africa, the traditional model of rural electrification mainly involves donor and government-supported programs. This development has been driven by an increasing number of private firms supplying solar systems to customers on a commercial basis to serve their electricity and lighting needs. Solar water pumping is one example. System suppliers take advantage of the substantial improvement in the price and efficiency of core technology components, the emergence of smart metering technologies, and the wide spread use of mobile phones and mobile payment schemes. Suppliers are therefore able to target poor customers located mainly in off-grid, rural areas through new pay-as-you-grow15 or pay-as-you-go16 business models that avoid high upfront costs (Nygaard et al., 2016). The successful products are usually designed for a developing country context.
Indeed, a number of failures in the transfer of energy technologies in the agrifood sector seems to be due to the replication of technological solutions designed in and for industrialized countries. The production of biogas from animal wastes and crop residues is an example. A modern biogas plant makes financial sense in a context where there is a reliable and modern grid which is able to receive the electricity produced and where there is a significant and constant supply of biogas feedstock. These two conditions are not common in developing countries which, conversely, are well endowed in terms of solar resources. In developing country contexts, hybrid PV-biogas commercial power plants, specifically conceived for the technical support services locally available, could perform better. However, this model is not widespread in developing countries which still struggle to replicate the European model of biogas production.
Policy recommendations
Aimed at policy makers, international finance institutions and investors, the report focused on identifying the main barriers impeding the full deployment of clean energy technologies in the case study countries, and recommends possible solutions to overcome them. Based on the analysis and conclusions presented in this report, as well as on the analysis done over the two years of implementation of the INVESTA project, the following holistic policy recommendations are provided to enable investments in energy-smart agrifood chains.
4 Pay-as-you-grow is a flexible payment structure that minimizes front-end costs when acquiring new agricultural equipment and provides the flexibility to ramp-up deployment for the new technologies or practices. It is particularly effective at allowing businesses to properly match early ramp-up usage by distributing agricultural costs more equitably across harvest periods.
5 Pay-as-you-go involves households or individuals procuring the system from a supplier by making a down payment, followed by daily, weekly or monthly payments for services that are set at affordable levels. Such an arrangement could take the form of a perpetual lease or of eventual system ownership after a defined period of time. The monthly payments are usually pre-paid and are mostly collected through a mobile payment platform.

xxxiiiMEASURING IMPACTS AND ENABLING INVESTMENTS IN ENERGY-SMART AGRIFOOD CHAINS
The recommendations are structured in five groups: “Financial versus economy returns”; “Regulatory framework”; “Mechanisms to foster investments”; “Gender equality”; and “Data availability”. The specific recommendations are directed at different target groups, some more at policy makers and donor organizations, other rather target financial institutions and private investors, or NGOs.
FINANCIAL VERSUS ECONOMIC RETURNS1. From the sustainable development perspective, it is important to assess not only
the financial attractiveness of an investment in energy technology in the agrifood chain, but also associated the co-benefits and hidden costs. This includes impacts that can take place at different stages of the value chain. The CBA methodology presented here and in FAO and GIZ (2018) is tailored to energy interventions in the agrifood chain and can help donors, impact investors and national decision makers in assessing a number of investment options in a consistent manner.
2. In national planning, establish proper baselines and well-defined and quantitative indicators, and an effective results and impact monitoring. Most countries lack reliable and up-to-date disaggregated data that allow baselines to be established and progress of energy interventions to be monitored. For measuring the performance of investments and technical assistance it is essential to improve the databases in all agrifood-related areas. Verifiable results and consistent impact indicators need to be defined, which would allow to determine the degree of achievement and draw lessons learned for future interventions.
3. When developing energy interventions or policies targeting the agrifood value chain, keep in mind potential issues related to the water-energy-food nexus and look for opportunities to de-couple them. Many interventions put additional pressure on already stressed resources. As a result, economic gains may be lost or existing water/food problems may worsen under pressure of climate change. Water and electricity tariffs that cover costs will help. Grid electricity, often subsidized and thus widely available and inexpensive, could potentially exacerbate the water problems by allowing farmers e.g. to pump large amounts of water, thus depleting ground water resources. As the electricity is cheap, it is less likely that water saving practices such as drip irrigation will be adopted. Farmers growing more dependent on cheap electricity will be hit harder when the groundwater becomes salty, wells become depleted, or the grid fails. By increasing energy efficiency, the pressure for water resources to be used for energy generation will be reduced.
4. Prioritize interventions and policies that increase resilience to natural disasters and social conflicts due to bad natural resource management. Interventions that are vulnerable to such events should be discouraged. Small and off-grid interventions are likely less affected by occurrences of extreme weather events such as storms and floods (driven by climate change), while heavy reliance on the public grid can leave populations vulnerable to social and ethnic conflicts.

xxxiv MEASURING IMPACTS AND ENABLING INVESTMENTS IN ENERGY-SMART AGRIFOOD CHAINS
REGULATORY FRAMEWORK5. Reform electricity tariffs so that they cover the real electricity production cost
(including generation, distribution, operation and maintenance and externalities). Doing so will unlock private sector investments in clean energy solutions (renewable energy, energy efficiency and rural energy access) in the agrifood sector as well as in other sectors and directly contributes to the SDGs. Also, recent trends in terms of falling prices of renewable energy should be considered in national planning.
6. When planning decentralized technology options, make sure to foster local ownership, maintenance, local repair and availability of spare parts. In addition, a saving scheme for maintenance is recommended to assure long-term maintenance. This sounds trivial but is often not sufficiently addressed. There are many examples of failed decentralized rural electrification programs and projects organized by government agencies and funded by donors. For successful, sustainable projects, local ownership is essential, e.g. in the form of cooperatives or the involvement of local communities, entrepreneurs and institutions. This can be assured by involving (and training) local businesses to provide service and spare parts.
7. Create a conducive framework for energy interventions in the agrifood chain that attracts local entrepreneurs and private investments. This can be done by reducing the regulatory and tax burden (waive import duties, sales tax, corporate tax, license obligations, etc.) for companies that clearly have a social impact (net positive co-benefits) which the government could only achieve at a higher cost. Energy technologies for agrifood are an effective ‘instrument’ to contribute to achieving the SDGs in time (for their scalability). It is likewise important for donors not to distort the market with subsidies to large agribusiness or to ‘pick winners’ through support programs.
8. Establish codes and standards for equipment and by-products to foster the development of a new market for these products which in turn can improve the financial viability of the investment in energy technology. For example, quality standards for anaerobic digestate or rice husks can help the development of local markets for these products, and thus adding value to them. Codes and standard for equipment contribute to eradicate the commercialization of low-efficiency or counterfeit equipment (e.g. batteries, solar panels).
9. Introduce environmental standards including on waste disposal and favour the use of waste for bioenergy. Such a regulation would have multiple benefits: It would safeguard the environment limiting pollution, would add value to a product that was considered a waste, and would develop a new market and its supporting industry. The EU experience in developing a bioenergy sector from agrifood waste, along with its failures and successes, could be used as example.

xxxvMEASURING IMPACTS AND ENABLING INVESTMENTS IN ENERGY-SMART AGRIFOOD CHAINS
10. Set minimum food quality standards and enforce quality checks already at an early stage of the agrifood value chain. Although the link with clean energy interventions is not straightforward, food quality standards often require value chain actors to adopt modern energy technologies (thus moving away from manual or traditional fossil fuel-based work). The milk value chain is a relevant example: Milk cooling becomes a necessary technology, especially for most rural and remote farmers, if stricter milk quality standards are requested and enforced.
11. Facilitate the administration process to obtain permits for commercial RE producing systems and grid connection. This process can be a major burden, both in terms of cost and time, especially for developers of small energy interventions.
12. Set and properly communicate national renewable energy and food quality targets specific for the agriculture or food industry sectors. They can foster the adoption of clean energy technologies. With a clear national target, public support and private resources are channeled towards a common goal.
MECHANISMS TO FOSTER INVESTMENTS13. Mainstream insurance and financing products tailored to agrifood energy
interventions. Insurance products should: • hedge against market price spikes of biomass feedstock (if a market exists).
This is applicable for example to bioenergy technologies which make use of agri-residues or food wastage; and
• protect early adoption of a technology against low yields. Early adopters of solar water pumps or innovative RE-powered equipment need to be protected against impact of extreme events (such as droughts) and be provided after-sales support by the technology provider. Bad experiences of early adoption can discourage new adopters. In agriculture, support guarantee schemes for producers should be tailored to farmers and farmer groups/cooperatives.
Financing products include concessional loans which match the specific businesses. For example, in agriculture, the loan should be spread over a sufficient number of harvests/cropping cycles to allow flexibility in case of bad seasons. Financing products should be tailored to value chain actors and take into account that smallholder farmers and processors often do not have a credit track records and collateral. New technologies such as smart meters and the wide spread use of mobile phones and mobile payment schemes can be used to provide alternative financing products17. Gender-responsive financial products should be developed and facilitated. This includes pay-as-you-go products, in partnership with financial institutions and/or international organizations18.
6 Kenya is leading the development of mobile payment systems integrated with GPS and other IT technologies. A successful example is provided by the fruit and vegetable wholesale company Twiga Foods (http://twigafoods.com/) which is revolutionizing the Nairobi market.
7 Refer to the Powering Agriculture gender guide on financial products for further details: Powering Agriculture guide on integrating gender in the financing of clean energy solutions, at https://poweringag.org/docs/guide-integrating-gender-financing-clean-solutions.

xxxvi MEASURING IMPACTS AND ENABLING INVESTMENTS IN ENERGY-SMART AGRIFOOD CHAINS
In the case of highly indebted countries, concessional debt may be a more cost-effective way than subsidies to make RE interventions attractive to developers, since it may reduce the total project support required to make the intervention viable. Moreover, governments have advantages that may enable them to provide dollar-equivalent debt subsidies more cheaply than price supports.
14. Reduce or (whenever possible) remove any direct or indirect subsidy for fossil fuels and develop government-backed financial mechanisms or preferential loans for early adopters. In the milk value chain, a price premium for quality cooled milk is an effective measure to convince early technology adopters. The support should be guaranteed for a period sufficient to recover the difference between conventional and off-grid equipment. Subsidies should be used only for specific finite interventions to generate the products, or when expansion can occur with a fixed public commitment in order to minimize market distortion. The business and development case for including agricultural finance in the portfolio of products offered to poor rural households has never been stronger.
15. Experiences of for-profit financial institutions confirm that a profitable investment in an energy technology can be developed to serve a poor rural clientele when there is:• knowledge of client needs, market and value chain dynamics;• appropriate risk management technologies; and• cost-effective delivery strategies.
In this context, win-win public-private partnerships should be prioritized as they are critical to the sustainable provision of non-financial services which complement and support agricultural finance product delivery.
16. Provide technical and financial assistance, possibly backed by international support, for micro-finance and local savings organizations, such as service and credit associations, to help them develop and market savings products for farmers and processors. This includes assistance on the most appropriate business models19.
17. Foster knowledge and education schemes, especially in rural areas. These can be summarized as follows:• Develop capacity to provide a better understanding of energy technologies and
good practices in agriculture and food processing to local financing institutes, administrative bodies, equipment providers and system developers. This includes technology demonstration to farmer groups, cooperatives and practitioner groups.
8 A number of business models have been mentioned and analysed in this report, and some are more suitable than others to specific country contexts (see section 4.3). There is clearly no one-size-fits-all solution, the suitability is influenced by the local laws, regulation and value chain.

xxxviiMEASURING IMPACTS AND ENABLING INVESTMENTS IN ENERGY-SMART AGRIFOOD CHAINS
• Build capacity of both women and men aiming to hold managerial and technical roles by liaising with professional organizations, universities and vocational training schools. The capacity building and technical assistance activities would include awareness raising of clean energy solutions, potential benefits and effective business models, particularly in rural areas. A range of activities could be foreseen ranging from promotional campaigns, including radio adverts, to demonstrations and extension officer support.
GENDER EQUALITY18. Mainstream gender considerations throughout the innovation process, including
concept development, research and development, piloting, early adoption/distribution, market growth and wide-scale adoption20. Targeting women and men makes social sense to improve their ability to work together to participate in economic opportunities, generate higher incomes, increase household food and nutrition security, and improve family health and wellbeing. Moreover, women should be empowered since ‘pull’ motivation (opportunity-based entrepreneurship) seems to be more effective than ‘push’ motivation (unemployment, job loss, etc.) to engage women (UNIDO, 2017).
19. Promote equal rights for men and women in legal and customary land law at policy, institutional and community level, empower women to secure access to land, and support women’s access to, and participation in, land initiatives. This includes the promotion of gender equitable and single-sex cooperatives by changing membership rules, such as fees, and organizational governance and structures, for example through quotas, building institutional capacity, and ensuring a supportive national policy environment21.
DATA AVAILABILITY20. Support the collection, processing, storage and appropriate sharing of data and
statistics on agriculture and the food industry in partnership with international organizations such as the FAO. International organizations can support the development of national statistics reporting processes and the dissemination and publication of data.
21. National statistical offices should ensure that the data collected are consistent with international standards. This is necessary to ensure a sound comparison of assessments (such as CBAs of energy interventions) done across countries. The SEEA-AFF22 should be considered as a reference for the combination of environmental and economic statistical data for the agriculture sector.
22. Facilitate the collection of sex-disaggregated data in agricultural sub-sectors, in the steps of agrifood value chains and throughout the adoption, use and outcomes of clean energy interventions.
9 Refer to the Powering Agriculture gender guides for further details: https://poweringag.org/resources
10 Refer to Kaaria et al. (2013) for further details.
11 For more information see: http://www.fao.org/economic/ess/environment/methodology/en/


1
FRO
M IN
TER
VEN
TIO
N-L
EVEL
TO
CO
UN
TRY
-LEV
EL A
SSES
SMEN
T
MEASURING IMPACTS AND ENABLING INVESTMENTS IN ENERGY-SMART AGRIFOOD CHAINS
1. FROM INTER VENTION-LEVEL TO COUNTRY-LEVEL ASSESSMENT
Women selling vegetables at a market in Tanzania. © GIZ / Shilpi Saxena
To meet the growing global demand for food and clean water, the global food supply system will have to be drastically modified, particularly if the goals of the Paris Climate Agreement are to be met. It is responsible for almost one quarter of total annual greenhouse gas (GHG) emissions (FAO, 2011a).
The need to improve the sustainability of food production and reduce these environmental impacts was confirmed recently by Barack Obama, former president of the United States of America. Mr Obama mentioned that, energy and climate change discussions should focus more on food production and cutting food waste, but a lack of knowledge is fuelling public resistance and [Food production] is the second leading driver of greenhouse gas emissions, second only to energy production. But we have already identified ways in which we can address this challenge. The path to a

FRO
M IN
TER
VEN
TIO
N-L
EVEL
TO
CO
UN
TRY
-LEV
EL A
SSES
SMEN
T
2 MEASURING IMPACTS AND ENABLING INVESTMENTS IN ENERGY-SMART AGRIFOOD CHAINS
sustainable food future will require unleashing the creative power of our best scientists, and engineers and entrepreneurs, backed by public and private investment, to deploy new innovations in climate-smart agriculture. Better seeds, better storage, crops that grow with less water, crops that grow in harsher climates, mobile technologies that put more agricultural data into the hands of farmers, so that they know when to plant and where to plant, what to plant and how it will sell. All these things can help us ensure that, in producing the food that we need to feed the billions of people on this planet, we’re not destroying the planet in the process. ”He also added that “A part of this is also going to be wasting less food.”.
The FAO and USAID (2015) report “Opportunities for Agri-Food Chains to become Energy-Smart”12, published under the umbrella of the international initiative “Powering Agriculture: An Energy Grand Challenge for Development (PAEGC)”, assessed three food supply chains for their energy inputs at each step along the specific value chain. From the many food value chains, those for milk, vegetables (tomatoes, beans and carrots) and rice were selected as examples to demonstrate the potential opportunities for reducing fossil fuel inputs and reducing GHG emissions. Markets for fresh, canned, paste and frozen products were assessed. Analyses of these value chains, at both large- and small-scales, identified priority stages, entry points and interventions where clean energy solutions could be introduced. Opportunities to improve energy efficiency along the value chains to reduce both energy demand and GHG emissions were also highlighted.
The financial and economic implications of introducing a range of clean energy technologies into the same three food supply value-chains were analysed in a subsequent PAEGC study: “Costs and Benefits of Clean Energy Technologies in the Milk, Vegetable and Rice Value Chains” (FAO and GIZ, 2018). A detailed cost-benefit analysis (CBA) was undertaken to evaluate technology interventions at the micro-level of individual farmers and food processors (Box 1). A methodological approach was developed to provide a sound and comprehensive CBA and compare it with a simple financial analysis to inform investors. Costs of the energy technologies at the intervention level that targeted farmers and food processors were collected and analysed. The suitability of each technology was assessed for a specific development context, the actual profitability expected, and the enabling conditions and policies needed to trigger pro-poor investments in the sector. Case studies were presented to illustrate how the introduction of a clean energy technology might add value for stakeholders. Special attention was given to pro-poor technologies and gender distribution along the selected value chains, since gender dominated segments may be correlated with investment power, target markets, and individual risk preparedness and resilience. The study highlighted the hidden environmental and socio-economic costs which are often borne by non-economic operators, for example through government support schemes such as feed-in tariffs for electricity.
12 Available online at http://www.fao.org/3/a-i5125e.pdf.

3
FRO
M IN
TER
VEN
TIO
N-L
EVEL
TO
CO
UN
TRY
-LEV
EL A
SSES
SMEN
T
MEASURING IMPACTS AND ENABLING INVESTMENTS IN ENERGY-SMART AGRIFOOD CHAINS
In this ‘Phase II’ report (Figure 1.1), the costs and benefits of energy interventions are analysed at the country level. The environmental and socio-economic impacts that may need to be adapted at this level of analysis are identified. After having assessed the impacts at the single intervention level on environmental, social and economic aspects, the technical potential of a technology was estimated for a given country using, when possible, national data on agricultural production and agrifood processing. The target audience for this report includes policy makers, financing agencies and private investors. This study identifies the main barriers impeding the full deployment of clean energy technologies, ways to possibly overcome them, and the resulting costs and benefits.
Box 1. Summary of the main steps of a cost-benefit analysis performed to assess a clean energy technology at the intervention level of a farmer or food processor.1. Identify and describe both the benchmark scenario (which normally consists
of fossil fuel-powered and/or inefficient technologies) and the post-energy intervention scenario (where the technology has been adopted). For instance, an irrigation system can be powered by a diesel pump (benchmark scenario) or by a solar photovoltaic (PV)-powered pump (post-energy intervention scenario).
2. Identify the investment costs, including capital and operating costs, and benefits. For the economic analysis, market prices are converted into economic/shadow prices to better reflect the social opportunity benefits and costs of the investment. This can be done by removing transfer payments such as taxes and subsidies, quantifying positive and negative externalities not borne by the investor(s) and, when possible, monetizing them.
3. Determine the financial and economic incremental net flows for the investment that result from comparing costs and benefits of the project with the benchmark scenario. Project performance indicators, such as financial and economic net present value (NPV), internal rate of return (IRR), benefit/cost ratio (B/C) or payback period, are then calculated by applying discounting techniques to these flows.
4. Perform a sensitivity analysis to assess the main risks and uncertainties.
For a more thorough description, please refer to FAO and GIZ (2018).
Source: FAO and GIZ (2018).

FRO
M IN
TER
VEN
TIO
N-L
EVEL
TO
CO
UN
TRY
-LEV
EL A
SSES
SMEN
T
4 MEASURING IMPACTS AND ENABLING INVESTMENTS IN ENERGY-SMART AGRIFOOD CHAINS
The rationale for enlarging the scope from the intervention level to the country level is to provide decision-makers and financial institutions with an indication of socio-economic costs and benefits related to the introduction of specific energy technologies in the milk, vegetable and rice value chains associated with investments at scale. Phase II is, therefore, a natural follow-up activity to Phase I, FAO and GIZ (2018) providing practical applications of the analysis needed to make things happen on the ground at the country level, facilitating a discussion among different stakeholders and aiming to answer the questions:
• How can specific clean energy interventions in the agrifood chain be fostered at the national level?
FIGURE 1.1. The CBA process when introducing an energy solution at I) the intervention level typically for farmers and food processors and II) the country level for policy-makers and financial institutions.
Source: Authors.
Phase 1 Phase 11intervention level Country levelM
etho
dolo
gica
lan
alys
is
App
licat
ion
bypi
lot
coun
trie
s
Methodological analysis
Cost-benefit analysis of key clean energy technologies in the three value chains
Identification of potential externatilities and natural resource impact
Local experts and policy-makers
Application of the analytical approach to selected pilot countries,complementing it with national data about cost of agricultural production, energy and equipment
Establishment of dialogues on statistical data availability and reporting
Financial institutions
Identification of ecosystem conditions to foster sustainable energy investment in the agrifood sector
Insights on appropriate delivery models and financial instruments
Policy recommendations

5
FRO
M IN
TER
VEN
TIO
N-L
EVEL
TO
CO
UN
TRY
-LEV
EL A
SSES
SMEN
T
MEASURING IMPACTS AND ENABLING INVESTMENTS IN ENERGY-SMART AGRIFOOD CHAINS
Box 2. Rationale for selecting the four case study countries• Kenya: One of the countries where FAO, in early 2015, began testing the applicability
of the System of Environmental-Economic Accounting for Agriculture (SEEA-Agri) in terms of data availability. The focus here is on energy technologies which can be introduced in the fresh vegetables value chain and in the dairy sector.
• Philippines: The choice of this country was due to good data availability. The Philippines submitted a fairly complete dataset on costs of agricultural production for the rice value chain to FAO CountryStat. Rice is an important component of the Philippines agrifood sector and widely grown elsewhere.
• Tanzania: A developing country with a dynamic dairy sector characterized by a multitude of small-scale milk producers. The focus is on pro-poor energy solutions for the milk chain which have a high potential for improving food security and welfare.
• Tunisia: The dairy value chain is targeted given its relevance to the agrifood sector of the country. Moreover, FAO is currently working in Tunisia to support national statistical offices in the measurement of ‘cost of production’ of the dairy sector.
Source: Authors.
• Which conditions that are conducive for investments should be introduced, given the specific context?
• Which factors for successful deployment have been experienced by investors and can be useful lessons for others?
For selecting the four countries as case study examples (Box 2), a detailed analysis of the value chains selected for each was undertaken to estimate the potential for the energy technology as well as to evaluate the aggregate costs and benefits of adoption. An analytical approach was developed using official national data to assess the costs of agricultural production, energy inputs and deployment of novel renewable energy or energy efficient equipment. The technologies with potential for replacing fossil with renewable energy sources or reducing energy demand in the milk value chain were considered for deployment in Kenya, Tanzania and Tunisia; in the vegetable value chain for Kenya; and in the rice value chain for the Philippines.
Data and information to perform the CBAs at country level were collected by means of desk-based research and through scope missions in each country (Philippines in September 2016, Tunisia in December 2016, Kenya in February 2017 and Tanzania in June 2017). During these missions, information on the relevant value chains, policy and regulation in each country were collected by meeting relevant public and private stakeholders from the agriculture and energy sector, as well as the finance sector13.
13 A list of the organizations and people met during the data collection missions is reported in Annex.

FRO
M IN
TER
VEN
TIO
N-L
EVEL
TO
CO
UN
TRY
-LEV
EL A
SSES
SMEN
T
6 MEASURING IMPACTS AND ENABLING INVESTMENTS IN ENERGY-SMART AGRIFOOD CHAINS
The information collected and the analysis performed in each country were discussed and validated in four national stakeholder meetings, organized to discuss the preliminary finding with national actors from the public, private and financial sector.
The findings show how to assess the costs and benefits of different investment options which could be deployed in the agrifood sector in the selected food value chains, using the four countries as case studies. The set of indicators presented in FAO and GIZ (2018) for evaluating the environmental and social impacts of selected technologies was modified and adapted for this macro-analysis at the country level (Chapter 2). The details of the financial and economic CBAs undertaken in the four case study countries are outlined in Chapter 3. Instruments to overcome barriers to deployment are then discussed in Chapter 4, followed by the lessons learned from the case studies and the INVESTA project at large (Chapter 5).
Guidelines on supporting interventions to spur investments were developed for the specific agrifood technologies under the specific situations for each country, allowing to address the following questions:
• What measures should be taken to ensure that farmers/processors can adopt the energy solutions?
• In what clean energy technologies should aid agencies, the development community, and national governments invest for a given country context?
The dairy value chain is highly relevant to the agricultural sector in many countries. © GIZ/Wohlmann

7
FRO
M IN
TER
VEN
TIO
N-L
EVEL
TO
CO
UN
TRY
-LEV
EL A
SSES
SMEN
T
MEASURING IMPACTS AND ENABLING INVESTMENTS IN ENERGY-SMART AGRIFOOD CHAINS
As a result of the analysis, a series of policy recommendations are provided (chapter 6 and an additional series of Policy Briefs) to encourage reasonable government actions that would initiate and foster a rural economy support system based on the introduction of clean energy solutions for agrifood chains. Insights are given on the appropriate delivery models that can be adopted by financing institutions or governments.
Overall, the outcomes of this study as reported here, will serve to assist public and private financing institutions to better target their interventions in clean energy technologies along the food chain. As a result of identifying the optimum investment options for a specific context, enabling policies can be implemented to foster the adoption of clean energy technologies throughout the agrifood sector.


9MEASURING IMPACTS AND ENABLING INVESTMENTS IN ENERGY-SMART AGRIFOOD CHAINS
MET
HO
DO
LOG
Y F
OR
A C
OST
-BEN
EFIT
AN
ALY
SIS
AT
CO
UN
TRY
LEV
EL
2. METHODOLOGY FOR A COST-BENEFIT ANALYSIS AT COUNTRY LEVEL
Gender-sensitive value chain analysis measures the impact of introducing clean energy solutions into the agrifood value chain. © GIZ/Folke Kayser, Ghana
The cost-benefit analysis was applied to the four case study countries prioritizing the use of national data on the costs of agricultural production, energy and equipment. A workshop was held in each country to outline the study and help gain access to further data directly from national authorities, though much of the agricultural data was derived from literature, FAOSTAT14 and CountrySTAT 15 databases using official data already reported by the countries.
14 For more information see http://www.fao.org/faostat/en/#home
15 For more information see http://www.fao.org/in-action/countrystat/en/

10 MEASURING IMPACTS AND ENABLING INVESTMENTS IN ENERGY-SMART AGRIFOOD CHAINS
MET
HO
DO
LOG
Y F
OR
A C
OST
-BEN
EFIT
AN
ALY
SIS
AT
CO
UN
TRY
LEV
EL
Assessing the potential to deploy a clean energy technology requires an analysis of its specific characteristics and of the influence of any restrictions with respect to natural and climatic parameters, geographical and physical locations, and technical limitations (FAO, 2017a). To estimate the technical potential of an agrifood energy intervention, the value chain characteristics need to be taken into consideration (Figure 2.1). These include gender roles, distribution and size of agricultural farms and processing units, and access and availability of inputs, resources and technologies. For instance, a detailed analysis of the energy system of a country is usually required to assess the economic attractiveness of an intervention since it depends upon the availability of access to the conventional electricity grid, its emission factor depending on the mix of generation plants, and any distributed fossil fuel heat or power alternatives. Data on the number of farms/processing units with access to the grid is fundamental to estimate the potential for off-grid renewable energy technologies to replace fossil fuel-powered systems.
If the intervention is targeting, for example, milk processing, it is important to collect data about the current number and type of milk processors, the amount of milk which is processed and the amount which is available but not processed for different reasons. For example, to estimate the technical potential of off-grid, biogas domestic milk chillers (BDMCs) for a country would require data on the size of all dairy farms, their distribution, and present or future access to the grid. The technical potential would be represented by the number of farms with 3 to 5 zero-grazing cows located in rural areas with no access to the grid and/or a diesel generator. If a case study scenario is employed, but the country situation and data differ significantly from it, the assumptions used will need to be modified to become more realistic.
The real potential of a technology at the country level depends on several social, environmental, financial and institutional factors and barriers. These were described during the feasibility analysis in Phase I report (FAO and GIZ, 2018) and also discussed with national stakeholders when working in the case study countries. To estimate the real potential of a clean energy intervention is complex and therefore challenging. The recommended approach is as follows:
1. Use existing literature to find studies that have estimated the socio-economic (real) potential of a specific technology by considering existing environmental, economic and social constraints.
2. Alternatively, estimate the economic potential and the attractiveness of a typical energy intervention, compared to business-as-usual. This information can be complemented by expert opinion to estimate the real potential by focussing on the economic attractiveness of the new technology compared to the incumbent technology.
3. Where limited time, data and resources necessitate a simpler approach, an alternative could be to undertake a rough CBA by basing the analysis on an estimate of the technical potential for the uptake of a technology. A ‘typical’ plant type and size would be assumed and the number of possible plants estimated, allowing for any constraints of available resources in a country, feedstocks, etc. The total impact would be proportional to the impact of one single plant multiplied by the assumed total number of plants. This would be a static (non-dynamic) analysis

11MEASURING IMPACTS AND ENABLING INVESTMENTS IN ENERGY-SMART AGRIFOOD CHAINS
MET
HO
DO
LOG
Y F
OR
A C
OST
-BEN
EFIT
AN
ALY
SIS
AT
CO
UN
TRY
LEV
EL
which would overlook other effects that could be triggered by the development of the technology at scale, for example, it would not consider what could happen to, for example, feedstock price which would probably increase assuming it is a finite resource. Hence, such a rough CBA is not suitable for investment planning.
After having estimated the potential for each technology in selected value chains and countries, aggregate financial investment costs can be derived from the CBA analysis by aggregating intervention costs according to the calculated technical potential. For instance, national cost and benefits of a milk chiller in a country will include the financial flows calculated from a case study multiplied by the estimated number of dairy farms that could adopt the technology.
For all externalities that are too time-consuming or would require too many assumptions to be monetized, a set of impact indicators for environmental and
FIGURE 2.1. Connection between the technical potential of a clean energy technology and the value chain characteristics.
Value chain characteristics
Technology characteristics
Technical potential of a clean energy technology
Access and availability
of inputs andrescources
Distribution and size of agricultural farms/processing
units
Source: Authors.

12 MEASURING IMPACTS AND ENABLING INVESTMENTS IN ENERGY-SMART AGRIFOOD CHAINS
MET
HO
DO
LOG
Y F
OR
A C
OST
-BEN
EFIT
AN
ALY
SIS
AT
CO
UN
TRY
LEV
EL
socio-economic criteria can be applied along the lines of those indicators used for the CBA of a single intervention (Box 1). However, these would need some adaptation since there may be impacts that become relevant at scale, and not at the level of the single intervention. For example, fossil fuel saved is relevant at scale since it can impact the balance of payment or energy security of a country. However, it is not relevant from the perspective of a farmer or food processor who is more likely to be interested in any financial benefit due to avoided fossil fuel purchases or in any impacts on household income. Likewise, at scale, the impact of reduced indoor air pollution on health becomes relevant. In order to make the CBA useful for national policy-makers in assessing non-monetized impacts, it should be understood that governments have different interests than private investors. The environmental and socio-economic indicators for the country-level analysis are presented in the next section.
The approach suggested (Figure 2.2) is simple and practical and therefore suitable for a rapid appraisal. It moves from the definition of a ‘typical’ energy intervention for a country (e.g. a single type and size of cold storage system) and, on the basis of the technical potential, estimates the monetized and non-monetized impacts at scale.
FIGURE 2.2. Moving from assessing impacts of clean energy interventions at intervention level (Phase I) to impacts at country level (Phase II).
Identify appropriate clean energy
intervention(s) in a selected
agrifood chain
Step
1
Step
2
Step
3
Step
4
Assess impacts of the technology at
the intervention level
Estimate the technological potential for the energy
intervention for the country in
question
Estimate potential costs
and benefits from adopting the
technology at the country level
Note: Steps 1 and 2 are described in detail in FAO and GIZ, 2018.
Source: Authors.
2.1 GENDER-SENSITIVE VALUE CHAIN APPROACHThe division of labour between genders in many agrifood contexts is unequal. This frequently results in women’s activities being overlooked or underestimated in conventional “gender-blind” value chain analyses (FAO, 2016a). It is therefore important to understand the primary aspects of women’s economic empowerment (WEE) in the context of agrifood value chain development. The two main interrelated dimensions of WEE are (FAO, 2016a):

13MEASURING IMPACTS AND ENABLING INVESTMENTS IN ENERGY-SMART AGRIFOOD CHAINS
MET
HO
DO
LOG
Y F
OR
A C
OST
-BEN
EFIT
AN
ALY
SIS
AT
CO
UN
TRY
LEV
EL
Box 3. Guiding questions for gender-sensitive value chain mapping.A. To map the role of women and men in households, farming and value chains
1. What is the typical role of women and men in rural households? In which agricultural activities are they involved and to what extent?
2. What is the typical role of women and men in the given value chain (inputs, production, transport, storage, handling and processing)?
3. Are there particular activities that are mainly or exclusively done by women or men? If yes, which ones and why? Consider access to productive assets and services.
4. Are there relevant producer associations functioning? What are the rates of membership and participation for women and men?
5. What are women’s and men’s sources of income and who controls this income? Is the household income pooled?
6. How much do women and men respectively contribute to the household income in the value chains under analysis?
7. Who are the main decision-makers at home, on the farm, at work and in associations?
8. Are there any outstanding issues on women’s and men’s power and agency (capabilities, self-confidence, etc.) in relation to rural lives and the value chain?
• ‘Access to productive resources’ relates to assets (such as land, equipment and networks); agricultural services (such as training and information, technology, inputs); and financial services.
• ‘Power and agency’ concerns capabilities (including an individual’s level of knowledge, skills and experience plus all other factors that influence that person’s freedom to decide on his or her potential); self-confidence; and decision-making power (FAO, 2016a).
These main dimensions of WEE are included in gender-sensitive value chain mapping and analysis in order to make women’s work and participation more visible. Gender-sensitive value chain analysis goes one step further, using indicators and gender-disaggregated data to measure the impact of introducing clean energy solutions into the agrifood value chain.For this reason, several social indicators in the CBA were measured using gender-disaggregated data whenever possible. These were health risks due to indoor air pollution, access to energy, household income, time saving and employment.
Key questions help to identify underlying gender issues in value chain development (Box 3). For instance, in the case of a milk value chain, the guiding questions identify the activities typically performed by women (feeding the cows, milking, nursing the cows) vis-à-vis those usually done by men (feed purchasing, milk selling, collection and

14 MEASURING IMPACTS AND ENABLING INVESTMENTS IN ENERGY-SMART AGRIFOOD CHAINS
MET
HO
DO
LOG
Y F
OR
A C
OST
-BEN
EFIT
AN
ALY
SIS
AT
CO
UN
TRY
LEV
EL
transportation). The questions also guide the collection of sex-disaggregated data for the social indicators to measure the gendered impact of clean energy solutions in value chains.
Gender-sensitive mapping and analysis (Figure 2.3) identifies the roles and main activities of men and women in a given value chain, the activities that would be influenced by a given energy intervention, and the gender impact of this intervention. For instance, if a milk cooling facility allows a reduction from three to two milkings per day, the time spent on this activity would be reduced. It would therefore have a positive impact on the time saved by women. Where milk is traditionally sold by men, the impact of increased household income from more milk reaching the collection centre may benefit men more than women. On the contrary, if the milk cooling technology reduces the time spent transporting the milk to milk collection centers (MCCs) by having one trip per day instead of two, and this is a remunerated activity performed by men, it could have a negative impact on men’s employment.
B. To analyse the impact of clean energy interventions in a value chain on women and men
9. Have there been any changes in the roles and activities of women and men in the value chain and/or at home?
10. Has there been a change in the exposure of women, men and children to household air pollution and to what extent?
11. Have women and men gained access to modern energy, along the value chain or at home? If so, how do they use this energy (for which activities)? Do these activities add to the household income?
12. Have women and men experienced a change in the type and volume of income generated?
13. Is there any change in the time spent by women and men performing the activities affected by the energy intervention? How has the time saved or lost affected other activities? Are these activities typically remunerated?
14. Have women and men experienced an increase or decrease in job opportunities? If so, with regard to which activities? What is the nature of the jobs concerned – skilled/unskilled, part-time/full-time, temporary/permanent?
15. Has the membership and participation in producer associations of women and men changed? If so, in how far?
16. Is there any change regarding decision-making at home, on the farm, at work and in associations?
17. Are there any changes regarding issues on women’s and men’s power and agency (capabilities, self-confidence, etc.)?
Source: Kuipers, 2017.

15MEASURING IMPACTS AND ENABLING INVESTMENTS IN ENERGY-SMART AGRIFOOD CHAINS
MET
HO
DO
LOG
Y F
OR
A C
OST
-BEN
EFIT
AN
ALY
SIS
AT
CO
UN
TRY
LEV
EL
2.2 IMPACT INDICATORS FOR COUNTRY-LEVEL ASSESSMENT In this section, the set of impact indicators is outlined. The indicators detailed for the intervention level of energy technologies in FAO and GIZ (2018) were adopted for the country-level assessment.
Impact indicators used for an assessment at intervention level may not be suitable for country-level assessment for three main reasons:
1. The impact measured may not be relevant for decision-makers. For instance, while indoor air pollution impacts of a technology are not relevant or easily measurable at the macro level, the related health expenses are relevant for decision-makers. Therefore, indoor air pollution previously considered for its environmental impact at the intervention level is now considered a socio-economic factor (health risk), underlining the connection between different sustainability aspects.
2. The impact can be measured at intervention level but cannot easily be estimated at country level. This is true for most quality indicators. For instance, impacts on soil and water quality can no longer be quantified since measurements at the intervention level cannot be easily aggregated. Soil quality and water quality criteria,
FIGURE 2.3. Example of traditional roles of men and women in a milk value chain and impacts of introducing a clean energy technology.
Inputs• Feeding the cows• Routine animal
health• Veterinary services• Insemination services• Feed purchasing
Production• Milking• Nursing the cows • Milk selling
Transport & Collection• Collection• Transport
Storage & Handling• Initial milk
processing (home-based) and storage
Processing
• Formal processor
Time saving
Household income
Health risk due to indoor air pollution
Access to energy
Employment
Legend: Size of the men/women icons indicates the extent of their participation in each step of the chain. Dark green boxes: Steps of the value chain affected by the introduction of the technology. Ovals: Activities affected.
Orange font: Activities usually performed by women; Blue font: Activities typically done by men. Plus sign: Positive impact indicators affected; Minus sign: Negative impact indicators affected. Orange sign: Impact is mostly on women; Blue sign: Impact is mainly on men.
Source: Authors.

16 MEASURING IMPACTS AND ENABLING INVESTMENTS IN ENERGY-SMART AGRIFOOD CHAINS
MET
HO
DO
LOG
Y F
OR
A C
OST
-BEN
EFIT
AN
ALY
SIS
AT
CO
UN
TRY
LEV
EL
although very important, are impossible to be measured since the impacts of interventions on these criteria are very intervention- and site-specific. They were therefore excluded from the country-level CBA.
3. Other indicators should be introduced that are relevant at scale but not at intervention level. For instance, energy security may be relevant when there are national policies or targets.
In summary, the indicators not measured at country level are soil quality, indoor air pollution, and water quality, whereas health risk due to indoor pollution and fossil fuel consumption are introduced as new country-level indicators to measure the impacts that cannot be monetized.
The description of each technology makes constant reference to the indicators developed for the intervention level and cannot be read independently from them. Details regarding the indicators for intervention level, as well as regarding the relevance of the indicators to sustainability (and the SDGs), can be found in FAO and GIZ (2018).
2.2.1 ENVIRONMENTAL IMPACTS
1. FERTILIZER USE
Indicator description: Change in the amount of chemical fertilizer applied; Unit of measurement: kg of nutrient; Directionality: The impact is positive if the indicator decreases; Relevance to sustainability and method: see FAO and GIZ, 2018; Method and limitations: see FAO and GIZ, 2018.
2. WATER USE AND EFFICIENCY
Indicator description: Amount of water used i) in absolute terms and ii) per quantity of output; Unit of measurement: (i) l and (ii) l/kg of output; Directionality: The impact is positive if the indicator decreases; Relevance to sustainability and method: see FAO and GIZ, 201; Method and limitations: The measurement of water use and of blue, green and grey water footprints are very site-specific. Therefore, unlike for the intervention-level indicator, a differentiation between blue, green and grey water is not recommended.

17MEASURING IMPACTS AND ENABLING INVESTMENTS IN ENERGY-SMART AGRIFOOD CHAINS
MET
HO
DO
LOG
Y F
OR
A C
OST
-BEN
EFIT
AN
ALY
SIS
AT
CO
UN
TRY
LEV
EL
3. FOOD LOSS
Indicator description: Amount of food loss avoided as a direct consequence of the energy intervention; Unit of measurement: kg or litres of food or agricultural products; Directionality: The impact is positive if the indicator increases; Relevance to sustainability and method: see FAO and GIZ, 2018; Method and limitations: see FAO and GIZ, 2018.
4. LAND REQUIREMENT
Indicator description: Area of productive land converted as a direct consequence of the energy intervention; Unit of measurement: Hectares; Directionality: The impact is negative if the indicator increases; Relevance to sustainability and method: see FAO and GIZ, 2018; Method and limitations: While land requirement depends mainly on the size of the intervention (e.g. the area occupied by a biogas plant), the amount of land converted depends on the local situation (e.g. land converted to energy crop production to feed the biogas plant). Hence this is difficult to estimate accurately at scale.
5. GREENHOUSE GAS EMISSIONS
Indicator description: Change in the absolute amount of greenhouse gases (GHGs) emitted at national level as a result of the intervention; Unit of measurement: kg of CO2eq; Directionality: The impact is negative if the indicator increases; Relevance to sustainability and method: see FAO and GIZ, 2018; Method and limitations: This indicator does not prescribe a full lifecycle assessment (LCA) but it simply measures the difference in GHG emissions before and after the intervention. GHG emissions adopting an LCA approach could show a significantly different outcome.
2.2.2 SOCIO-ECONOMIC IMPACTS
6. HEALTH RISK DUE TO INDOOR AIR POLLUTION
Indicator description: Change in the number of people exposed to household air pollution (HAP) due to the energy intervention, disaggregated by gender and age; Unit of measurement: Absolut number of people; Directionality: If the indicator decreases the impact is positive; Relevance to sustainability: Globally, 4.3 million deaths were attributable to HAP in 2012, almost all in low and middle-income countries (WHO, 2014b). The mortality

18 MEASURING IMPACTS AND ENABLING INVESTMENTS IN ENERGY-SMART AGRIFOOD CHAINS
MET
HO
DO
LOG
Y F
OR
A C
OST
-BEN
EFIT
AN
ALY
SIS
AT
CO
UN
TRY
LEV
EL
attributable to pollution resulting from combustion of solid fuels for cooking and heating can be expressed as number of deaths or death rates calculated by dividing the number of deaths by the total population.
Exposure to smoke from incomplete combustion of solid fuels is linked with a range of conditions including acute and chronic respiratory diseases and cardiovascular diseases (WHO, 2014b). These include:• acute lower respiratory infections in young children under 5 years;• chronic obstructive pulmonary disease (COPD) in adults above 25 years; • lung cancer in adults above 25 years; • ischaemic heart disease (IHD) in adults above 25 years; and• cerebrovascular diseases (stroke) in adults above 25 years.
Energy interventions that reduce the use of solid fuels can significantly reduce mortality by reducing exposure to risk. Moreover, energy technologies can reduce health hazards associated with the collection, transportation and use of fuelwood, charcoal and kerosene, such as bruising, headache, neck ache, back ache, knee problems, poisoning, burns, encounters with wild animals and snakes, in addition to risks of rape and personal attacks (FAO and GIZ, 2018);
Method and limitations: The burden of disease attributable to HAP is estimated by the World Health Organization (WHO) based on comparable risk assessment methods (Ezzati et al., 2002) and methods developed by the Institute for Health Metrics and Evaluation, and expert groups for the Global Burden of Disease 2010 study (Lim et al., 2012; Smith et al., 2014; WHO, 2014a). The percentage of the population exposed to HAP is provided by country, and relative risks were calculated separately for men, women and children.
Burden of disease is calculated by first combining information on the risk of a disease resulting from exposure, with information on the percentage, of people using solid fuels. This allows the calculation of the ‘population attributable fraction’ (PAF), which is the fraction of disease seen in a given population that can be attributed to the exposure, in this case solid fuel use (WHO, 2014a). Applying this fraction to the total burden of disease (e.g. child pneumonia expressed as deaths or disability-adjusted life years (DALYs)), gives the total number that results from the use of solid fuels. The Global Health Observatory data provides country data on the mortality from household air pollution.
The energy intervention can reduce the PAF by reducing exposure, for example, the percentage of people using solid fuels. Therefore, information on the total number of people than can avoid solid fuel usage as a result of introducing an energy technology is an important indication of impact on health. This number can then be divided by the total national population and compared with the previous percentage of the population using solid fuels for cooking as calculated by the World Health Organization (WHO, 2015a) according to methods described in Bonjour et al. (2013).

19MEASURING IMPACTS AND ENABLING INVESTMENTS IN ENERGY-SMART AGRIFOOD CHAINS
MET
HO
DO
LOG
Y F
OR
A C
OST
-BEN
EFIT
AN
ALY
SIS
AT
CO
UN
TRY
LEV
EL
7. FOSSIL FUEL CONSUMPTION
Indicator description: Change in national consumption of fossil fuels due to the energy intervention by type of fuel;
Unit of measurement: Primary energy (Joules);
Directionality: The impact is positive if the indicator decreases;
Relevance to sustainability: Energy interventions along the food chain can reduce fossil fuel consumption. Using less fossil fuels translates into less GHG emission released (an impact already covered by a separate indicator). For most countries that import fossil fuels, reducing energy demand would increase energy security due to lower geopolitical risks and resource depletion over a longer term. This indicator is relevant to the latter aspect of sustainability. It aims to measure an impact on natural resource consumption of fossil fuels as a proxy for energy security (a socio-economic impact);
Method and limitations: The amount of end-use energy displaced by an energy intervention can be foreseen ex-ante knowing the technical specifications and the expected use of a facility, or ex-post through direct measurement. Since this indicator aims at measuring the actual natural resource used, it should consider the change in ‘primary energy’ associated with the end-use energy avoided due to the energy intervention. As such, if an energy intervention reduces the amount of diesel, petrol or electricity consumed (end-use energy) that was produced from a certain amount of oil, coal and natural gas (primary energy), the indicator will measure the total primary energy avoided.
While the impact on end-use energy consumption is a characteristic of the specific energy intervention, the corresponding primary energy is dependent on a country’s energy balance. The Energy Balances16 provided by the International Energy Agency (IEA), or other national sources can be used to estimate the primary energy consumed. For electricity, it is important to know the national grid electricity mix and the consequent emissions factor which can be obtained from the same sources. The IEA Energy Statistics Manual17 and its technical conversion coefficients18 can be used as a reference for mass or volume to energy conversions as appropriate. IEA reports conversion factors to estimate the primary energy requirement on the basis of the final energy carrier consumed. The main limitation of this indicator is associated with the poor availability of detailed country balance sheets that link end-use energy consumption with total primary energy supply.
16 https://www.iea.org/Sankey/
17 Available online at http://www.iea.org/publications/freepublications/publication/energy-statistics-manual.html
18 In this report we assume the net calorific (lower heat) value of industrial diesel to be 39.6 MJ/litre, and of crude oil to be 38.7 MJ/litre (http://w.astro.berkeley.edu/~wright/fuel_energy.html); conversion factors of 41,868 GJ/toe and 0.086 Mtoe/TWh (https://webstore.iea.org/energy-statistics-manual); 50% of gasoline and 25% diesel are produced per unit of crude oil refined (http://www.petroleum.co.uk/refining and https://www.eia.gov/tools/faqs/faq.php?id=327&t=9).

20 MEASURING IMPACTS AND ENABLING INVESTMENTS IN ENERGY-SMART AGRIFOOD CHAINS
MET
HO
DO
LOG
Y F
OR
A C
OST
-BEN
EFIT
AN
ALY
SIS
AT
CO
UN
TRY
LEV
EL
8. ACCESS TO ENERGY
Indicator description: Number of people affected by a change in access to modern energy, disaggregated by gender;
Unit of measurement: Absolute number of people;
Directionality: The impact is positive if the indicator increases;
Relevance to sustainability: see FAO and GIZ, 2018;
Method and limitations: At the national level, this indicator gives the number of people that are affected by a specific energy intervention with any impact on access to modern energy services, including modern bioenergy that decreases demand for traditional biomass from fuelwood and animal dung. Building upon the definition of the Global Bioenergy Partnership (FAO, 2011c), a modern bioenergy service can be defined as a modern energy service that relies on biomass. It includes:
• usage of improved cookstoves that i) make an energy efficient use of the biomass resource (considering the energy stored in the biomass resource and the energy actually made available for the specific service), and ii) do not release harmful flue gases; or at least the flue gases do not have a negative direct impact on human health;
Access to clean energy can reduce greenhouse gas emissions (GHG) in agriculture substantially. © Jeffrey M. Walcott/Futurepump

21MEASURING IMPACTS AND ENABLING INVESTMENTS IN ENERGY-SMART AGRIFOOD CHAINS
MET
HO
DO
LOG
Y F
OR
A C
OST
-BEN
EFIT
AN
ALY
SIS
AT
CO
UN
TRY
LEV
EL
• electricity delivered to the final user through a grid from biomass power plants; district heating; district cooling; improved cookstoves (including such stoves used for heating) at the household and business level;
• stand-alone or grid-connected generation systems for household or businesses;
• domestic and industrial biomass heating as well as cooling systems;
• biomass-powered machinery for agricultural activities or businesses;
• biofuel to power tractors and other vehicles as well as grinding and milling machinery.
Modern energy services do not include biomass used for cooking or heating purposes in open stoves or fires with no chimney or hood or any other energy system that releases indoors flue gases dangerous for human health, irrespective of the type of feedstock or biomass employed.
The indicator measures the number of people affected by a change in access to modern energy as a direct result of the energy intervention. For example, if an energy intervention allows a shift from firewood to PV electricity used to dry food, and surplus electricity produced by the system can power two households with typically five people each, such an intervention would improve access to modern energy for ten people.
Assessing this indicator requires knowledge of the energy system in the country, such as the number of farms/processing units with access to grid or to other energy sources in order to define a baseline for the benchmark. Data and information needed for this may be non-existent or unreliable. This would limit the applicability of the indicator. Expert opinion can be used to complement missing data to define a proper benchmark.
9. HOUSEHOLD INCOME
Indicator description: i) Number of people affected by an energy intervention and ii) increased income as a result of an energy intervention, disaggregated by gender if possible;
Measurement unit: i) Absolute number of people and ii) US$ or local currency (per household);
Directionality: The impact is positive if the indicator increases; Relevance to sustainability: see FAO and GIZ, 2018;
Method and limitations: The method and limitations of this indicator are similar to those outlined in FAO and GIZ, 2018. However, at the intervention level, the householders’ income was calculated as income generation due to change in wages, expenditure reduction, increase in net income from sale, barter and/or own consumption, or avoided waste for the household. At the country level scale, the

22 MEASURING IMPACTS AND ENABLING INVESTMENTS IN ENERGY-SMART AGRIFOOD CHAINS
MET
HO
DO
LOG
Y F
OR
A C
OST
-BEN
EFIT
AN
ALY
SIS
AT
CO
UN
TRY
LEV
EL
indicator also attempts to measure the number of people whose income is affected by the energy intervention. This additional sub-indicator shows the distribution of benefits among individuals. It includes, whenever possible, qualitative information about gender roles and the distribution of power inside the households19. The measurement of this indicator can be very context specific as household characteristics may vary significantly within a country.
10. TIME SAVING
Indicator description: Change in time spent in performing unpaid agricultural
and/or household activities, disaggregated by gender if possible;
Unit of measurement: Hours per week or per year;
Directionality: The impact is positive if the indicator decreases;
Relevance to sustainability and method: see FAO and GIZ, 2018;
Method and limitations: The main limitation of this indicator is associated with the gender disaggregation since this information is not always available and it may need to be complemented by existing social studies in order to get a reasonable estimate of the male/female distribution of agriculture and household activities which usually vary significantly within a country.
11. EMPLOYMENT
Indicator description: Net jobs created along the agrifood value chain, and shares of (i) skilled or unskilled jobs, and of (ii) temporary or permanent, part-time or full-time jobs; all disaggregated by gender if possible;
Unit of measurement: Absolute number of net jobs created;
Directionality: The impact is positive if net jobs are created. The impact is more positive if the jobs created are skilled, permanent and full-time. Equitable employment of women is a positive impact;
Relevance to sustainability and method: see FAO and GIZ, 2018.
Method and limitations: Conventionally, self-employed farmers and family workers are included in the count of jobs created. The repartition of working time for informal and family work can be difficult to assess, especially because this can change significantly among seasons and across the country due to different local habits (see also FAO and GIZ, 2018).
19 The indicator measured alone as ‘increased income as a result of an energy intervention’, without information on the specific value chain, would collect information on the quantitative changes in income but would not be able to capture the impact on women’s power and agency to manage it.

23MEASURING IMPACTS AND ENABLING INVESTMENTS IN ENERGY-SMART AGRIFOOD CHAINS
MET
HO
DO
LOG
Y F
OR
A C
OST
-BEN
EFIT
AN
ALY
SIS
AT
CO
UN
TRY
LEV
EL
2.2.3 RELEVANCE OF IMPACT INDICATORS FOR SUSTAINABLE DEVELOPMENT GOALS
The differences between the set of indicators suggested for assessing non-financial and non-monetized impacts both at intervention level (FAO and GIZ, 2018) and at country level are summarised in Table 2.1, along with the relevant SDG targets. The Table shows that the indicators have a direct link with several of the 17 Sustainable Development Goals, in particular:
• Zero hunger (SDG 2)
• Good health and well-being (SDG 3)
• Gender equality (SDG 5)
• Clean water and sanitation (SDG 6)
• Affordable and clean energy (SDG 7)
• Decent work and economic growth (SDG 8)
• Responsible consumption and production (SDG 12)
• Climate action (SDG 13)
• Life on land (SDG 15).

24 MEASURING IMPACTS AND ENABLING INVESTMENTS IN ENERGY-SMART AGRIFOOD CHAINS
MET
HO
DO
LOG
Y F
OR
A C
OST
-BEN
EFIT
AN
ALY
SIS
AT
CO
UN
TRY
LEV
EL
TABLE 2.1. Summary of indicators for the CBA assessment at intervention level, at country level, and related SDG targets.
Indicators for intervention-level assessment
Indicators for country-level assessment
SDG targets linked to the indicators for country-level assessment
Envi
ronm
enta
l im
pact
s
Soil quality – –
Fertilizer use and efficiency Fertilizer use Target 12.4; Target 15.5
Indoor air pollution – –
Water use and efficiency Water use and efficiency Target 6.4; Target 12.2
Water quality – –
Food loss Food loss Target 2.1, 2.2; Target 12.2
Land requirement Land requirement Target 15.5
GHG emission GHG emission Target 13.2
Soci
o-e
cono
mic
impa
cts Time saving Time saving Target 2.3; Target 5.8; Target 8.2
Employment Employment Target 5.8; Target 8.3
Access to energy Access to energy Target 7.1
Household income Household income Target 2.3; Target 8.2
–Health risk due to indoor air pollution
Target 3.9
– Fossil fuel consumption Target 7.2; Target 12.2
Note: The SDG targets are described in FAO and GIZ (2018) with the exception of Target 7.2 (by 2030, increase substantially the share of renewable energy in the global energy mix).
Source: Authors.
2.3 LIMITATIONS OF THE METHODOLOGYThe errors associated with undertaking a CBA at the country level can be significant due to the possible errors when assessing the externalities associated with a single intervention, plus any errors associated with assessing the technical potential which can be significantly different from the real potential due to the following:
• The vast diffusion of a technology at scale can generate competition for natural and socio-economic resources which can be captured only by a dynamic assessment. Some resources may be limited which would in turn lead to a significant spike in their market price, resulting in the energy intervention not being viable. An example could be those bioenergy technologies which make use of low-value feedstock such as crop residues. The market price of residues can rise from zero (or negative market values where their disposal entails a cost) to become unaffordable.
• Energy prices can vary significantly over time. A decrease in the electricity or oil price can result in a non-viable energy intervention, hence significantly reducing its real potential.

25MEASURING IMPACTS AND ENABLING INVESTMENTS IN ENERGY-SMART AGRIFOOD CHAINS
MET
HO
DO
LOG
Y F
OR
A C
OST
-BEN
EFIT
AN
ALY
SIS
AT
CO
UN
TRY
LEV
EL
• Social effects such as the ‘rebound effect’ resulting from the tendency to overuse those energy services which are cheaper or even “free”, such as electricity from solar PV plants. This could in turn overexploit natural resources and act as a limit to technology uptake. A classic example is solar pumping of water. Introducing a large number of solar pumps in a water-scarce area as a replacement for fossil fuel-powered pumps can result in farmers pumping more water from underground aquifers, quickly leading to additional water scarcity. If not properly managed, this can decrease the real potential of such an energy intervention.
• Gender issues in rural livelihoods and in a given agrifood value chain can vary significantly within a country, region or even community. Making generalisations about gender roles and responsibilities in an agrifood value chain at the national level, the costs and benefits of a clean-energy technology in relation to its impact on gender equality can be misleading.
• Large energy interventions in one sector such as the food sector can have a negative impact on other sectors of society such as water or energy. In fact, while the impact on just one sector of the water-energy-food nexus may be positive, there may be other factors that are limiting. For example, the development of cold storage for food may be limited by the electricity generation capacity of the sector or by competing demands for electricity.
• Not all energy interventions can reach their technical potential at the same time. Some are mutually exclusive and may lead to increased competition and overlaps of impacts among technologies. For example, the potential use of organic residues (manure) from dairy farms for either biogas production or composting leads to competition for the same feedstock. Similarly, biogas electricity generation, energy efficiency measures, and solar cold storage systems aim at reducing the demand for the same electricity, thus reducing their real potential if their deployment is pursued at the same time.
A thorough cost-benefit analysis is needed to justify significant investments at country level. However, even a relatively simple analysis, like the one devised in this study and outlined in the following Chapter 3, will be sufficient to provide broad guidance for policy decision-makers, financing agencies and investors, and to offer general recommendations on the costs and benefits of different types of clean energy interventions in the milk, vegetable and rice value chains.

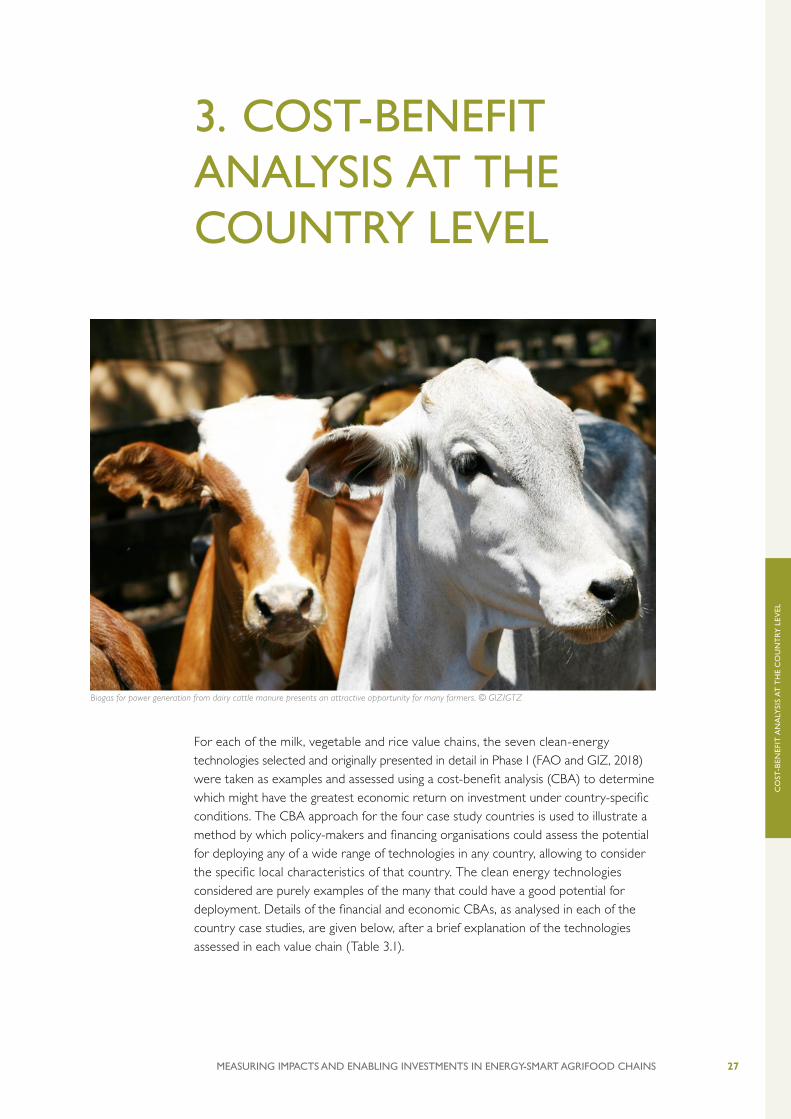
27MEASURING IMPACTS AND ENABLING INVESTMENTS IN ENERGY-SMART AGRIFOOD CHAINS
CO
ST-B
ENEF
IT A
NA
LYSI
S A
T T
HE
CO
UN
TRY
LEV
EL
3. COST-BENEFIT ANALYSIS AT THE COUNTRY LEVEL
For each of the milk, vegetable and rice value chains, the seven clean-energy technologies selected and originally presented in detail in Phase I (FAO and GIZ, 2018) were taken as examples and assessed using a cost-benefit analysis (CBA) to determine which might have the greatest economic return on investment under country-specific conditions. The CBA approach for the four case study countries is used to illustrate a method by which policy-makers and financing organisations could assess the potential for deploying any of a wide range of technologies in any country, allowing to consider the specific local characteristics of that country. The clean energy technologies considered are purely examples of the many that could have a good potential for deployment. Details of the financial and economic CBAs, as analysed in each of the country case studies, are given below, after a brief explanation of the technologies assessed in each value chain (Table 3.1).
Biogas for power generation from dairy cattle manure presents an attractive opportunity for many farmers. © GIZ/GTZ

28 MEASURING IMPACTS AND ENABLING INVESTMENTS IN ENERGY-SMART AGRIFOOD CHAINS
CO
ST-B
ENEF
IT A
NA
LYSI
S A
T T
HE
CO
UN
TRY
LEV
EL
TABLE 3.1. Value chains and technologies considered in the study.20
20 Based on cost information collected to develop the biogas-to-electricity case study in Kilifi, Kenya, as reported in FAO and GIZ, 2018 (US$ thousand):
Power plant acquisition (sourced from direct contact of Kilifi managers)
500
Grid connection (estimated) 20
Site preparation, including cement basements (estimated) 20
Project development, authorization and FiT agreement 30
Total Investment 570
Value chain
Energy technology
Energy technology description
Milk value chain
Biogas for power generation from dairy cattle manure
The plant has a 650 m3 anaerobic digester and uses cattle manure mixed with crop residues as feedstock, linked with a gas engine to power a generator of 150 kWel nominal power capacity (real capacity assumed to be 140 kWel ). The capital cost of one biogas power plant of this kind (made in Germany) is around US$ 500,000. Other capital costs, including grid connection to medium voltage lines, site preparation including civil works, and attainment of permissions, sum up to additional US$ 570,00020. Engine maintenance is performed by farm mechanics since this activity does not require specialist skills. Major maintenance to the internal combustion engine takes place every 60,000 to 70,000 hours (between 5 to 10 years). The operating costs for a large-scale biogas power plant are the labour needed to run the plant and any feedstock costs such as the collection from on-farm or external purchase and delivery.Liquid effluent, cow dung, crop residues or any other solid effluents are assumed to be free on-site, and water was assumed to be available at no cost. Co-digestion with crop residues is assumed. The FAO Bioenergy and Food Security Rapid Appraisal tool (FAO BEFSRA, 2017) is used to estimate the amount of feedstock required to run such a plant.It is reasonable to assume that a dairy farmer will invest in this kind of system only if the electricity produced can be sold to the grid. Therefore, close proximity to the grid is necessary for a cheap grid connection. In addition, where the grid is unreliable, a main benefit of introducing a biogas power generation technology is improved access to reliable electricity for the dairy farm, avoiding the need for diesel generation back-up. The wet digestate resulting after the anaerobic digestion can be dried to make it a more marketable product and easier to transport. The drying process would require some energy that can be obtained from the residual electricity or by recuperating residual heat from the engine.
Biogas domestic milk chiller (BDMC)
The domestic-scale biogas digester and milk chiller (BDMC) is a technology suitable for smallholder dairy farmers with few cows, since it can only cool up to 10 litres of milk per day (FAO and GIZ, 2018). With a BDMC, more milk is likely to be marketed through formal channels. Benefits for the farmer arise from increased milk revenues, availability of digestate slurry/manure as a fertiliser, and from using surplus biogas as a fuel for clean cookstoves. The net incremental benefit from investing in a milk chiller can be evaluated by deducting benefits obtained when no milk chiller is used from the benefits arising when one is used. It is unlikely that small-scale dairy farmers who are connected to the electricity grid will invest in a milk chiller since they are likely to have access to nearby milk collection centres (MCCs) with refrigeration facilities. They can bring the milk directly to the MCC without incurring spoilage from bacterial growth.The CBA was performed at the household level and assumed morning and evening milkings. The morning milk does not have to be cooled since it is delivered directly to the MCC with cooling facilities shortly after milking. Lack of local manufacturing implied that the technology is imported.

29MEASURING IMPACTS AND ENABLING INVESTMENTS IN ENERGY-SMART AGRIFOOD CHAINS
CO
ST-B
ENEF
IT A
NA
LYSI
S A
T T
HE
CO
UN
TRY
LEV
EL
The milk chiller requires about 1,000 litres of biogas per day (with a heat value of 25 MJ/l) to cool 10 litres of milk. Another cubic metre of surplus biogas is available to fuel one or more cookstoves for 1 to 2 hours per day. The commercially available SimGas system used for the analysis (costs and performance detailed in FAO and GIZ, 2018) is able to cool 10 l/day. It has a capital cost of US$ 1,600 and a lifespan of 10 years (lifetime of the milk chiller). Variable costs are for maintenance, replacement of spare parts and labour. Maintenance starts from year three of adoption, costing US$ 20 per year. Cookstove costs US$ 35 in the fifth year. The main cost of the system is the additional work needed to feed the digester with cow manure every day. This cost is partly compensated for by the benefits from using the digestate on farm to increase crop yield. A comparative study resulted in crop yield increases of between 25– 200% (FAO and GIZ, 2018).
Solar milk cooler
The technology and performance of the solar milk cooler is based on the “MilkPod” system that has been operated in Kenya since 2015 (FAO and GIZ, 2018). Manufactured by FullWood Packo, a Belgian company, it can chill and store 500 to 2,000 l of milk per day, relying just on solar power. The system is a complete milk collection and chilling station, including a milk receiving and testing section, a rapid milk chilling section and a milk storage section. The cost of one MilkPod with a capacity of 600 litres, imported from Belgium, is US$ 40,000. The system includes a cooling unit with ice bank (US$ 15,200); a 6 kW solar PV system (about 20 panels of 250 Wp); four 24 V, 3,500 Ah batteries; an inverter and a controller (US$ 19,290). The system is built in a shipping container with insulated walls and roof, LED lighting, a stainless steel wash sink with hot and cold water connections, a water heater and a stainless steel table (US$ 5,510). The system is shipped and installed by the manufacturer who also trains the future operators. Expected life of the cooling tank, ice bank, PV panels, water heater, waste heat recovery unit from the compressor (using a plate heat exchanger) and the other steel components in the container is 20 years. It was assumed the batteries will be replaced every 10 years for a cost of about US$ 3,000. The ice bank capacity can cool 2,500 l of milk, and therefore can go several days without solar power. The solar panels can fully charge the ice bank in one sunny day, so a few hours of operation are sufficient to create the ice. The ice water can chill and maintain milk at 4 °C for 3 to 5 days with no solar input. Routine maintenance includes washing the tank once a day and cleaning the solar panels six times a year, taking about two hours. The inputs required are labour to wash the milk tank and the open tank milk chiller, consuming 50 to 150 litres of water per day.
Overall, it was assumed that managing the system would require one full-time technician to fill the milk tank, clean it, and turn on and supervise the milk collection unit. To ensure milk quality and hygiene standard, the milk that reaches the solar milk cooler needs to be checked regularly.The system can cool milk to 4 °C in less than one hour, whereas less efficient, conventional direct expansion (DX) chillers can take up to 3 to 4 hours, thus improving the milk quality by reducing bacteria growth. By cooling the milk faster, the solar cooler can reduce milk rejection due to poor quality.
Vege- table value chain
Solar cold storage
The 25 m3 refrigerated cold storage system, designed for tomatoes and green beans, is powered by electricity from a 11 kWp solar PV array. The system is built in a 20 feet shipping container. The analysis is assuming the costs and technical performance of refrigerated container systems such as those commercialized by SunDanzer 21. These systems are suitable for refrigeration in locations with an intermittent grid as they are equipped with batteries for energy storage and (optionally) a PV system. The capital cost of a refrigerator of 35 m3 (6.1 m x 2.4 m x 2.4 m) with an internal refrigeration capacity of 25 m3 ranges from US$ 90,000 to 110,000, plus around US$ 25,000 for the solar system22.
21 For more information please visit http://www.sundanzer.com
22 For larger systems with several units, the capital cost per unit of refrigeration capacity slightly decreases.

30 MEASURING IMPACTS AND ENABLING INVESTMENTS IN ENERGY-SMART AGRIFOOD CHAINS
CO
ST-B
ENEF
IT A
NA
LYSI
S A
T T
HE
CO
UN
TRY
LEV
EL
Solar- powered water pumping
The water pump used for the case study (the SF1 solar irrigation pump provided by Futurepump, see FAO and GIZ, 2018 for more details) is equipped with an 80 Wp panel for pumping up to 1,200 l/day from a maximum depth of 8 m and is suitable for irrigating 0.2 ha of vegetable cropland. It can therefore be applied only to some areas of a country. The expected lifetime of the pump is 10 years. It costs US$ 650 when purchased as a cash payment. The service and maintenance costs for the farmer are covered by a two-year warranty. After the warranty period, these costs will be paid by the farmer and are estimated to be US$ 33 per year (in Kenya) including technician call-outs and spare parts.
Rice value chain
Rice husk gasific- ation
The 100 kWel rice husk gasifier is connected to a rice mill. The technology used for the case study is an ANKUR gasifier with dry ash removal and dry gas filter technology23. The system consumes up to 120 kg of biomass per hour, which represents about a third of of the typically available husk left over from milling. The installation costs about US$ 56,000 and requires maintenance and operators. The lifetime of the system is expected to be 10 years.
Solar- powered domestic rice processing
The solar-powered domestic-scale rice processing and milling equipment used for the case study is manufactured by PSS and it can process up to 120 kg/day. The technology improves the rice quality if compared to old diesel-powered millers due to lower damage of grains.A solar milling system (including huller, polisher, PV modules and modules’ holder, battery, electrical cables and accessories, charge controller) to process 40 to 45 tons of paddy per year can cost US$ 4,850 (FAO and GIZ, 2018). Concerning replacement and maintenance costs: the battery needs to be replaced every 3 years; mill’s brushes need to be changed approximately every 500 hours, at a cost of about US$ 5/set; rubber rollers on huller are expected to be replaced every 500 to 1,000 hours, at a cost of US$ 150/set; new belts are required every 250 to 500 hours, at a cost of US$ 25 for the rice huller and US$ 15 for the polisher. Finally, the system would need to be cleaned every week, requiring about 52 hours of work per year. As shown in FAO and GIZ (2018) and mentioned above, the solar-powered domestic rice mill can also improve the quality of the rice, since rubber rollers are used that are gentle on grains and therefore reduce rice breakage and loss. The technology has a lifetime of 20 years if properly maintained.
Note: More details on the technologies listed can be found in the case studies analysed in FAO and GIZ (2018).
Source: Authors.
23 For more information please visit https://www.ankurscientific.com/
The country-level impacts were assessed using the methodology presented in Chapter 1 for the selected value chains. The information collected on local costs, the energy sector and food production performance, was used together with the monetized benefits from the single intervention. Financial and economic CBAs were undertaken as reported in the following sections. Non-monetized impacts were also quantified when possible, using the indicator set presented in Section 2.2.
Where relevant, this study also monetized the impact of an energy technology on water use at national level by using the local market price or national tariff for water use. This ‘financial’ price of water was considered as an opportunity cost for the water resources affected (both positive and negative) by the introduction of a technology. In the context of this study, the impact on water demand is a broad subject since it depends on the technology, the value chain and the context considered. For instance,

31MEASURING IMPACTS AND ENABLING INVESTMENTS IN ENERGY-SMART AGRIFOOD CHAINS
CO
ST-B
ENEF
IT A
NA
LYSI
S A
T T
HE
CO
UN
TRY
LEV
EL
some technologies would reduce the water demand, whereas others that require water for cleaning or as an input to a process could increase demand. Therefore, the benefits and costs from an energy intervention that affects the water resource had to be identified on a case-by-case basis. In this study, the shadow price of water was estimated on the basis of the financial price of water, since it was not always possible to clearly identify the alternative services for the water used at national level and the users̀ willingness to pay (WTP) for these services. Where an alternative service could be distinguished and the WTP could be estimated, the WTP was used as a proxy for the social cost of water use.
Slightly different assumptions were made for each CBA scenario, including the baseline scenario, depending on the country-specific situation. For example, it could be assumed that all electricity generated by a technology is sold to the grid, whereas under another situation, some may be used on-site and the remainder distributed through a local mini-grid. All assumptions made by the authors are clearly described in the text.

3.1 MILK VALUE CHAIN
© GIZ/Angelika Jakob

33MEASURING IMPACTS AND ENABLING INVESTMENTS IN ENERGY-SMART AGRIFOOD CHAINS
CO
ST-B
ENEF
IT A
NA
LYSI
S A
T T
HE
CO
UN
TRY
LEV
EL
3.1.1 TUNISIA: ENERGY INTERVENTIONS IN THE MILK CHAIN
Value chain description
The milk sector in Tunisia is concentrated mainly in the North of the country although milk production is gaining importance in other regions such as the Sahel and the Centre (i.e. Sidi Bouzid), which previously had no such agricultural traditions (LACTIMED, 2013). Around 112,000 active cattle breeders are estimated, representing 30% of all farmers (LACTIMED, 2013; GIVLAIT, 2016). According to FAOSTAT, fresh milk production from cows in 2014 reached 1,192 million litres with an estimated number of 654,000 dairy cows in 2013 and 678,000 dairy cows in 2014 (FAOSTAT, 2017)24.
The distribution of farmers according to farm size and number of cows shows large differences, leading to the fragmentation of the milk sector with many small farms (LACTIMED, 2013). The distribution of farmers according to surface exploitation indicates that about 73% of farmers have less than 10 hectares, and that more than 50% have less than 5 hectares. Distribution of cattle farmers according to the number of cows is illustrated in Table 3.2. Less than 200 breeders (0.17%) have more than 50 cows, and 73 (0.06%) have more than 200 (LACTIMED, 2013).
TABLE 3.2. Distribution of cattle farmers according to number of cows.
Number of cows Percentage
1 – 5 82.8%
6 – 10 10.93%
11 – 20 4.79%
21 – 50 1.31%
≥ 50 0.17%
Source: LACTIMED, 2013.
The majority of dairy cattle farms are held in intensive mode, with the exception of a few herds which are extensively farmed, particularly in mountainous areas. There are two main farming systems in Tunisia (OEP, personal communication, 201725):
24 The analysis presented in this study is based on official statistics as reported to FAOSTAT. However, according to GIVLAIT, the actual numbers are lower: 424 000 dairy cows in 2013 and 437 000 dairy cows in 2014 (GIVLAIT, 2016).
25 Information provided by S. Zitouni, Ingénieur En Chef, Chef de service LAIT, Coordinatrice Nationale du Projet Tuniso-Danois, Office de l'Elevage et des Pâturages (OEP), in December 2017.

34 MEASURING IMPACTS AND ENABLING INVESTMENTS IN ENERGY-SMART AGRIFOOD CHAINS
CO
ST-B
ENEF
IT A
NA
LYSI
S A
T T
HE
CO
UN
TRY
LEV
EL
• The integrated intensive system characterizes the majority of farms, both in the organized sector on public land and in small and medium breeders, especially those located in the North and in the irrigated perimeters. The integration rate varies from one farm to another, depending on the agricultural and fodder area.
• The “landless” system is represented mainly by small dairy farmers whose cultivable area is very limited in number of animals, of the order of up to 0.3 ha/cow. The number of animals varies considerably, but is generally between 1 and 20 cows. This system has developed dramatically in the Sahel region (Sfax, Mahdia, Monastir, Sousse) and the Center (Sidi Bouzid).
In terms of manure availability (for biogas production), considering a production rate of 14.34 kg of manure per head per day (FAO BEFSRA, 201626), a total amount of more than 3.4 million tons of manure was produced by dairy cattle in Tunisia in 2016. Cow manure is usually stored in barns and applied to fields. (Alcor, 2010). Anaerobic digestion from dairy manure to produce biogas is not practiced in Tunisia, apart from a few pilot systems for household use.
The milk processing network includes over 240 MCCs, with a total capacity of over 2.7 million litres per day. This corresponds to 64% of national production of domestic raw milk and 85% of industrialized milk being collected through the national collection network. The remaining share of raw milk runs in a parallel or informal collection network sold by larger farms directly to dairies (GIVLAIT, 2016).
According to GIVLAIT (2016), the milk processing sector is composed of:
• 11 units producing milk to drink and fresh derivatives. These plants have a daily processing capacity of about 3.4 million litres milk into dairy fresh products;
• 2 units for milk powder with a daily capacity of 200,000 litres;
• 8 units27 for yogurt and fresh milk derivatives with a daily capacity of 750,000 litres;
• 25 cheese production units from fresh milk (industrial and artisanal units) with a daily processing capacity of 400,000 litres; and
• 5 processed cheese production units.
One of the weaknesses of the milk production sector in Tunisia is the milk quality which is negatively affected by the lack or failure of cooling equipment at farm level (Yanoubli, 2014). In fact, most small dairy farmers in Tunisia are used to sell the collected milk directly to large MCCs which, at times, are located far away. The milk cooling at the farm level is not commonly practiced. In addition, the milk is not valued according to its quality (Yanoubli, 2014). The current price policy fixes prices at the producer and consumer levels, and milk is not tested before reaching the MCC. Hence, farmers may have little incentives to improve milk hygiene and quality, as their
26 Default values are those suggested by the IPCC Guidelines for National Greenhouse Gas Inventories, Vol.4, Annex 10A.2, 2006.
27 9 units at the end of 2017 (Ben Salem Mondher, personal communication, 2017).

35MEASURING IMPACTS AND ENABLING INVESTMENTS IN ENERGY-SMART AGRIFOOD CHAINS
CO
ST-B
ENEF
IT A
NA
LYSI
S A
T T
HE
CO
UN
TRY
LEV
EL
milk will be mixed with milk from neighbouring farmers and tested as a blend at the MCC. Therefore, good quality milk collected by a farmer may be rejected by the MCC after being mixed with other farmers’ milk of poorer quality at collection stage. Introducing intermediate quality checks and quality-based price premiums could increase the incentives for farmers to improve milk hygiene and standards.
The milk typically reaches the MCCs by three main channels:
1. Breeders bring their production, once or twice a day, directly to the collection centre or sometimes to the dairy plant;
2. The MCC collects the milk from the farm;
3. Pedlars pick up and deliver the milk to collection centres, processing units or directly to users (creamers, coffee makers, consumers).
In the second case, the milk is collected farm by farm, by vans equipped with 300 to 1,000 l tanks and/or 40 litre milk cans, and brought to the MCC or dairy plant. The farmers often do the evening milking in the early afternoon in order to have the milk ready for the van to collect it. The collection tour takes from 2 to 3 hours, so on arrival in the MCC the milk often exceeds 3 hours without cooling, which affects the quality of milk, particularly in the hot season (GIVLAIT, 2015). To prevent the deterioration of milk quality, the milk must be cooled immediately after milking. Milk cooled without delay preserves its quality and keeps much longer.
In North African countries, losses of produced milk during post harvesting and storage can be significant (FAO, 2011a). According to research by the International Center for Agricultural Research (ICARDA), the National Agricultural Research Institute of Tunisia (INRAT) and GIZ (2016), the quantity of milk collected by a MCC is quite stable over the year, but the quantity of milk rejected varies from 15% (January) to 27% (June), being on average 21%.

36 MEASURING IMPACTS AND ENABLING INVESTMENTS IN ENERGY-SMART AGRIFOOD CHAINS
CO
ST-B
ENEF
IT A
NA
LYSI
S A
T T
HE
CO
UN
TRY
LEV
EL
GENDER ANALYSIS Despite significant efforts over the last few decades to improve women’s rights in Tunisia, significant gender inequities remain, particularly in rural areas. According to a 2012 survey of the National Board for Family and Population (ONFP), about half of Tunisian women have been subject to violence during their lifetime. In rural areas, 40% of rural women are illiterate (particularly in older age brackets), many lack access to free basic healthcare and are poorly integrated into the local economy and political scene, affecting their ability to influence decision-making (Gender Concern International, 2017). Female-headed households are generally poorer and benefit less from development activities, such as job creation and income-generating activities, than male-headed households (IFAD, 2016a).
Stark contrasts remain in the roles and responsibilities of men and women in rural Tunisia. Many young men migrate on a temporary, seasonal or long-term basis in search of employment opportunities. While this results in important supplementary income for rural households through remittances, it means that those left behind – including women of all ages and older men – take on more agricultural work and livestock husbandry. Women farmers now make up 57% of all farmers in the central regions, 24% in the North and 19% in the South. Yet, they still own only 4% of agricultural land. In general, the smaller the farmland, the more responsibility on the farm is borne by women. Despite women performing up to three-quarters of work on the farm, much of their work is unpaid. Rural women in Tunisia are also invariably responsible for domestic chores (FAO, 2017b).
In this context, gender-sensitive smallholder dairy development represents an opportunity for women to increase their income through the increase in production as well as through value addition from artisanal processing of milk (for example, into cheese such as Regouta or Leben, and other derivatives). Recognized areas that need support are: hygiene, milk quality, technical training, access to inputs including fodder
FIGURE 3.1. Daily average quantity of milk collected and rejected at MCCs in Tunisia.
0
–50
–100
–150
50
100
150
200
250
300
350
Janua
ry
Febr
uary
Mar
ch
April
May
June July
Augu
stSe
ptem
ber
Oct
ober
Nov
embe
rD
ecem
ber
Quantity collected
Quantity rejected
Tho
usan
d lit
re/d
ay
Source: Muhi El-Dine Hilali, 2016.

37MEASURING IMPACTS AND ENABLING INVESTMENTS IN ENERGY-SMART AGRIFOOD CHAINS
CO
ST-B
ENEF
IT A
NA
LYSI
S A
T T
HE
CO
UN
TRY
LEV
EL
and improved technology, access to credit (linked to land ownership) for investment and to producer associations, and marketing of local products (GIZ, 2014; IFAD, 2012).
Women are mostly in charge of indoor activities such as animal caring and feeding, while men are normally involved in marketing and managing of the resources (Muhi El-Dine Hilali, 2016). Collection and transportation of milk is predominantly a male activity. In the handling and processing stages, women commonly work in the informal sector producing dairy products (usually cheese), which do not meet quality standards for the formal value chain (GIVLAIT, personal communication, 201728) (Figure 3.2).
A study by ICARDA, INRAT and GIZ (2016) in the Governorate of Sidi Bouzid shows how responsibilities in the family farm are divided between the household members. Farm and crop management are essentially a male responsibility since they require more physical strength and are performed outside the house. Milking and livestock husbandry are almost exclusively a female responsibility. Milking in particular is almost exclusively done by women, which is predominantly carried out manually.
The study also collected data on the management of family income. It shows that women’s work is largely undervalued and that women’s awareness of the value of their activities is low. Men control a significantly bigger portion of household income regardless of the effort and labour that women have provided. In detail, the study showed that crop income is mostly spent by the men of the household. Men also control most of the income from all livestock-related activities (based on selling of milk and animals) and own almost all the animals. Although mostly women perform the task of milking, the revenue generated is normally managed and spent by men. On average, women spend around one-third of the total income generated by milk selling. Furthermore, the portion of income from seasonal migration jobs spent by women is notably small.
28 Information retrieved by an interview with R. Hazgui (GIVLAIT) during the Atelier de formation conjoint FAO/CIF-OIT sur «Le développement de chaînes de valeur sensible au genre» in Tunis, May 2017.
FIGURE 3.2. Gender roles along the milk value chain in Tunisia.
Inputs• Feeding the cows• Routine animal health• Veterinary services• Insemination services• Feed purchasing
Production• Milking• Nursing the cows • Milk selling• Cooperative
members
Transport & Collection• Collection• Transportation
Storage & Handling• Collection centres
Processing
• Formal processing plants
• Informal milk processing
Legend: Size of the men/women icons indicates the extent of their participation in each step of the chain.
Orange font: Activities usually performed by women; Blue font: Activities typically done by men.
Source: Authors.

38 MEASURING IMPACTS AND ENABLING INVESTMENTS IN ENERGY-SMART AGRIFOOD CHAINS
CO
ST-B
ENEF
IT A
NA
LYSI
S A
T T
HE
CO
UN
TRY
LEV
EL
ENERGY ASPECTSTunisia’s primary energy demand is mainly covered by natural gas and other fossil sources. Despite the country’s efforts in promoting renewable energy, their share remains almost insignificant (GIZ, 2012). Biofuels and waste accounted for 11.5% of total energy use in 2014, while fossil fuel accounted for 71%, and alternative energy (including hydropower, geothermal, and solar power) accounted for 0.5% (IEA 2017, World Bank 2016a). Regarding electricity production, renewable sources (mainly solar and wind) accounted for 3% in 2014, natural gas for 94% and oil for 1.7% (IEA 2017, World Bank 2016a). Energy production from biogas is also negligible (IEA, 2016). However, few combined heat and power (CHP) plants from non-specified and non-unique organic waste exist (La Presse de Tunisie, 2010).
The energy sector is heavily subsidised in Tunisia: In 2012, energy subsidies amounted to TND 5,600 million (about US$ 3,400 million), equalling 9% of GDP. These subsidies are not sustainable for the state and have several negative effects on public spending, such as a decreasing budget for public investments. The subsidy system is composed of indirect and direct subsidies. Indirect subsidies are the difference between supply costs of crude oil and gas for the state and the selling prices to the two public operators, the Société Tunisienne des Industries de Raffinage (STIR) for oil and the Société Tunisienne de l’Electricité et du Gaz (STEG) for natural gas. Direct subsidies are subsidies directly to STIR and STEG to offset their deficits (Energypedia, 2016a).
Pump price for diesel fuel in Tunisia in 2014 was US$ 0.68 per litre (World Bank, 2016c).
Electricity grid infrastructure
STEG holds the monopoly of transmission, distribution and sale of electricity and is the only entity allowed to import and export electricity. The remaining share is held by Independent Power Producers (IPPs) or self-producers with concessions (GSE, 2013). According to the World Bank (2016b), almost 100% of the population had access to electricity in 2012. Although grid coverage is quite poor in the southeast of Tunisia (GSE, 2013) it is still above 96% (ONAGRI, 2016). The electricity sales to the agriculture sector in 2012 accounted for 532 GWh (GSE, 2013).
Electricity prices can be divided according to voltage (Energypedia, 2016a)29:
• Low voltage. On the general low voltage, tariffs depend on the consumer sector (residential or non-residential) and the consumption per month in kWh. Tariffs are most heavily subsidized for households whose monthly consumption is below 50, 100 and 200 kWh. These households pay, respectively, TND 0.075 (US$ 0.03), TND 0.108 (US$ 0.05) and TND 0.140 (US$ 0.06) for each kWh consumed. Households whose consumption surpasses 200 kWh per month have to pay TND 0.151 (US$ 0.065)/kWh for the first 200 kWh, TND 0.184 (US$ 0.08)/kWh for the following 100 kWh; TND 0.280 (US$ 0.12)/kWh for the following 200 kWh; and TND 0.350 (US$ 0.15) for each kWh above 500 kWh/month.
29 The prices mentioned here refer to the year 2015.

39MEASURING IMPACTS AND ENABLING INVESTMENTS IN ENERGY-SMART AGRIFOOD CHAINS
CO
ST-B
ENEF
IT A
NA
LYSI
S A
T T
HE
CO
UN
TRY
LEV
EL
• Medium voltage. There are three to four tariff slots depending on the sector and on the time of day. Prices range from TND 0.088 (US$ 0.04)/kWh to TND 0.238 (US$ 0.10)/kWh.
• High voltage. This represents a substantially small share of the market, with only a handful of subscribers. There are four tariff slots and prices range between TND 0.111 (US$ 0.05)/kWh and TND 0.233 (US$ 0.10)/kWh.
Support for electricity production from renewable energies
Tunisia has a policy of energy conservation (energy efficiency) and promotion of RE. A national target of 30% of total energy production from renewables by 2030 was set30. Yet, Tunisia has not had standard long-term power purchase agreements (PPAs) until recently nor feed-in tariffs (FiTs) for RE.
Electricity produced from renewable sources can be either for self-consumption purposes, for selling it exclusively and entirely to the public body who guarantees to buy it31, or for export (Journal Officiel de la République Tunisienne, 2015). Companies and communities can also install PV generators on their roofs and benefit from the net metering system32. The projects are to be developed under four different “régimes” (as outlined by the 2015 law and 2016 decree and by Mokhtari et al., 2017):
• large-scale projects (above 10 MW for solar PV and thermodynamic solar energy and 30 MW for wind energy), subject to concession (tender process);
• small-scale projects, subject to authorization;
• self-production projects, subject to authorization; and
• export projects, subject to concession.
A FiT for electricity is only possible on the basis of ad-hoc contracts between private producers and STEG (Kurokawa et al., 2007). However, the law on energy conservation provides the possibility to the private sector to produce renewable electricity for own consumption and, in some cases, to feed the electricity surplus into the grid. In particular, industries are encouraged to install RE generation facilities and sell any unused surplus (up to 30% of total production) back to STEG (Reegle, 2012).
The selling price applied to the energy transferred to STEG throughout the contract duration depends on the origin of the electric energy and is fixed by the order of the Minister in charge of energy (STEG, no date). The purchase price for energy from
30 Law n. 2015-12 was later detailed and completed by decree n. 2016–1123 in August 2016 and the latest revision of the solar plan. The national target includes installations of 1,000 MW total capacity during the first period 2017–2020 and an additional 1,250 MW during the period 2021–2030. The Ministry published application texts for projects on 9 February 2017, including PPAs for the sale of renewable energy to STEG, transmission contracts, and grid connection codes.
31 See Law n. 2015–12. The producer of electricity from renewable sources can sell the electricity produced exclusively and entirely to the public body under a contract of sale concluded between the two parties in accordance with a standard contract approved by decree of the Minister for Energy. This contract determines in particular the technical and commercial conditions relating to the purchase of electricity produced from renewable sources.
32 In addition, these companies are eligible for incentives from the FNME under a program contract with the Agence Nationale pour la Maitrise de l'Energie (ANME) (ANME, 2012).

40 MEASURING IMPACTS AND ENABLING INVESTMENTS IN ENERGY-SMART AGRIFOOD CHAINS
CO
ST-B
ENEF
IT A
NA
LYSI
S A
T T
HE
CO
UN
TRY
LEV
EL
non-state producers in 2016 was TND 180/MWh (US$ 0.08/kWh) (ICEX, 2016). According to the standard contract fixed by STEG for high-voltage electricity producers, STEG keeps the equivalent of the VAT plus an estimate of income or company taxes, paying the producer only the net price for the excess energy (STEG, no date). Therefore, a net price of TND 0.16/kWh (US$ 0.07/kWh) is assumed. The producer is responsible for the set of taxes, duties and fees derived from the execution of the contract (ICEX, 2016).
For small-scale grid connected renewable energy projects, a net-metering policy was approved in 2009 allowing to feed excess electricity into the grid, which is then postponed to the next electricity bill (RCREEE, 2013).
Next to designing a net-metering system, Tunisia promotes RE and EE by providing direct aids. Such aids are granted by the Fonds National de Maîtrise de l’Energie (National Fund for Energy Conservation, FNME) and are guaranteed by specific tax benefits for energy efficiency and renewable energies:
• reduction of customs duties to the minimum rate of 10% (from a general rate of 18%) and exemption from VAT for imported equipment used for EE or RE, if no similar equipment is manufactured locally;
• reduction of customs duties and exemption from VAT for imported raw materials and semi-finished products entering into the production of equipment used in the field of EE and RE;
• exemption from VAT for locally manufactured raw materials and semi-finished products entering into the production of equipment for EE and RE;
• exemption from VAT for equipment manufactured locally and used in the field of energy conservation or RE (Reegle, 2012).
In addition, the FNME provides the following financial incentives for biogas in the agricultural sector:
• 40% of investment with a maximum of TND 20,000/project for biogas production only;
• 20% of investment with a maximum of TND 100,000/project for biogas production intended for electricity production (RCREEE, 2013).

41MEASURING IMPACTS AND ENABLING INVESTMENTS IN ENERGY-SMART AGRIFOOD CHAINS
CO
ST-B
ENEF
IT A
NA
LYSI
S A
T T
HE
CO
UN
TRY
LEV
EL
Technologies assessed
As mentioned above, in 2016, there were 240 MCCs in Tunisia, with a daily collection capacity of 2.7 million litres per day. The quantity collected by the network of official MCCs is increasing every year, from about 500 million litres in 2005 to 783 million litres in 2014 (GIVLAIT, 2016). Almost 75% of the milk collected by MCCs comes from the following seven governorates in the Centre and in the North: Sidi Bouzid, Mehdia, Bizerte, Jendouba, Beja, Sfax and Monastir (Abdelli, 2016). Collection centres and transformation units are concentrated in these areas (Figure 3.3). Often the small breeders in more remote areas do not have the means to transport their daily milk production to MCCs or to ensure refrigerated storage. Therefore, a good network of smaller solar milk coolers would support small-scale farmers, serving as a delivery tool between breeders and the MCCs or dairy processing plants.
Depending on the season, milk rejection at the MCCs due to low quality of the milk can be significant. No comprehensive data on this are available at national level but rejections can be in the range of 15–25% of the milk delivered to MCCs (Muhi El-Dine Hilali, 2016, GIVLAIT, 2015) (see figure 3.1). The milk rejected at this stage is usually thrown away. Solar milk coolers with a 500 to 1,000 l capacity can therefore be a good intermediate option for small farmers’ groups or cooperatives, which are located far from the MCC and face the risk of their milk being rejected due to poor quality.
Although herd sizes are typically small in Tunisia, in some cases the numbers may be sufficient for a biogas-to-electricity plant through anaerobic digestion of cattle manure
FIGURE 3.3. Distribution of MCCs and transformation units in Tunisia.
Source: GIVLAIT, 2016.
GULF OF HAMMAMET
ALGERIACollection basin
UHT milk production unit
Yogurt production unit
Drying unit
Cheese factory MEDITERRANEAN
SEA
ALGERIALYBIA
GULF OF GABÈS
GULF OF TUNIS
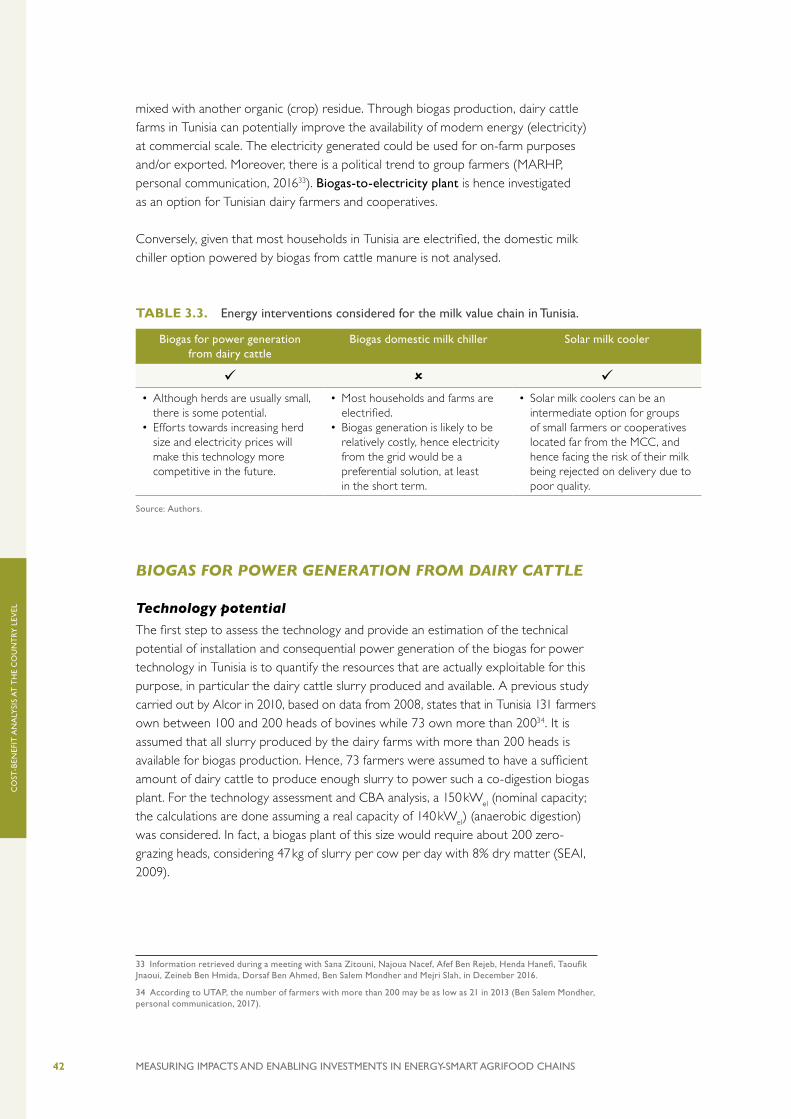
42 MEASURING IMPACTS AND ENABLING INVESTMENTS IN ENERGY-SMART AGRIFOOD CHAINS
CO
ST-B
ENEF
IT A
NA
LYSI
S A
T T
HE
CO
UN
TRY
LEV
EL
mixed with another organic (crop) residue. Through biogas production, dairy cattle farms in Tunisia can potentially improve the availability of modern energy (electricity) at commercial scale. The electricity generated could be used for on-farm purposes and/or exported. Moreover, there is a political trend to group farmers (MARHP, personal communication, 201633). Biogas-to-electricity plant is hence investigated as an option for Tunisian dairy farmers and cooperatives.
Conversely, given that most households in Tunisia are electrified, the domestic milk chiller option powered by biogas from cattle manure is not analysed.
TABLE 3.3. Energy interventions considered for the milk value chain in Tunisia.
Biogas for power generation from dairy cattle
Biogas domestic milk chiller Solar milk cooler
• Although herds are usually small,
there is some potential.• Efforts towards increasing herd
size and electricity prices will make this technology more competitive in the future.
• Most households and farms are electrified.
• Biogas generation is likely to be relatively costly, hence electricity from the grid would be a preferential solution, at least in the short term.
• Solar milk coolers can be an intermediate option for groups of small farmers or cooperatives located far from the MCC, and hence facing the risk of their milk being rejected on delivery due to poor quality.
Source: Authors.
BIOGAS FOR POWER GENERATION FROM DAIRY CATTLE
Technology potential
The first step to assess the technology and provide an estimation of the technical potential of installation and consequential power generation of the biogas for power technology in Tunisia is to quantify the resources that are actually exploitable for this purpose, in particular the dairy cattle slurry produced and available. A previous study carried out by Alcor in 2010, based on data from 2008, states that in Tunisia 131 farmers own between 100 and 200 heads of bovines while 73 own more than 20034. It is assumed that all slurry produced by the dairy farms with more than 200 heads is available for biogas production. Hence, 73 farmers were assumed to have a sufficient amount of dairy cattle to produce enough slurry to power such a co-digestion biogas plant. For the technology assessment and CBA analysis, a 150 kWel (nominal capacity; the calculations are done assuming a real capacity of 140 kWel) (anaerobic digestion) was considered. In fact, a biogas plant of this size would require about 200 zero-grazing heads, considering 47 kg of slurry per cow per day with 8% dry matter (SEAI, 2009).
33 Information retrieved during a meeting with Sana Zitouni, Najoua Nacef, Afef Ben Rejeb, Henda Hanefi, Taoufik Jnaoui, Zeineb Ben Hmida, Dorsaf Ben Ahmed, Ben Salem Mondher and Mejri Slah, in December 2016.
34 According to UTAP, the number of farmers with more than 200 may be as low as 21 in 2013 (Ben Salem Mondher, personal communication, 2017).

43MEASURING IMPACTS AND ENABLING INVESTMENTS IN ENERGY-SMART AGRIFOOD CHAINS
CO
ST-B
ENEF
IT A
NA
LYSI
S A
T T
HE
CO
UN
TRY
LEV
EL
Further, biogas production using crop residues (wheat straw freely available on the farms) is assumed35. The FAO BEFS Rapid Appraisal tool (FAO BEFSRA, 2017) is used to estimate the amount of feedstock required to run such a plant.
TABLE 3.4. Technology potential of biogas for power generation plants from manure in Tunisia.
Item Value Unit Source
Electricity production 882,000 kWh/year FAO and GIZ, 2018
Feedstock required
3,448 (slurry)21,752 (wheat straw)
tonnes/year
FAO, 2006 and expert opinion with a 6 :1 wheat straw:slurry ratio.FAO BEFSRA, 2017
Number of zero-grazing cows required
201 SEAI, 2009
Wet digestate produced
2,396 tonnes/year
FAO BEFSRA, 2017
Dried digestate (at 30% dry matter)
400 tonnes/year
FAO BEFSRA, 2017
Number of farms with more than 200 cows
73 Alcor, 2010
Source: Authors.
Cost-benefit analysis
FINANCIAL CBAIn Tunisia, a 20% subsidy on the equipment with a maximum of TND 100,000/project (around US$ 45,000) is applied to investments in biogas production for electricity (RCREEE, 2013). This results in capital costs of US$ 455,000 for a 150 kWel (nominal capacity) anaerobic digestion plant of this kind. Other costs include grid connection (medium voltage), site preparation, including civil works, and attainment of permissions for a total of around US$ 45,000. The spare parts are imported from the EU. The biogas plant is powered by cow slurry (3,443 ton/year) and wheat straw (3,443 ton/year), available on farm at no cost.
The average salary of a manager in Tunisia is around US$ 9,500, while a skilled worker’s salary is US$ 7,500 (Salary Explorer, 2015). Therefore, the overall cost of labour for a biogas plant (one manager and three part-time skilled employees) is approximately US$ 20,900/year.
Assuming an engine efficiency of 75% and a power plant own consumption of 8%, the plant generates more than 800 MWh/year. The electricity producer can make an ad-hoc agreement with STEG and sell excess electricity up to a maximum of 30% at
35 Wheat straw is an available feedstock in Tunisia (FAO, 2006). However, competitive uses of agricultural residues shall be taken into account. Wheat straw is commonly used in animal feed (as a complement to enhance digestion of ruminants) or for bedding. When traded, wheat straw is sold at 3–5 dinars/bale of 16–18 kg (Ben Salem Mondher, personal communication, 2017). For simplicity, the current case study assumes that wheat straw is not being used currently and is freely available for the farmers.

44 MEASURING IMPACTS AND ENABLING INVESTMENTS IN ENERGY-SMART AGRIFOOD CHAINS
CO
ST-B
ENEF
IT A
NA
LYSI
S A
T T
HE
CO
UN
TRY
LEV
EL
an agreed price (ANME, personal communication, 201636). Therefore, it is assumed that 70% of the electricity produced by the biogas plant is consumed for local (e.g. on-farm) activities such as milk cooling or processing, irrigation and lighting, while 30% is sold to the grid at an average price of US$ 0.07/kWh (ICEX, 2016). Before the introduction of the biogas plant, these on-farm activities are assumed to have been powered by grid electricity and a diesel generator for grid backup in case of outages37. The electricity produced by the plant would avoid buying grid electricity for up to US$ 38,200/year and diesel fuel to power a backup generator for US$ 224/year. The cost of grid electricity is considered on average US$ 0.07/kWh38 (ANME, personal communication, 2016), while the cost of electricity from a diesel generator is assumed to be US$ 0.28/kWh. By selling 30% of the excess electricity produced to STEG at a price of US$ 0.07/kWh, the biogas owner has an annual revenue of around US$ 18,150/year.
The investment does not pay back and shows a negative financial NPV – mainly due to the heavy subsidies for electricity in the absence of subsidies for RE production.
ECONOMIC CBA
Value added along the value chainOften, one of the main benefits of introducing a biogas for power generation technology to a large-scale dairy farm is improved access to electricity in case of an unreliable grid. However, in Tunisia the grid is relatively reliable. Therefore, even assuming that the electricity produced by the biogas plant is used for cooling and processing milk, the direct impact of a more stable electricity provision on value added along the milk value chain (e.g. improvement of milk quality due to the elimination of power outages) is very limited.
Subsidies and taxes Due to the subsidy scheme in place for biomass plants (20% of the investment with a maximum of TND 100,000 per project), each plant would cost the society about US$ 45,000 at installation stage. Moreover, electricity is heavily subsidized in Tunisia, so the 30% energy production bought by STEG would translate in a cost for the government. A subsidy of US$ 0.07/kWh is assumed (IRENA, 2014).
Since the plant will also displace about 11.35 l/year of diesel fuel needed for the generator during power outages, the State will lose about US$ 27/year from taxes on diesel use (for each plant)39. However, diesel is also subsidised with a 27% direct and indirect subsidy (Alcor, 2014), therefore, the avoided subsidy (US$ 60/year) surmounts the savings in tax revenues on diesel (an additional economic benefit for the society).
In addition, the FNME guarantees various reductions and exemptions regarding customs duties (see above “Energy acpects”). For each plant, the state will receive
36 Information reviewed during the interview with Abdessalem El Khazen, Director, Head of Renewable Energy Department, ANME, in December 2016.
37 In Tunisia, energy shortages are not common. In 2013, the World Bank dataset reported 0.3 power outages in firms in a typical month (World Bank, 2016b). This corresponds to around four days of power outage per year.
38 This is equal to the uniform tariff applied to medium voltage (GIZ, 2016).
39 With a taxation of 12% on diesel (Alcor, 2014).

45MEASURING IMPACTS AND ENABLING INVESTMENTS IN ENERGY-SMART AGRIFOOD CHAINS
CO
ST-B
ENEF
IT A
NA
LYSI
S A
T T
HE
CO
UN
TRY
LEV
EL
approximately US$ 50,000 from the technology import duty , plus US$ 1,000/year for the import of spare parts (US$ 5,000 for major maintenance every 5–10 years).
Electricity costs in Tunisia are around TND 0.260/kWh, while the average electricity selling price is about TND 0.133/kWh (US$ 0.07/kWh). Direct subsidies to grid electricity hence amount to TND 0.127/kWh (US$ 0.06/kWh). Indirect subsidy totals about TND 0.079/kWh (US$ 0.04/kWh) (Alcor, 2014). Since the electricity produced by the biogas plant replaces grid electricity, each plant would avoid direct and indirect subsidy on electricity of about US$ 80,000 per year.
Assessment of environmental and socio-economic impacts at national level
TABLE 3.5. Environmental and socio-economic impacts associated with 4041
the technical potential of biogas for power generation from manure in Tunisia (73 plants with installed capacity of 150 kWel each).
40 Information retrieved during the interview with Mohamed Toumi and Tarek Zrelli, Ministère de l’Environnement (Agence National de Gestion Des Déchets), in December 2016.
41 The digestate of the plant has a 95% moisture (FAO BEFSRA, 2017). Therefore, in order to sell it as fertilizer to other users, a centrifuge system is suggested to be used to reduce it to 70% moisture.
Impact Description Impact indicator
Monetized impact
Fertilizer use
Each biogas plant of this type produces about 400 tonnes of dried (30% dry matter) marketable digestate per year (FAO BEFSRA, 2017). In certain regions, the digestate can be as sold at TND 180/tonne (about US$ 80/tonne) (Ministry of Environment, personal communication, 2017 40). Since the market for the digestate is not yet established at national level, the study assumes a lower value for it (US$ 45/tonne), which also reflects the benefits in terms of increased fertility related to the digestate’s use as fertilizer. At national level, 73 plants would produce 29,151 tonnes of digestate per year41. This digestate is rich in nutrients (nitrogen (N), phosphorus (P) and potassium (K)) and can substitute organic and inorganic fertilizers. Given the size and variety of crops produced, an estimate of the amount of chemical fertilizer applied per hectare (and therefore displaced) in the areas where digestate could be used would require an ad-hoc study. However, it is possible to quantify the amount of N P K in the digestate produced by a biogas plant, which would be 32 tonnes of N/year, 6 tonnes of P/year and 14 tonnes of K/year. The amount of chemical fertilizers displaced can then be estimated based on these quantities.
29,151 tonnes of digestate/year;2,531 tonnes of N/year;416 tonnes of P/year; 989 tonnes of K/year
US$ 1,312,000/ year
Water use and efficiency
The mixed liquid and solid effluent slurry (8% total solids) collected underneath the feeding area is suitable for biogas feedstock without the need of extra water. Even with the digestion of 6:1 ration of wheat straw:slurry, the share of total solids in the mixture is 52%, which implies that no significant extra water is needed for the digester used (FAO BEFSRA, 2017). Some water is used for cleaning purposes but the increase in water use is negligible. Moreover, the water recovered from the moisture in the digestate (by using for example a centrifuge) can be used for this purpose.
– –

46 MEASURING IMPACTS AND ENABLING INVESTMENTS IN ENERGY-SMART AGRIFOOD CHAINS
CO
ST-B
ENEF
IT A
NA
LYSI
S A
T T
HE
CO
UN
TRY
LEV
EL
42
42 This can be interpreted as the opportunity cost of using this land and is accounted for as a cost for society in the economic CBA.
Food loss Since the grid is quite reliable, the impact of a continuous availability of modern energy on food loss is considered negligible.
– –
Land require- ment
The amount of land occupied by each plant is marginal, in the order of 500 m2 for a 150 kW plant. Since the plants are powered just by manure, there is no land converted to energy crops to feed the biogas plant. By assuming an average value of agricultural land of TND 50/m2 (ICARDA, INRAT and GIZ, 2016), this is equivalent to about US$ 7,900 at national level42.
3.65 hectares
US$ 7,900
GHG emissions
Using the respective grid and diesel generation emission factors (from Brander et al., 2011 & IPCC, 2006), and the net sale of electricity to the national grid, the avoided CO2eq emissions amount to around 400 tonnes CO2eq/year, or about 30 kt CO2eq/year for the 73 plants. By assuming a social cost of carbon (SCC) of US$ 36/tonne CO2eq, this corresponds to US$ 14,000/year per plant or about US$ 1 million/year at national level.
30,000 tonnes CO2eq/year
US$ 1 million/year
Health risk due to indoor air pollution
It is assumed that the biogas or electricity produced does not replace woodfuel for cooking in Tunisia, therefore the impact is negligible.
– –
Fossil fuel consump- tion
The electricity production avoided by the government includes both the reduction in the electrical consumption from the grid and the extra amount that STEG buys from the biogas plant. It sums up to 811 MWh/year, which corresponds to 2,920 GJ/year. Since in Tunisia the vast majority of electricity is produced with natural gas (93% in the electricity mix in 2014) (IEA, 2017), the biogas produced corresponds to about 213 TJ/year of natural gas.The diesel generator needed for about 800 kWh/year would require 11.35 l diesel (Diesel Service and Supply, 2017). With a conversion factor or 39.6 MJ/l, the diesel consumption avoided by a farm would be 450 MJ/year. At national level, this equals about 33,000 MJ/year of diesel or 128,000 MJ/year of primary energy (crude oil).
213 TJ of natural gas/year and 128 GJ of oil/year
–
Access to energy
Considering that the vast majority of large dairy farms are connected to the grid and are equipped with backup diesel generators, the technology has a negligible impact on access to modern energy. As stated above, it is assumed that the biogas produced does not replace traditional fuels for cooking or is used for additional farming or milk processing activities.
– –
Household income
The biogas feedstock (slurry and wheat straw) are freely available and the only cost is labour for their collection. There is no impact on the income of external smaller households (who could sell manure or other feedstock to the biogas plants if there was a market for them).
– –
Time saving No direct impact (biogas does not replace collected wood fuel for cooking).
–
Employ- ment
Each plant requires 1 manager and 3 skilled part-time workers. The intervention would create new, long-term jobs. At national level, this is equivalent to almost 300 new jobs (73 as manager and 219 as qualified part-time workers). Assuming a typical wage of US$ 3,800/year for part-time skilled workers and US$ 9,500/year for manager (Salary Explorer, 2015), this amount to about US$ 21,000/year for each biogas plant, totalling US$ 1.5 million/year for 73 plants. Given the skilled nature of the work and hence the higher level of education and training required, it is more likely that these jobs, in rural areas, would be held by men.
300 new jobs (skilled and long-term)
US$ 1.5 million/year
Colour code:
Positive impact Variable impact Negative impact No or negligible impact
Source: Authors.

47MEASURING IMPACTS AND ENABLING INVESTMENTS IN ENERGY-SMART AGRIFOOD CHAINS
CO
ST-B
ENEF
IT A
NA
LYSI
S A
T T
HE
CO
UN
TRY
LEV
EL
PROFITABILITYTable 3.6 summarizes the main financial and economic costs and benefits of biogas for power generation in Tunisia, both at intervention and at national scale (assuming a potential of 73 plants). The socio-economic and environmental benefits from subsidies’ reduction, taxes, digestate use as fertilizer, GHG emissions avoided and employment creation overcome the negative financial flows. Although the investment is not very attractive from a financial point of view, Figure 3.4 shows that, economically, the investment pays back after five years.
TABLE 3.6. Financial and economic CBA of biogas for power generation from manure in Tunisia.
Item Unit Value (single intervention)
Value (at scale) Notes
COSTS
Installation costs Thousand US$ 500 36,500
Subsidy for installation of RE systems
Thousand US$ 45 3,285 20% of investment with a maximum of TND 100,000 /project (US$ 45,000) for biogas production intended to electricity generation (RCREEE, 2013).
Replacement costs
Thousand US$ 10/year for spare parts, 20 for major maintenance
730/year for spare parts, 1,460 for major maintenance
Major maintenance is needed after 60,000–70,000 hours of engine functioning.
Labour cost
Thousand US$/year
21 1,523 1 full-time plant manager and 3 skilled part-time employees.
Subsidy for the electricity bought by STEG
Thousand US$/year
18 1,325 Assuming that 30% of the electricity produced by the plant is sold to the grid at a price subsidized by US$ 0.07/kWh.
Tax revenue from diesel use
US$/year 27 1,962 12% taxes on diesel (Alcor, 2014).
Land requirement US$/year 108 7,900 Assuming an average value of agricultural land of TND 50/m2.
BENEFITS
Savings from own biogas electricity consumption
Thousand US$/year
38 2,807 Assuming that on-farm activities consume up to 70% of the electricity produced that would otherwise be bought from the grid at US$ 0.07/kWh.
Revenues from selling electricity to STEG
Thousand US$/year
18 1,325 Assuming that 30% of the electricity produced by the plant is sold to the grid at a price of US$ 0.07/kWh (ICEX, 2016).
Avoided direct subsidy on electricity production
Thousand US$/year
49 3,606 Total electricity cost: TND 0.260/kWh; Average selling price: TND 0.133/kWh; Direct subsidy: –TND 0.127/kWh (about US$ 0.06/kWh) (Alcor, 2014).
Avoided indirect subsidy on elec-tricity production
Thousand US$/year
31 2,254 Indirect subsidy: TND 0.079/kWh (about US$ 0.04/kWh) (Alcor, 2014).

48 MEASURING IMPACTS AND ENABLING INVESTMENTS IN ENERGY-SMART AGRIFOOD CHAINS
CO
ST-B
ENEF
IT A
NA
LYSI
S A
T T
HE
CO
UN
TRY
LEV
EL
Avoided subsidy on diesel
US$/year 60 4,415 27% direct and indirect subsidy (Alcor, 2014).
Import taxes on plant
Thousand US$ 50 3,650
Reduction of customs duties to the minimum rate of 10% and exemption from VAT.
Import taxes on spare parts
Thousand US$ 1/year for spare parts, 5 for the major maintenance
73/year for spare parts, 365 for the major maintenance
On-farm digestate use
Thousand US$/year
18 1,312 Assumed value of dry digestate: US$ 45/tonne.
GHG emissions avoided
Thousand US$/year
14 1,051 Assumed social cost of CO2 emissions: US$ 36 per tonne (growing 2% per year).
Employment creation
Thousand US$/year
21 1,523 1 full-time plant manager and 3 skilled part-time employees per plant.
PROFITABILITY INDICATORS
Financial NPV Thousand US$ –283 –20,684
Financial IRR % –1%
Economic NPV Thousand US$ 897 65,448
Economic IRR % 28%
Note: Life expectancy of the technology is 20 years. Discount rate is 8%. Financial costs and benefits are on a orange background. Economic costs and benefits are on a green background.
Source: Authors.
FIGURE 3.4. Financial and economic cumulative discounted costs and benefits over 20 years of a biogas for power generation plant in Tunisia.
1000
800
600
400
200
0
–200
– 400
– 600
Subsidies and taxesFinancial net benefitsGHG emissions
Fertilizer useEmployment
1200
1400
Tho
usan
d U
S$
Land requirement
91 2 3 4 5 6 7 10 11 12 13 14 15 16 17 18 19 20 years0 8
Note: Additional non-monetized impacts on fossil fuel consumption occur (Table 3.5).
Source: Authors.

49MEASURING IMPACTS AND ENABLING INVESTMENTS IN ENERGY-SMART AGRIFOOD CHAINS
CO
ST-B
ENEF
IT A
NA
LYSI
S A
T T
HE
CO
UN
TRY
LEV
EL
SENSITIVITY ANALYSISThe benefits of the biogas for power generation plants depend on the price of digestate. A biogas plant fed by manure and wheat residue produces about 400 tonnes of dried marketable digestate per year (70% moisture (FAO BEFSRA, 2017)). In certain regions, the dry digestate can be sold at TND 180/t (about US$ 80/tonne) (Ministry of Environment, personal communication, 201743). Since the market for the digestate is not yet established at national level, the study assumes the lower value of US$ 45/tonne. This value reflects also the benefits in terms of increased fertility related to the digestate´s use as fertilizer, hence, it is shown in the economic CBA as an environmental benefit (Table 3.5). Therefore, the financial CBA assumes that the price of both wet and dry digestate is null. Figure 3.5 shows that, if there is a market price for the dry digestate, the biogas for power generation technology would be more profitable from a financial point of view. In particular, the financial NPV would be positive with a price for the dry digestate above US$ 100/tonne.
RESULTSThe initial investment required to install 73 biogas plants in Tunisia amounts to around US$ 36.5 million. Although the financial NPV over 20 years is negative (–US$ 21 million), the economic NPV is positive with US$ 65 million (Figure 3.6). The difference between financial and economic NPV is mainly due to additional revenues from taxes (including import duties) and avoided subsidies, digestate use as fertilizer, GHG emission reduction and employment creation. Economic costs are for instance in terms of land requirement (although negligible), which represents a cost for society. Overall, the State could avoid US$ 47 million in subsidy to electricity and earn US$ 4.6 million from import duties. Benefits from digestate use as fertilizer amount
43 See note 39.
FIGURE 3.5. Financial NPV for a biogas for power generation plant from manure in Tunisia according to the dry digestate price.
Fina
ncia
l NPV
(th
ousa
nd U
S$)
0 20 40 60 80 100 120 140 160
Value of dry digestate
400
300
200
100
0
–100
–200
–300
– 400
US$ / tonne
Source: Authors.

50 MEASURING IMPACTS AND ENABLING INVESTMENTS IN ENERGY-SMART AGRIFOOD CHAINS
CO
ST-B
ENEF
IT A
NA
LYSI
S A
T T
HE
CO
UN
TRY
LEV
EL
to US$ 1.3 million/year, while GHG emission reduction is worth more than US$ 12.5 million in 20 years. Finally, by creating four new jobs in each plant, the investment would create a benefit of US$ 15 million for the society as additional wages over 20 years.
Although not significant in this case, the impact of the biogas for power generation technology on water use and efficiency at national level should be carefully considered since other plant types and feedstock mixes (with a higher percentage of total solids) may have major impacts on water use.
Data sources
Figure 3.7 illustrates the information needed for estimating the technical potential of the technology, and Table 3.7 summarizes the information and data input needed, and actually used, for the techno-economic analysis.
FIGURE 3.6. Cumulative economic costs and benefits of biogas for power generation from manure in Tunisia at national level after 20 years (73 plants with installed capacity of 150 kWel each).
0
–20
20
–40
40
60
80
100
Financial net bene�ts
GHG emissions
Subsidies and taxes
Employment
Land requirement
Fertilizer use
15.0
Mill
ion
US$
12.5
12.9
45.9
–20.7
–0.08
US$ 37 millionFor 73 systems
INITIAL INVESTMENTOVER 20 YEARS
US$ 65 millionECONOMIC NPV
FINANCIAL IRR
–1%
US$ –21 millionFINANCIAL NPV
Fossil fuel consumption–213
TJ/year
Note: The sum of the financial NPV and the economic co-benefits and costs is the economic NPV.
Colour code for non-monetized impacts: Positive impact Variable impact Negative impact
Source: Authors.
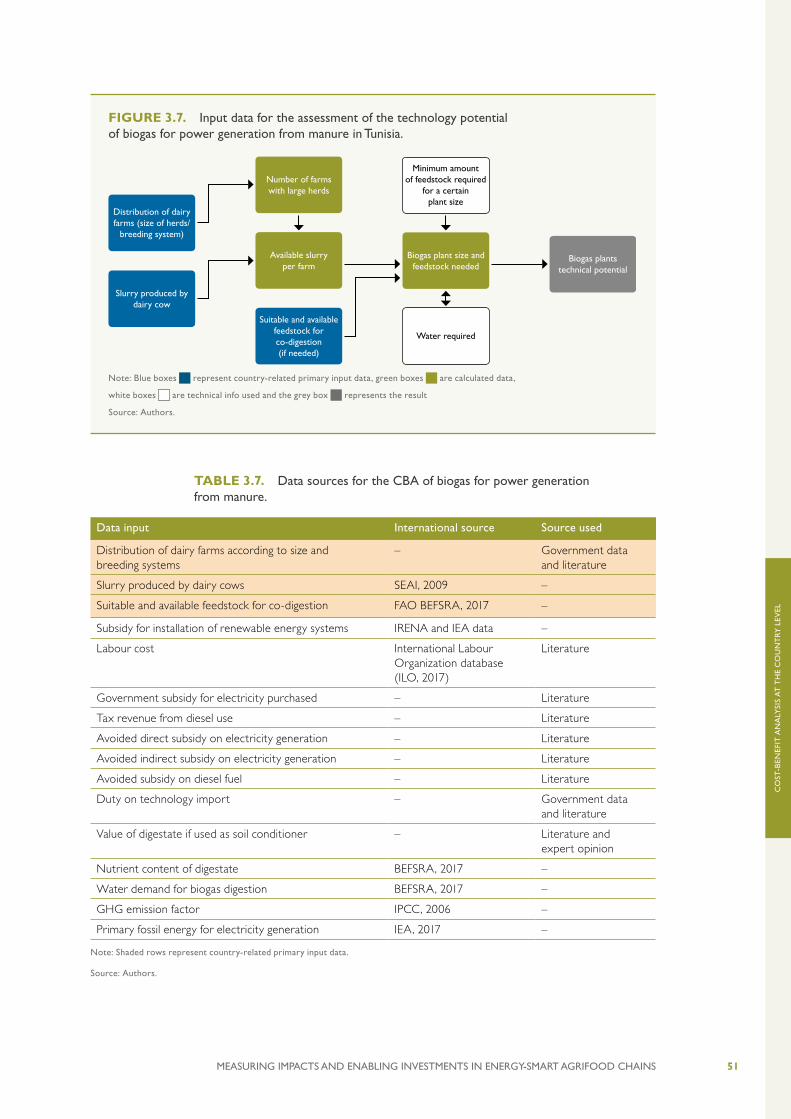
51MEASURING IMPACTS AND ENABLING INVESTMENTS IN ENERGY-SMART AGRIFOOD CHAINS
CO
ST-B
ENEF
IT A
NA
LYSI
S A
T T
HE
CO
UN
TRY
LEV
EL
TABLE 3.7. Data sources for the CBA of biogas for power generation from manure.
Data input International source Source used
Distribution of dairy farms according to size and breeding systems
– Government data and literature
Slurry produced by dairy cows SEAI, 2009 –
Suitable and available feedstock for co-digestion FAO BEFSRA, 2017 –
Subsidy for installation of renewable energy systems IRENA and IEA data –
Labour cost International Labour Organization database (ILO, 2017)
Literature
Government subsidy for electricity purchased – Literature
Tax revenue from diesel use – Literature
Avoided direct subsidy on electricity generation – Literature
Avoided indirect subsidy on electricity generation – Literature
Avoided subsidy on diesel fuel – Literature
Duty on technology import – Government data and literature
Value of digestate if used as soil conditioner – Literature and expert opinion
Nutrient content of digestate BEFSRA, 2017 –
Water demand for biogas digestion BEFSRA, 2017 –
GHG emission factor IPCC, 2006 –
Primary fossil energy for electricity generation IEA, 2017 –
Note: Shaded rows represent country-related primary input data.
Source: Authors.
FIGURE 3.7. Input data for the assessment of the technology potential of biogas for power generation from manure in Tunisia.
Distribution of dairy farms (size of herds/
breeding system)
Available slurry per farm
Suitable and available feedstock for co-digestion (if needed)
Biogas plants technical potential
Slurry produced by dairy cow
Number of farms with large herds
Biogas plant size and feedstock needed
Minimum amount of feedstock required
for a certain plant size
Water required
Note: Blue boxes represent country-related primary input data, green boxes are calculated data,
white boxes are technical info used and the grey box represents the result
Source: Authors.

52 MEASURING IMPACTS AND ENABLING INVESTMENTS IN ENERGY-SMART AGRIFOOD CHAINS
CO
ST-B
ENEF
IT A
NA
LYSI
S A
T T
HE
CO
UN
TRY
LEV
EL
Barriers to technology adoption
A first barrier to the development of biogas for power generation in Tunisia is the limited awareness of new biogas technologies. This barrier is also linked to the lack of qualified experts for the sizing, design, and safety of systems, particularly of engineers and technicians specialised in biogas. Moreover, people sometimes dislike handling manure as it is considered makruh44.
Other institutional barriers can be identified in a complicated regulatory environment to launch projects and the lack of clear development strategy on anaerobic digestion at the policy level.
The limited knowledge of the technology amongst public officials is linked to both the lack of support services for operation, maintenance and installation of plants, and the shortage of projects on the development of biogas at university level. Moreover, farmers often lack awareness about the nutrient value of digestate and prefer to apply manure.
The financial returns of investing in biogas for power are reduced by the absence of preferential tariffs for electricity generated by biogas technologies. Moreover, biogas faces strong competition by other energy sources on the market, both renewable and conventional, in particular as energy prices are often artificially low due to subsidy.
As the upfront investment cost for the biogas for power technology is very high, an important barrier to its adoption are the difficulties in accessing credit. Potential barriers and risks to the adoption of biogas for power in Tunisia are summarized in Table 3.8.
44 In Islamic terminology, makruh is a distasteful, offensive or an inappropriate act.

53MEASURING IMPACTS AND ENABLING INVESTMENTS IN ENERGY-SMART AGRIFOOD CHAINS
CO
ST-B
ENEF
IT A
NA
LYSI
S A
T T
HE
CO
UN
TRY
LEV
EL
TABLE 3.8. Key barriers to the adoption of biogas for power generation from manure in Tunisia.
SOLAR MILK COOLER
Technology potential
Solar milk coolers with a capacity of 500 to 1000 l can be an additional cooling step for small farmers’ groups or cooperatives which are located far from the MCC and face the risk of their milk being rejected due to poor quality.
The solar milk cooler assessed can cool about 600 l of milk per day. It is used to keep the evening milk cool during the night, so that it can sold the next morning, together with the morning milk. Considering an average milk production per cow of 1,744 l/year (elaboration based on FAOSTAT, 2016)45, the capacity is sufficient for 200 to 300 cows. Therefore, given the small average size of dairy farms in Tunisia, a milk cooler with this capacity can be considered an appropriate solution for a farmer group or cooperative. The Tunisian government is incentivizing small dairy farmers to group in cooperatives or farmer groups. However, this agglomeration tendency is challenged by a general lack of trust by the farmers46.
This technology is particularly suitable for regions where milk production is practiced at very small scale and the aggregation level of livestock farmers is low. To estimate the potential for this technology, the analysis focuses on the milk produced outside of the major seven milk producing governorates, where 74% of the collection is concentrated (see above Figure 3.3). In these regions, small dairy farmers have fewer means to transport the milk regularly to MCCs and the milk can remain at the farm
45 According to other sources based on GIVLAIT (2016), the average milk production in Tunisia is higher: With 1,175 million litres of milk produced in 2013 by 424,000 dairy cows, the average production equals around 2,700 litres/year (Ben Salem Mondher, personal communication, 2017).
46 The main reason for the lack of trust is cultural and based on failed experiences and policies in the past (Guiza, Ben Hammadi and Abdelli, UTAP, personal communication, 2016).
Knowledge and information
Organization/ social
Regulations/ institutions
Support services/ structures
Financial returns
Access/ cost of capital
Lack of qualified experts for the sizing, design, and safety of systems, particularly of engineers and technicians specialised in biogas plants
Low awareness of modern biogas technologies and of the nutrient value of digestate among farmers and public officials
Handling manure is sometimes considered makruh in the Islamic culture
Long waiting time and bureaucracy to get per-missions for new anaerobic digestion plants
Lack of support services for installation, operation and maintenance of plants
Lack of demo projects
Artificially low energy prices (electricity and agri-cultural diesel) due to subsidy, inhibiting the competiti-veness of anaerobic digestion
Other REs and traditional energy sources are more competitive in Tunisia
Lack of access to credit
Source: Authors.

54 MEASURING IMPACTS AND ENABLING INVESTMENTS IN ENERGY-SMART AGRIFOOD CHAINS
CO
ST-B
ENEF
IT A
NA
LYSI
S A
T T
HE
CO
UN
TRY
LEV
EL
up to three days before reaching the collection stage. This situation increases exponentially the risk of milk spoilage and milk rejection at the MCC. In this context, solar coolers as an intermediate step between the farm and the MCC or collection unit can be a very positive innovation.
Based on local expert opinion, around 70% of farmers in these areas could benefit from the introduction of an intermediary milk refrigeration step, be it due to the distance to the collection centre or the lack of appropriate means for a timely milk delivery (Union Tunisienne de l’Agriculture et de la Pêche (UTAP), personal communication, 201747). On this basis, and considering that about 182 million litres are collected by MCCs in these governorates, there is a technical potential of 580 solar refrigeration units with a capacity of 600 l/day (Table 3.9).
TABLE 3.9. Technology potential of solar milk coolers in Tunisia.
Item Value Source
Number of MCCs 240 GIVLAIT, 2016
MCCs daily capacity [million l/day] 2.7 GIVLAIT, 2016
Milk collected by the official MCC [%] 64 GIVLAIT, 2016
Milk collected by the official MCC [million l/year] 701 Authors’ calculation
Share of milk collected in the seven major milk producing governorates [%]
74.1 Abdelli, 2016
Milk collected in the other governorates [million l/year] 182 Authors’ calculation
Share of smallholder farmers who could benefit from an intermediate milk cooling step
70% UTAP, personal communication, 2017 48
Installable solar milk coolers [n°] 580 Authors’ calculation
Source: Authors.
Typically, no quality check is performed before the milk reaches an official MCC. As 48 the milk is collected by several farmers before reaching the MCC, the incentive for farmers to improve the milk hygiene and cool their milk is low, unless there is a high level of trust and cooperation between all the farmers in a group. Even good quality milk can be rejected at the MCC stage if mixed with bad quality milk at the collection level. Intermediate milk coolers, which also allow to perform quality tests on the milk collected by individual farmers, may represent a huge improvement for the whole value chain. Quality checked coupled with the introduction of a price premium for cooled milk at the MCC would significantly improve the financial benefits related to the adoption of a solar milk cooler.
47 Information retrieved by personal communication with M. Abdelli, UTAP.
48 See note 47.

55MEASURING IMPACTS AND ENABLING INVESTMENTS IN ENERGY-SMART AGRIFOOD CHAINS
CO
ST-B
ENEF
IT A
NA
LYSI
S A
T T
HE
CO
UN
TRY
LEV
EL
The typical benchmark situation is that, before the introduction of a solar milk cooler, a farmer group or cooperative would pay somebody to collect the milk farm-by-farm twice a day (morning and afternoon/evening) and to transport it to the closest MCC. The current milk price at the level of the collecting centres is TND 0.736/l (US$ 0.32/l). To encourage milk channelling through the collection network there is an additional premium of TND 0.04/l (ICARDA, INRAT and GIZ, 2016) to incentivize farmers to gather in groups and organize joint transportation instead of selling the milk at farm level to hawkers.
With the introduction of solar milk chillers closer to the farmers, the evening milk can be collected with less stress on the breeders and can be cooled soon after milking, reducing significantly the rejection rate at the MCC. It is assumed that milk rejection of evening milk can be reduced from an average of 21% (Muhi El-Dine Hilali, 2016, GIVLAIT, 2015) to 6%. The cooled evening milk can stay in the solar milk cooler overnight and be delivered to the MCC the next morning (together with the morning milk or on a separate trip, depending on the capacity of the transportation mean and the geographic distribution of the farmers). Few MCCs already pay a refrigeration premium of TND 0.04/l to promote on-farm milk cooling (ICARDA, INRAT and GIZ, 2016).
Cost-benefit analysis
FINANCIAL CBAThe costs and benefits for a collective farmer cooperative investing in a MilkPod were compared with a situation where no intermediate cooling system exists between the farm and the MCC49.
To ensure milk quality and hygiene standard, the milk that reaches the solar milk cooler should be checked regularly. Assuming a water price of TND 3.7/m3 (US$ 1.60m3) (ICARDA, INRAT and GIZ, 2016) and an average salary for skilled employ of US$ 7,590 (Salary Explorer, 2015), the operating cost for the solar milk cooler amounts to about US$ 7,650 /year.
The main benefit of adopting a solar milk cooler is the reduction in milk rejection rates at the MCC. Farmers can sell more milk at TND 0.78 (about US$ 0.34) per litre, which is the fixed purchasing price payed by MCCs. Given that on average about 21% of the milk is rejected at the MCCs (equalling 125 l/day), each solar milk cooler can save about 89 litres of milk per day by cooling 600 l/day50. The group of breeders bringing the milk to the MCCs would receive a fixed price of US$ 0.336/l (Table 3.10). By saving 89 l/day their revenues increase by US$ 10,882/year.
49 Socio-environmental costs of manufacturing the milk cooler type are beyond the scope of this analysis.
50 However, other complementary measures are required at farm and collection level to completely eliminate rejection at the MCCs, such as keeping the cows healthy and well-fed and performing the milking in strictly clean conditions (GIVLAIT, 2015). Therefore, it is assumed that the introduction of a solar milk chiller will not fully avoid rejections (125 litres/day), but rather bring about a reduction of rejection rates from 21% to 6%.

56 MEASURING IMPACTS AND ENABLING INVESTMENTS IN ENERGY-SMART AGRIFOOD CHAINS
CO
ST-B
ENEF
IT A
NA
LYSI
S A
T T
HE
CO
UN
TRY
LEV
EL
Under these conditions, the investment does not pay back from a financial point of view since the costs outweigh the benefits51. Conversely, if we would have included a price premium for cooled milk (TND 0.035/l) paid at the collection centre, the financial NPV of investment turns positive (see Chapter 4). However, since the practice of paying a premium for refrigerated/quality milk is not common in Tunisia, it is not considered for the CBA.
ECONOMIC CBA
Value added along the value chainMilk prices along the value chain are fixed in Tunisia (Table 3.10). The adoption of solar milk coolers as an intermediate step between the farm level and the MCC or trans-formation unit would allow saving on average 89 litres of milk per day per cooler, at MCC level. This milk is made available to the market and can be further processed. The financial savings are incorporated by the farmer group or small cooperative (and accounted for in the financial CBA) while co-benefits will be spread also down the value chain. The approximate value added of the additional 89 litres of milk at each step of the value chain is shown in Table 3.10. Since the value added up to transport/collection stage is already considered in the financial CBA, the overall value added along the milk value chain would be the sum of all values added at the following steps (net costs), i.e. US$ 771/year.
TABLE 3.10. Price and value added along the milk value chain due to milk loss reduction.
Price Cost Profit Value added
DT/l US$/l US$/l US$/l US$/year
Farm gate 0.736 0.319
Transport/collection 0.776 0.336 0.334 0.002
MCC 0.790 0.342 0.338 0.004 140
Processing unit 1.089 0.471 0.465 0.006 196
Wholesaler 1.096 0.474 0.471 0.003 98
Retailer/consumer 1.120 0.485 0.474 0.010 337
Total valued added 771
Source: Authors’ compilation based on GIVLAIT, 2016.
Subsidy and taxesThe MilkPod has to be imported since no similar equipment is manufactured locally. In Tunisia, imported renewable technologies benefit from a preferential import duty of 10% (instead of 18%) and a VAT exemption (see above “Energy aspects”). The import duty is a benefit from the public perspective while the VAT exemption can be considered a ‘missed benefit’.
51 The chosen discount rate for Tunisia is 8% as in the biogas-for-power analysis.
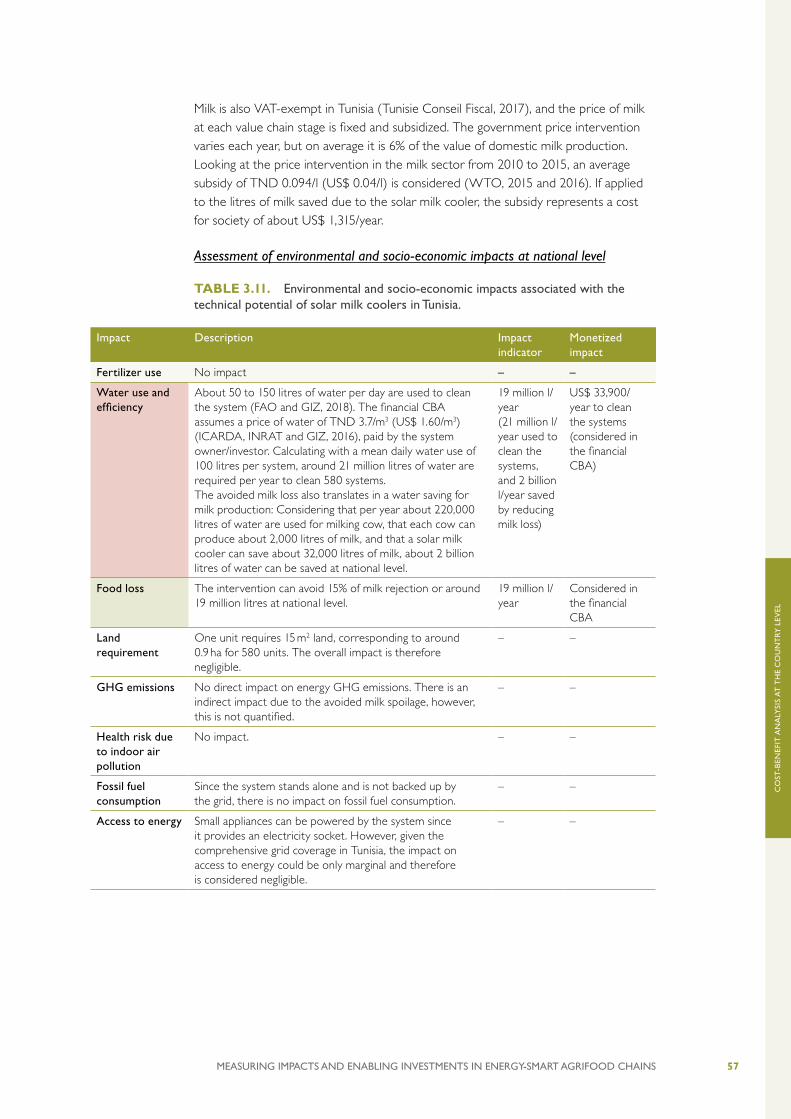
57MEASURING IMPACTS AND ENABLING INVESTMENTS IN ENERGY-SMART AGRIFOOD CHAINS
CO
ST-B
ENEF
IT A
NA
LYSI
S A
T T
HE
CO
UN
TRY
LEV
EL
Milk is also VAT-exempt in Tunisia (Tunisie Conseil Fiscal, 2017), and the price of milk at each value chain stage is fixed and subsidized. The government price intervention varies each year, but on average it is 6% of the value of domestic milk production. Looking at the price intervention in the milk sector from 2010 to 2015, an average subsidy of TND 0.094/l (US$ 0.04/l) is considered (WTO, 2015 and 2016). If applied to the litres of milk saved due to the solar milk cooler, the subsidy represents a cost for society of about US$ 1,315/year.
Assessment of environmental and socio-economic impacts at national level
TABLE 3.11. Environmental and socio-economic impacts associated with the technical potential of solar milk coolers in Tunisia.
Impact Description Impact indicator
Monetized impact
Fertilizer use No impact – –
Water use and efficiency
About 50 to 150 litres of water per day are used to clean the system (FAO and GIZ, 2018). The financial CBA assumes a price of water of TND 3.7/m3 (US$ 1.60/m3) (ICARDA, INRAT and GIZ, 2016), paid by the system owner/investor. Calculating with a mean daily water use of 100 litres per system, around 21 million litres of water are required per year to clean 580 systems. The avoided milk loss also translates in a water saving for milk production: Considering that per year about 220,000 litres of water are used for milking cow, that each cow can produce about 2,000 litres of milk, and that a solar milk cooler can save about 32,000 litres of milk, about 2 billion litres of water can be saved at national level.
19 million l/year (21 million l/year used to clean the systems, and 2 billion l/year saved by reducing milk loss)
US$ 33,900/year to clean the systems (considered in the financial CBA)
Food loss The intervention can avoid 15% of milk rejection or around 19 million litres at national level.
19 million l/year
Considered in the financial CBA
Land requirement
One unit requires 15 m2 land, corresponding to around 0.9 ha for 580 units. The overall impact is therefore negligible.
– –
GHG emissions No direct impact on energy GHG emissions. There is an indirect impact due to the avoided milk spoilage, however, this is not quantified.
– –
Health risk due to indoor air pollution
No impact. – –
Fossil fuel consumption
Since the system stands alone and is not backed up by the grid, there is no impact on fossil fuel consumption.
– –
Access to energy Small appliances can be powered by the system since it provides an electricity socket. However, given the comprehensive grid coverage in Tunisia, the impact on access to energy could be only marginal and therefore is considered negligible.
– –

58 MEASURING IMPACTS AND ENABLING INVESTMENTS IN ENERGY-SMART AGRIFOOD CHAINS
CO
ST-B
ENEF
IT A
NA
LYSI
S A
T T
HE
CO
UN
TRY
LEV
EL
Household income
The impact on household income (of the cooperative members) depends on the structure of the group/cooperative and on the number of cows per household. For instance, the number of farmers affected by each solar milk cooler can vary from about 80 (assuming 3 cows/household) to 25 (assuming 10 cows/household). At national level this is equivalent to between 10,000 and 50,000 farmers. If a farmer receives a price of US$ 0.32/l of milk and has 3 cows (each one producing about 1,700 l/year), their benefit is about US$ 120/year due to the introduction of the solar milk cooler. A farmer with 10 cows can instead increase his or her revenues by more than US$ 400/year. It is possible that both women and men control a portion of the additional income generated from milk sales, with men controlling a larger share
10,000 to 50,000 peopleUS$ 120–400/year per household
US$ 6 million/year (considered in the financial CBA)
Time saving The impact on time saving depends on the collection network and therefore the geographical distribution of the farmers. Previous to the introduction of the solar milk cooler, evening milk is typically collected by a transporter going from farm to farm. After the intervention, transporters still go from farm to farm and bring the milk to the solar milk cooler (closer to the farmers, thus saving time). However, a transporter still has to deliver the milk to the MCC, which partly offsets the time savings. Hence, overall the impact at country level is expected to be positive or negligible.
– –
Employment One additional skilled worker is needed to operate, clean and maintain the milk cooler, at an average wage of US$ 7,590 per year. The local technician could be a man or a woman. Given the higher rate of illiteracy and fewer technical skills of rural women compared to men, the technician is more likely to be male, unless women are proactively trained and empowered to take on the role as well.
1 skilled worker per system
US$ 4.4 million/year
Colour code: Positive impact Variable impact Negative impact No or negligible impact
Note: The calculations are based on 580 systems with a capacity of 600 litres each.
Source: Authors.

59MEASURING IMPACTS AND ENABLING INVESTMENTS IN ENERGY-SMART AGRIFOOD CHAINS
CO
ST-B
ENEF
IT A
NA
LYSI
S A
T T
HE
CO
UN
TRY
LEV
EL
PROFITABILITYTable 3.12 summarizes the financial and economic net benefits for the reference solar milk cooler in Tunisia. Although the investment is not very attractive from a financial point of view, Figure 3.8 shows that economically the investment pays back after four years and has a very positive economic NPV. The most relevant co-benefits of this technology in the Tunisian context are the creation of value added along the milk chain and the creation of employment (1 skilled employee per system).
TABLE 3.12. Financial and economic CBA of solar milk coolers in Tunisia.
Item Unit Value (single intervention)
Value (at scale) Notes
COSTS
Installation costs Thousand US$
40 23.206 Source: FAO and GIZ, 2018
Replacement costs
Thousand US$
3 every 10 years to replace battery
1.740 every 10 years to replace battery
Source: FAO and GIZ, 2018
Water requirement
Thousand US$/year
0.06 34 To clean and manage the system at a water price of TND 3.7/m3
(US$ 1.60/m3).
Labour cost Thousand US$/year
7.6 4.401 1 skilled employee to run and clean the system.
National subsidy to milk price
Thousand US$/year
1.3 763 Average subsidy of DT 0.09/l (US$ 0.04/l) (WTO, 2015 and 2016).
BENEFITS
Increased revenues from selling the milk at the MCC
Thousand US$/year
10.9 6.313 Due to the reduction by 15% in milk rejection at the MCC (from 21% to 6%).
Value added along the value chain
Thousand US$/year
0.8 447 At the prices fixed by the government, assuming that 89 l/day are saved.
Import taxes on MilkPod
Thousand US$
4 2.321Reduction of customs duties to the minimum rate of 10% and exemption from VAT.Import taxes
on batteryThousand US$
0.3 at year 10 174
Employment creation
Thousand US$/year
7.6 4.401 1 skilled employee per cooler.
PROFITABILITY INDICATORS
Financial NPV Thousand US$
–9.6 –5.570
Financial IRR % 5%
Economic NPV Thousand US$
64 36.980
Economic IRR % 28%
Note: Life expectancy of the technology is 20 years. Discount rate is 8%. Financial costs and benefits are on an orange background. Economic costs and benefits are on a green background.
Source: Authors.

60 MEASURING IMPACTS AND ENABLING INVESTMENTS IN ENERGY-SMART AGRIFOOD CHAINS
CO
ST-B
ENEF
IT A
NA
LYSI
S A
T T
HE
CO
UN
TRY
LEV
EL
RESULTSWith a technical potential of 580 solar milk coolers that can be introduced in Tunisia as an intermediate step between small farmer groups and MCCs, the total initial investment required would be about US$ 23 million. The intervention significantly reduces milk rejection at the MCC. However, without a price premium for cooled milk, the investment does not pay back from a financial point of view. Nonetheless, in remote areas, the impact on the value added along the value chain can be significant since each litre saved at the MCC stage increases value down the chain.
The government would benefit from import duties on the technology. Conversely, since the price of milk is fixed and subsidized, more milk in the value chain implies a cost for the government (Figure 3.9).
An important aspect is the amount of water needed to clean the system (about 50-150 l/day per system), which can represent a concern in water-scarce areas. The technology has important co-benefits in terms of skilled employment creation and household income (monetized in the financial CBA).
Data sources
Figure 3.10 illustrates the information needed for estimating the technical potential of the technology, and Table 3.13 summarizes the information and data input needed, and actually used, for the techno-economic analysis.
FIGURE 3.8. Financial and economic cumulative discounted costs and benefits over 20 years of a solar milk cooler in Tunisia.
100 100
80
60
40
20
0
–20
– 40 -40
– 60 -60
Subsidies and taxes
Financial net benefits Value added along the VC
Employment
Tho
usan
d U
S$
years
Water use and efficiency
91 2 3 4 5 6 7 10 11 12 13 14 15 16 17 18 19 200 8
Source: Authors.

61MEASURING IMPACTS AND ENABLING INVESTMENTS IN ENERGY-SMART AGRIFOOD CHAINS
CO
ST-B
ENEF
IT A
NA
LYSI
S A
T T
HE
CO
UN
TRY
LEV
EL
FIGURE 3.9. Cumulative economic costs and benefits of solar milk coolers in Tunisia at national level after 20 years (580 systems).
0
10
–10
–20
20
30
40
50
Financial net bene�ts
Subsidies and taxes
Employment
Value added along the VC
Water use and efficiency
43.2
0.034.4
–5.6
–5.1
Mill
ion
US$
US$ 23 million For 580 systems
INITIAL INVESTMENTOVER 20 YEARS
US$ 37 millionECONOMIC NPV
FINANCIAL IRR
5%
US$ –6 millionFINANCIAL NPV
Note: The sum of the financial NPV and the economic co-benefits and costs is the economic NPV
Source: Authors.
FIGURE 3.10. Input data for the assessment of the technology potential of solar milk coolers in Tunisia.
Milk that cannot easily reach MCCs
Solar milk cooler technical potential
Milk cooler technical potential
Electricity prices and grid distribution
Dairy farms (size of herds/
breeding system)
Percentage of farmers who could benefit
from an intermediate milk cooling step
Capacity of MCCs in regions with poor milk cooling chain
Capacity of a solar milk cooler
Note: Blue boxes represent country-related primary input data, green boxes are calculated data,
white boxes are technical info used and the grey box represents the result
Source: Authors.

62 MEASURING IMPACTS AND ENABLING INVESTMENTS IN ENERGY-SMART AGRIFOOD CHAINS
CO
ST-B
ENEF
IT A
NA
LYSI
S A
T T
HE
CO
UN
TRY
LEV
EL
TABLE 3.13. Data sources for the CBA of solar milk coolers in Tunisia.
Data input International source Source used
Milk production from dairy cows FAOSTAT, 2016 FAOSTAT, 2016
Distribution and capacity of organized MCC network/dairy business units
– Government data
Capacity of MCCs in regions with poor milk cooling chain – Government data
Dairy farms (size of herds / breeding system) – Government data and literature
Grid distribution World Bank, 2016b World Bank, 2016b
Percentage of farmers who could benefit from an intermediate milk cooling step
– Expert opinion
Labour cost ILO, 2017 (for some countries)
Literature
National subsidy for milk price WTO, 2015 and WTO, 2016
WTO , 2015 and WTO, 2016
Milk selling price and value added along the value chain – Government data and literature
Duty on technology import and replacement – Government data
Note: Shaded rows represent country-related primary input data.
Source: Authors.
Barriers to technology adoption
A first major barrier to the adoption of solar milk coolers in Tunisia is the absence of incentives for farmers to improve milk hygiene and quality. In particular, if the milk coming from different farmers is mixed during transportation or at the MCC, all farmers would need to adopt similar quality standards in order to avoid spoilage and rejection. Therefore, trust and cooperation among neighbour farmers is required. The introduction of improved quality checks and refrigeration premiums at national level can significantly contribute to the development of the milk value in Tunisia. For instance, by considering a price premium for cooled milk at MCC level, the financial NPV in the analysis above turns positive.
From the interviews with the national stakeholders, it emerged that the milk value chain is highly regulated (fixed prices) which can limit business opportunities. Since milk is paid for by quantity and not by quality, and given the current collection system, farmers are not encouraged to make efforts to improve milk quality or to invest in a milk cooling system. In particular, young people do not see opportunities in the agricultural sector and look for jobs in other sectors.
On the contrary, the solar sector is quite developed in Tunisia and has governmental support. As the market grows, technology prices can be reduced. Moreover, there is a strong and quite advanced domestic private sector in solar technologies. However, since farmers often have access to cheap grid electricity, solar technology is currently hardly competitive.

63MEASURING IMPACTS AND ENABLING INVESTMENTS IN ENERGY-SMART AGRIFOOD CHAINS
CO
ST-B
ENEF
IT A
NA
LYSI
S A
T T
HE
CO
UN
TRY
LEV
EL
Finally, the initial investment costs for this technology can be quite relevant for small dairy farmers, who typically face difficulties in accessing credit. Potential barriers and risks to the adoption of the solar milk cooler technology in Tunisia are summarized in Table 3.14.
TABLE 3.14. Key barriers to the adoption of solar milk coolers in Tunisia.
Knowledge and information
Organization/ social
Regulations/ institutions
Support services/ structures
Financial returns Access/cost of capital
– Lack of incentives for a farmer to improve milk quality and hygiene
Lack of trust among farmers to mix ‘milks’ with different qualities due to poor quality checks
Business opportunities are limited due to the lack of price premiums for refrigerated quality milk
No appropriate milk quality check at the collection stage (low incentives for farmers to improve milk quality)
Low financial returns
Farmers have access to cheap (subsidized) grid electricity, so solar technologies are hardly competitive
Difficult access to credit for dairy smallholder groups
Source: Authors.
3.1.2 TANZANIA: ENERGY INTERVENTIONS IN THE MILK CHAIN
Value chain description
The dairy sector in Tanzania has undergone several institutional and structural changes in line with changes in government policies: From the socialist, centrally planned economy of the 1970s whereby parastatal dairy farms and processing plants dominated the dairy landscape to the post mid-1990s economic liberation period to date, under which the private sector is playing an important role.
Approximately 37% of the 1.68 million households in Tanzania own cattle and approximately 60% of rural households derive 22% of their income from livestock (DANIDA, 2016). It has been estimated that as much as US$ 286 million per annum could be created above current levels, if all livestock keepers had access to extension services. Only about 20% of small-scale dairy farmers have access to extension services, which impacts the low productivity of cows. Productivity of most of the dairy cows is low, 239 litres of milk per annum on average, while improved dairy cattle average > 1,700 litres per annum on smallholder farms. Large-scale dairy farms average 2,600 to 3,000 litres per lactation, especially in the cool Southern Highlands (MALF Tanzania, 2016).

64 MEASURING IMPACTS AND ENABLING INVESTMENTS IN ENERGY-SMART AGRIFOOD CHAINS
CO
ST-B
ENEF
IT A
NA
LYSI
S A
T T
HE
CO
UN
TRY
LEV
EL
Milk production plays a vital role in Tanzania’s agriculture. © GIZ / Dirk Ostermeier
Currently, Tanzania produces about 2.14 billion litres of milk annually52. Traditional cattle keepers produce about 75% while dairy farmers produce 25% (DANIDA, 2016). Production of milk at household level is typically 2 to 10 litres per day but can exceed 10 litres. About 90% of milk produced in Tanzania is consumed on the farm and barely 10% is marketed with only 3% being formally processed (Makoni et al., 2014; EADD, 2015).
Milk production in Tanzania is based on two farming systems:
• the traditional system based on extensive grazing on mostly communal land by nomadic pastoralists; and
• the more sedentary, sometimes transhumant, agro-pastoralist system.
The traditional system accounts for more than 97% of the cattle population and for 75% of the total milk production (DANIDA, 2016).
52 According to FAOSTAT (2016), milk production was 1.92 million tonnes in 2013 and the total number of dairy cattle was 7.08 million of heads in 2014.
65MEASURING IMPACTS AND ENABLING INVESTMENTS IN ENERGY-SMART AGRIFOOD CHAINS
CO
ST-B
ENEF
IT A
NA
LYSI
S A
T T
HE
CO
UN
TRY
LEV
EL
The structure of dairy farms in Tanzania is as follows:
• Pastoralists (owning 100 to 300 heads of cattle) depend on communal grazing and move around seasonally in search of pastures and water for their cattle. Agro-pastoralist (owning 5 to 10 cattle) feed their livestock on pastures and crop residues during the rainy and dry seasons respectively.
• Smallholder dairy farmers (owning 1 to 10 cows) mostly living in densely populated highlands and around urban areas use the cut-and-carry system of feeding (Mangesho, 2012).
• Medium to large commercial farms commonly practice partial grazing. About 32,100 dairy cattle are retained in such farms (ILRI, 2012). Large scale commercial dairying is therefore relatively less well developed (Lusato et al., 2012).
Most farmers use basic animal husbandry practices. Overall, 71% of rural households, who keep 37% of total Tanzania cattle population, keep between 1 and 10 heads of cattle (Lusato et al., 2012). Access to land has been one of the contentious issues especially with regards to pastoralists who have in-migrated in areas previously not inhabited by livestock keepers.
According to the Ministry of Agriculture, Livestock and Fisheries (MALF), the dairy cattle population in Tanzania has increased by 7.1% per annum from 1995 to 2008 to reach approximately 680,000 (MALF Tanzania, 2016). The main means of breeding cows is natural mating using mostly unproved bulls, a practice that slows down genetic gains between generations of cows. The national livestock census of 2012 established that seven regions, namely Shinyanga, Mwanza, Arusha, Tabora, Singida, Manyara and Mara that cover about 40% of the landmass of Tanzania, account for 65% of the cattle population. The highest densities per km2 were found in Mwanza (101), Mara (88), Shinyanga (73) Arusha (50), Manyara (37) and Singida (33) (NBS, 2012). The density of productive animals is an important parameter for milk value chain integration as it lowers transaction costs especially with regards to milk collection and processing.
The improved dairy cattle farms are a subsystem that is more intensively managed in mixed farming systems such as the coffee-banana perennial crop subsystem in the highland areas of Arusha/Kilimanjaro, in the Coastal belt around Dar es Salaam and Tanga, in the Southern Highlands (Iringa, Mbeya and Ruvuma) and in the Lake region of Kagera (Figure 3.11). The average herd-size per dairy household with improved cattle breeds is four (Mwakaje, 2012).

66 MEASURING IMPACTS AND ENABLING INVESTMENTS IN ENERGY-SMART AGRIFOOD CHAINS
CO
ST-B
ENEF
IT A
NA
LYSI
S A
T T
HE
CO
UN
TRY
LEV
EL
FIGURE 3.11. Improved dairy cattle population in Tanzania by Region, 2008/2009.
130,000 +
100,000 – 130,000
70,000 – 100,000
30,000 – 70,000
0 – 30,000
KILIMANJARO161,984
ZANZIBAR6,880
DAR ES SALAAM24,372
PWANI28,507
LINDI4,199
MTWARA394
RUVUMA12,177
MOROGORO9,414
IRINGA14,258MBEYA
72,724
RUKWA4,149
TABORA2,370
KIGOMA3,077
KAGERA23,863
SHINYANGA5,419
MWANZA3,194
SINGIDA3,409
DODOMA3,473
ARUSHA78,637
MARA2,877
TANGA41,639
Source: EADD, 2015.
This improved cattle subsystem is further subdivided into smallholders and the more commercially oriented medium- and large-scale private farms, government-institution farms (notably research and training institutions), livestock multiplication units, prisons and Jeshi la Kujenga Taifa (JKT) farms, and faith-based organizations/institutions, especially missionaries.
The amount of manure produced per day is between 15 to 44.5 kg per dairy cattle (Raynk, 2004; Kadigi, 2013), depending on the feed management. According to Baitilwakea et al. (2011), cattle manure output in the mainland is about one million tonnes per year. An increase in manure production in populated urban and peri-urban areas leads to scarce areas for disposal, causing problems with odour produced by decomposing manure, polluted water streams and increased breeding of pathogens and flies (Mlozi, 1996; Kadigi, 2013; William and Robert, 2015). Manure disposal in urban area is a challenge and livestock keepers incur substantial costs in disposing it (Chivenge and Six, 2011).
When managed properly, the nutrients in cattle manure can substitute for commercial fertilizers and thus save money spent on fertilizers. There is evidence of economic usage of cattle manure in urban and peri-urban areas of Tanzania as fertilizer in horticulture gardens and biogas production (Kirigia et al., 2013). Use of cattle manure as fertilizer by livestock keepers themselves is yet to be quantified. However, cattle manure can be sold to non-livestock keepers as a source of income. In Tanzania,

67MEASURING IMPACTS AND ENABLING INVESTMENTS IN ENERGY-SMART AGRIFOOD CHAINS
CO
ST-B
ENEF
IT A
NA
LYSI
S A
T T
HE
CO
UN
TRY
LEV
EL
manure is marketed directly to farmers and horticultural farms. In some cases manure is given away free of charge to neighbours. In doing so, livestock keepers are benefiting by cleaning their ground and avoiding the risk of environmental pollution caused by animal waste disposal.
Milk produced in the evening is sold to milk collection centers and industries in the morning of the following day. Households with no refrigerators boil the milk by using firewood to maintain its quality at household level prior to selling53. Milk supply from farm to consumers flows through the informal sector (about 150 million litres/year) and the formal sector (about 64 million litres/year) (DANIDA, 2016). Informal channels are primarily driven by hawkers who buy milk from the farmers and transport it to the nearest town (often on bicycles). Smallholder dairy farmers and large-scale dairy farms account for 70% of the milk flows through the formal channel (i.e. MCCs and milk processing plants) (MALF Tanzania, 2016). 90% of the milk produced by the informal sector is consumed on farm and 10% is sold (8% in informal market and 2% in formal market). The milk from the formal sector instead is produced from dairy herd, and 30% of it is consumed at home while 70% is sold (60% to informal market and 10% to formal) (ILRI, 2013). A study by EADD (2015) stated that in the formal sector milk collection could be grouped into four main models:
(i) Processor – smallholder farmer model;
(ii) NGO/Development Partners facilitation model;
(iii) Cooperative model;
(iv) Processor – large holder farmer model.
Milk vendors use bicycles or motorbikes to collect milk from the farmers and deliver it to the MCCs where the milk is received and chilled until the target quantity is achieved. This can take 2 to 3 days until the total quantity is transferred to the processing plant (EADD, 2015). In some places, farmers are organized in groups aggregated around collection centres. These farmers sell their milk immediately to the MCCs.
Milk is routinely tested for quality at most MCCs since the quality of milk delivered from various farmers is variable. Generally, if farmers have adhered to good animal husbandry practice, most milk could attain first and second class of quality on the basis of bacteriological quality (MALF Tanzania, 2016). Most MCCs apply simple tests such as alcohol tests using 68 to 72% alcohol to test for freshness, and lactometers to check for adulteration (DANIDA, 2016). There is evidence of rejecting poor quality milk at MCCs in Tanzania. However, there is no official data about the amount of milk rejected. Based on personal communication, about 10% of the milk is rejected at the MCC, depending on the season54.
53 Boiling 10 litres of milk using firewood can consume 5 to 7 kg of firewood.
54 Information on milk rejections have been retrieved by personal communication with C. Tumaini, Tanga Fresh Limited, and E. Mariki, Executive Secretary TAMPA, in June 2017.

68 MEASURING IMPACTS AND ENABLING INVESTMENTS IN ENERGY-SMART AGRIFOOD CHAINS
CO
ST-B
ENEF
IT A
NA
LYSI
S A
T T
HE
CO
UN
TRY
LEV
EL
The number of milk processing plants has increased from 7 in 1994 to 23 in 2006, with a total processing capacity of 510,000 litres per day (MLFD, 2006). By 2007, 13 plants had closed down including the privatized ex-TDL Ubungo (Royal Dairies) plant in Dar es Salaam with a capacity of 90,000 litres per day (Mchau et al., 2007). By 2011/2012, additional small plants had come into operation making a total of 48 processing plants with an overall processing capacity of 315,000 litres per day. By 2012, there were approximately 70 private sector milk processing units located in various parts of the country, the majority of which are small, processing less than 1,000 litres a day (Ogutu et al., 2014). More investments from 2013 to 2015 brought the number of processing plants to 83 with a total capacity of 640,800 litres per day (TDB, 2015). The majority of them (80.7%) are small-scale (< 5000 litres per day) and (14.5%) medium-scale (5,000 to 50,000), with only 4 dairy plants (4.8%) being large scale (> 50,000 litres per day). Some plants were closed as of November 2015 (TDB, 2015). The remaining plants with a total capacity of 429,700 litres per day are reported to be processing 167,020 litres per day (TDB, 2015; TLMI, 2015).
The major processing regions are Tanga (26.7%), Dar es Salaam (9.2%), Mara (7.3%), Arusha (6.9%), Kilimanjaro (6.3%) and Iringa (5.4%). The Unguja Island in Zanzibar has become a major milk processing area, processing about 45 000 litres per day, mainly by the Azam Dairies Company which processes mainly imported skimmed milk powder and butter oil for production of ultra-high temperature (UHT) milk (EADD, 2015). Interestingly, a recent study by Kurwijila (2015) showed that most of the plants are located in areas with a high population of improved dairy cattle, and not in the traditional cattle areas. Table 3.15 below presents the performance of processing plants according to size.
TABLE 3.15. Performance of processing plants in Tanzania according to size.
Plant category(l/d)
Number of plants
Working plants(number)
Working plants(%)
Total installed capacity (l/d)
Working plants capacity (l/d)
Volume of milk processed (l)
Utilisa- tion of total capacity(%)
Utilisa- tion of working capacity(%)
Large (> 50,000)
4 (4.8%)
3 75.0 370,000 250,000 97,500 26.4 39.0
Medium (5,000–49,999)
12 (14.5%)
9 75.0 193,000 103,000 35,100 18.2 34.1
Small (< 5,000)
67(80.7%)
65 97.0 77,800 76,700 34,420 44.2 44.9
Total 83 77 92.8 640,800 429,700 167,020 26.1 38.9
Source: MMA (Match Maker Associates Limited), fieldwork analysis, August 2016.
The overall installed plant capacity utilization remains low at 26.1%. This is symptomatic of a poorly organized sector that is beset with a number of challenges, which include (i) operational inefficiencies, (ii) weak marketing and collection infrastructure, (iii) weak organizational and institutional support especially for smallholder farmers, as well as (iv) business-unfriendly policies and regulatory frameworks.

69MEASURING IMPACTS AND ENABLING INVESTMENTS IN ENERGY-SMART AGRIFOOD CHAINS
CO
ST-B
ENEF
IT A
NA
LYSI
S A
T T
HE
CO
UN
TRY
LEV
EL
One specific challenge is the lack of cooling facilities at the MCCs. By 2015, only 30% of the 183 MCCs had cooling facilities. This lack in most cases is due to a lack of electricity supply or alternative source of energy in the villages or small quantities of milk available for collection. Most MCCs are affected by unreliable power supply and are forced to use generators, resulting in extra fuel costs (DANIDA, 2016)55. Without cooling facilities at the MCC, the dairy cooperative or processor does not collect the evening milk from the farmers due to a high probability of rejection at the next value chain stage. As milk goes wasted in a short time in high temperature it cannot be stored at the MCC for several hours without cooling. Since transportation to the processing unit typically does not happen more than once per day, the MCC is not used at its full capacity.
Average milk prices fluctuate seasonally but have fallen dramatically over the last decade from about US$ 0.4/l in 2000 in some areas to about US$ 0.3/l in 2012.
Locally produced and processed milk has increased from a maximum of approximately 40 million litres in 1977 to about 122,000 litres per day, or, if imported recombined milk is included, to 167,020 litres per day in 2015. The share of processed milk declined from approximately 15% of total milk production in 1965, to 10% in 2010 to 2014. By 2015, only 3% (45 million litres) of the total milk production (2.14 billion litres) was processed. About 70 million litres of liquid milk equivalent (LME) are imported. The size of the market for processed dairy products is estimated to be 134 million litres of LME. In addition, considering that some 214 million litres are marketed off farm, the total market of processed and unprocessed milk can be estimated to stand at 348 million litres of milk annually, equated to 10% of all the milk produced in the country. The un-commercialised, domestic consumption continues to syphon 1.9 billion litres (90%) of the milk produced (more than 86% of marketed milk from local production is sold to neighbours in the vicinity of producing households) (Lusato et al., 2012). Notably, whereas there is a wide array of dairy products in the market, the range of products produced locally is narrow, and are mainly limited to: fermented milk, sour milk, pasteurized fresh milk, yoghurt and to a small extent, cheese, butter and ghee.
Currently, Tanzania is a net importer of processed milk products worth on average US$ 20 million per annum. Imported high value dairy processed products such as milk powder, UHT milk, cheese, butter and ice cream cost as much as double the price of locally manufactured products of a similar type. Milk powder makes up about 80% of imports, including products in the form of milk powder (i.e. full cream, whole and skimmed milk), followed by UHT milk, cheese and butter (TRA, 2016). Imported milk and milk products from Ireland, Uganda, Kenya, South Africa, Oman, United Kingdom, France, Poland, Denmark, New Zealand, Netherlands, Brazil, Singapore and the United Arab Emirates are available in the market. Imports from Kenya are mainly UHT milk, yoghurt and cream (MMA, 2016). A number of studies documented that Tanzanians prefer fresh milk. A study conducted by Kurwijila et al. (1995) shows that
55 A generator with a capacity to run more than 15 hours consumes an average of 5 to 7 litres of fuel per hour. Hence, it is important to include the investment costs of a standby generator of 28 to 40 kVA depending on the size of the tank (DANIDA, 2016).

70 MEASURING IMPACTS AND ENABLING INVESTMENTS IN ENERGY-SMART AGRIFOOD CHAINS
CO
ST-B
ENEF
IT A
NA
LYSI
S A
T T
HE
CO
UN
TRY
LEV
EL
79% of milk consumers purchase raw milk. Most consumed dairy processed products in Tanzania are UHT milk, powdered milk, processed fresh milk and sour milk.
The market is characterised by a generally low annual per capita consumption of dairy products, currently estimated at 47 litres, an amount which is merely 24% of the amount recommended by the FAO to meet the national nutritional requirements (MALF Tanzania, 2016). Processed dairy products are mainly marketed and consumed in the urban and peri-urban areas, by consumers of the medium to high-income category.
The International Livestock Research Institute (ILRI, 2013) projected that growth in population, urbanisation and incomes will spiral the market growth by 60% by 2020. At constant cattle productivity and observed herd growth rates, milk production would increase by 41%, hence resulting in an annual milk deficit of 673 million litres, equivalent to 26% of demand. If the current initiatives to increase per capita consumption (e.g. through school milk programs) are intensified and sustained, per capita consumption will increase. However, if the intensity of efforts targeting increasing supply does not match that of efforts to increase consumption, the country will remain a net importer of milk and dairy products.
GENDER ANALYSIS Rural women in Tanzania face social and structural barriers that lower their access to property (land), credit, agricultural inputs, markets, agricultural co-operatives and agricultural services such as extension, compared to men (IFAD, 2016b). Poverty rates are high among women with a reported 60 percent living in absolute poverty (Kato and Kratzer, 2013). Root causes of their poverty include their heavy and time-consuming workloads at home, on-farm and off-farm, high levels of illiteracy, and a lack of voice and representation at the household, group, community and national level. Female-headed households, whose women are widowed, deserted or divorced, make up 25 percent of all households in Tanzania (World Bank, 2015).
The gender analysis of smallholder dairy farming in Tanzania shows that cattle are predominantly owned by men, both in male-headed households and when comparing cattle ownership between male-headed (27 percent) and female-headed households (17 percent) (ILRI, 2014). This has a direct bearing on who makes decisions in households and dairy associations about cattle husbandry and income, including income from livestock products such as milk. Common problems for both male-headed and female-headed households include inadequate access to feed, breeding services, credit and animal health services. Vaccination rates are generally low, especially among poor female-headed households (ILRI, 2014).
Although variations in gender roles and responsibilities occur between pastoral and agro-pastoral communities, evidence suggests that women are generally involved in feeding, milking and selling milk (to neighbours, the local population through milk kiosks and street stalls and to MCCs). Even though women sell the milk, men have traditionally controlled the income generated. However, research suggests that this is changing as women are becoming more empowered at home and also due to dairy cooperatives where they make up a higher proportion of members. There is the risk,

71MEASURING IMPACTS AND ENABLING INVESTMENTS IN ENERGY-SMART AGRIFOOD CHAINS
CO
ST-B
ENEF
IT A
NA
LYSI
S A
T T
HE
CO
UN
TRY
LEV
EL
however, that as milk production and marketing become more profitable, men are more likely to step in and take over. Men transport milk from the farm to MCCs.
ENERGY ASPECTSIn 2015, the energy consumption in Tanzania was composed of residential (67%), followed by industry (15%), transport (10%), agriculture (4%) and others (3%) (IEA, 2018). The national energy balance indicates a dominance of biomass use in the form of charcoal and firewood, contributing about 85% to the total national energy consumption. Regarding energy for cooking, firewood is used by about 71.2% of households in Tanzania Mainland, followed by charcoal (37.0%), liquefied petroleum gas (LGA) (7.2%), kerosene (5%) and use electricity (0.3%) (NBS and REA, 2017). Biomass is dominantly burned in traditional three-stone stoves or in inefficient charcoal making Kilns, and is unsustainably harvested from forest resources (AfDB, 2015).
Petroleum products contribute about 9.3% to the total energy consumed while electricity accounts for 4.5% and coal and renewable energies for 1.2% (MEM Tanzania, 2015). About 56% of grid electricity utilized in the country is generated from natural gas, 31% from hydropower and 13% from liquid fossil fuel (EWURA, 2016). Per capita energy consumption in 2014 was 104.79 kWh, and demand is rapidly increasing due to an increase in consumption and newly connected households (AfDB, 2015).
About 30% of all Tanzania Mainland households are electrified (use electricity at household level): 74.9% of electrified households are connected to the grid electricity, 24.7% use electricity from installed solar power systems and 0.3% get electricity from (private entity) Independent Power Producers (IPPs) (NBS and REA, 2017). About 46% of rural residents live close to the grid, 20% live far from it but in high density population areas, and 33% live far away in low-density settlements (AfDB, 2015).
FIGURE 3.12. Gender roles along the milk value chain in Tanzania.
Inputs• Feeding the cows• Routine animal
health• Veterinary services• Insemination
services• Feed purchasing
Production• Milking• Nursing the cows • Milk selling• Cooperative
members• Cooperative
members
Transport & Collection• Transportation
Storage & Handling• Milk collection
centres
Processing
• Formal processing plants
Legend: Size of the men/women icons indicates the extent of their participation in each step of the chain.
Orange font: Activities usually performed by women; Blue font: Activities typically done by men.
Source: Authors.

72 MEASURING IMPACTS AND ENABLING INVESTMENTS IN ENERGY-SMART AGRIFOOD CHAINS
CO
ST-B
ENEF
IT A
NA
LYSI
S A
T T
HE
CO
UN
TRY
LEV
EL
Electricity in the country is provided by a central grid, owned by the state utility TANESCO and by isolated mini-grids in remote areas. A process of interconnecting the grids is slated to be completed by 2019, together with the reinforcement and upgrading of actual lines. Electricity production has been dominated to date by large hydro, but due to extensive droughts in the country in recent years, their contribution to the total supply has fallen dramatically. This has forced the utility to use extensive load shedding, use thermal power plants for base load and hire emergency power installations, thus increasing the generation cost (AfDB, 2015).
National electricity access rate in 2014 was 36% (11% in rural areas). The Power System Master Plan (PSMP) updated in 2012 expects the country to reach 75% by 2035. Installed capacity is projected to increase seven-fold to meet demand. The country is also developing a Sustainable Energy for All (SE4All) Action Agenda, setting its energy objectives for access, renewables and energy efficiency for the year 2030 (AfDB, 2015).
Electricity tariffs by TANESCO are reported in the table below.
TABLE 3.16. Electricity tariffs by TANESCO.
Domestic Low Usage
General Usage Low Voltage Max
High Voltage Max
Zanzibar
Low energy (0–50 kWh) per kWh
0.027 US$ (60 TZS)
– – – –
High energy charge per kWh (> 50 kWh)
0.12 US$ (273 TZS)
– – – –
Service charge per month
– 7.72 US$ (3,841 TZS)
6.37 US$ (14,233 TZS)
6.37 US$ (14,233 TZS)
6.37 US$ (14,233 TZS)
Demand charge per kVA
– – 7.58 US$ (16,944 TZS)
6.49 US$ (14,520 TZS)
5.40 US$ (12,079 TZS)
Energy charge per kWh
– 0.10 US$ (221 TZS)
0.06 US$ (132 TZS)
0.05 US$ (118 TZS)
0.05 (106 TZS)
Source: TANESCO, 2016.
Most parts of Tanzania have abundant solar resources throughout the whole year with the low point occurring in July. The lowest annual average is 15 MJ (or 4.2 kWh)/m2/day and the highest is 24 MJ (or 6.7kWh)/m2/day. Solar radiation is especially high in the country’s central region, and off-grid as well as grid-connected solutions are being developed. In 2015, about 6 MWp of off-grid solar PV electricity has been installed countrywide for various applications (AfDB, 2015). More than half of this capacity is utilised by households in peri-urban and rural areas. Government has supported a number of solar PV programmes that target off-grid areas where the cost of lighting from solar is less than from a diesel generator or kerosene. An example is Rural Energy Agencie’s (REA) Lighting Rural Tanzania competitive grant programme (financed under the African Evaluation Association (AFREA) and Tanzania Energy Development and Access Project (TEDAP)), which supports private enterprises in developing new business models to supply affordable energy in rural areas (AfDB, 2015).
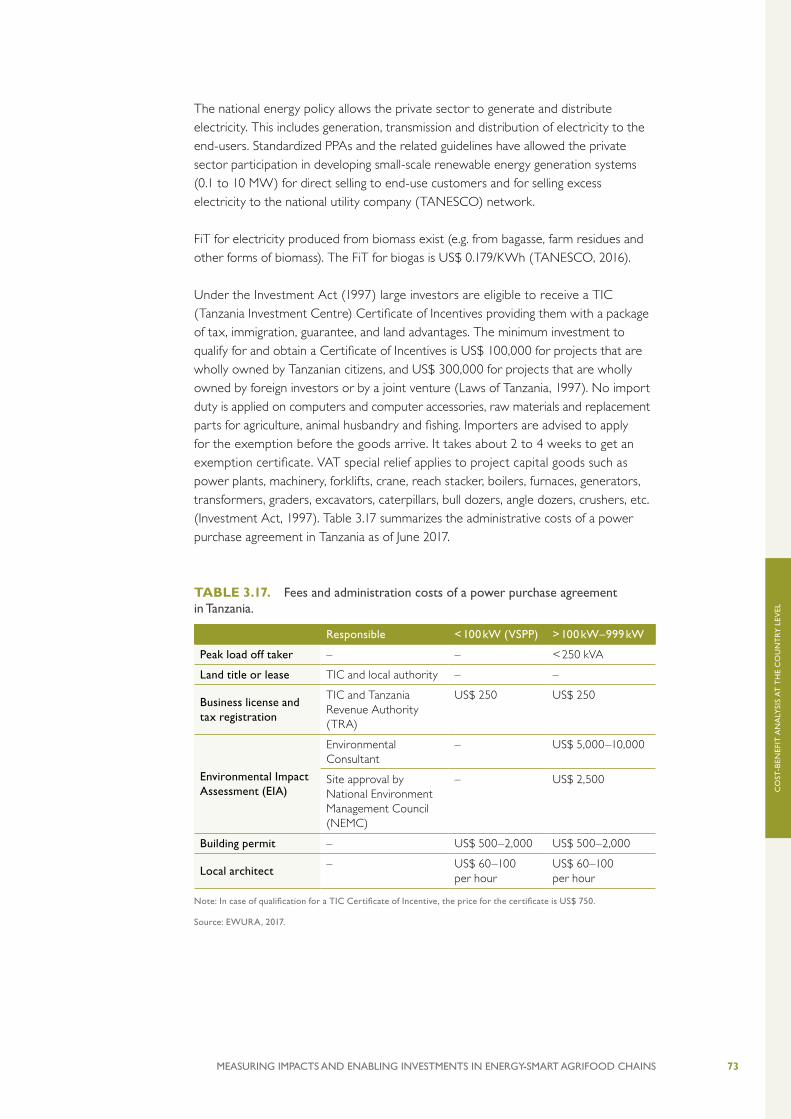
73MEASURING IMPACTS AND ENABLING INVESTMENTS IN ENERGY-SMART AGRIFOOD CHAINS
CO
ST-B
ENEF
IT A
NA
LYSI
S A
T T
HE
CO
UN
TRY
LEV
EL
The national energy policy allows the private sector to generate and distribute electricity. This includes generation, transmission and distribution of electricity to the end-users. Standardized PPAs and the related guidelines have allowed the private sector participation in developing small-scale renewable energy generation systems (0.1 to 10 MW) for direct selling to end-use customers and for selling excess electricity to the national utility company (TANESCO) network.
FiT for electricity produced from biomass exist (e.g. from bagasse, farm residues and other forms of biomass). The FiT for biogas is US$ 0.179/KWh (TANESCO, 2016).
Under the Investment Act (1997) large investors are eligible to receive a TIC (Tanzania Investment Centre) Certificate of Incentives providing them with a package of tax, immigration, guarantee, and land advantages. The minimum investment to qualify for and obtain a Certificate of Incentives is US$ 100,000 for projects that are wholly owned by Tanzanian citizens, and US$ 300,000 for projects that are wholly owned by foreign investors or by a joint venture (Laws of Tanzania, 1997). No import duty is applied on computers and computer accessories, raw materials and replacement parts for agriculture, animal husbandry and fishing. Importers are advised to apply for the exemption before the goods arrive. It takes about 2 to 4 weeks to get an exemption certificate. VAT special relief applies to project capital goods such as power plants, machinery, forklifts, crane, reach stacker, boilers, furnaces, generators, transformers, graders, excavators, caterpillars, bull dozers, angle dozers, crushers, etc. (Investment Act, 1997). Table 3.17 summarizes the administrative costs of a power purchase agreement in Tanzania as of June 2017.
TABLE 3.17. Fees and administration costs of a power purchase agreement in Tanzania.
Responsible < 100 kW (VSPP) > 100 kW – 999 kW
Peak load off taker – – < 250 kVA
Land title or lease TIC and local authority – –
Business license and tax registration
TIC and Tanzania Revenue Authority (TRA)
US$ 250 US$ 250
Environmental Impact Assessment (EIA)
Environmental Consultant
– US$ 5,000 –10,000
Site approval by National Environment Management Council (NEMC)
– US$ 2,500
Building permit – US$ 500– 2,000 US$ 500 – 2,000
Local architect– US$ 60–100
per hour US$ 60 –100 per hour
Note: In case of qualification for a TIC Certificate of Incentive, the price for the certificate is US$ 750.
Source: EWURA, 2017.

74 MEASURING IMPACTS AND ENABLING INVESTMENTS IN ENERGY-SMART AGRIFOOD CHAINS
CO
ST-B
ENEF
IT A
NA
LYSI
S A
T T
HE
CO
UN
TRY
LEV
EL
License application requires the submission of a feasibility study, a business plan, site maps and a land use plan of which the total estimated cost is US$ 1,000–2,000 (EWURA, 2017).
The grid connection cost is influenced by the distance to the connection point. For example, a connection to the grid from an IPP located 1 km away from the electricity grid, costs around US$ 40,000.
In terms of experience on biogas digestion from agricultural residues, the Centre for Agriculture Mechanization and Research of Technologies (CAMARTEC) implemented a four-year country-wide Tanzania Domestic Biogas Programme (TDBP) from 2009 to 2013, supported by the Netherlands, aimed at constructing 12,000 digesters of various sizes for household cooking and lighting and electricity production (AfDB, 2015). Biogas small-scale digesters have been promoted and installed in the country and trained and qualified technicians are available locally. These are traditional anaerobic digesters constructed with bricks, cement, sand and pipe fittings for households use, with a small capacity between 4 to 13 m3. However, there are experienced technicians who can install systems of relatively larger capacity up to 60 m3.
Technologies assessed
Given the current structure of the milk sector in Tanzania, there is no potential market for biogas for power generation from manure. In fact, there are very few large zero-grazing farming units (i.e. around five, based on the information collected from local experts) as cattle management practices for large cattle are predominantly free-grazing. Therefore, the CBA for biogas for power generation is not performed in the Tanzanian case study. Instead, both biogas-powered milk chilling at small farm level and solar milk coolers at MCCs are technologies with high potential.
In Tanzania, raw milk is not cooled at farm level, especially from small-scale dairy farmers, hence the quality of evening milk is compromised by the heat overnight. Tanzania Mainland has around 11.5 million households (NBS and REA, 2017), most of which are off-grid and do not have refrigerators (even households connected to the grid sometimes have no refrigerator). Only 8.3% and 0.7% of the Tanzanian households own refrigerators and freezers respectively (NBS and REA, 2017). As a result, a very high amount of low-quality evening milk is rejected by MCCs. This makes the small-scale biogas-powered milk chiller a very relevant technology. The technology can help small-scale dairy farmers to meet the quality standards required to access the formal sector, which increases their income, increases milk supply and thereby increases food security. Biogas is also used for cooking, cooling and other small applications at household level, thus displacing solid fuels traditionally used for cooking, while the slurry is used as organic fertilizer on farm. As reported by SNV (2014), 50% of active formal farmers in Tanga region (most important processing region) are not delivering evening milk to the milk collection farm. Cooling at farm level would result in benefits also to the dairy cooperatives and dairy processors including: increased loyalty of members for milk delivery, increased intake of evening milk, reduced milk rejection, reduced electricity use for cooling milk, increased utilisation of installed processing capacity and improved quality of collected milk.

75MEASURING IMPACTS AND ENABLING INVESTMENTS IN ENERGY-SMART AGRIFOOD CHAINS
CO
ST-B
ENEF
IT A
NA
LYSI
S A
T T
HE
CO
UN
TRY
LEV
EL
In most of the cases in Tanzania raw milk is transported to milk collection facilities without any cooling. Chilling of raw milk at collection centres decreases the risk and cost of spoiling due to delays in transport. Lack of a reliable electricity supply and the small quantity available for collection in the villages are among the biggest challenges affecting the milk value chain in Tanzania. Currently there are 183 MCCs in Tanzania of which only 30% have cooling facilities (MALF Tanzania, 2016)56. Moreover, using electricity is expensive (especially if the cooling tank is used at low capacity), and some MCCs prefer to boil milk using firewood (at no cost) and cool it using tap water. This is a highly unsustainable practice. Small dairies using electricity for boiling and cooling between 600 to 1,500 litres cultured and fresh milk per day, can consume around 100 kWh/day or 3,000 kWh/month. The average milk collected daily per MCC varies between approximately 200 litres in Arusha and 1,000 litres in Tanga region (DANIDA, 2016). Solar milk coolers with 600 litres capacity can provide cold storage at the MCCs without cooling facility.
TABLE 3.18. Energy interventions considered for the milk value chain in Tanzania.
56 Some dairies owning a cooling tank do not use it. For example, the Ndeweni Milk Collection Centre in Moshi Rural, Kilimanjaro Region, has a cooling tank of 1,500 litres which is not used because the collection of milk per day is too low (only 200 to 350 litres) and the milk is normally sold within a few hours.
Biogas for power generation from dairy cattle
Biogas domestic milk chiller Solar milk cooler
• Dairy cattle management is pre-
dominantly free-grazing. Only a very few large dairy farms practice zero-grazing with cows on feedlots from where the manure can be easily collected.
• Most households and farms are not electrified.
• Because raw milk is not cooled by most small-scale dairy farmers, the quality of evening milk is compromised by the ambient heat overnight. In most cases, low-quality evening milk is rejected by MCCs. Cooling the milk overnight will significantly reduce rejection.
• Lack of a reliable electricity supply in the villages is a major challenge.
• 70% of the milk is transported from MCCs to milk processing factories without any cooling.
• Currently, only 30% of the 183 MCCs have cooling facilities.
Source: Authors.
BIOGAS DOMESTIC MILK CHILLER
Technology potential
The following underlying assumptions have been used to estimate the market size for the biogas domestic milk chiller technology (BDMC) in Tanzania:
• Households with 1 to 10 cattle are the targeted market for this technology.
• Households rearing improved breeds are currently the serviceable market for the BDMC, as they apply more zero-grazing and have milk available for sale that they might want to preserve using the milk chiller.

76 MEASURING IMPACTS AND ENABLING INVESTMENTS IN ENERGY-SMART AGRIFOOD CHAINS
CO
ST-B
ENEF
IT A
NA
LYSI
S A
T T
HE
CO
UN
TRY
LEV
EL
• Households rearing improved breeds are currently the serviceable market for biogas powered milk chiller, as they apply more zero grazing, and have milk available for sale that they might want to preserve using the milk chiller to benefit from the advantages described above;
• Households with access to the grid have little incentive to purchase a biogas system and therefore are excluded from the calculation.
Based on the data in Table 3.19 and assumptions highlighted above, the total available market for the BDMC would be approximately 1.2 million households, while the serviceable market at the moment is around 153,000 households, which is considered the technical potential for this technology.
TABLE 3.19. Technology potential of biogas domestic milk chillers in Tanzania.57
Information used Value Source
Total number of cattle rearing 23 million MALF Tanzania, 2016
Number of cattle rearing households 1,698,579 NBS, 2012
Share of households with 1–10 cattle herd size57 71% NBS, 2012
Number of households with 1–10 cattle 1,212,145 NBS, 2012
Number of improved dairy cattle 780,000 TLMI, 2015
Number of households keeping improved dairy cattle 218,418 MALF Tanzania, 2015
Percentage of household without access to electricity 70% NBS and REA, 2017
Number of households without access to electricity keeping improved dairy cattle
152,893 Authors' calculation
Source: Authors.
Cost-benefit analysis
FINANCIAL CBAThe system operating time is 3.5 hours per day, therefore the annual operating time amounts to 1,278 hours. Using a wage rate of US$ 0.23 per hour, annual labour cost equivalent amounts to US$ 294 (Trade Union Congress of Tanzania, 2016). It is assumed that no cost for land (rent) is incurred. Total variable costs (i.e. costs for maintenance, operating, labour and rent) vary and are on average US$ 343.
Cow feed cost is not considered as already present in the benchmark scenario. For the farmer adopting the technology, benefits arise from milk revenues (which amount to US$ 4.34 per day and US$ 1,584 annually), from the slurry/manure which can be applied to his or her own farm (additional annual benefit of US$ 408) and from using the cookstove. In fact, by using the cook stove, a fuel saving of US$ 250 per year and a time saving of 730 hours per year are achievable. With average variable costs of US$ 343 and benefits of US$ 2,242, total financial benefits from using biogas are worth US$ 1,899 annually.
57 The average herd-size per dairy household with improved cattle breeds is four (Mwakaje, 2012).

77MEASURING IMPACTS AND ENABLING INVESTMENTS IN ENERGY-SMART AGRIFOOD CHAINS
CO
ST-B
ENEF
IT A
NA
LYSI
S A
T T
HE
CO
UN
TRY
LEV
EL
The net incremental benefit (i.e. additional benefit arising from the use of a milk chiller) is obtained by deducting the benefits obtained when no milk chiller is used from the benefits arising when a milk chiller is used. The average net incremental benefits total US$ 1,450, implying that using a milk chiller is two times more beneficial than not doing so.
The net incremental benefit is discounted to arrive at its present value. The incremental benefit is discounted for 10 years, the lifetime of the milk chiller. The discounted net incremental benefits reduce over the lifetime of the technology. The initial outlay of the technology, the NPV of the technology is US$ 4,928 and the IRR is 85%, making it an attractive investment.
ECONOMIC CBA
Value added along the value chainWhen a biogas powered domestic milk chiller is used, more milk is likely to be marketed in formal channels. However, in Tanzania most of the milk chilled by a BDMC is sold fresh to neighbours or local informal markets and not processed. The value added down the value chain per litre of milk in informal channel is estimated to be about TZS 100 (or US$ 0.05) per litre (FAO and GIZ, 2018). As the BDMC delivers an additional 7 litres per day into the market, about US$ 128 (= 7 litres/day x US$ 0.05 x 365) are added in terms of value in a year due to the introduction of the technology.
A biogas milk chiller can work without access to a grid, thereby improving opportunities for remote farmers. © GIZ/Alex Kamweru

78 MEASURING IMPACTS AND ENABLING INVESTMENTS IN ENERGY-SMART AGRIFOOD CHAINS
CO
ST-B
ENEF
IT A
NA
LYSI
S A
T T
HE
CO
UN
TRY
LEV
EL
Subsidies and taxes According to SimGas subsidy for equipment is US$ 120. However, the Energy Subsidy Policy is still waiting for approval by the Government of Tanzania58. From the 1st January 2005, the East African Community Customs Union came into force for Tanzania, Kenya and Uganda (i.e. the Partner states). The implication is a common external tariff in respect of all goods imported in Tanzania, Kenya and Uganda from foreign countries. For instance, imported duty on equipment is 10% per year.
Assessment of environmental and socio-economic impacts at national level
TABLE 3.20. Environmental and socio-economic impacts associated with the technical potential of biogas domestic milk chillers in Tanzania (153,000 systems).5960
Impact Description Impact indicator
Monetized impact
Fertilizer use In Tanzania most small households use cattle manure instead of chemical fertilizers, therefore the change in the amount of chemical fertilizer applied is negligible.
– –
Water use and efficiency
A 6 m3 digester system requires between 50 and 100 litres of water per day, depending on manure quality and other factors. At national level, this is estimated to be about 4,185 million litres of water per year.When the resulting digestate is applied to soils, it increases soil moisture if compared with simple (and semi-dried) manure application. In biophysical terms, the overall water consumption could therefore decrease, since water can be used more efficiently as digestate moisture rather than in traditional irrigation systems. However, this impact is already covered in the financial assessment as a benefit deriving from digestate application (in terms of increased yields, etc.). The water footprint of the milk loss avoided59 does not counterbalance the water consumed by the digester. Even assuming a water footprint of milk in Tanzania of 1 litre/day, around 3,795 million litres of water per year are required60. Assuming a value of water of US$ 0.002/m3 (Michael et al., 2014), at national level, the cost of water use is around US$ 9,392/year.
Around 3.8 billion litres/year
US$ 9,400/year
Food loss The domestic milk chiller offers farmers the chance to market higher volumes of milk. This will also result in more milk for formal channels, and therefore value added down the value chain.
391 million litres milk/year
Considered in the financial CBA (US$ 121 million/year) and value added (US$ 20 million/year)
Land requirement
No impact since the milk chiller is kept in the house and the biogas system requires a negligible size of land.
– –
58 MEM Energy Subsidy Policy 2013 (Draft).
59 The water footprint of the milk throughout the value chain is on average 2.7 litres/day per litre of milk according to FAO/USAID (2015) but is significantly lower in household livestock managing practices.
60 In a few cases, the chiller replaces the traditional milk cooling method of putting churns in cold water baths, thus contributing to additional water savings. However, these are exceptions and therefore not considered as the benchmark for the CBA.

79MEASURING IMPACTS AND ENABLING INVESTMENTS IN ENERGY-SMART AGRIFOOD CHAINS
CO
ST-B
ENEF
IT A
NA
LYSI
S A
T T
HE
CO
UN
TRY
LEV
EL
GHG emissions The only emissions which can be directly accounted for are those avoided due to the use of biogas for cooking. The use of a clean cookstove instead of traditional cooking fuels reduces GHG emissions of between 6 and 8 tonnes CO2eq/year. Since only 24% of fuelwood is considered non-renewable, net GHG saving for each domestic system is 1.68 tonnes CO2eq/year (FAO and GIZ, 2018).At national level, this amounts to 257,000 tonnes CO2eq/year. By applying a price of US$ 36/tCO2eq (growing at 2.3% per year), this is equal to about US$ 9 million/year.
257,000 tonnes CO2eq/year
US$ 9 million/year
Health risk due to indoor air pollution
Biogas is a clean cooking fuel and thereby takes away the health hazards of indoor air pollution. In East Africa, 95% of households use wood or charcoal (Schmitz/GTZ, 2007) and the inhalation of acrid smoke and fine particulates causes risk of skin, eye and lung diseases. In Tanzania, lower respiratory infections are the second main cause of death (WHO, 2015c). About 153,000 women may be affected by the introduction of clean cookstove (one per household). SimGas estimates that the healthcare costs avoided for diseases related to cookstoves are about US$ 20–30 per household per year, while other studies find smaller values (US$ .03, US$ 0.41 and US$ 0.08 per household per year in Kenya, Sudan and Nepal, respectively) (Malla et al., 2011). By assuming a value of US$ 20/year per household, at national level, the avoided health costs are about US$ 3 million/year.
153,000 women
US$ 3 million/year
Fossil fuel consumption
No impact since in the benchmark situation the milk is not cooled and biogas substitutes woodfuel for cooking.
– –
Access to energy The system improves access to energy for both male- and female-headed households. It is difficult to estimate how many of the 25% of female-headed households would benefit considering that they generally own fewer cattle and have lower access to credit and new technologies. They would need to be specifically targeted.Assuming on average 4.7 people per household (NBS, 2014), about 718,595 people can be affected at national level.
719,000 people
Household income
The impact on household income includes additional revenues from milk selling, from using the digestate and from savings on fuel due to the introduction of the cookstove. Increased household income from sales of milk will largely be controlled by men, unless efforts are continued to empower women at home and in dairy cooperatives. There is also the risk that men will take over the production and marketing of milk by women if it becomes more profitable.Assuming on average 4.7 people per household (NBS, 2014), about 718,595 people can be affected at national level.
719,000 people
Considered in the financial CBA (US$ 222 million/year)
Time saving The biogas cookstove saves 2 to 4 hours a day for fuel- wood collection and/or purchase, cooking and cleaning. All activities usually undertaken by women. The dairy farmer (man or woman) transports the milk in churns of varying size by foot, bicycle or motorbike (depending on the travel distance) to the MCC twice a day, or hires a worker who has various jobs on the farm such as feeding cows, collecting manure, feeding the digester, fetching water, etc. The average time to travel from dairy
– –

80 MEASURING IMPACTS AND ENABLING INVESTMENTS IN ENERGY-SMART AGRIFOOD CHAINS
CO
ST-B
ENEF
IT A
NA
LYSI
S A
T T
HE
CO
UN
TRY
LEV
EL
farm to collection centre and back is 73 minutes61. For two deliveries, this takes about 2 hours and 43 minutes per day. If the evening milk can be cooled and kept cool overnight in the milk chiller, it can potentially be sold in the morning together with the morning milk, thereby saving half the delivery time.Depending on the context, the biogas system may require additional water that may need collecting, using buckets, a wheelbarrow or a donkey. While women are normally responsible for domestic water collection, calling on their children for support when required, men can sometimes collect water for productive purposes, including livestock watering. The overall impact on time saving is context-specific and cannot be estimated for a ‘typical’ intervention of this kind.
Employment The introduction of the milk chiller does not have an impact on paid employment. However, the development of a market for biogas domestic milk cooler can create employment in the biogas sector. A trained technician in Tanzania costs about US$ 3,000 per year (SimGas, personal communication, 201762). To install and maintain 153,000 systems, about 1,000 full-time technicians would be required. This would generate employment for a value of about US$ 3 million/year. Given the higher rate of illiteracy and fewer technical skills of rural women compared to men, the technicians are more likely to be men, unless women are proactively trained and empowered to take on the role as well.
1,019 full-time skilled technicians
US$ 3.1 million/year
Colour code: Positive impact Variable impact Negative impact No or negligible impact
Source: Authors
PROFITABILITY Both cumulative incremental benefits and additional economic benefits increase over the lifetime of the technology, as presented in Figure 3.13. Table 3.21 summarizes the financial and economic costs and benefits associated with the adoption of the BDMC, both at intervention level and at national level. The investment is already positive from a financial point of view. The main additional economic benefit is a value added of US$ 128/year.
TABLE 3.21. Financial and economic CBA of biogas domestic milk chillers in Tanzania.
COSTS Unit Value (single intervention)
Value (at scale: 153,000)
Notes
COSTS
Installation cost
Thousand US$
1.6 244,628 Assumption (for a 6m³ digester, milk chiller, stove, installation, piping, training and 2 years full service).
61 According to market studies by SNV in Tanzania/Kenya/Zambia.
62 Information retrieved by an interview with D. Poelhekke, SimGas, 2017.

81MEASURING IMPACTS AND ENABLING INVESTMENTS IN ENERGY-SMART AGRIFOOD CHAINS
CO
ST-B
ENEF
IT A
NA
LYSI
S A
T T
HE
CO
UN
TRY
LEV
EL
Replacement costs
US$ US$ 15 every 5 years for cookstove + US$ 20 every year for pellets for milk chiller
US$ 2.3 million every 5 years for cookstove + US$ 3 million every year for pellets for milk chiller
FAO and GIZ, 2018
Operating cost: Additional labour cost (equivalent)
Thousand US$/year
0.29 44,924 Assuming that non-paid on-farm work has an opportunity cost equal to US$ 0.23/h (Trade Union Congress of Tanzania, 2016).
Subsidy for equipment
Thousand US$
0.12 18,347 At year 0 (AllAfrica, 2016).
Water use Thousand US$/year
0.06 9,392 Assuming a value of water of US$ 0.003/m3 (Michael et al., 2014).
BENEFITS
Additional income from milk sales
Thousand US$/year
0.79 121,099 Milk farm gate price: US$ 0.31/litre; additional quantity sold per day: 7 litres.
Digestate Thousand US$/year
0.41 62,380 FAO and GIZ, 2018
Savings on cooking fuel
Thousand US$/year
0.25 38,223 Due to cookstove (FAO and GIZ, 2018).
Tax revenues from duty on technology import
US$/year US$ 1.5 every 5 years for cookstove + US$ 2 every year for pellets for milk chiller
US$ 0.2 million every 5 years for cookstove + US$ 0.3 million every year for pellets for milk chiller
Duty of 10% on imported equipment (Ministry of Finance and Planning Tanzania, 2016).
Value added US$/year 128 19,570 Authors’ estimate based on FAO and GIZ, 2018.
GHG emission avoided
Thousand US$/year
0.06 9,247 Only 24% of fuelwood is considered non-renewable, resulting in a net GHG saving of 1.68 tonnes CO2eq/year.
Health risk due to indoor air pollution
Thousand US$/year
0.02 3,058 US$ 20 healthcare costs avoided related to cookstoves, per household per year (SimGas estimate).
Employment creation
Thousand US$/year
0.02 3,058 10 technicians can install and maintain about 1,500 systems. A trained technician in Tanzania costs about US$ 3,000 per year (SimGas, personal communication, 201763).
PROFITABILITY INDICATORS
Financial NPVThousand US$
4.9 753,389
Financial IRR % 85%
Economic NPVThousand US$
5.9 904,983
Economic IRR % 92%
Note: Life expectancy of the technology is 10 years (lifetime of the milk chiller). Discount rate is 16%. Financial costs and benefits are in orange. Economic costs and benefits are in green.
Source: Authors.63
63 See note 62.

82 MEASURING IMPACTS AND ENABLING INVESTMENTS IN ENERGY-SMART AGRIFOOD CHAINS
CO
ST-B
ENEF
IT A
NA
LYSI
S A
T T
HE
CO
UN
TRY
LEV
EL
RESULTSBDMCs are an interesting energy intervention for the milk value chain in Tanzania. From a financial point of view, the system pays back in less than three years, due to the additional income from milk selling, the value of digestate as fertilizer and the savings on fuel for cooking (assuming that the surplus biogas produced is used for cooking). The only additional financial cost is the time required to feed the digester (monetized as an opportunity cost as labour cost).
From an economic point of view, the adoption of BDMCs generates value added down the milk value chain and additional revenues for the state thanks to duty imports on the milk chiller and the cookstove. The avoided woodfuel used for cooking brings benefits in terms of GHG emissions and of health risk due to indoor air pollution, particularly for women. The adoption of the technology generates employment in the biogas sector and has a positive (not monetized) impact on access to energy. The only negative impacts are due to the subsidy that the government pays on biogas systems and due to the incremental water use. The impact on time saving has to be monitored.
FIGURE 3.13. Financial and economic cumulative discounted costs and benefits over 10 years of a biogas domestic milk chiller in Tanzania.
6
4
2
0
–2
Subsidies and taxesFinancial net benefits Health risk due to indoor
air pollutionWater use and efficiencyValue added along the VC
91 2 3 4 5 6 7 100 8
Tho
usan
d U
S$
8
10
Employment
years
GHG emissions
Note: Additional non-monetized impacts on access to energy and time saving occur (Table 3.20).
Source: Authors.

83MEASURING IMPACTS AND ENABLING INVESTMENTS IN ENERGY-SMART AGRIFOOD CHAINS
CO
ST-B
ENEF
IT A
NA
LYSI
S A
T T
HE
CO
UN
TRY
LEV
EL
Data sources
Figure 3.15 illustrates the information needed for estimating the technical potential of the BDMC technology, and Table 3.22 summarizes the information and data input needed, and actually used, for the techno-economic analysis.
FIGURE 3.14. Cumulative economic costs and benefits of biogas domestic milk chillers in Tanzania at national level after 10 years (153,000 systems).
0
200
–200
400
600
800
1,000
Mill
ion
US$
151545
95
753
–17
– 0.05
Access to energy719,000people Time saving
Financial net bene�ts
GHG emissions
Subsidies and taxes
Employment
Value added along the VC
Water use and efficiency
Health risk due to indoor air pollution
US$ 245 million For 153,000 systems
INITIAL INVESTMENTOVER 10 YEARS
US$ 905 millionECONOMIC NPV
FINANCIAL IRR
85%
US$ 753 millionFINANCIAL NPV
Note: The sum of the financial NPV and the economic co-benefits and costs is the economic NPV.
Colour code for non-monetized impacts: Positive impact Variable impact Negative impact
Source: Authors.
FIGURE 3.15. Input data for the assessment of the technology potential of biogas domestic milk chillers in Tanzania.
Note: Blue boxes represent country-related primary input data, green boxes are calculated data,
white boxes are technical info used and the grey box represents the result.
Source: Authors.
Number of improved cattle
Number of small-holder dairy farmers
rearing improved dairy cattle
Grid distribution
Milk chiller technical potential
Capacity of a milk chiller
Improved cattle kept in small-scale
system
Average herd size

84 MEASURING IMPACTS AND ENABLING INVESTMENTS IN ENERGY-SMART AGRIFOOD CHAINS
CO
ST-B
ENEF
IT A
NA
LYSI
S A
T T
HE
CO
UN
TRY
LEV
EL
TABLE 3.22. Data sources for the CBA of biogas domestic milk chillers in Tanzania.
Data input International source Source used
Number of improved cattle – Government data
Improved cattle in small-scale dairy production system/household
– Government data
Average herd size per household – Literature
Grid distribution World Bank, 2016b World Bank, 2016b
Labour cost ILO, 2017 (for some countries)
Literature
Milk selling price and value added along the value chain
– Government data and Literature
Value of digestate – Literature
Diesel/gasoline fuel prices World Bank, 2016c Literature and World Bank, 2016c
Share of fuels used for cooking – Literature
Duty on technology import – Government data
GHG emission factor for woodfuel IPCC, 2006 IPCC, 2006
Note: Shaded rows represent country-related primary input data.
Source: Authors.
Barriers to technology adoption
There are several barriers in Tanzania to the adoption of biogas domestic milk chiller (BDMC) technology. The main barriers are summarized in Table 3.23. In Tanzania, the BDMC technology is still new, therefore, the majority of dairy farmers are not aware of the variety of application and benefits of this technology. However, it should be noted that small-scale dairy farmers are often risk averse and unlikely to invest in a technology that they have not seen paying off. Limited knowledge amongst public officials due to a lack of extension training on new technologies affect the adoption of BDMC technology. In fact, only about 20% of small-scale dairy farmers have access to extension services.
Likewise, the BDMC technology requires high initial investment costs and currently is rarely affordable for small-scale dairy farmers. The initial investment needed is the cost for purchasing and installing a biogas system as well as a milk chiller. SimGas has been active to develop, promote and distribute the BDMC, however, appropriate financing and access to credit schemes for small-scale dairy farmers are lacking. Commercial banks and other financial institutions require a high amount of collateral and a long accounting track record that most small dairy farmers cannot deliver. For savings group and informal lenders, financing requirements include interest rates that are often too high (the required lending rate can be higher than 20%).
Milk price fluctuation has also a significant influence on the adoption of the BDMC technology. Recently, milk prices varied in rainy and dry periods. During the rainy period the consumer demand of milk and milk products declined, resulting in a price decrease. The price variation generally ranged from US$ 0.25 to 0.5 per litre of milk. Processors also influenced the price of milk by diminishing the amount of milk they receive from cooperatives and farmers when they had problems with their processing

85MEASURING IMPACTS AND ENABLING INVESTMENTS IN ENERGY-SMART AGRIFOOD CHAINS
CO
ST-B
ENEF
IT A
NA
LYSI
S A
T T
HE
CO
UN
TRY
LEV
EL
plant and/or in times of low market demand. As a result, the cooperatives also decreased the amount of milk that they collected or decreased the price per litre of milk they pay for the producers. The degree of milk price fluctuation can discourage small-scale dairy farmers to invest in the BDMC technology. Moreover, the absence of premium programs to provide incentives for dairy farmers to improve milk quality and hygiene also discourage farmers to invest in the BDMC technology. Normally, premium payments motivate farmers to produce high quality milk.
The Government of Tanzania has been supporting the promotion of the BDMC technology through subsidies. According to SimGas the subsidy for equipment (i.e. milk chiller) is US$ 120. In addition, there is the Draft Energy Subsidy Policy of 2013 which is still waiting for approval by the Government of Tanzania. However, import duties and VAT impact negatively on the price of the BDMC technology.
A regulation against informal selling of the milk is in place. However, the enforcement of the ban is low, since there are no alternative market outlets for small farmers to sell their evening milk. In fact, milk shed areas in remote areas are inaccessible especially during the rainy season, while many regions have no established MCCs nor processing factories. Where factories exist, accessibility to the milk producers is mostly characterized by poor road infrastructure.
Lastly, high distribution costs for the BDMC technology, especially for remote dairy farmers, impact negatively on the price of the technology. Largely, Tanzania’s rural infrastructure is extremely poor and underdeveloped. This translates to high transaction costs to distribute the BDMC technology. Strategies for the development and spread of small scale processing plants should go hand in hand with the adoption of the milk cooling technologies at MCCs and transport infrastructure development linkages in the respective areas, using the inclusive value chain approach.
TABLE 3.23. Key barriers to the adoption of biogas domestic milk chillers in Tanzania.
Knowledge and information
Organization/social
Regulations/institutions
Support services/structures
Financialreturns
Access/cost of capital
Lack of awareness of the technology potential and benefits
Lack of incentives for a farmer to improve milk quality and hygiene (no price premium for quality)
Low enforcement of the ban to sell milk to informal channels because there is no alternative (some farmers earn money selling the evening milk to the informal market)
Limited knowledge amongst public officials
Lack of access to extension services for farmers High distribution costs for the BDMC especially for remote farmers
Lack of functional roads during the rainy season
Milk price variability can make the investment financially less viable
High initial investment costs of BDMC for small dairy farmers
Difficult access to credit for small dairy farmers
Source: Authors.

86 MEASURING IMPACTS AND ENABLING INVESTMENTS IN ENERGY-SMART AGRIFOOD CHAINS
CO
ST-B
ENEF
IT A
NA
LYSI
S A
T T
HE
CO
UN
TRY
LEV
EL
SOLAR MILK COOLER
Technology potential
In Tanzania, MCCs are the targeted market for the solar milk cooler technology, as the average daily milk collected per MCC varies between approximately 200 litres in Arusha to 1,000 litres in Tanga region (DANIDA, 2016). Therefore, the system fits the size requirement well. As currently only 30% of the MCCs have cooling facilities (MALF Tanzania, 2016) the CBA adopts as a benchmark a situation with no cooling facilities. MCCs with cooling facilities may need solar technology to avoid dependency on the unreliable electricity grid, however, as the solar milk cooler is typically stand-alone, only MCCs without cooling facilities are considered as serviceable market for this technology. Based on this and on the data in Table 3.24, the total serviceable market is around 128 MCCs. Therefore, the following CBA assumes the introduction of solar milk coolers at the 128 MCCs currently without cooling facilities.
TABLE 3.24. Technology potential of solar powered milk coolers in Tanzania.
Item Value Source
Total number of Milk Collection Centres (MCCs) 183 MALF Tanzania, 2016
MCCs installed daily capacity (litres/day) 262,978 DANIDA, 2016
MCCs installed yearly capacity (litres/year) 95,986,970 DANIDA, 2016
Number of MCCs without cooling facilities 128 MALF Tanzania, 2016
Operating collection capacity of MCCs (litres/day) 94,137 DANIDA, 2016
Percentage of MCCs installed dairy capacity used 35% DANIDA, 2016
Average daily milk delivery to MCC (litres/day) 200–1,000 DANIDA, 2016
Source: Authors.
Cost-benefit analysis
FINANCIAL CBASolar powered milk cooler technology can provide an off-grid milk cooling solution for MCCs with a capacity of around 600 litres. To date, MCCs are reported to be around 183 in the country. Their ownership is mixed, but typically they are owned by dairy cooperative societies or dairy processors64. This CBA analysis is performed for both scenarios to show how the distribution of financial and economic flow will change according to who makes the initial investment. First, it is assumed that the solar milk cooler is owned by dairy cooperative societies, then, by a dairy processor who collects the milk from the MCC.
64 In Tanga, 24 milk collection centres out of 47 are owned by dairy cooperative societies operating under a regional umbrella organization, TDCU (Tanga Dairy Cooperative Union). The rest are either privately owned or owned by processors such as Tanga Fresh Ltd. In Arusha and Kilimanjaro, a few milk-cooling centres are owned by farmer groups and some are processor-owned. The Iringa and Morogoro-Dar es salaam milkshed area has a number of milk cooling centres that are mostly processor-owned and agent- or manager-operated. A study by Austroproject Association for Rockford Local Development Corporation (RLDC) (2007) found out that in the central corridor regions of Morogoro, Dodoma, Singida, Manyara and Tabora, where traditional cattle were the predominant source of marketable milk, there were only 8 milk collection centres, mostly privately owned, utilizing less than 20% of an installed capacity of 14,400 litres per day.

87MEASURING IMPACTS AND ENABLING INVESTMENTS IN ENERGY-SMART AGRIFOOD CHAINS
CO
ST-B
ENEF
IT A
NA
LYSI
S A
T T
HE
CO
UN
TRY
LEV
EL
Assuming an average salary of US$ 1,294 for one full-time technician to fill the milk tank, clean it, and turn on and supervise the unit, and a water price of US$ 0.75/m3 (EWURA, 2016), the operating cost for the solar milk cooler amounts to about US$ 1,321/year.
Without cooling facilities at the MCC, the dairy cooperative or processor does not collect the evening milk from the farmers, as it faces a high probability of rejection at the next value chain stage. Since milk cannot be stored at the MCC for several hours without cooling facilities and transportation to the processing unit typically does not happen more than once per day, the MCC is not used at its full capacity. It is assumed that before the introduction of the solar milk cooler at the MCC, the milk collected from the farmers is around 300 litres of milk per day (just the morning milk), since the MCC cannot store milk overnight. The introduction of cold storage allows the dairy cooperative (or processor) to collect, store and sell more milk to the processing units (or to process it). It is assumed that after the introduction of the solar milk cooler at the MCC, the owner of the MCC buys 600 litres per day from the farmers (at a price of US$ 0.29/l).
Average prices and profit along the value chain are summarized in Table 3.25. For each litre of milk, the dairy cooperative pays US$ 0.29/l to the farmer and sells the milk to the processing unit at US$ 0.45/l. Assuming costs for the transport from the farm gate to the MCC and for storage of US$ 0.09 per litre, the cooperative makes a profit of US$ 0.07 per litre if it owns the solar milk cooler. If the dairy processor buys the milk directly from the farmers and owns the MCC, its profit is higher as it includes three stages of the value chain (transport/collection, MCC and processing). The dairy processor has therefore a profit of US$ 0.14/l (DANIDA, 2016). Currently, price premiums for cooled milk are not paid to farmers in Tanzania. Hence, additional profits are generated only by an increase in volume of milk sales.
TABLE 3.25. Average prices of fresh milk along the value chain and profits.
Price Cost Profit
US$/l US$/l US$/l
Farm gate 0.29 0.21 0.08
Transport/collection at farm gate 0.33 0.02 0.02
MCC 0.45 0.07 0.05
Processing unit 0.71 0.19 0.07
Wholesaler 0.9 0.08 0.11
Retailer/consumer 1.17 0.02 0.25
Source: Authors’ elaboration based on DANIDA, 2016.
Moreover, the solar milk chiller improves the quality of the milk by reducing bacteria growth, thus decreasing the probability of milk spoilage and rejection by the dairy processing unit. On average, about 10% of the milk produced is rejected at the MCC, depending on the season. By cooling the milk, this rejection can be reduced to about 1%. Therefore, each solar milk cooler can save about 27 litres of milk per day.

88 MEASURING IMPACTS AND ENABLING INVESTMENTS IN ENERGY-SMART AGRIFOOD CHAINS
CO
ST-B
ENEF
IT A
NA
LYSI
S A
T T
HE
CO
UN
TRY
LEV
EL
The financial benefits of the investment depend on who owns the MCC: as the dairy processor gains more profits per litre, it can have higher revenues from the avoided spoiled milk. Under these conditions, for the dairy cooperative the investment pays back from a financial point of view in about 17 years (NPV of US$ 1,020) and brings about significant benefits down the value chain. For the dairy processor, the same investment will pay back after 3 years (NPV of US$ 50,555), but will have less impact down the value chain. Since the difference between the two scenarios (milk cooler owned by a dairy cooperative or by a processor) is only in the distribution of the benefits along the value chain, the economic NPV is equal in the two cases.
ECONOMIC CBA
Value added along the value chainIn Tanzania, only a small percentage of the milk produced enters the formal milk value chain. The introduction of solar milk coolers at the MCC would allow to double the quantity of milk entering the formal channel from the MCCs currently without cooling facilities, thus improving the value added in the milk chain.
As pointed out in Table 3.25, the value added of a litre of milk in the formal channel is about US$ 0.07 per litre for the processor and US$ 0.11 for the wholesaler. The CBA considers as ‘value added along the formal value chain’ the profit created by the processing unit and the wholesaler only, as farmers are likely to provide milk to the informal market in absence of a formal channel. When the solar milk cooler is owned by a dairy cooperative, the value added down the chain is held by the processor and the wholesaler. By considering these values, the addition of around 300 litres per day in the formal channel and the reduction of rejections at processing unit (from 10% to 1%) bring about a total value added of US$ 21,484/year per solar milk chiller (US$ 0.18/l). If the investment is made by the processor the value added will be the profit of the wholesaler only (US$ 0.11/l), amounting to about US$ 13,129/year. The benefits for the processor are already considered in the financial flows.
Subsidies and taxesIn Tanzania there are neither subsidies to milk prices nor taxes on fresh milk in place (only UHT milk is subject to VAT taxation). Moreover, solar technologies for rural electrification and agriculture benefits from VAT exemption and duty free allowance (TIC, 2015). Therefore, no import duty on technology and replacement parts is considered.

89MEASURING IMPACTS AND ENABLING INVESTMENTS IN ENERGY-SMART AGRIFOOD CHAINS
CO
ST-B
ENEF
IT A
NA
LYSI
S A
T T
HE
CO
UN
TRY
LEV
EL
Assessment of environmental and socio-economic impacts at national level
TABLE 3.26. Environmental and socio-economic impacts associated with the technical potential of solar milk coolers in Tanzania (128 systems).
Impact Description Impact indicator
Monetized impact
Fertilizer use No impact – –
Water use and efficiency
As mentioned above, about 50–150 litres of water per day is used to clean the system (FAO and GIZ, 2018). This calculation uses the mean value of 100 litres. The financial CBA assumes a water price of US$ 0.75/m3 (EWURA, 2016), paid by the system owner. About 4.7 million litres of water can be required to clean 128 systems. The avoided milk loss also translates in a water saving for milk production: considering that per year about 222 m3 of water are used for milking cows, that each cow can produce about 1,800 litres of milk, and that a solar milk cooler can save about 8,800 litres of milk (by reducing rejections at processing unit), about 139 million litres of water can be saved at national level.
–133 million l/year (4.7 million litres of water to clean the system; 138 million litres saved by reduced milk loss)
US$ 3,500 /year to clean the system (considered in the financial CBA); US$ 101,000/year saved by reducing milk loss
Food loss The intervention can reduce milk rejection at processing units from 10% to 1%. Moreover, due to the introduction of cold storage at MCCs, the quantity entering the formal channel increases. At national level, about 1.1 million litres of milk can be saved thanks to reduced rejections at the processing units. These benefits are included in the financial CBA and in the value added.
1.1 million l/year
Considered in the financial CBA and value added
Land requirement
One unit requires 15 m2 corresponding to around 0.19 ha of land for 128 units. The overall impact is therefore negligible.
– –
GHG emissions
No direct impact on energy GHG emissions. There is an indirect impact due to the avoided milk spoilage however this is not quantified.
– –
Health risk due to indoor air pollution
No impact. – –
Fossil fuel consumption
Since the system stands alone and is not backed up by the grid, there is no impact on fossil fuel consumption.
– –
Access to energy The impact on access to energy could only be marginal (small appliances can be powered by the system) and therefore is considered negligible.
– –
Household income
The impact on household income depends on the number of cows per household. For instance, the number of dairy households affected by each solar milk cooler can vary from about 80 (assuming 3 cows/household) to 25 (assuming 10 cows/household). At national level, this is equivalent to between 3,000 and 10,000 farmers that can benefit from the introduction of solar milk coolers at MCCs. If a farmer receives a price of US$ 0.29/l of milk and has 3 cows (each one producing about 1,800 l/year), their benefit is about US$ 780/year, due to the possibility to double the quantity of milk sold at the MCC. A farmer with 10 cows can instead increase his or her revenues by
3,000 to 10,000 people; up to US$ 780–2,600/year per household
–

90 MEASURING IMPACTS AND ENABLING INVESTMENTS IN ENERGY-SMART AGRIFOOD CHAINS
CO
ST-B
ENEF
IT A
NA
LYSI
S A
T T
HE
CO
UN
TRY
LEV
EL
more than US$ 2,500/year. Research suggests that in Tanzania, smallholder dairy cooperatives generally include more women than men. However, the benefits for the household depend on the alternative use of the milk not sold to the MCC in absence of a solar milk cooler. If the farmers can sell the milk in the informal channel at a price higher than or equal to US$ 0.29/l, the impact on household income is negative or negligible.
Time saving Since the collection of the milk is normally done by the cooperative farm-to-farm, there is no impact on household time65.
– –
Employment One additional skilled worker is needed to operate, clean and maintain the milk cooler at the MCC, at an average wage of US$ 1,294 per year. The local technician could be a man or a woman provided recruitment and training is gender-sensitive.
128 full-time skilled workers
US$ 0.17 million/year
Colour code: Positive impact Variable impact Negative impact No or negligible impact
Source: Authors.65
PROFITABILITYTable 3.27 summarizes the financial and economic net benefits for introducing solar milk coolers in existing MCCs without cooling facilities in Tanzania. As the table shows, the investment is not very attractive from a financial point of view for a dairy cooperative, but is more attractive for a dairy processor who can incorporate more value added. Table 3.27 and Figure 3.16 show that in both cases economically the investment pays back after one year and has a very positive economic NPV (US$ 136,000). The difference between the two scenarios is in the distribution of the value added along the value chain: If the dairy processor owns the system its value added is incorporated as a financial benefit.
TABLE 3.27. Financial and economic CBA of one solar milk cooler in Tanzania.
Item Unit Value (single intervention)
Value (at scale) Notes
COSTS
Installation costs Thousand US$
40 5,120 Source: FAO and GIZ, 2018
Replacement costs Thousand US$
3 every 10 years to replace battery
384 every 10 years to replace battery
Source: FAO and GIZ, 2018
Water requirement Thousand US$/year
0.03 3.5 About 100 l of water per day to clean and manage the system (water price: US$ 0.75/m3).
Labour cost Thousand US$/year
1.3 166 1 employee to run and clean the system.
65 After the introduction of the solar milk cooler, the dairy cooperative may collect the milk from the farmers twice a day instead of once, but it can save time for the transportation from the MCC to the processing units. In fact, often the milk collected in MCC without cooling facilities goes through a MCC with cooling facilities before reaching the processing units. With the introduction of a solar milk cooler this intermediate step can be avoided. Therefore, the analysis does not consider any change in the cost of transportation (per litre of milk) for the dairy cooperative.

91MEASURING IMPACTS AND ENABLING INVESTMENTS IN ENERGY-SMART AGRIFOOD CHAINS
CO
ST-B
ENEF
IT A
NA
LYSI
S A
T T
HE
CO
UN
TRY
LEV
EL
BENEFITS
Increased revenues from milk sales – – Due to more milk collected at the MCCs (600 litres instead of 300 litres per day) and a reduction in milk rejection at the processing unit (from 10% to 1% of milk rejected).
If the cooperative owns the solar milk cooler
Thousand US$/year
8.4 1,069 Profit of the dairy cooperative: US$ 0.07/l of milk (DANIDA, 2016).
If the processor owns the solar milk cooler
Thousand US$/year
16.7 2,139 Profit of the dairy processor: US$ 0.14/l of milk (DANIDA, 2016).
Value added along the value chain Additional 327 litres per day are entering the formal channel.
If the cooperatives owns the solar milk cooler
Thousand US$/year
21.5 2,750 The value added of a litre of milk in the formal channel is at the processing and wholesaler steps.
If the processor owns the solar milk cooler
Thousand US$/year
13.1 1,681 The value added of a litre of milk in the formal channel is at the wholesaler step.
Water use and efficiency
Thousand US$/year
0.8 104 Water saved for milk production (water price: US$ 0.75/m3).
Employment Thousand US$/year
1.3 166 1 employee to run and clean the system.
PROFITABILITY INDICATORS
Financial NPV (dairy cooperative)
Thousand US$
1.0 130.6
Financial IRR (dairy cooperative)
% 16%
Financial NPV (dairy processor)
Thousand US$
50.6 6,471.0
Financial IRR (dairy processor)
% 38%
Economic NPV (dairy cooperative)
Thousand US$
141 18,030
Economic IRR (dairy cooperative)
% 77%
Economic NPV (dairy processor)
Thousand US$
141 18,030
Economic IRR (dairy processor)
% 77%
Note: Life expectancy of the technology is 20 years. Discount rate is 16%. Financial costs and benefits are on a orange background. Economic costs and benefits are on a green background.
Source: Authors.

92 MEASURING IMPACTS AND ENABLING INVESTMENTS IN ENERGY-SMART AGRIFOOD CHAINS
CO
ST-B
ENEF
IT A
NA
LYSI
S A
T T
HE
CO
UN
TRY
LEV
EL
FIGURE 3.16. Financial and economic cumulative discounted costs and benefits over 20 years of a solar milk cooler in Tanzania, if the system is owned by a dairy cooperative or a dairy processor.
Note: Additional non-monetized impacts on household income were found (Table 3.26).
Source: Authors.
RESULTSSolar milk coolers at MCCs in Tanzania can be very beneficial for the milk value chain in the country. When the system is owned by a cooperative, from a financial point of view the investment is not very attractive as it pays back only after about 17 years. However, the main benefit of this technology is in terms of value added along the value chain (Figure 3.17. Cumulative economic costs and benefits of solar milk coolers in Tanzania at national level after 20 years (128 systems)). In fact, the introduction of cold storage at MCCs increases the quantity of the milk entering the formal channel and improves its quality. For this reason, when the investment is made by a dairy processor, the financial NPV is very positive and the payback time is 4 years.
– 20
– 40– 50
150Owner: dairy cooperative
20
40
60
80
100
120
140
010 2 3 4 5 6 7 8 9 10 11 12 13 14 15 16 17 18 19 20
Financial net benefits
Water use and efficiency
Value added along the VC
Employment
years
20
40
60
80
100
120
140
Tho
usan
d U
S$
– 20
– 40
01 2 3 4 5 6 7 8 9 10 11 12 13 14 15 16 17 18 19 200 years
– 50
150Owner: dairy processor
Financial net benefits
Water use and efficiency
Value added along the VC
Employment

93MEASURING IMPACTS AND ENABLING INVESTMENTS IN ENERGY-SMART AGRIFOOD CHAINS
CO
ST-B
ENEF
IT A
NA
LYSI
S A
T T
HE
CO
UN
TRY
LEV
EL
Depending on the alternative use of milk in the informal sector, this may produce an increase in household income for the farmers selling the milk to the dairy cooperatives. Moreover, the solar milk coolers generate employment.
However, solar milk coolers require water to be cleaned and maintained, thus having a negative impact on water use (incorporated as financial cost). This is not compensated by the avoided water waste associated to milk spoilage and rejection.
Data sources
Figure 3.18 illustrates the information needed for estimating the technical potential of the technology in Tanzania, assuming that the solar milk coolers are installed in existing MCCs without cooling facilities. Table 3.28 summarizes the information and data input needed, and actually used, for the techno-economic analysis.
FIGURE 3.17. Cumulative economic costs and benefits of solar milk coolers in Tanzania at national level after 20 years (128 systems).
Note: The sum of the financial NPV and the economic co-benefits and costs is the economic NPV.
Colour code for non-monetized impacts: Positive impact Variable impact Negative impact
Source: Authors.
0.6 0.6
10.016.3
6.5
0.1
mill
ion
US$
OWNED BY COOPERATIVE
OWNED BY PROCESSOR
4
6
2
0
8
10
12
14
16
18
20
US$ 18 millionECONOMIC NPV
US$ 5.1 million For 128 systems
INITIAL INVESTMENTOVER 20 YEARS
1.0 1.0
Household income3,000
to 10,000people
Financial net bene�ts
Employment
Value added along the VC
Water use and efficiency
FINANCIAL IRR
16%
US$ 0.13 millionFINANCIAL NPV
DAIRY COOPERATIVE
DAIRY PROCESSOR
FINANCIAL IRR
38%
US$ 6.5 millionFINANCIAL NPV

94 MEASURING IMPACTS AND ENABLING INVESTMENTS IN ENERGY-SMART AGRIFOOD CHAINS
CO
ST-B
ENEF
IT A
NA
LYSI
S A
T T
HE
CO
UN
TRY
LEV
EL
FIGURE 3.18. Input data for the assessment of the technology potential of solar milk coolers in Tanzania.
Note: Blue boxes represent country-related primary input data, green boxes are calculated data,
white boxes are technical info used and the grey box represents the result.
Source: Authors.
Capacity of installed dairy business units
Milk cooler technical potential
MCCs without cooling facilities
Solar milk cooler technical potential
Capacity of a solar milk cooler
TABLE 3.28. Data sources for the CBA of solar milk coolers in Tanzania.
Data input International source
Source used
Distribution and capacity of organized MCC network/ dairy business units
– Government data
Number of MCCs without cooling facilities – Government data
Average daily milk delivery to MCC (litres/day) – Literature
Price of water – Government data
Labour costILO, 2017 (for some countries)
Literature
Milk selling price and value added along the value chain
– Literature
Duty on technology import and replacement – Government data
Note: Shaded rows represent country-related primary input data.
Source: Authors.
Barriers to technology adoption
There are several barriers to the adoption of solar powered milk coolers in Tanzania. Solar systems are characterized by a relatively high initial cost and a relatively low annual cost. The potential users of technology in Tanzania do not have the economic resources to afford the initial investment. Access to credit is often limited for smallholder dairy farmers and cooperatives. This is among the most significant barriers to the development of their businesses. However, lack of access to credit plays a central role for the acceptance of solar milk coolers. The low financial returns further hinder the adoption of this technology, in particular from farmer groups/cooperatives as they have a payback time of about 17 years.

95MEASURING IMPACTS AND ENABLING INVESTMENTS IN ENERGY-SMART AGRIFOOD CHAINS
CO
ST-B
ENEF
IT A
NA
LYSI
S A
T T
HE
CO
UN
TRY
LEV
EL
Moreover, the absence of premium programs to provide incentives for dairy farmers to improve milk quality and hygiene also discourage investments in solar milk coolers.
The import of solar systems is being regulated through Tanzania Bureau of Standards (TBS). However, low quality, uncertified and hence unreliable solar system are often imported into the country due to the weak regulatory system. This contributes to damaging the reputation of the technology and to negatively impacting the end-user confidence.
Since solar milk coolers are a new technology and private sectors are not yet involved, potential users will not have enough information and knowledge about the nature of the technology, its technical details and costs as well as benefits. Additionally, in remote rural areas of Tanzania, qualified technicians are difficult to find. Thus, there will be inadequate support services for operation, maintenance and repair of the solar system. Moreover, programs for educating and training technicians are generally inadequate.
Progressive policies in Tanzania already promote solar technology and agricultural development through subsidies and VAT exemptions. Under the East Africa Community External Tariff of 2007, solar products are classified to attract 0% import duty. However, for a company to benefit from these subsidies it is required to prove that the technology components will be applied in the agriculture sector. This can be a problem for solar equipment which can be used also in other sectors (e.g. batteries). At the policy level there is a lack of consistent and integrated strategy to guide the development and implementation of milk cold chain projects. Table 3.29 summarizes the key barriers to the adoption of solar milk cooler in Tanzania.
TABLE 3.29. Key barriers to the adoption of solar milk coolers in Tanzania.
Knowledge and information
Organization/social
Regulations/institutions
Support services/structures
Financialreturns
Access/cost of capital
Lack of awareness and know-how of the technology potential
– Lack of clear development strategy for improvement of milk cold chains
No enforcement for quality standards of solar technology (counterfeit products)
Shortage of qualified technicians especially in rural areas to install and maintain the system
Low financial returns (payback time ranging between 4 and 18 years)
No price premium for quality
High initial investment costs for dairy smallholder groups
Lack of financing solutions for dairy smallholder groups
Source: Authors.

96 MEASURING IMPACTS AND ENABLING INVESTMENTS IN ENERGY-SMART AGRIFOOD CHAINS
CO
ST-B
ENEF
IT A
NA
LYSI
S A
T T
HE
CO
UN
TRY
LEV
EL
3.1.3 KENYA: ENERGY INTERVENTIONS IN THE MILK CHAIN
Value chain description
In 2013, cow milk production in Kenya was 3.7 million tonnes (3,574 million litres), with a total number of dairy cattle comprising 5.7 million heads (FAOSTAT, 2016), concentrated mainly in the highlands with almost half in the Rift Valley (Figure 3.19. Share of raw milk production by main dairying regions in Kenya.).
Zero and semi-zero grazing are the predominant management systems extensively practiced in the Rift Valley, Central, parts of Eastern, and to a smaller but growing extent in Southern Eastern, Nyanza, Western regions and Coastal lowlands where milk is a high-value commodity as these are milk deficit regions (Katothya, 2017). Milk yields are between 15–30 litres per cow under zero-grazing per day as compared with 1–2 litres for cows under extensive grazing systems (EADD, 2008). Extensive grazing cows are mostly traditional breeds whereas higher yielding crossbreds and purebreds are used for zero- and semi-zero-grazing systems. The average milk productivity per cow at national level is around 10 litres/day (Livestock department, personal communication, 201766).
66 Interview with S. Matoke, Deputy Director, and J. Otiang, Dairy Services Division, in February 2017.
FIGURE 3.19. Share of raw milk production by main dairy regions in Kenya.
Source: Katothya, 2017.
Rift Valley
Eastern
Central & Nairobi
Nyanza
Western
Coast
47%
31%
11%
6%4%
1%

97MEASURING IMPACTS AND ENABLING INVESTMENTS IN ENERGY-SMART AGRIFOOD CHAINS
CO
ST-B
ENEF
IT A
NA
LYSI
S A
T T
HE
CO
UN
TRY
LEV
EL
There are about 1.8 million dairy farms (Livestock department, personal communication, 2017):
• 70-80% are smallholdings (3–10 cows) with mostly intensive system (zero-grazing);
• 10–20% are medium scale (10–50 cows);
• 10–15% are large scale (more than 50 cows).
Dairy systems also differ in terms of farm management and inputs. In smallholdings the cows are fed mainly with freshly cut forage and small quantities of concentrate feed, with many smallholders being highly commercial and well-versed in dairy production and quality management (FAO, 2011b).
In large dairy farms with improved breeds, the cows are often kept in confined feedlots and zero-grazed. The farms are connected to the electricity grid and have refrigerated milk storage tanks up to 10,000 litres capacity. Other on-farm electricity demand is limited mainly to operating the milking equipment (AHK Kenya, 2015) unless any milk processing activities are performed.
A survey of about 300 farmers (FAO, 2016b) showed that most followed conventional manure management practices by storing the manure in uncovered piles under shade or in open areas. Less than 10% practiced composting or used polythene covers. Around 40% of farmers applied the manure to food crops, 35% to fodder crops, and the other 22% claimed to use it for construction material. Around 2% of farmers sold manure to other farmers, and only 0.3% dried the dung for use as a cooking fuel. Over half (58%) of the farmers surveyed stated that lack of capital needed for the construction of a biogas digester was the main barrier to using manure for biogas production. Other barriers reported were lack of knowledge on biogas plant installation (30%) and having insufficient amounts of manure available (12%). Awareness about the soil nutrient value of the bio-digestate varied across regions.
In Kenya the various milk industry value-chains can be categorized as:
• milk traders dealing with largely unpasteurized milk;
• direct chains from milk producers to consumers that are popular with medium- and large-scale farms in urban and peri-urban areas;
• MCCs drawing milk from many producers and marketing it directly to consumers (largely unpasteurized);
• processing companies drawing milk from small- and large-scale commercial milk producers to manufacture a range of products; and
• cottage industries, commonly being large farms that have invested in vertical integration.

98 MEASURING IMPACTS AND ENABLING INVESTMENTS IN ENERGY-SMART AGRIFOOD CHAINS
CO
ST-B
ENEF
IT A
NA
LYSI
S A
T T
HE
CO
UN
TRY
LEV
EL
Supply chains handling unprocessed milk products from small dairy farms are categorized as informal. The informally traded milk is sold either sold directly from farmer to consumer (including neighbours) or through unlicensed/informal traders including itinerant traders, milk bars and kiosks, brokers and self-help groups (Figure 3.20. Main milk marketing pathways in Kenya.). They handle more than 80% of marketed milk. The formal chain includes collection centres, milk processors, cooperatives, supermarkets, retail shops and any other actor that handles processed milk products. Milk for the formal market, which comes from medium and large dairy farms is usually transported to bulk centres for chilling prior to sale for processing. It has less than 20% share of the milk market (Katothya, 2017).
The formal milk trade is the market segment licensed by the Kenya Dairy Board (KDB). Licences are issued for milk bars (for up to 1,000 litres/day), cottage industries (up to 3,000 litres/day), mini dairies (up to 5,000 litres/day), processors (up to 5,000 litres/day), producers (who process, manufacture, prepare or treat the milk for sale) and distributors (who buy for resale). The distribution of milk dispensers, processors, cottage industries, cooling plants and mini dairies is widespread (Figure 3.21. Dairy business units in Kenya.). The processors handle about 80% of milk in the formal sector (FAO, 2011b).
FIGURE 3.20. Main milk marketing pathways in Kenya.
Note: The percentages indicate the fraction of milk that is produced by or passed on to the actors.
Source: adapted from FAO, 2014a.
Smallholder farmers 90–95%
Rural Raw Milk Informal Trade
45%
Cooperatives Self-Help Groups
30%
Caterer / HotelHawker / Milkbar
Traders 10%
Rural Raw Milk Not traded
35%
Family Consumption 27% Calves 8%
Rural and Urban Consumers 65%
Pasteurized milk / Dairy products
20%
Medium / Large Dairy Farmers
5–10%
Dairy Factories 20%
Retailer
35% 17% 40% 40%
28%
12%
8%
Dairy Cottages
28%

99MEASURING IMPACTS AND ENABLING INVESTMENTS IN ENERGY-SMART AGRIFOOD CHAINS
CO
ST-B
ENEF
IT A
NA
LYSI
S A
T T
HE
CO
UN
TRY
LEV
EL
An FAO (2014a) study on food losses in Kenya identified the main causes of milk losses were due to poor transport infrastructure (such as roads); inadequate/ unhygienic handling equipment; poor product quality due to lack of technical know-how, lack of equipment and lack of price incentives for efforts to improve quality; lack of appropriately trained personnel along the milk supply chain; inappropriate transport equipment and poor handling practices; and lack of market intelligence (FAO, 2014a). A poor cold chain lowers the quality of processed milk and prevents processors from producing long-life products that need high quality input (EADD, 2008). Milk needs to be cooled within 2–4 hours after milking in order to maintain quality, but a major share of milk received for marketing, especially informally, has not been cooled. Since milk delivery or collection is normally conducted only in the morning, evening milk is often of particularly poor quality when received by processors and hawkers the following morning after standing overnight. Large dairy farms normally have cooling facilities on-farm and can ensure a cold supply chain, as can some groups or cooperatives of small dairy farmers.
The price of milk depends on volume and region, ranging from 33 to 38 KES/l (New KCC, personal communication, 201767). A small number of farmers around Nairobi and other big cities can sell to tourist hotels and other elite consumers for more than KES 60/l. Some processors and creameries pay a price premium of 1 KES/l68 if the milk that reaches the MCC is below 4° C. Therefore, small farmers have an incentive to establish self-help groups or cooperatives in order to receive a higher price.
67 Interview with P. Kiboi, Head of engineering, and P. Nguli, Project Engineer, New Kenya Co-operative Creameries Ltd (New KCC) in February 2017.
68 The exchange rate used here for Kenyan shillings is 1 KES = US$ 0.01.
FIGURE 3.21. Dairy business units in Kenya.
Source: KDB, 2017, adapted
Cottage industry
Cooling plants
Milk dispensers
Processors

100 MEASURING IMPACTS AND ENABLING INVESTMENTS IN ENERGY-SMART AGRIFOOD CHAINS
CO
ST-B
ENEF
IT A
NA
LYSI
S A
T T
HE
CO
UN
TRY
LEV
EL
Milk losses throughout the supply chain have been estimated at 7.3% of total production with most occurring on the farms mainly due to spoilage of evening milk (FAO, 2014a). The other critical points are at MCCs and vendor outlets. At current production levels, losses on the farm give national annual losses of around 318 million litres per year valued at over KES 10 billion (MALF Kenya, 2017). Rejections are higher during the wet season when milk production is high and roads can become inaccessible.
Milk reaches consumers through many channels. In rural and suburban areas of Kenya, consumers buy generally unprocessed milk directly from producers, kiosks, neighbourhood shops and hotels. In urban centres, unprocessed and processed milk compete, using more or less the same retail outlets. More than 60% percent of processed milk is sold as fresh whole/homogenized milk with some also processed at ultra-high temperature (UHT) to give longer shelf life. Higher value products such as yoghurt, cheeses and mala (fermented milk) are gaining in popularity in most urban centres and are sold mainly in supermarkets (FAO, 2011b). The per capita milk consumption rate of over 100 litres per year puts Kenya at the top of the list among developing countries globally. In fact, a study carried out by Smallholder Dairy Project (SDP) showed that in 2008 the industry employed approximately 84,000 people full time. At the farm level it is estimated that for every 1,000 litres of milk produced daily, 23 full time jobs are generated for the self-employed, 50 permanent fulltime jobs for employees and 3 full time casual labour jobs, making a total of 77 full time jobs per 1,000 litres daily milk production (Katothya, 2017).
GENDER ANALYSISWomen in rural Kenya still face significant economic, social and political inequalities that restrict household nutrition and food security as well as broader development efforts. For example, women provide 80% of farm labour and manage 40% of the small farms, yet they own roughly 1% of agricultural land and receive 10% of available credit (USAID, 2015). Female-headed households, who are widowed, deserted or divorced, make up 36% of all households in Kenya (World Bank data, 2015). They have lower income, higher poverty incidences and lower levels of education than male-headed households.
Women, particularly from female-headed households, face various challenges in smallholder farming. They lack access to natural and productive resources including land, credit (tied to land title deeds), inputs and markets, compared to men. Widows and abandoned women can be stripped of their assets by relatives of the men, increasing their level of vulnerability. Women also have fewer opportunities to become members of cooperatives and producer organizations, and have lower access to agricultural extension services, than men. Key reasons for this situation include: women’s time poverty from the triple responsibility for domestic, on-farm and off-farm work; women’s high illiteracy rates; and, lack of mechanisms and communication channels specifically to target women (IFAD, 2013). The upshot of gender inequality in smallholder agriculture is low productivity and food insecurity. The situation is compounded by the increasing rate of migration by men searching for jobs who are away for long periods of time. In their absence, women take on the additional responsibility for cash crops and large livestock while sometimes still finding it hard to access the required resources,

101MEASURING IMPACTS AND ENABLING INVESTMENTS IN ENERGY-SMART AGRIFOOD CHAINS
CO
ST-B
ENEF
IT A
NA
LYSI
S A
T T
HE
CO
UN
TRY
LEV
EL
services and inputs (Katothya, 2017). Although women participate in various activities and nodes along the smallholder dairy value chain, these challenges mean their participation is lower overall than that of men. Generally, women perform activities undertaken daily, in or around the home, while men perform weekly or seasonal activities as well as those requiring travel. Gender roles in the Kenyan smallholder dairy value chain are summarized in Figure 3.22.
Dairy inputs and services are normally provided and mainly accessed by men. Women’s access is restricted by their heavy workloads and limited ability to read and use written information and extension materials. Meanwhile, public and private livestock service providers, such as paravets, are predominantly staffed by men and they often lack the skills to target women farmers effectively. Although dairy cattle are managed by women, they are largely owned by men who are responsible for selling calves, heifers and cattle.
Women provide most of the labour in smallholder dairy production with milk production seen as a women’s task to meet household food needs and to generate income. When hired labour (mainly men) is used to perform the milking, women in the household provide a supervisory role, which often does little to reduce their workload. In fact, a study noted that the intensification and commercialisation of smallholder milk production can sometimes lead to more work as well as to a loss of control of the growing income for women in a male-headed household (Katothya, 2017). The selling of milk at the farm gate by men or women varies depending on intra-household gender roles, type of market outlet and milk collection and transportation arrangements.
Participation rates of men and women in dairy Producer Organizations (POs) that improve access to milk markets and provide production and productivity-enhancing services and inputs, vary. In some areas, women dominate while in others men make up most of the numbers. The study (Katothya, 2017) also noted that women’s participation in POs did not necessarily alter intra household decision-making regarding production and marketing of milk. A survey of 300 dairy farmers in western Kenya (Omondi et al., 2014), found that the issue of controlling milk income is a strong determining factor in women’s registration and participation in a PO. It also showed that female-headed householders are less likely to register at dairy POs than male-headed householders.
Milk transport from farm to MCC or trader is predominantly performed by young men on bicycles, motorcycles, carts and donkeys, with a few in vans. Transport from MCC or trader to the processer or retailer (usually within formal value chains) is undertaken by men driving specialized milk tanker vehicles. Women farmers represent at least half of the MCC members, while men are mainly employed as staff in MCCs, particularly in management and field-related operations (Katothya, 2017).

102 MEASURING IMPACTS AND ENABLING INVESTMENTS IN ENERGY-SMART AGRIFOOD CHAINS
CO
ST-B
ENEF
IT A
NA
LYSI
S A
T T
HE
CO
UN
TRY
LEV
EL
Both women and men are involved in milk trading, however women operate on a smaller scale owing to less access to capital, improved technology, information, skills, training as well as their heavy domestic workload and reduced mobility. Nevertheless, women are reportedly becoming more involved in milk trading. Dairy support service businesses, such as agro-veterinary stores, are mainly owned by men, while young women are employed to work in the stores.
Dairy processing plants are owned and mainly staffed by men because of the nature of the work which is heavy and physical, field based and occurs at odd hours. Women tend to choose more convenient office-based jobs such as laboratory and administration work (Katothya, 2017).
Most women control the income from their milk sales and/or can direct the income towards domestic provisioning as well as school fees, healthcare, loan repayments, contributions to community welfare activities and participation in informal savings and credit groups. The opportunity to manage income from milk sales earns women respect and recognition at the household and community level (Katothya, 2017).
Another study in Western Kenya (Kuipers, 2017) revealed that decisions concerning the value chain (such as production and marketing) and income derived from the value chain are predominantly the responsibility of the household head, either male or female. Joint decision making was only mentioned in 10% of the cases.
FIGURE 3.22. Gender roles along the milk value chain in Kenya.
Legend: Size of the men/women icons indicates the extent of their participation in each step of the chain.
Orange font: Activities usually performed by women; Blue font: Activities typically done by men.
Source: Authors’ elaboration based on Katothya, 2017.
Inputs• Feeding the cows• Routine animal health• Fetching water• Veterinary and para- veterinary services
• Purchasing inputs• Input suppliers• Extension service
provision
Production• Milking/supervision
of labour• Hired labour• Nursing the cows • Milk selling• Milk selling • PO members• PO members
Transport & Collection• Transportation
Storage & Handling• Employment at milk
collection centres (MCCs)
• Membership of MCCs (50 – 60%)
Processing • Formal processing
plants• Laboratory and
office work

103MEASURING IMPACTS AND ENABLING INVESTMENTS IN ENERGY-SMART AGRIFOOD CHAINS
CO
ST-B
ENEF
IT A
NA
LYSI
S A
T T
HE
CO
UN
TRY
LEV
EL
ENERGY ASPECTSKenya is facing an acute electricity shortage not only due to the limitations of installed capacity but also due to more than 36% of electricity coming from hydro power generation (IEA, 2017) that can threaten security of supply in times of drought. Due to frequent power outages, the electricity supply companies must provide emergency power aggregates with high electricity generation costs, thus increasing the overall cost of electricity especially in a dry season. According to the World Bank, in 2013 Kenya enterprises experienced power outages 6.3 days per months or more than 75 days in the year with outages being frequent with an average length of 5 hours (Enterprise Surveys, 2017).
Access to electricity reached 23% of the population in 2012; 6.7% in rural areas and 58% in urban areas (World Bank, 2016b). Two thirds of the population still rely primarily on fuelwood (Heinrich Böll Foundation, 2013) since large areas of the country are not yet covered by the national grid (Figure 3.23). The current administration’s target is to have universal electricity connection by 2020 (The Star, 2016). In November 2016, the main electricity transmitter and distributor Kenya Power and Lighting Company (KPLC) received pledges of about US$ 300 million from development partners to expand off-grid electricity systems in remote areas (The Star, 2016).
FIGURE 3.23. Electricity grid distribution in Kenya in 2017.
Source: Energydata.info, 2017.
MOMBASA
NAIROBI
ELDORET

104 MEASURING IMPACTS AND ENABLING INVESTMENTS IN ENERGY-SMART AGRIFOOD CHAINS
CO
ST-B
ENEF
IT A
NA
LYSI
S A
T T
HE
CO
UN
TRY
LEV
EL
Electricity tariffs in Kenya ranged from KES 13 to 20/kWh (US$ 0.13 to 0.20/kWh) in September 2016 for commercial consumers (Stima, 2017). In rural off-grid areas, electricity is usually provided by diesel fuel generators, exposing farmers to higher tariffs with high fluctuations due to variable fuel prices. For example, in February 2017, diesel prices ranged from US$ 0.86 to 0.99 per litre (ERC, 2017).
In an effort to promote the uptake of renewable energy, increase national electricity generation capacity, and promote small electricity projects, the Ministry of Energy and Petroleum implemented the Renewable Energy Feed-in Tariff (REFiT) in 2008 (Heinrich Böll Foundation, 2013). It was revised in December 2012, and differentiated into small projects from 0.2 MW to 10 MW, and large projects above 10 MW (Ministry of Energy of Kenya, 2012).
To date, with a FiT of only KES 0.10/kWh for biogas generation, the FiT has not resulted in greater deployment of small-scale biogas plants since it is insufficient to guarantee a good return on investment. The FiT payments are revised over time by the regulator and can therefore vary from project to project. The renewable electricity project developer has to pay for the grid connection costs.
On-farm energy generation can provide a reliable source of electricity hedging fluctuating electricity prices. Alternatively, surplus electricity can be sold to the national grid and gain access to Kenyan REFiTs under a contract with KPLC that owns and operates the national transmission and distribution lines.
Other factors limiting the development of biogas projects include access to financing (particularly at low interest rates); lack of local expertise and technical capacity; and difficulties negotiating a power purchase agreement for selling the excess electricity to the grid (Heinrich Böll Foundation, 2013). The import of solar PV technologies is duty free (KRA, 2016) and prices are decreasing rapidly so they can compete with biogas.
Technologies assessed
The biogas for power generation technology is an energy intervention suitable for large dairy farms with a large availability of manure (and possibly other easily available feedstocks). In order to negotiate a power purchase agreement (PPA) with KPLC to sell surplus electricity to the national grid, the biogas plant must have a minimum capacity of 100 kWel. Although there are few large dairy farms in Kenya, the manure collection can only be done easily and at low cost when the cattle are housed. According to the local experts, there is still a high technical potential.
Domestic-powered biogas milk chillers with around 15–20 litres per day cooling capacity and solar powered milk coolers of 600 litres per day capacity suitable for small communities or farmer groups, can have a major impact on the improvement of the milk value chain, since poor quality (and lack of enforcement of quality standards) are resulting in milk losses. Milk cooling both on-farm or at a MCC has potential to improve income and livelihood of the farmers and the many dairy societies and unions that supply milk processors (Table 3.30).

105MEASURING IMPACTS AND ENABLING INVESTMENTS IN ENERGY-SMART AGRIFOOD CHAINS
CO
ST-B
ENEF
IT A
NA
LYSI
S A
T T
HE
CO
UN
TRY
LEV
EL
TABLE 3.30. Membership of dairy co-operative societies and number of dairy societies and unions in Kenya, 2006 –2012.
Unit 2006 2007 2008 2009 2010 2011 2012
Members Thousand 254 255 306 342 343 393 345
Societies and unions n. 252 258 264 273 278 313 343
Average members per society n. 1,008 988 1,159 1,253 1,234 1,256 1,006
Source: KNBS, 2013.
The solar milk cooler with a capacity of about 600 litres seems therefore to be an interesting technology for off-grid rural areas, which are very widespread in Kenya. It can help milk co-operative societies and unions to cool their milk in a fast and safe way before reaching bigger dairy processing units.
TABLE 3.31. Energy interventions considered for the milk value chain in Kenya.
Biogas for power generation from dairy cattle
Biogas domestic milk chiller Solar milk cooler
• Although dairy cattle are often
free-grazing, in some large farms the livestock are kept on feedlots overnight, thus making the collection of manure easy and cost effective.
• The vast majority of households are off-grid, which makes conserving the quality of evening milk challenging.
• Solar milk coolers can be adopted by farmer groups, unions and associations to cool the milk one step ahead of processing in the value chain. Many milk collection points are off-grid or in areas with an unreliable electricity grid.
Source: Authors.
BIOGAS FOR POWER GENERATION FROM DAIRY CATTLE
Technology potential
Biogas for power generation plants can be installed on large dairy farms that perform zero-grazing, since they have large volumes of manure readily available. In Rift Valley provinces there are about 5,500 zero-grazing farm units (MALF Kenya, 2009). The 650 m3 biogas digester to produce 880,000 kWh of electricity a year would require manure from more than 200 cows if mixed with other feedstock. Since sisal residue is a readily available feedstock in Kenya (ERC, 2016), a sisal residue to manure slurry ratio of 5:1 by weight was assumed. Since only around 10% of zero-grazed dairy farms have large herds it was assumed the biogas plant potential would be limited to 77 farms. It was further assumed that a dairy farmer would invest in a biogas power plant only if the electricity produced could be sold to the grid to benefit from the FiT. Therefore, the technology is only likely to be adopted by large dairy farms that are close to medium voltage distribution lines. In the Rift Valley this is true for about 40% of the total large zero-grazing dairy units. Hence, only 31 farms have the potential to install this technology (Table 3.32). The total feedstock required would therefore be around 130,000 tonnes of slurry and 653,000 tonnes of sisal residue, or any similar lignocellulosic feedstock, per year.
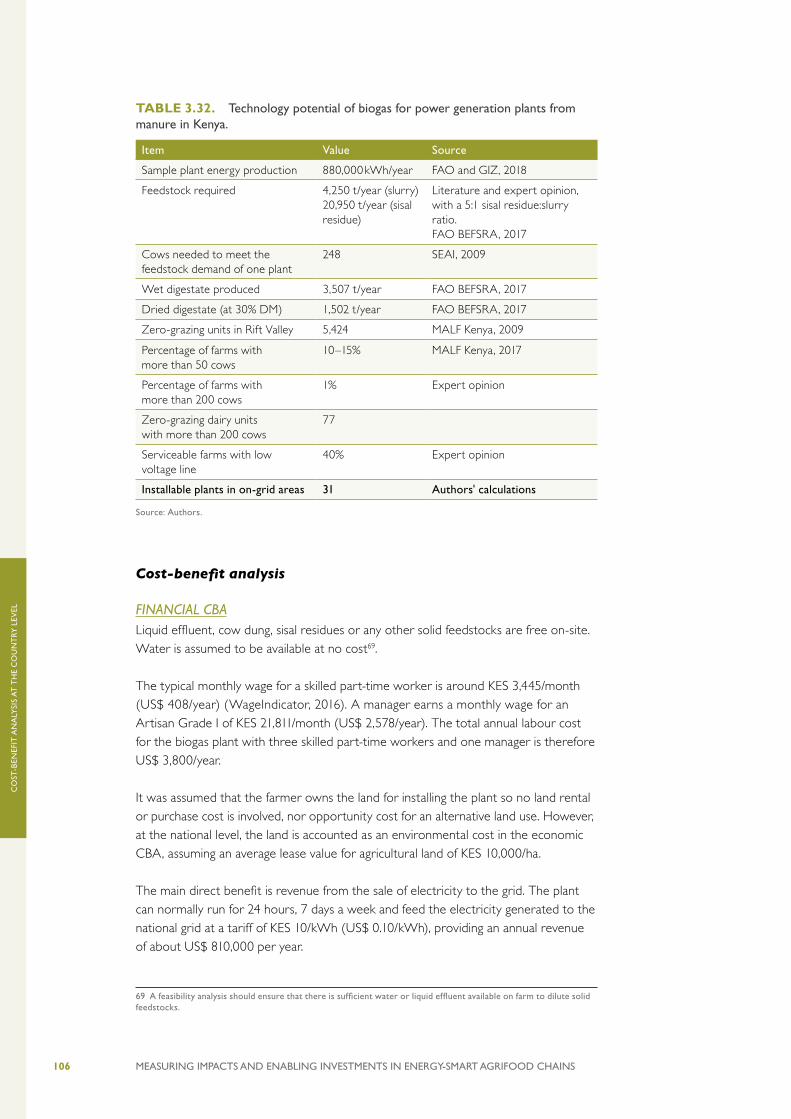
106 MEASURING IMPACTS AND ENABLING INVESTMENTS IN ENERGY-SMART AGRIFOOD CHAINS
CO
ST-B
ENEF
IT A
NA
LYSI
S A
T T
HE
CO
UN
TRY
LEV
EL
TABLE 3.32. Technology potential of biogas for power generation plants from manure in Kenya.
Item Value Source
Sample plant energy production 880,000 kWh/year FAO and GIZ, 2018
Feedstock required 4,250 t/year (slurry)20,950 t/year (sisal residue)
Literature and expert opinion, with a 5:1 sisal residue:slurry ratio.FAO BEFSRA, 2017
Cows needed to meet the feedstock demand of one plant
248 SEAI, 2009
Wet digestate produced 3,507 t/year FAO BEFSRA, 2017
Dried digestate (at 30% DM) 1,502 t/year FAO BEFSRA, 2017
Zero-grazing units in Rift Valley 5,424 MALF Kenya, 2009
Percentage of farms with more than 50 cows
10–15% MALF Kenya, 2017
Percentage of farms with more than 200 cows
1% Expert opinion
Zero-grazing dairy units with more than 200 cows
77
Serviceable farms with low voltage line
40% Expert opinion
Installable plants in on-grid areas 31 Authors' calculations
Source: Authors.
Cost-benefit analysis
FINANCIAL CBALiquid effluent, cow dung, sisal residues or any other solid feedstocks are free on-site. Water is assumed to be available at no cost69.
The typical monthly wage for a skilled part-time worker is around KES 3,445/month (US$ 408/year) (WageIndicator, 2016). A manager earns a monthly wage for an Artisan Grade I of KES 21,811/month (US$ 2,578/year). The total annual labour cost for the biogas plant with three skilled part-time workers and one manager is therefore US$ 3,800/year.
It was assumed that the farmer owns the land for installing the plant so no land rental or purchase cost is involved, nor opportunity cost for an alternative land use. However, at the national level, the land is accounted as an environmental cost in the economic CBA, assuming an average lease value for agricultural land of KES 10,000/ha.
The main direct benefit is revenue from the sale of electricity to the grid. The plant can normally run for 24 hours, 7 days a week and feed the electricity generated to the national grid at a tariff of KES 10/kWh (US$ 0.10/kWh), providing an annual revenue of about US$ 810,000 per year.
69 A feasibility analysis should ensure that there is sufficient water or liquid effluent available on farm to dilute solid feedstocks.

107MEASURING IMPACTS AND ENABLING INVESTMENTS IN ENERGY-SMART AGRIFOOD CHAINS
CO
ST-B
ENEF
IT A
NA
LYSI
S A
T T
HE
CO
UN
TRY
LEV
EL
In the benchmark situation the farm has access to electricity and is backed up by a diesel generator in case of outage. The amount of electricity purchased from the grid supply was assumed to be the same before and after the introduction of the biogas plant since it was assumed that the farm sells all the electricity generated to the grid and buys back the amount required for on-farm activities. Under these assumptions, the investment is not financially attractive as the NPV is negative. In order to make the investment financially viable, the FiT should be above US$ 0.11/kWh. In such case, the financial NPV would be just positive and the investment would pay back at year 20.
ECONOMIC CBA
Value added along the value chainThis technology could potentially avoid milk losses if the electricity produced is used to reliably power a refrigerated milk cooling facility, and could also allow the introduction of other technologies such as automatic milking systems, cow monitoring using GPS, and high pressure irrigation. Such investments can increase both the quality and the quantity of milk produced, resulting in more milk flowing through the value chain. Moreover, the steady load supplied by the biogas plant to the grid could contribute to the electrification of nearby rural communities, enabling the development of new businesses including value-added milk processing. However, the benchmark scenario assumed that each farm already has access to electricity, backed up by a diesel generator. Hence, the impact along the value-chain is zero.
Subsidies and taxes The FiT costs are largely passed on to society and therefore the economic CBA counts the FiT as a cost. However, introduction of the technology would also result in additional revenues for the state. Assuming each plant is imported, an import duty of US$ 15,000 would result, consisting of an import declaration fee (IDF) and a railway development levy, payable on all imports into the country at 1.5% of the customs value of the goods (KRA, 2016). Similarly, spare parts are subject to import taxes. The import of components for the engine service after 60,000–70,000 hours of operation are valued at around US$ 20,000, and hence subject to a duty of about US$ 1,500. Import taxes are included in the economic CBA as benefits.
Assessment of environmental and socio-economic impacts at national levelEnvironmental and socio-economic impacts are associated with many of the indicators linked with this energy system (Table 3.33). Some, such as use of the digestate as fertilizer, GHG emission reduction, and employment creation, can be monetized and so were included in the economic CBA. Others could not be monetized and hence are assessed here using the impact indicator set presented in Chapter 2.

108 MEASURING IMPACTS AND ENABLING INVESTMENTS IN ENERGY-SMART AGRIFOOD CHAINS
CO
ST-B
ENEF
IT A
NA
LYSI
S A
T T
HE
CO
UN
TRY
LEV
EL
TABLE 3.33. Environmental and socio-economic impacts associated with the technical potential of biogas for power generation from manure in Kenya (31 plants with an installed capacity of 150 kW each).70
Impact Description Impact indicator Monetized impact
Fertilizer use The bioreactor gives 3,500 tonnes of wet digestate (at 95% moisture (FAO BEFSRA, 2017)). The majority of farmers in Kenya are unaware of the benefits of drying the digestate, so often give more value to wet digestate. For this reason, the analysis assumes that the wet digestate is sold at US$ 10/t (Williens farm, personal communication, 201770). This value reflects also the benefits in terms of increased soil fertility. At national level, 31 plants would produce about 109,400 tonnes of digestate per year. One single plant (1:5 slurry:sisal residue feedstock mix) would produce digestate containing 91 tonnes of N/year, 16 tonnes of P/year and 13 tonnes of K/year from 175 tonnes (FAO BEFSRA, 2017).
Around 109,000 tonnes of wet digestate/year:2,843 tonnes of N/year;500 tonnes of P/year; 416 tonnes of K/year
US$ 1,094,000/year
Water use and efficiency
With co-digestion of a 5:1 sisal residue:slurry ratio, total solids are 10%. This implies for digester design that no extra water is needed (FAO BEFSRA, 2017). Some water is used for cleaning but the overall increase in water use is negligible. However, if at national level other plant designs and high total solid feedstock mixes are considered, there could be an impact on water use and efficiency. In such case, some water can be recovered when drying the digestate.
– –
Food loss The technology has little impact on the avoidance of food losses on-farm because the majority of large farms are equipped with diesel generators to avoid negative effects of frequent power outages on milk quality from the lack of cooling. A positive impact is the possible improved access to a reliable source of electricity for other farms and residences in the area. However, this indirect effect is very difficult to evaluate as it depends mainly on the local grid, the locality of neighbouring farms, and their willingness to be connected to a local mini-grid. Therefore, the impact of the technology on food loss was not quantified.
– –
Land requirement
The amount of land occupied by each plant is marginal, around 500 m2 for plant. No land is converted to energy crop production to feed the biogas plant. Installing 31 plants uses 1.6 hectares of land at the national level, which at KES 1/m2/year equates to US$ 173/year.
1.6 hectares US$ 173/year
GHG emissions
Avoided emissions are around 500 tonnes CO2eq/year for each plant based on the Kenya grid emission factor (IPCC, 2006). For 31 plants, 16 kt CO2eq/year are avoided.By assuming a social cost of carbon (SCC) of US$ 36/t CO2eq (growing 2% yearly) in the economic CBA, GHG emission reduction was valued around US$ 18,000 per year per plant or about US$ 564,000/year considering the national technical potential.
16,000 tonnes CO2eq/year
US$ 564,000/year
Health risk due to indoor air pollution
It was assumed that no biogas produced replaces woodfuel for cooking. Therefore, there is no impact on this indicator.
– –
70 Interview with Dennis Kirwa, Willens Dairy Farm, in February 2017.

109MEASURING IMPACTS AND ENABLING INVESTMENTS IN ENERGY-SMART AGRIFOOD CHAINS
CO
ST-B
ENEF
IT A
NA
LYSI
S A
T T
HE
CO
UN
TRY
LEV
EL
Fossil fuel consumption
Electricity generation per plant is 811 MWh/year (2,920 GJ/year). 20% of grid electricity is produced using non-renewable sources (crude oil) (IEA, 2017), amounting to 18,220 GJ/year at national level.
18,220 GJ/year –
Access to energy
Most large dairy farms are grid-connected and also equipped with back-up diesel generator so the biogas generation technology will have a negligible impact on access to modern energy 71. Biogas does not replace traditional fuels for cooking.
– –
Household income
It was assumed that the biogas feedstocks are freely available. There is therefore no impact on the income of smaller households (who could sell manure or other crop residues to the plant owners if there was a market).
– –
Time saving No direct impact because the biogas does not replace woodfuel for cooking, hence does not save the time taken to collect it.
– –
Employment The intervention would create new, long-term jobs for 31 managers and 94 skilled part-time workers if 31 plants are constructed. Given the skilled nature of the work and hence the higher level of education and training required, it is likely these jobs would be held by men.
125 new jobs (skilled and long-term)
US$ 119,000/year
Colour code: Positive impact Variable impact Negative impact No or negligible impact
Source: Authors.
PROFITABILITY 71
The results of the financial and economic profitability of the energy intervention at country level (Table 3.34) and the benefits and costs over the investment horizon (Figure 3.24) show the level of profitability of the intervention. The investment does not pay back neither from the financial nor economic perspective because of the high capital cost and the lack of a market for the digestate. The FiT is a benefit from the financial perspective but a cost for the government.
TABLE 3.34. Financial and economic CBA of biogas for power generation from manure in Kenya.
71 A positive indirect effect is due to the provision of a more reliable source of electricity for the households and farms in the nearby area, thus contributing to stabilizing the grid which may become relevant at scale.
Item Unit Value (single intervention)
Value (at scale) Notes
COSTS
Installation costs Thousand US$
570 17,777 FAO and GIZ, 2018
Maintenance costs Thousand US$
10/year for spare parts; 20 for major maintenance
340/year for spare parts; 680 for major maintenance
Major maintenance after 60,000–70,000 hours of engine operation.
Labour cost Thousand US$/year
3.8 119 1 plant manager and 3 skilled part-time employees.
FiT Thousand US$/year
81 2,531 Assuming all the electricity generated is sold to the grid at the FiT price of US$ 0.10/kWh.

110 MEASURING IMPACTS AND ENABLING INVESTMENTS IN ENERGY-SMART AGRIFOOD CHAINS
CO
ST-B
ENEF
IT A
NA
LYSI
S A
T T
HE
CO
UN
TRY
LEV
EL
Land requirement US$/year 5.6 173 Assuming an average lease value for agricultural land of KES 1/m2.
BENEFITS
Electricity sold to the grid
Thousand US$/year
81 2,531 Assuming that all the electricity produced by the plant is sold to the grid.
Import duty on plant
Thousand US$
15 468 Kenya Revenue Authority (KRA, 2016)
Import duty on spare parts
Thousand US$/year
0.3/year for spare parts; 1.5 for major maintenance
10/year for spare parts; 51 for major maintenance
Kenya Revenue Authority (KRA, 2016)
Digestate use Thousand US$/year
35 1,094 Assuming wet digestate is sold for US$ 10/tonne.
GHG emissions avoided
Thousand US$/year
18 564 500 tonnes CO2eq/year avoided at a social cost of US$ 36/tonne CO2eq
Employment creation
Thousand US$/year
3.8 119 1 plant manager and 3 skilled part-time employees.
PROFITABILITY INDICATORS
Financial NPV Thousand US$
–54 –1,698
Financial IRR % 9%
Economic NPV Thousand US$
–202 –6,286
Economic IRR % 5%
Note: Life expectancy of the technology is 20 years. Discount rate is 11%. Financial costs and benefits are in orange. Economic costs and benefits are in green.
Source: Authors.
FIGURE 3.24. Financial and economic cumulative discounted costs and benefits over 20 years of a biogas for power generation plant in Kenya.
Note: Additional non-monetized impacts on fossil fuel consumption occur (Table 3.33).
Source: Authors.
– 400
– 200
– 800
0
600
400
200
Financial net benefits
Subsidies and taxes Employment
Land requirement GHG emissions
Fertilizer use
0 1 2 3 4 5 6 7 8 9 10 11 12 13 14 15 16 17 18 19 20
Tho
usan
d U
S$
years
– 600

111MEASURING IMPACTS AND ENABLING INVESTMENTS IN ENERGY-SMART AGRIFOOD CHAINS
CO
ST-B
ENEF
IT A
NA
LYSI
S A
T T
HE
CO
UN
TRY
LEV
EL
SENSITIVITY ANALYSISThe return on the investment partly depends on the selling price for the digestate. It was assumed there is no market for the dry digestate. The US$ 10/tonne value for wet digestate reflected the benefits in terms of increased soil fertility, hence it appears in the economic CBA as an environmental benefit. Therefore, the financial CBA assumes that the price of both wet and dry digestate is zero. If a better market price was received for the wet digestate, the investment would be more profitable from a financial point of view. The financial NPV would become positive once the price for the wet digestate exceeds US$ 18/tonne (Figure 3.25).
FIGURE 3.25. Financial NPV for a biogas for power generation plant in Kenya according to the wet digestate price.
40
20
0
– 20
– 40
– 60
Fin
anci
al N
PV (
thou
sand
US$
)
0 5 10 15 20 25 30 35 40
Value of (wet) digestate [US$ / t]
80
60
Source: Authors.
RESULTSThe initial investment required to install 31 biogas plants in Kenya amounts to around US$ 18 million. With the current FiT and value of digestate both the financial NPV (US$ –54,000) and the economic NPV (US$ –202,000) over 20 years are negative. The economic NPV is more negative than the financial NPV because the FiT represents a cost for the government. Economic benefits are in terms of digestate use, GHG emission avoided, employment creation and reduction in fossil fuel consumption.

112 MEASURING IMPACTS AND ENABLING INVESTMENTS IN ENERGY-SMART AGRIFOOD CHAINS
CO
ST-B
ENEF
IT A
NA
LYSI
S A
T T
HE
CO
UN
TRY
LEV
EL
FIGURE 3.26. Cumulative economic costs and benefits of biogas for power generation from manure in Kenya at national level after 20 years (31 plants with an installed capacity of 150 kW each).
Financial net bene�ts
GHG emissions
Subsidies and taxes
Employment
Land requirement
Fertilizer use
Fossil fuel consumption18.2 PJ/year
–5
–10
0
–15
–20
–25
5
10
15 1
5
9
–2
–20
US$ 18 millionFor 31 systems
INITIAL INVESTMENTOVER 20 YEARS
US$ –6.3 millionECONOMIC NPV
FINANCIAL IRR
9%
US$ –1.7 millionFINANCIAL NPV
Mill
ion
US$
< 0.1
Note: The sum of the financial NPV and the economic co-benefits and costs is the economic NPV.
Colour code for non-monetized impacts: Positive impact Variable impact Negative impact
Source: Authors.
Data sources
Figure 3.27 illustrates the information needed for estimating the technical potential of the technology, and Table 3.35 summarizes the information and data input needed, and actually used, for the techno-economic analysis.
FIGURE 3.27. Input data for the assessment of the technology potential of biogas for power generation from manure in Kenya.
Note: Blue boxes represent country-related primary input data, green boxes are calculated data,
white boxes are technical info used and the grey box represents the result.
Source: Authors.
Distribution of dairy farms (size of herds/
breeding system)
Available slurry per farm
Suitable and available feedstock for co-digestion (if needed)
Biogas plants technical potential
Slurry produced by dairy cow
Number of farms with large herds
Biogas plant size and feedstock needed
Minimum amount of feedstock required
for a certain plant size
Water required

113MEASURING IMPACTS AND ENABLING INVESTMENTS IN ENERGY-SMART AGRIFOOD CHAINS
CO
ST-B
ENEF
IT A
NA
LYSI
S A
T T
HE
CO
UN
TRY
LEV
EL
TABLE 3.35. Data sources for the CBA of biogas for power generation from manure in Kenya.
Data input International source Source used
Distribution of dairy farms according to size and breeding systems
– Government data and literature
Slurry produced by dairy cows SEAI, 2009 –
Suitable and available feedstock for co-digestion
FAO BEFSRA, 2017 FAO BEFSRA, 2017
Labour cost ILO, 2017 (for some countries)
Literature
Feed-in tariff – Government data and literature
Duty on technology import – Government data and literature
Value of digestate if used as soil conditioner
– Literature and expert opinion
Nutrient content of digestate FAO BEFSRA, 2017 FAO BEFSRA, 2017
Water demand for biogas digestion FAO BEFSRA, 2017 FAO BEFSRA, 2017
GHG emission factor IPCC, 2006 IPCC, 2006
Primary fossil energy for electricity generation
IEA, 2017 IEA, 2017
Note: Shaded rows represent country-related primary input data.
Source: Authors.
Barriers to technology adoption
Several barriers hinder the technology adoption of biogas power generation in Kenya, the main one being the high initial cost of capital investment. The ability of potential users to pay for the construction of biogas plants without any financial assistant is uncertain, in particular with inadequate access to capital due to the high interest rates currently being charged by commercial banks and the perception of high risk by financial institutions.
An additional limitation is the lack of technology knowledge and awareness among potential users. Biogas plants require continuous monitoring, routine maintenance and repair. In Kenya, qualified technicians who specialize on biogas technologies are difficult to find. Therefore, support services for operation, routine maintenance and repair are inadequate. Also, there is limited knowledge about the benefits and support mechanisms of biogas among government authorities, bankers, financiers and project developers. In addition, usually farmers are not aware of the value of the digestate for soil amendment.
Moreover, there can be difficulties in negotiating a power purchase agreement (PPA) for selling electricity to the grid (Heinrich Böll Foundation, 2013) which can therefore be a lengthy and costly process. Also, there is a risk that even after signing the PPA, the electricity company does not pay the producer. Finally, a lack of standards, codes and certification may affect the quality of the installed technology and product acceptability (Table 3.36).

114 MEASURING IMPACTS AND ENABLING INVESTMENTS IN ENERGY-SMART AGRIFOOD CHAINS
CO
ST-B
ENEF
IT A
NA
LYSI
S A
T T
HE
CO
UN
TRY
LEV
EL
TABLE 3.36. Key barriers to the adoption of biogas for power generation from manure in Kenya.
Knowledge and information
Organization/ social
Regulations/ Institutions
Support services/ structures
Financial returns Access/ cost of capital
Lack of qualified experts in the sizing, design and safety of systems, particularly of engineers and technicians specialised in biogas plants
Low awareness of modern biogas technologies
Lack of awareness of the nutrient value of digestate
– The process to negotiate a PPA can be long and complicated
Lack of standard, codes and certification affects the quality of the technology and product acceptability
Lack of support services for installation, operation and maintenance of plants
Limited knowledge amongst public officials
Low financial returns
Inadequate access to capital due to high interest rates and perception of high risk by financial institutions
Source: Authors.
BIOGAS DOMESTIC MILK CHILLER
Technology potential
The biogas domestic chiller (BDMC) is suitable for smallholder dairy farmers with 2–4 cows since it can cool up to 20 litres of milk per day (FAO and GIZ, 2018). The chiller is more likely to be adopted by farms using zero-grazing of improved dairy cattle breeds (SNV, 2017). According to the last national census in 2009, the total number of cattle was 17,467,774, of which 14,112,367 were traditional breeds and 3,355,407 improved. Around 75% of improved cattle are kept on small-scale dairy farms (MALF Kenya, 2017). The average herd size of small-scale dairy production farms is 1.91 heads per household (Egerton, Tegemeo and MSU, 2000). In Kenya, about 1.3 million smallholder dairy farms suitable are considered as a potential market for the BDMC.
However, grid-connected small dairy farmers would not need a biogas chiller, since they are likely to have access to MCCs with refrigeration facilities. It would be more convenient for them to bring the milk directly to the MCCs without incurring spoilage. Assuming the chiller technology is adopted by off-grid farmers and knowing that the percentage of rural population without access to the grid is 93.7% (World Bank, 2016b), the technical potential in Kenya is about 1.2 million small farms (Table 3.37).

The biogas domestic chiller can cool up to 20 litres of milk a day. © SimGas

116 MEASURING IMPACTS AND ENABLING INVESTMENTS IN ENERGY-SMART AGRIFOOD CHAINS
CO
ST-B
ENEF
IT A
NA
LYSI
S A
T T
HE
CO
UN
TRY
LEV
EL
TABLE 3.37. Technology potential of biogas domestic milk chillers in Kenya.
Item Value Source
Number of improved breed cattle 3,355,407 National 2009 population census
Improved cattle kept in small-scale dairy production system
75% MALF Kenya, 2017
Average herd size for small-scale dairy production system (per household)
1.91 Egerton, Tegemeo and MSU, 2000
Number of BDMCs that can be installed 1,317,568 Authors’ calculation
Rural population with access to the grid 6.3% World Bank, 2016b
Number of BDMCs that could be installed in off-grid areas
1,235,000 Authors’ calculation
Source: Authors.
Cost-benefit analysis
FINANCIAL CBAThe CBA was performed at household level and assumed an average herd size of three cows producing 20 litres of milk per day (at morning and evening milking). The morning milk does not have to be cooled since it is delivered directly to the MCC (with cooling facilities) shortly after milking.
In the benchmark situation the milk is never cooled at the household and the evening milk is stored during the night at ambient temperature, resulting in possible bacteria growth making it unsuitable for sale next morning72. After the energy intervention, assuming that family and calf consumption of milk is around 30%, the remaining 7 litres milking in the evening can reach the dairy processor together with the 7 litres of morning milk.
The average farm gate price of raw milk in the Kenya was assumed to be KES 28/l (US$ 0.28/l). No price premium for high quality milk exists in Kenya, although some dairy cooperatives in Western Kenya receive a premium for cooled milk from the main milk processor provided that the milk is below 4 °C. The amount of the incentive depends on the volume of milk delivered and ranges from KES 1.15/l to KES 1.45/l (SimGas, personal communication, 201773). Assuming that households receive US$ 0.28/l milk, they could earn an additional US$ 715 per year by chilling the evening milk (avoided milk loss) and then selling it to a dairy processor if one is located nearby.
The milk chiller requires about 1,000 litres of biogas per day to cool 10 litres of milk with any surplus biogas used for cookstoves.
72 Before the introduction of the domestic milk chiller, almost half of the daily milk production has to be consumed by the farmer’s family, used to feed calves or other farm animals, or sold to neighbours for a low price.
73 See note 62.
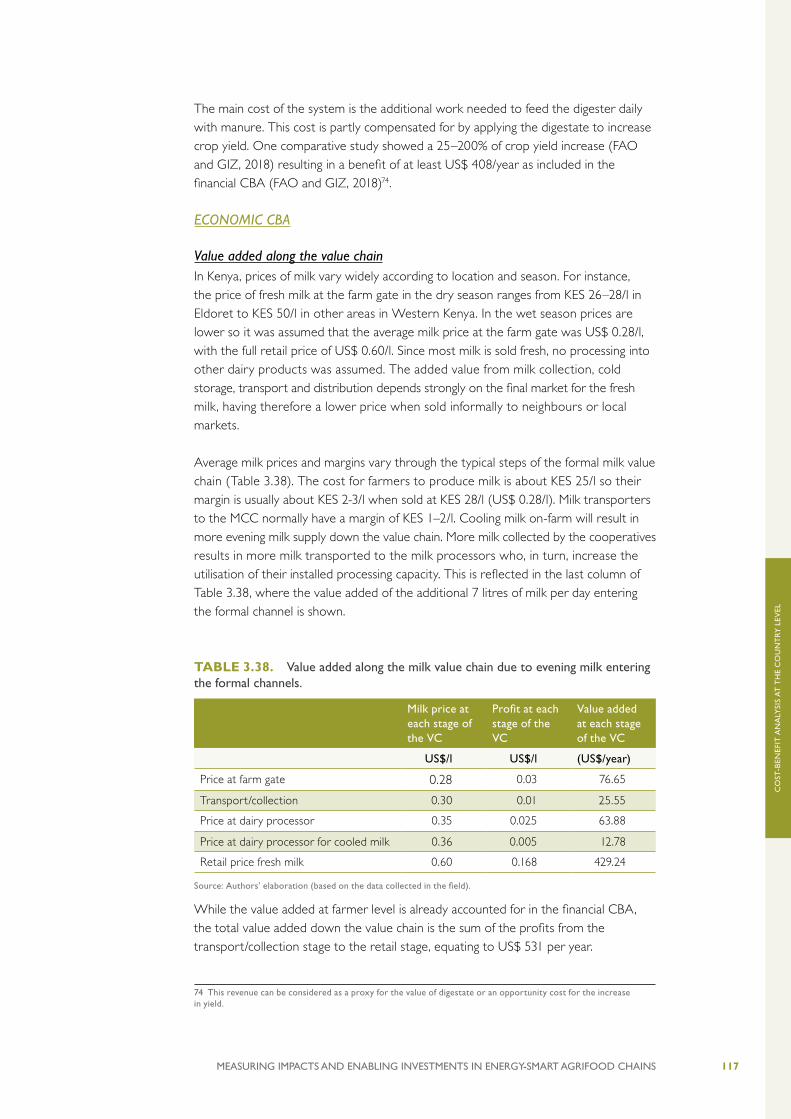
117MEASURING IMPACTS AND ENABLING INVESTMENTS IN ENERGY-SMART AGRIFOOD CHAINS
CO
ST-B
ENEF
IT A
NA
LYSI
S A
T T
HE
CO
UN
TRY
LEV
EL
The main cost of the system is the additional work needed to feed the digester daily with manure. This cost is partly compensated for by applying the digestate to increase crop yield. One comparative study showed a 25–200% of crop yield increase (FAO and GIZ, 2018) resulting in a benefit of at least US$ 408/year as included in the financial CBA (FAO and GIZ, 2018)74.
ECONOMIC CBA
Value added along the value chainIn Kenya, prices of milk vary widely according to location and season. For instance, the price of fresh milk at the farm gate in the dry season ranges from KES 26–28/l in Eldoret to KES 50/l in other areas in Western Kenya. In the wet season prices are lower so it was assumed that the average milk price at the farm gate was US$ 0.28/l, with the full retail price of US$ 0.60/l. Since most milk is sold fresh, no processing into other dairy products was assumed. The added value from milk collection, cold storage, transport and distribution depends strongly on the final market for the fresh milk, having therefore a lower price when sold informally to neighbours or local markets.
Average milk prices and margins vary through the typical steps of the formal milk value chain (Table 3.38). The cost for farmers to produce milk is about KES 25/l so their margin is usually about KES 2-3/l when sold at KES 28/l (US$ 0.28/l). Milk transporters to the MCC normally have a margin of KES 1–2/l. Cooling milk on-farm will result in more evening milk supply down the value chain. More milk collected by the cooperatives results in more milk transported to the milk processors who, in turn, increase the utilisation of their installed processing capacity. This is reflected in the last column of Table 3.38, where the value added of the additional 7 litres of milk per day entering the formal channel is shown.
TABLE 3.38. Value added along the milk value chain due to evening milk entering the formal channels.
Milk price at each stage of the VC
Profit at each stage of the VC
Value added at each stage of the VC
US$/l US$/l (US$/year)
Price at farm gate 0.28 0.03 76.65
Transport/collection 0.30 0.01 25.55
Price at dairy processor 0.35 0.025 63.88
Price at dairy processor for cooled milk 0.36 0.005 12.78
Retail price fresh milk 0.60 0.168 429.24
Source: Authors’ elaboration (based on the data collected in the field).
While the value added at farmer level is already accounted for in the financial CBA, the total value added down the value chain is the sum of the profits from the transport/collection stage to the retail stage, equating to US$ 531 per year.
74 This revenue can be considered as a proxy for the value of digestate or an opportunity cost for the increase in yield.

118 MEASURING IMPACTS AND ENABLING INVESTMENTS IN ENERGY-SMART AGRIFOOD CHAINS
CO
ST-B
ENEF
IT A
NA
LYSI
S A
T T
HE
CO
UN
TRY
LEV
EL
Subsidies and taxes This biogas technology is not produced locally in Kenya and has to be imported, providing a revenue for government. The biogas generator is duty free and exempt of VAT, but subject to an import declaration fee of 2.25%, with a minimum charge of KES 5,000 (US$ 50). Importation of these articles must comply with the national Consumer Product Safety guidelines and requirements, controlled by the Consumer Product Safety Commission (KRA, 2016; Pitney Bowes, 2017).
By comparison, the import duty for importing a refrigerator is 25%, the VAT 0%, and the more important Import Declaration Fee is 2.25% of the total cost, insurance and freight (CIF) (KRA, 2016; Pitney Bowes, 2017). The Kenyan government reduced the import duty on energy efficient cookstoves from 25% to 10% to align them with similar cookstoves and cookers that use gas, electricity and other fuels that currently attract a 10% import duty (GACC, 2016). Therefore, the duty import for the cookstove is US$ 1.5 in the fifth year.
Assessment of environmental and socio-economic impacts at national level
TABLE 3.39. Environmental and socio-economic impacts associated with the technical potential of biogas domestic milk chillers in Kenya (1.2 million systems).
Impact Description Impact indicator
Monetized impact
Fertilizer use Most small households do not use chemical fertilizers to be replaced by cattle manure.
– –
Water use and efficiency
A 6 m3 digester system requires between 50 and 100 litres of water per day to mix with the manure, equating to about 33.8 billion litres annually to supply all chillers.Even if considering the water footprint of the milk loss avoided, around 30 billion litres of water per year are still required. Assuming a value of water of US$ 0.5/m3, the total cost at national level would be US$ 15 million/year.
Around 30 billion litres/year
US$ 15 million/year
Food loss
Milk chillers offer farmers the chance to market higher volumes of milk, which will result in more milk entering formal marketing channels, and therefore adding value down the value chain.
3,154 million litres of milk
Considered in the financial CBA (US$ 94 million/year) and value added (US$ 656 million/year)
Land requirement
No impact since the milk chiller is kept inhouse and the biogas system requires negligible amount of land.
– –
GHG emissions The only emissions which can be directly accounted for are those avoided due to the use of biogas for cooking. The use of a clean cookstove instead of traditional cooking fuels reduces GHG emissions of between 6 and 8 tonnes CO2eq/year. Since only 24% of fuelwood is considered non-renewable, net GHG saving for each domestic system is 1.68 tonnes CO2eq/year (FAO and GIZ, 2018).At national level, emissions avoided due to using biogas for cooking are about 2 million tonnes CO2eq/year. At a carbon price assumed of US$ 36/tonne CO2eq (growing at 2.3% per year) this equates to about US$ 75 million/year.
2 million tonnes CO2eq/year
US$ 75 million/year

119MEASURING IMPACTS AND ENABLING INVESTMENTS IN ENERGY-SMART AGRIFOOD CHAINS
CO
ST-B
ENEF
IT A
NA
LYSI
S A
T T
HE
CO
UN
TRY
LEV
EL
Health risk due to indoor air pollution
Lower respiratory infections are the second main cause of death in Kenya (WHO, 2015b). About 1.2 million women may benefit from the introduction of clean cookstoves (one per household) so the health cost avoided was estimated at US$ 20 per household per year (SimGas estimate), leading to a total of about US$ 25 million/year.
1.2 million women
US$ 25 million/year
Fossil fuel consumption
No impact since in the benchmark situation the milk is not cooled and biogas substitutes woodfuel for cooking.
– –
Access to energy The system improves access to energy for both male- and female-headed households. It is difficult to estimate how many of the 36% of female-headed households would benefit considering they generally own fewer cattle and have lower access to credit and new technologies.Assuming on average 4.4 people per household (KNBS, 2010), about 5 million people could be affected at national level.
5 million people
–
Household income
Impacts on household income include additional revenues from milk selling and digestate and savings on fuel due to the introduction of the biogas cookstove. In the past, the male head of household controlled all income but times have changed. More women in male-headed households have sole control of the income from their milk sales or make joint decisions with men about how to spend the money. Women from female-headed households control the household income. The growing number of women whose men migrate for long periods of time have control over a proportion of all household income. At scale, increased household income from sales of milk and digestate has the potential to economically empower a large proportion of poor rural women and improve their standing in society.Assuming on average 4.4 people per household (KNBS, 2010), about 5 million people could be affected at national level.
5 million people
Considered in the financial CBA (US$ 1,700 million/year)
Time saving The impact on time saving is context specific and hence cannot be estimated.
– –
Employment The introduction of the milk chiller does not have an impact on paid employment but can create employment in the biogas sector. A trained technician in Kenya costs about US$ 2,880 per year (WageIndicator, 2016). In order to install and maintain 1.2 million systems, about 8,000 full-time skilled technicians would be required. Given the higher rate of illiteracy and fewer technical skills of rural women compared to men, the technicians are more likely to be men, unless women are proactively trained and empowered to take on the role as well. This would generate employment valued at about US$ 23 million/year.
8,230 full-time skilled technicians
US$ 23 million/year
Colour code: Positive impact Variable impact Negative impact No or negligible impact
Source: Authors.
PROFITABILITY The financial NPV of the BDMC in Kenya is very positive, with a financial IRR of 73% and a payback time of less than 2 years (Table 3.40). Additional economic benefits include added value along the supply chain and tax revenues received from duty import. The adoption of biogas cookstoves together with milk chillers at the domestic scale generates a reduction in GHG emission and health risk associated to indoor air pollution. Finally, the introduction of the technology at national level has a positive

120 MEASURING IMPACTS AND ENABLING INVESTMENTS IN ENERGY-SMART AGRIFOOD CHAINS
CO
ST-B
ENEF
IT A
NA
LYSI
S A
T T
HE
CO
UN
TRY
LEV
EL
impact on employment creation. The only environmental cost associated with the introduction of the technology is a slight increase in water use. The benefits and costs over the investment horizon (Figure 3.28) show the level of profitability from the intervention.
TABLE 3.40 Financial and economic CBA of biogas domestic milk chillers in Kenya.
Item Unit Value (single intervention)
Value (at scale) Notes
COSTS
Installation costs Thousand US$
1.60 1,975,298 Assumption (for a 6 m3 digester, milk chiller, stove, installation, piping, training and 2-years full service).
Replacement costs US$ US$ 15 every 5 years for cookstove + US$ 20 every year for pellets for milk chiller
US$ 18 million every 5 years for cookstove + US$ 25 million every year for pellets for milk chiller
FAO and GIZ, 2018
Additional labour cost (equivalent)
Thousand US$/year
0.20 247,838 Assuming that non-paid on-farm work has an opportunity cost equal to the Minimum Consolidated Wages for general workers in rural areas in Kenya (with effect from May 1, 2015) of KES 54.70/h (WageIndicator, 2016).
Water use Thousand US$/year
0.01 15,321 Assuming a value of water of US$ 0.5/m3.
BENEFITS
Additional income from milk sales
Thousand US$/year
0.72 883,205 Milk farm gate price: US$ 0.28/litre; additional quantity sold per day: 7 litres.
Digestate Thousand US$/year
0.41 503,701 FAO and GIZ, 2018
Savings on cooking fuel
Thousand US$/year
0.25 308,640 Due to cookstove (FAO and GIZ, 2018).
Tax revenues from duty on technology import
US$/year US$ 1.5 every 5 years for cookstove
US$ 2 million every 5 years for cookstove
Biogas generator is duty free and exempt of VAT. The import duty rate for importing fridge into Kenya is 25%, the import VAT is 0%. Import duty on energy efficient cookstoves is 10%.
Value added Thousand US$/year
0.53 656,095 Authors’ estimate
GHG emissions avoided
Thousand US$/year
0.06 74,666 Only 24% of fuelwood is considered non-renewable, resulting in a net GHG saving of 1.68 tonnes CO2eq/year.
Health risk due to indoor air pollution
Thousand US$/year
0.02 24,691 US$ 20 per household per year (SimGas estimate).
Employment creation
Thousand US$/year
0.02 23,704 4 technicians can install and maintain about 600 systems. A trained techni-cian costs about US$ 2,880 per year.

121MEASURING IMPACTS AND ENABLING INVESTMENTS IN ENERGY-SMART AGRIFOOD CHAINS
CO
ST-B
ENEF
IT A
NA
LYSI
S A
T T
HE
CO
UN
TRY
LEV
EL
PROFITABILITY INDICATORS
Financial NPV Thousand US$ 5.2 6,429,953
Financial IRR % 73%
Economic NPV Thousand US$ 8.9 10,980,197
Economic IRR % 112%
Note: Life expectancy of the technology is 10 years (lifetime of the milk chiller). Discount rate is 11%. Financial costs and benefits are in orange. Economic costs and benefits are in green.
Source: Authors.
FIGURE 3.28. Financial and economic cumulative discounted costs and benefits over 10 years of a biogas domestic milk chiller in Kenya.
0 1 2 3 4 5 6 7 8 9 10
– 2
2
4
6
8
10
0
Financial net benefits
Subsidies and taxes
Water use and efficiency
Value added along the VC
GHG emissions
Employment
Tho
usan
d U
S$
years
Note: Additional non-monetized impacts on access to energy and time saving occur (Table 3.40).
Source: Authors.
RESULTSBiogas domestic milk chillers are an interesting energy intervention for the dairy sector in Kenya given the large number of small dairy farms with improved breeding cows in off-grid areas. The US$ 1,600 capital cost per unit is a barrier to its adoption, even though, from the financial point of view the payback period is less than 2 years due to the additional revenue, the value of the digestate as fertilizer and the savings of fuelwood for cooking (assuming there is surplus biogas used for cooking). The only additional cost is the time required to feed the digester (monetized as an opportunity cost).
From the economic point of view, the adoption of biogas milk chillers adds value along the milk value chain by increasing the quantity of milk that enters the formal channels. Duty paid on imported cookstoves generates additional revenue for the government. The avoided woodfuel used for cooking reduces GHG emissions and health risks, particularly for women. The adoption of the technology brings benefits from employment but has negative impacts on water use and extra time. The technology has a positive impact on access to energy.
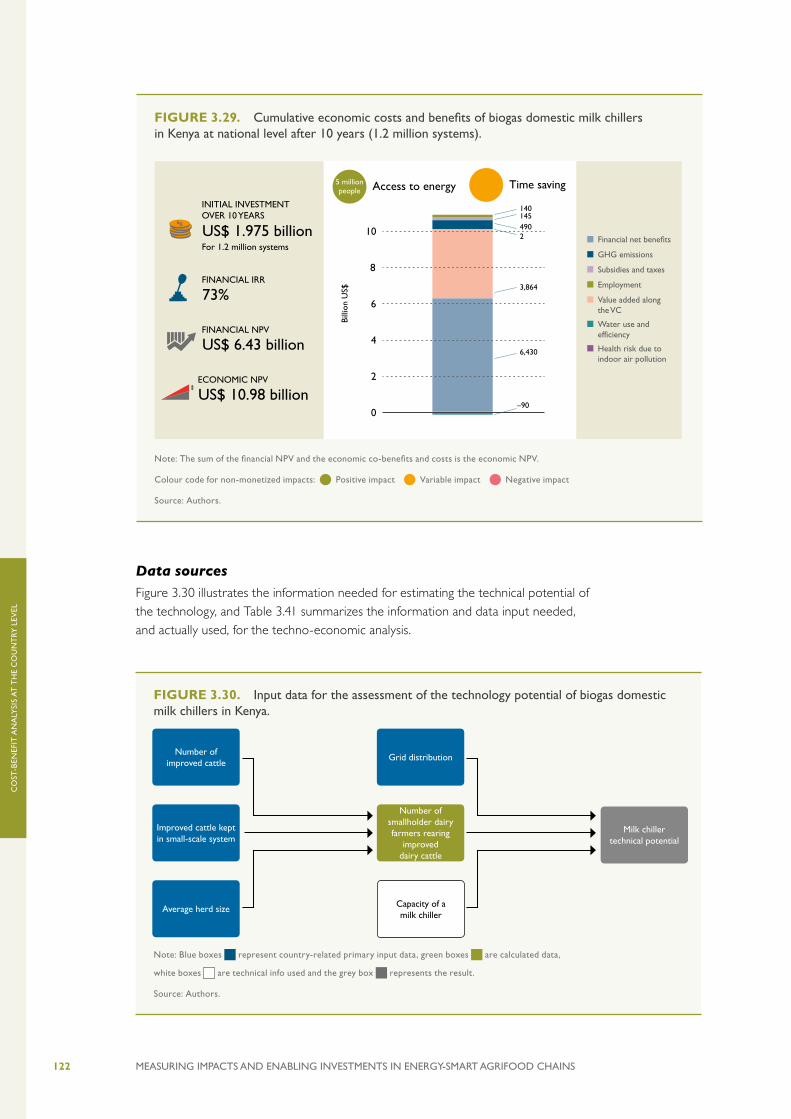
122 MEASURING IMPACTS AND ENABLING INVESTMENTS IN ENERGY-SMART AGRIFOOD CHAINS
CO
ST-B
ENEF
IT A
NA
LYSI
S A
T T
HE
CO
UN
TRY
LEV
EL
Data sources
Figure 3.30 illustrates the information needed for estimating the technical potential of the technology, and Table 3.41 summarizes the information and data input needed, and actually used, for the techno-economic analysis.
FIGURE 3.30. Input data for the assessment of the technology potential of biogas domestic milk chillers in Kenya.
Note: Blue boxes represent country-related primary input data, green boxes are calculated data,
white boxes are technical info used and the grey box represents the result.
Source: Authors.
Improved cattle kept in small-scale system
Average herd size
Number of improved cattle
Grid distribution
Number of smallholder dairy farmers rearing
improved dairy cattle
Capacity of a milk chiller
Milk chiller technical potential
FIGURE 3.29. Cumulative economic costs and benefits of biogas domestic milk chillers in Kenya at national level after 10 years (1.2 million systems).
6,430
2
140145490
3,864
–90
6
4
0
2
8
10US$ 1.975 billion For 1.2 million systems
INITIAL INVESTMENTOVER 10 YEARS
US$ 10.98 billionECONOMIC NPV
FINANCIAL IRR
73%
US$ 6.43 billionFINANCIAL NPV
Billi
on U
S$
Financial net bene�ts
GHG emissions
Subsidies and taxes
Employment
Value added along the VC
Water use and efficiency
Health risk due to indoor air pollution
Access to energy5 millionpeople
Time saving
Note: The sum of the financial NPV and the economic co-benefits and costs is the economic NPV.
Colour code for non-monetized impacts: Positive impact Variable impact Negative impact
Source: Authors.

123MEASURING IMPACTS AND ENABLING INVESTMENTS IN ENERGY-SMART AGRIFOOD CHAINS
CO
ST-B
ENEF
IT A
NA
LYSI
S A
T T
HE
CO
UN
TRY
LEV
EL
TABLE 3.41. Data sources for the CBA of biogas domestic milk chillers in Kenya.
Data input International source Source used
Number of improved cattle – Government data
Improved cattle kept in small-scale dairy production system
– Government data
Average herd size per household
– Literature
Grid distribution World Bank, 2016b World Bank, 2016b
Labour cost ILO, 2017 (for some countries)
Literature
Milk selling price and value added along the value chain
– Government data and Literature
Value of digestate – Literature
Diesel/gasoline fuel prices World Bank, 2016c Literature and World Bank, 2016c
Share of fuels used for cooking
– Literature
Duty on technology import – Government data
GHG emission factor for woodfuel
IPCC, 2006 IPCC, 2006
Note: Shaded rows represent country-related primary input data.
Source: Authors.
Barriers to technology adoption
One barrier is poor awareness about the technology. A possible strategy to increase adoption is to target the formal dairy market (smallholder dairy farmers who are active members of dairy cooperatives) before targeting the informal market (SimGas, 2016). The cooperatives could then present the benefits of the technology to its members and become an important multiplicator to influence change both at county and national levels.
Another barrier is the initial capital, which can be too high for farmers without access to credit. This obstacle can be overcome by working with micro-finance institutions (MFIs) on a lease-to-own financing model. This model is becoming increasingly common in East Africa where the loan portfolios of solar PV companies are active and show that 99% of customers are paying on time (SimGas, 2016). A supplier could arrange for customers to gain lease financing from an MFI over a 12-, 24- or 36-month period, depending on the outcome of the credit risk assessment by the MFI. Once a loan has been approved by the MFI, the supplier technicians can deliver and install the chiller. After commissioning and training, customers make monthly payments through one of the established mobile phone money payment systems such as M-PESA, which keeps track of the payments made. Variable milk prices in different seasons and areas may however hinder the financial returns from the investment. Other barriers can be poor management of the digester and the milk cooler as well as delays in delivery of the technology in more remote areas because of transport issues (SimGas, 2016).

Using manure for biogas production reduces GHG emissions and health risk. © GIZ/Alex Kamweru

125MEASURING IMPACTS AND ENABLING INVESTMENTS IN ENERGY-SMART AGRIFOOD CHAINS
CO
ST-B
ENEF
IT A
NA
LYSI
S A
T T
HE
CO
UN
TRY
LEV
EL
The improvement of public sector services is also critical for the adoption of the technology as well as for the development of the milk value chain. Extension training, food safety monitoring and control, disease monitoring and control, improved roads, as well as water supply and sanitation are often weak or lacking (USAID, 2012). For instance, potable water is key to producing quality milk. The introduction of milk quality standards at a national level can drive milk quality upgrading. Currently farmers lack any incentive to improve milk quality and hygiene.
Potential barriers and risks to the adoption of biogas-powered milk domestic chiller in Kenya are summarized in Table 3.42.
TABLE 3.42. Key barriers to the adoption of biogas domestic milk chillers in Kenya.
Knowledge and information
Organization/ social
Regulations/ institutions
Support services/ structures
Financial returns
Access/ cost of capital
Lack of awareness about the technology and its benefits
Lack of incentives for a farmer to improve milk quality and hygiene (with no price premium for quality)
No milk quality standards at national level
Limited knowledge amongst public officials
High distribution costs especially to farmers in remote rural areas
Weak infra-structure (e.g. regarding roads and water sanitation)
Milk price variability can make the investment financially less viable
High initial investment costs for small dairy farmers
Difficult to gain access to credit for small dairy farmers
Source: Authors.
SOLAR MILK COOLER
Technology potential
The Kenya Dairy Board (KDB) collects information on the dairy business units in Kenya, including milk dispensers, processors, cottage industries, cooling plants and mini dairies (KDB, 2017). By looking at the business units with installed capacity between 300 and 600 litres, it is possible to estimate a rough potential for the solar milk chiller technology. There are about 187 installed business units with such capacity, of which 167 are operational. The number of these dairy business units working off-grid is unknown. Access to electricity was 23% in 2012 (World Bank, 2016b). Therefore, a similar share of access to energy for dairy business units was assumed. The potential for solar milk coolers is then estimated to be around 125 units (Table 3.43). In fact, the analysis assumes that the solar milk chillers replace direct expansion (DX) diesel-powered units with an equivalent capacity.

126 MEASURING IMPACTS AND ENABLING INVESTMENTS IN ENERGY-SMART AGRIFOOD CHAINS
CO
ST-B
ENEF
IT A
NA
LYSI
S A
T T
HE
CO
UN
TRY
LEV
EL
TABLE 3.43. Dairy business units with an installed capacity between 300 and 600 litres in Kenya.
Operational capacity Installed capacity
Total capacity l/day 45,677 75,960
Average capacity l/day 275 408
Business units n. 167 187
Business units off-grid n. 112 125
Source: Authors’ elaboration based on KDB, 2017.
Solar milk coolers are more efficient than traditional DX coolers and therefore reduce milk wastage and eliminate the cost of purchasing diesel. Each system can cool up to 1,200 litres of milk per day (600 litres each in the morning and in the evening) but the analysis considered an average use limited to 600 l/day (300 litres each in the morning and in the evening). Each unit can cool the milk from about 85 cows (assuming an average milk productivity of 7 l/day/cow), therefore it can serve between 9 and 29 small dairy farmers (with 10 and 3 cows each respectively).
It was assumed that the cooperative buys the milk from the farmers twice per day at US$ 0.28/l, paying US$ 0.02/l for transport, and delivering the cooled milk to the dairy processor for a price of US$ 0.35/l75. For each litre of milk the cooperative earns a margin of US$ 0.08.
The final price of the milk depends on its use and destination, but on average it was assumed to be US$ 0.60/l. If the cooperative reaches the consumers, hotel and caterers directly it could realize a higher price and therefore incorporate the benefits received along the value chain.
Cost-benefit analysis
FINANCIAL CBAThe costs and benefits for a collective farmer cooperative investing in a solar milk cooler were compared with a benchmark cooling system of a 10 kW diesel generator and a 600 l DX milk cooler. The costs for the benchmark system are dependent on the price of diesel fuel, the efficiency of the generator to convert diesel to electricity, and the capital cost (FAO and GIZ, 2018). The benchmark system (milk cooler and equipment, diesel generator, 3-phase motor, washing equipment and water heater) has a capital cost of US$ 10,500, with the replacement of generator and milk cooler equipment every 8 years for a cost of around US$ 8,500. Assuming an engine efficiency of 30%, diesel-powered milk coolers consume about 8.5 litres of diesel per day at a price of KES 80/l76 (US$ 0.80/l), giving an annual fuel cost of about US$ 2,500. A solar milk cooler would avoid these fuel costs as well as repair and maintenance costs.
75 Milk prices were assumed constant over the 20-year period since the increasing trend in price (increased by 9% in the period 2000–2014) was considered to be counter-balanced by inflation.
76 The price of diesel is assumed to be constant throughout the 20 years. An increase in diesel price will improve the NPV and IRR of investing in the solar milk cooler.

127MEASURING IMPACTS AND ENABLING INVESTMENTS IN ENERGY-SMART AGRIFOOD CHAINS
CO
ST-B
ENEF
IT A
NA
LYSI
S A
T T
HE
CO
UN
TRY
LEV
EL
A 600 litre solar milk cooler system can be purchased for about US$ 40,000, including a cooling unit and ice bank, 6 kW solar PV system, a rack, batteries, inverters and controls, and the shipping container with insulated walls and roof, LED lighting, stainless steel wash sink with hot and cold water connections, water heater and a stainless steel table (FAO and GIZ, 2018). The ice bank can cool 2,500 litres of milk with no additional energy input, so the cooler can operate for several days without sunshine. In sunny weather, a few hours of operation are sufficient to create the ice and the ice water can chill and maintain milk at 4 °C for 3 to 5 days with no further solar input.
Since both the benchmark system as well as the solar milk cooler would need to be washed, no additional water requirement was accounted for in the financial CBA.
The system can cool milk to 4 °C in less than 1 hour whereas conventional DX chillers can take up to 3–4 hours. By cooling the milk faster, the solar cooler can reduce bacterial growth and rejection due to poor quality. Data on the quantity of milk that can be saved by faster cooling is unavailable. The amount of annual milk loss at the production stage in East Africa is 6% of total production (627,000 tonnes) and 11% (1,232,000 tonnes) at the post-harvest stage, with a total of about 650,000 tonnes in Kenya alone (FAOSTAT, 2017)77. It was assumed that due to the milk cooler a cooperative could reduce its losses from 11% to about 6%, equivalent to 30 l/day. From avoiding wasting 5% of the milk collected, the cooperative would have an additional revenue of US$ 876 per year.
ECONOMIC CBA
Value added along the value chainIt was assumed that the cooperative would sell the cooled milk for US$ 0.35/l to a dairy processor after buying it from the farmers for US$ 0.25/l. For each litre of milk, the cooperative pays a collection/transport price of US$ 0.02/l, leading to a profit of around US$ 0.08 per litre of milk cooled for the cooperative. After the introduction of the solar milk cooler the cooperative reduces the milk rejection of 5% (10,950 l/year) due to faster milk cooling. Therefore, the financial analysis incorporates an additional revenue of US$ 876 per year.
Local production of better quality milk contributes to meeting the growing demand for milk products in the region and thus has a strong economic development potential. The value added down the value chain for each litre of milk was assumed to be around US$ 0.20/l and the retail price of fresh milk to be US$ 0.60/l (Table 3.38). By saving about 30 litres of milk per day from rejection and/or spoilage, a solar milk cooler generates an economic value added along the value chain of about US$ 2168/year. This value added is spread between dairy processors, transporters, retailers and other agents down the value chain. If the cooperative sold the cooled milk directly to consumers, hotels, caterers or the market at the price of US$ 0.60/l, it would incorporate this benefit into its margin.
77 According to FAOSTAT (2017), Kenya fresh cow milk production in 2014 was 3,796,000 tonnes.

128 MEASURING IMPACTS AND ENABLING INVESTMENTS IN ENERGY-SMART AGRIFOOD CHAINS
CO
ST-B
ENEF
IT A
NA
LYSI
S A
T T
HE
CO
UN
TRY
LEV
EL
Subsidies and taxes In Kenya solar milk coolers do not benefit from subsidies or incentives. Solar-powered equipment and accessories (including deep cycle sealed batteries which exclusively use and/or store solar power) are exempt from import duty (KRA, 2016). Therefore, there is no impact on public expenditures due to the purchase of a solar milk cooler.
A tax of US$ 0.40 per litre of diesel (The Star, 2016) is avoided by the adoption of a solar milk cooler. Therefore, the government loses revenue of US$ 1,243 per year from diesel tax, based on 3,103 litres of diesel used to power a standard DX milk cooler.
Assessment of environmental and socio-economic impacts at national level
TABLE 3.44. Environmental and socio-economic impacts associated with the technical potential of solar milk coolers in Kenya (125 systems).
Impact Description Impact indicator
Monetized impact
Fertilizer use No impact – –
Water use and efficiency
About 100 litres of water per day is used to clean the system both in the benchmark and solar milk cooler case (FAO and GIZ, 2018). The impact compared to the benchmark scenario is therefore negligible.
– –
Food loss Improved cooling performance results in less rejection at the next stage of the value chain. The overall added value of the avoided milk loss (30l/day) is more than US$ 3,000/year per unit totalling about US$ 380,000/year.
1.37 million litres/year
US$ 380,000/year (US$ 110,000/year as financial benefit and US$ 270,000/year as value added)
Land requirement
One unit requires 15 m2 of land, corresponding to around 0.2 ha for 125 units. The overall impact is therefore negligible.
– –
GHG emissions Considering a GHG emission factor for diesel of 0.268 kg CO2eq/kWh (default emission factors for stationary combustion in agriculture from IPCC, 2006), a diesel generator efficiency of 27.5% and an electricity consumption of 9,636 kWh/year (600 litre cooler), each solar milk cooler avoids emissions of around 10 tonnes CO2eq per year. This corresponds to US$ 338/year per plant or about US$ 42,000/year at country level (assuming a SCC of US$ 36/t CO2eq).
1,200 tonnes CO2eq/year
US$ 42,000/year
Health risk due to indoor air pollution
No impact – –
Fossil fuel consumption
The introduction of a solar milk cooler to replace a diesel-powered chiller would avoid combusting more than 3,000 litres of diesel per year (123 GJ/year). This corresponds to 15,415 GJ of diesel at national level, equivalent to 61,660 GJ/year of crude oil (primary energy).
61,660 GJ/year
–
Access to energy The impact on access to energy could be only marginal (small appliances can be powered by the system) and therefore is considered negligible.
– –

129MEASURING IMPACTS AND ENABLING INVESTMENTS IN ENERGY-SMART AGRIFOOD CHAINS
CO
ST-B
ENEF
IT A
NA
LYSI
S A
T T
HE
CO
UN
TRY
LEV
EL
Household income
The impact on household income (of the cooperative members) depends on the structure of the dairy cooperative and the number of cows per household. The number of farmers affected by each solar milk cooler can vary from about 29 (assuming 3 cows/household) to 9 (10 cows/household). With a market milk price of US$ 0.28/l the benefits for a 3-cow-herd owner would be about US$ 100/year and US$ 350/year for a 10-cow-herd owner. These benefits are accounted for in the financial CBA when the farmers own the solar milk cooler through the cooperative/union. The extent to which increased revenue affects gender equality depends on women’s access to the dairy cooperatives. Research suggests that in Kenya, dairy cooperatives can be evenly mixed or include mainly men or mainly women. At scale, women therefore stand to benefit equally from increased income generated by cooperatives compared to men. This assumes that men do not take over the activity once it becomes more profitable.
1,000–4,000 people
Considered in the financial CBA (US$ 110,000/year)
Time saving No impact on the time saving of the people working for the cooperative, since it will not change the structure of the value chain but only its efficiency.
– –
Employment The introduction of solar milk coolers can have a potential positive indirect impact since it requires the development of new supporting services for solar technologies. Moreover, if production, storage, handling and processing of milk are to improve gender equality, both women and men need equal access to information about new employment opportunities, training, membership of dairy cooperatives and self-help groups, and complementary inputs and services, such as land, labour and credit. The overall impact is however negligible.
– –
Colour code:
Positive impact Variable impact Negative impact No or negligible impact
Source: Authors.
PROFITABILITYFrom a financial point of view, the investment is not attractive since it has a payback time of more than 15 years and a NPV of US$ 1,500 (Table 3.45). However, the financial benefits can be much higher if the price of milk or the price of diesel would be assumed to increase over time. In any case, Figure 3.31 shows that economically the investment pays back after less than 10 years and that it has a very positive economic NPV, mainly due to the value added along the food chain and the avoided GHG emission. The economic analysis shows the avoided revenues from the tax on diesel as a cost.

© GIZ/Ursula Meissner

131MEASURING IMPACTS AND ENABLING INVESTMENTS IN ENERGY-SMART AGRIFOOD CHAINS
CO
ST-B
ENEF
IT A
NA
LYSI
S A
T T
HE
CO
UN
TRY
LEV
EL
TABLE 3.45. Financial and economic CBA of solar milk coolers in Kenya.
Item Unit Value (single intervention)
Value (at scale) Notes
COSTS
Installation costs Thousand US$
10.5–40 3,696 Benchmark diesel generator and standard DX cooler: US$ 10,500 (with diesel generator replacement every 8 years); Solar milk cooler: US$ 40,000 (FAO and GIZ, 2018)
Replacement cost Thousand US$
Battery replacement at US$ 3,000 every 10 years
Battery replacement at US$ 356,000 every 10 years
Energy costs Thousand US$/year
–2.49 –311 Assuming constant diesel price of US$ 0.80/l.
Avoided tax revenue from diesel
Thousand US$/year
1.2 156 A tax of US$ 0.40 per litre of diesel (The Star, 2016) for 3,103 litres is avoided.
BENEFITS
Additional milk revenues
Thousand US$/year
0.9 110 Due to reduction from 11% to 6% of milk rejected due to quicker cooling (5% = 30l/day) based on table 3.38.
Value added along the value chain
Thousand US$/year
2.2 272 At average prices, assuming that 30 l/day of milk are saved.
GHG emissions avoided
Thousand US$/year
0.3 43 Considering a GHG emission factor for diesel of 0.268 kg CO2eq/kWh (IPCC default emission factors), each solar milk cooler would avoid about 10 t CO2eq per year.
PROFITABILITY INDICATORS
Financial NPV Thousand US$
1.5 188
Financial IRR % 12%
Economic NPV Thousand US$
12.1 1,512
Economic IRR % 17%
Note: The following assumptions were made for the analysis: US$ 1.00 = KES 100; a discount rate of 11%; a final price of diesel of US$ 0.80/l. Financial costs and benefits are in orange. Economic costs and benefits are in green.
Source: Authors.

132 MEASURING IMPACTS AND ENABLING INVESTMENTS IN ENERGY-SMART AGRIFOOD CHAINS
CO
ST-B
ENEF
IT A
NA
LYSI
S A
T T
HE
CO
UN
TRY
LEV
EL
RESULTSWith a technical potential for 125 solar milk coolers that could be introduced as alternative to diesel generation and a DX cooler, the total initial investment required would be about US$ 5 million. From the financial point of view, the main benefits of the technology are in terms of milk loss reduction (a financial benefit for farmers groups and cooperatives) and the savings from not purchasing diesel fuel. Without a price premium for cooled milk however, the payback period is more than 15 years, given the significant initial investment required.
From the economic perspective, the introduction of solar milk coolers can have a significant impact on the value added along the milk value chain. Each litre saved at this stage increases the value along the chain. The technology also avoids GHG emissions. On the other hand, since diesel is taxed in Kenya, the government loses tax revenues (Figure 3.32). An additional not monetized co-benefit is in terms of fossil fuel consumption which decreases by 61,660 GJ per year.
FIGURE 3.31. Financial and economic cumulative discounted costs and benefits over 20 years of a solar milk cooler in Kenya.
Financial net benefits
Subsidies and taxes Value added along the VC
GHG emissions
Tho
usan
d U
S$
years0 1 2 3 4 5 6 7 8 9 10 11 12 13 14 15 16 17 18 19 20
– 30
– 10
0
10
20
30
– 20
Note: Additional non-monetized impacts on fossil fuel consumption occur (Table 3.45).
Source: Authors.

133MEASURING IMPACTS AND ENABLING INVESTMENTS IN ENERGY-SMART AGRIFOOD CHAINS
CO
ST-B
ENEF
IT A
NA
LYSI
S A
T T
HE
CO
UN
TRY
LEV
ELData sources
Figure 3.33 illustrates the information needed for estimating the technical potential of the technology, and Table 3.46 summarizes the information and data input needed, and actually used, for the techno-economic analysis.
FIGURE 3.32. Cumulative economic costs and benefits of solar milk coolers in Kenya at national level after 20 years (125 systems).
0.5
0
1.0
– 0.5
1.5
2.0
2.5
3.0
0.40
2.16
0.19
–1.24
–1.0
–1.5
US$ 5 million For 125 systems
INITIAL INVESTMENTOVER 20 YEARS
US$ 1,515,000
ECONOMIC NPV
FINANCIAL IRR
12%
US$ 188,000
FINANCIAL NPV Mill
ion
US$
Financial net bene�ts
GHG emissions
Subsidies and taxes
Value added along the VC
Fossil fuel consumption61,660 GJ/year
Note: The sum of the financial NPV and the economic co-benefits and costs is the economic NPV.
Colour code for non-monetized impacts: Positive impact Variable impact Negative impact
Source: Authors.
FIGURE 3.33. Input data for the assessment of the technology potential of solar milk coolers in Kenya.
Note: Blue boxes represent country-related primary input data, green boxes are calculated data,
white boxes are technical info used and the grey box represents the result.
Source: Authors.
Capacity of installed dairy business units
Milk cooler technical potential
Grid distribution
Solar milk cooler technical potential
Capacity of a solar milk cooler

134 MEASURING IMPACTS AND ENABLING INVESTMENTS IN ENERGY-SMART AGRIFOOD CHAINS
CO
ST-B
ENEF
IT A
NA
LYSI
S A
T T
HE
CO
UN
TRY
LEV
EL
TABLE 3.46. Data sources for the CBA of solar milk coolers in Kenya.
Data input International source Source used
Distribution and capacity of organized dairy business units – Literature and Government data
Grid distribution/electrification rate World Bank, 2016b World Bank, 2016b
Labour cost ILO, 2017 (for some countries)
Literature
Energy costs – Literature and Government data
Milk selling price and value added along the value chain – Literature and expert opinion
Duty on technology import and replacement – Government data
GHG emission factor IPCC, 2006 IPCC, 2006
Primary fossil energy for electricity generation IEA, 2017 IEA, 2017
Note: Shaded rows represent country-related primary input data.
Source: Authors.
Barriers to technology adoption
A barrier for the adoption of solar milk coolers is their relatively high initial cost. The key to affordability is low cost financing and making the technology available to poor farmers through dairy farmer cooperatives that can get finance to purchase the solar milk chiller and then operate it. The financing could be arranged in a way that the monthly repayment cost is less than the previous monthly cost for diesel fuel.
Reducing the capital cost of the technology is also important. The companies SDG and Packo have partnered to manufacture, sell and service the solar milk chillers worldwide. The first two prototypes were bought by Nestlé for US$ 50,000, but the aim of SDG and Packo is to reduce this price. For instance, similar technologies without the container can cost much less.
Milk price fluctuations are an additional barrier to adoption. Farmers prefer a stable milk price but it fluctuates a lot over the season with changing milk volumes reaching the market. Currently there is no-quality based payment system and no guarantee of milk quality. Introducing such a system could increase incentives for farmers to improve the hygiene by cooling their milk. The fluctuations of diesel price may also improve the financial returns of solar technologies.
Finally, the deployment of the solar sector (in particular solar chilling technology) in the country requires services for operation, maintenance and installation of the system especially in rural areas and the development of good infrastructure.

135MEASURING IMPACTS AND ENABLING INVESTMENTS IN ENERGY-SMART AGRIFOOD CHAINS
CO
ST-B
ENEF
IT A
NA
LYSI
S A
T T
HE
CO
UN
TRY
LEV
EL
TABLE 3.47. Key barriers to the adoption of solar milk coolers in Kenya.
Knowledge and information
Organization/ social
Regulations/ Institutions
Support services/ structures
Financial returns Access/ cost of capital
Lack of awareness of the technology
Lack of incentive for a farmer to improve milk quality and hygiene
No regulation to ensure standards for solar technology (avoid counterfeit products)
Shortage of qualified technicians in rural areas to install and maintain the system
No strict milk quality check at the collection stage reduces incentives for farmers to improve the hygiene and cool their milk
Low financial returnsMilk price variability
High initial investment costs for dairy smallholder groups
Lack of financing solutions for dairy smallholder groups
Source: Authors.
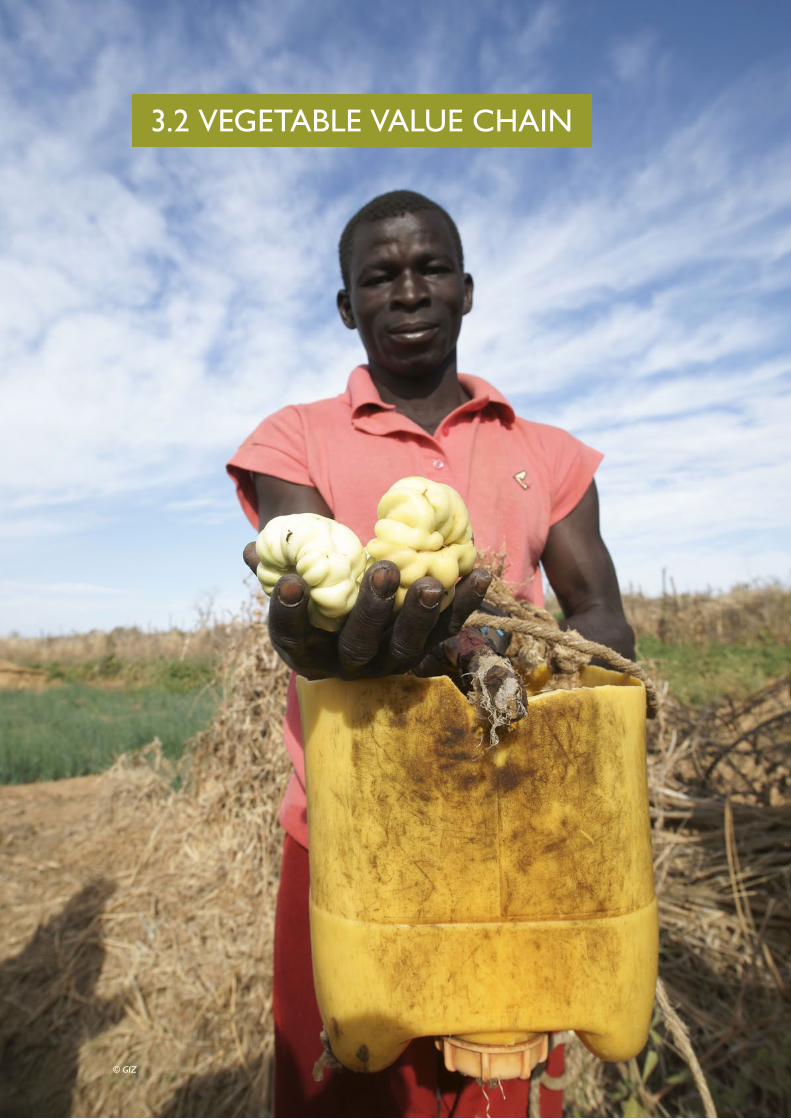
3.2 VEGETABLE VALUE CHAIN
© GIZ

137MEASURING IMPACTS AND ENABLING INVESTMENTS IN ENERGY-SMART AGRIFOOD CHAINS
CO
ST-B
ENEF
IT A
NA
LYSI
S A
T T
HE
CO
UN
TRY
LEV
EL
3.2.1 KENYA: ENERGY INTERVENTIONS IN THE VEGETABLE CHAIN
Value chain description
The economy of Kenya is largely dependent on agriculture (26% of GDP) which sustains the livelihood of the majority of the rural population and employs about 75–80% of the total population. Agriculture represents also two thirds of total exports. Horticulture is the third leading subsector after dairy and tea, and it is a growing market as national trends have shown recently (USAID and HCD, 2014; MALF Kenya, 2015). The horticultural production domestic value in 2014 was US$ 1960 million (5% increase from 2013), the area under cultivation 605,000 hectares (2% increase over the same period), and the total production 7.9 million tonnes (9% increase). In 2014, 36% of the domestic value of horticulture came from the vegetables sector, constituting US$ 709 million, 326,837 ha and 4.1 million tonnes.
Most agriculture in Kenya is rain-fed with two growing seasons. The average Kenyan farm is less than two hectares. Subsistence farming is often the primary source of livelihood for individual farm households who have little knowledge or capacity on appropriate postharvest handling practices, packaging, labelling and grading, and storage (GCCA, 2016). They have neither the means nor the incentive to invest in additional resources for cold storage. Harvested irrigated temporary crop area for vegetables in Kenya is estimated to be 45,200 ha in 2010, which means that less than 30% of the total area harvested is dedicated to vegetables (AQUASTAT, 2016).
The main challenges that producers face include irregular rainfall, high and volatile energy prices, low crop yields, post-harvest losses of perishable crops, seasonal variations in products price and lack of access to modern energy technologies (both to store and to irrigate vegetables, and thus to have a more constant level of production and income). Another challenge is the lack of access to market information: small farmers do not have information on market demand and often do not know when or whether their produce will be collected by middlemen. Additionally, since they have poor means to conserve food, they have little bargaining power. This is one of the main causes of waste and loss of the most perishable produce. Moreover, small farmers located far from main markets are significantly constrained by weak and sometimes non-existent transportation infrastructure to reach consumers. Farmers are therefore dependant on intermediaries for transport to the markets. The selling price is thus set by these intermediaries (GCCA, 2016).
Kenya is responding to the challenge of adequately feeding its population through strategies to increase production capacity and to enhance trade to meet the growing demand of markets. Approximately 10% of the population is considered food-insecure, 30% of which live in urban and peri-urban centres. Poor dietary diversity is an important feature of urban Kenya, which hosts nearly 35% of the country’s population.

138 MEASURING IMPACTS AND ENABLING INVESTMENTS IN ENERGY-SMART AGRIFOOD CHAINS
CO
ST-B
ENEF
IT A
NA
LYSI
S A
T T
HE
CO
UN
TRY
LEV
EL
Solar cold storage for vegetables could help overcome some of the above-mentioned challenges. For Kenya, the CBA is applied specifically to solar cold storage conservation of tomatoes and green beans. In fact, tomato is the second leading vegetable after Irish potato in Kenya. It represents 15% of total vegetables and 6.7% of total horticultural products. The consumption of tomatoes is predominant in both rural and urban areas, and satisfies food and nutrition needs, mainly of micronutrients such as provitamin A or potassium. Reduction of food loss at all levels of the value chain can help improve food and nutrition insecurity. Green beans are one of the dominating goods for export, with a small quantity consumed in the domestic market. According to the main final destination of the produce, this work considers the production of tomatoes for the domestic vegetable market and green beans for the export market.
The markets for tomatoes and green beans are experiencing growth. The area of tomatoes planted increased by 15% in 2014 compared to the previous year, and the quantity and value increased by 4% and 1.3% respectively (USAID and HCD, 2014). In the green beans sector, the area increased by 3% during the same period, while the production and value increased by 9% and 15% respectively, meaning an increase in productivity coming from exports (USAID and HCD, 2014).
At the same time, the production of fresh vegetables like tomatoes and green beans is risky and volatile. Post-harvest losses at the wholesaler stage78 (during transport and off-loading) are high for such perishable crops. Thus, wholesalers establish prices accounting for their high share of risk and losses. Currently, smallholder farmers lack the capital necessary to invest in refrigeration technologies. Therefore, they are forced to sell their produce as soon as they can, at any price (KFIE, 2015). Moreover, they have to wait for wholesalers to come only every three days on average. This results in a decrease in product quality and an increase in the likelihood of rejection at collection points. The objective of introducing cold storage for vegetables powered by renewable energy is to preserve the quality and quantity of fresh vegetables at collection points.
The second energy intervention analysed in the vegetable value chain in Kenya is solar-powered water pumping which would also importantly contribute to overcome some of the agricultural production challenges mentioned above. In fact, today rural farms have limited access to electricity and irrigation. According to estimates, there are 2.9 million smallholder farmers in Kenya but only 6% of the farmland is irrigated. According to Kenya’s irrigation policy, the country has an irrigation potential of 1,341 900 ha based on available water resources and improvement in irrigation water use efficiency. Of this potential, approximately 161,840 ha of irrigation have been developed. Individual smallholder farmers own around 42% of this irrigated farmland (FAO and GIZ, 2018). The rate of irrigation development in the country has been low, with an increase of new irrigated area which is equivalent to an annual growth rate of less than 1%. The specific objective of Kenya’s national irrigation policy is to expand land under irrigation by an average of 80,000 ha per year to reach the full irrigation potential by 2030. With population growth and increased pressure on arable land, smallholder farmers will increasingly demand viable options to irrigate their land.
78 A wholesaler is an intermediary who buys goods from farmers at a certain collection point and sells the products on the market.

139MEASURING IMPACTS AND ENABLING INVESTMENTS IN ENERGY-SMART AGRIFOOD CHAINS
CO
ST-B
ENEF
IT A
NA
LYSI
S A
T T
HE
CO
UN
TRY
LEV
EL
Irrigation and energy access are interdependent, as most water pumping technologies require energy but in turn can contribute to an increase in yields. Currently, diesel engine irrigation pumps are powering the expansion of irrigated land, releasing CO2 and particulate matter pollution. FAO and GIZ, 2018
GENDER ANALYSIS Gender roles in the horticultural value chains in Kenya are quite distinct. Women perform manual activities that need precision, while men undertake activities needing more muscle or those that tend to be mechanised. Generally, men oversee bulk transactions of higher value compared to women who market small household surpluses (KENDAT et al., 2013).
Irrigation is an activity carried out predominantly by men, since they typically own the land and are members of water user associations. However, if the pumping system is smaller and portable, women can take over this activity. Women traditionally do planting and weeding activities, up to harvesting. Crop protection and irrigation are mostly performed by men (AMIRAN, personal communication, 201779).
Women are generally responsible for growing and selling surplus subsistence vegetables. They also work in retail (USAID, 2013) and are taking on new opportunities in sorting, grading and packaging (cash crop) tomatoes. Men cultivate cash crops primarily for sale, which leads to a disproportionate portion of agricultural income going to men, and male traders dominating the more profitable wholesale segment of the horticulture value chain. Transport loading and driving is undertaken by men. What producers cannot sell to buyers at farm gate is usually consumed at the household level or sold in small quantities in local markets. In some cases, this can cause considerable losses for farmers who are poorly connected to buyers and markets.
79 Interview with J. Wambugu, Operations Manager, AMIRAN in February 2017.
FIGURE 3.34. Gender roles along the vegetables value chain in Kenya.
Legend: Size of the men/women icons indicates the extent of their participation in each step of the chain.
Orange font: Activities usually performed by women; Blue font: Activities typically done by men.
Source: Authors.
Inputs• Input purchasing • Land owner • Credit access • Spraying • Irrigation
Production• Subsistence crops• Sale of surplus
subsistence crops• Cash crops • Sale of cash crops
Transport & Collection• Transport loading
and driving (cash crops)
Storage & Handling• Sorting and grading• Management
Processing • Formal processing
plants

140 MEASURING IMPACTS AND ENABLING INVESTMENTS IN ENERGY-SMART AGRIFOOD CHAINS
CO
ST-B
ENEF
IT A
NA
LYSI
S A
T T
HE
CO
UN
TRY
LEV
EL
ENERGY ASPECTSElectricity production in Kenya was 9,258 GWh in 2014, obtained from geothermal (44%), hydropower (36%), oil (18%) and other renewables (biofuels, solar and wind) (2%) (IEA, 2017). Geothermal energy is experiencing a growth, i.e. two years before (2012) 53% came from hydro and only 20% from geothermal. Therefore, the total domestic electricity generation is increasing (IEA, 2017). The 16,000 tonnes of fuel oil used in agriculture in 2014 were all imported, as was the primary energy used to produce diesel (597,000 tonnes of crude oil in 2014) (IEA, 2017).
Kenya is very well endowed in terms of solar resource. Solar peak hours in Kenya range from 5 to 7, and the average solar irradiation is 4–6 kWh/m2. However, due to the PV panels’ efficiency, less than 15% of this energy can be transformed into electricity. Moreover, the import of solar technologies is duty free (KRA, 2016) and the PV panels’ market price is experiencing a rapid decrease.
As already illustrated in Figure 3.23, grid connection still remains a challenge for most rural Kenyan people, especially in the northern and eastern counties. In off-grid farmlands, the introduction of small RE technologies, such as those analysed in this study, can significantly improve access to energy since they can be used to power e.g. mobile phones, radios and other small appliances.
Providing proper cold storage for vegetables can alleviate food insecurity and minimize food loss. © GIZ/Nnaemeka Ikegwuonu

141MEASURING IMPACTS AND ENABLING INVESTMENTS IN ENERGY-SMART AGRIFOOD CHAINS
CO
ST-B
ENEF
IT A
NA
LYSI
S A
T T
HE
CO
UN
TRY
LEV
EL
Technologies assessed
Currently vegetable refrigeration at collection points is very limited or non-existing in Kenya. Solar cold storage can contribute to ensure appropriate conservation in rural off-grid areas, or reduce the energy bill where the cold chain depends on unreliable electricity or diesel. Charcoal coolers (sometimes using an electric fan) are also in use, although their adoption has been constrained by low construction standards and low awareness (Makanga et al., 2012). Solar coolers can therefore fill an existing gap in the cold chain in Kenya.
The introduction of solar-powered water pumps could be adopted both to expand irrigated cropland and to replace conventional fuel-powered pumps. The latter use approximately 85 litres of petrol per year. The areas currently under irrigation are in the South (AQUASTAT, 2015), where there is a total dynamic head of less than 10 metres (Winrock International, 2017)80. In the vegetable value chain, there is huge potential for solar irrigation since many smallholders rely on rain-fed agriculture and have thus very low productivity in the dry season. Several innovators are already promoting solar-powered irrigation systems (SPIS) in the country.
For these reasons both energy interventions, which were illustrated as case studies in FAO and GIZ (2018), will be assessed for their costs and benefits at country level in Kenya.
TABLE 3.48. Energy interventions considered for the vegetable value chain in Kenya.
SOLAR COLD STORAGE FOR VEGETABLES
Technology potential
In order to estimate the potential of solar cold storage for tomatoes and green beans, both the production areas and the grid distribution are taken into account. The main producing counties of both tomato and green beans are in the South. For tomato they are Kajiado, Bungoma and Kirinyaga (37% of the total annual production), while the leading production counties of green beans by smallholders and medium farmers are Kirinyaga, Murang’a and Meru (88% of the total annual production), as shown in Table 3.49 (USAID and HCD, 2014; MALF Kenya, 2015). These counties are quite well
80 The water flow (dependant on the water requirement) is the main parameter for the calculation of the power required in the solar pump design.
Solar cold storage for vegetables Solar-powered water pumping for vegetables
• Urgent need to improve cold chains incl. for
tomatoes and green beans (volatile production and huge post-harvest losses).
• Existing but unreliable electricity grid, especially in Southern Kenya where tomatoes and green beans are grown.
• Lack of irrigation facilities is a major reason for low vegetable productivity, especial among small farmers (only 6% of the farmland is irrigated).
• Low access to modern and affordable energy, especially electricity, make irrigation impossible or non-attractive for small farmers.
Source: Authors.

142 MEASURING IMPACTS AND ENABLING INVESTMENTS IN ENERGY-SMART AGRIFOOD CHAINS
CO
ST-B
ENEF
IT A
NA
LYSI
S A
T T
HE
CO
UN
TRY
LEV
EL
connected to the grid. Since tomatoes and beans are largely grown in grid-connected regions and the collection points are placed in the outskirts of urban areas, the solar cold storage technology assessed in this study is able to work on-grid (thus requiring a lower capital investment). The on-grid area also includes the most important consumer markets, i.e. the cities of Nairobi, Mombasa, Kisumu and Eldoret. Table 3.49 shows the area, output and value for tomato and green beans in the three largest producing counties and at national level.
TABLE 3.49. Production area, output and value of green beans and tomatoes at national level and in main producing counties, in 2014.
Tomatoes Green beans
National Kajiado (1st)
Bungoma (2nd)
Kirinyaga (3rd)
National Kirinyaga (1st)
Murang’a (2nd)
Meru(3rd)
Area (ha) 24,074 1,680 1,700 1,647 4,572 1,536 847 407
Production (t) 400,204 47,368 50,399 48,560 122,666 47,440 34,690 17,030
Yield (t/ha) 17 28 30 29 26.8 30.9 40.9 41.8
Value (million US$) 118 16 16 12 50 24 13 7
Source: USAID and HCD (2014) and MALF Kenya (2015).
The value of the produce at national level is linked to the value of potential food loss avoided. If 21% of loss is avoided along the value chain (in weight) (i.e. the total food loss of the vegetable value chains according to PEF, 2015; USAID-KAVES, 2015), the value of the produce could increase at national level by US$ 149 million for tomatoes and by US$ 64 million for green beans. Tomatoes and green beans have high rates of post-harvest losses compared to other vegetables. The need to improve cold chains for vegetables is increasingly important. Tomatoes have a perishable nature due to their high water content, which results in high losses (crushing and bruising) from over-packing and transport. Green beans are less perishable but are typically directed to the export market and therefore have to meet higher quality requirements (USAID, 2013). Post-harvest handling of both tomatoes and green beans should be placed in cold storage as soon as possible. Tomatoes need to be stored at a temperature range of 6 °C to 13 °C in order to last up to 5–10 days, depending on the stage of ripeness (FAO and GIZ, 2018; NAFIS, 2017). Green beans have to maintain a constant temperature range of 6 °C to 8 °C for shelf-life of up to 7–14 days (USAID-KAVES, 2015). Solar cold storage is an effective solution to improve the cold chain for areas where the grid is unreliable. The core objective of this technology is to reduce the post-harvest losses along the value chains of tomatoes and beans.
The technology potential is an estimate of the number of solar cold storage systems of a certain size that could be introduced at collection points in those areas with an existing although unreliable access to the electricity grid. Off-grid units have not been considered since these systems would entail higher capital costs (mainly due to larger battery size) which would make the intervention financially less appealing. The potential therefore considers only on-grid collection points with a grid back-up. This intervention takes place at the level of the wholesaler who makes the initial investment and collects the produce from collection points.

143MEASURING IMPACTS AND ENABLING INVESTMENTS IN ENERGY-SMART AGRIFOOD CHAINS
CO
ST-B
ENEF
IT A
NA
LYSI
S A
T T
HE
CO
UN
TRY
LEV
EL
In fact, small producers group around a collection point, usually taking the form of farmer associations or unions, in order to reduce transaction costs. There were 1,436 other agricultural unions (beyond farmer associations) in 2012, with about 100 members on average (KNBS, 2013). One solar cold storage system would serve one farmer association, corresponding to 100 farmers on average, who fill each container with 1,400 tonnes with tomatoes and/or green beans. In this way, at national level, the number of cold storage system that could be installed for tomato and green bean production is 373. Assuming an access to electricity of 30% in the Rift Valley area (data of 2012 by World Bank, 2016b), the technical potential at national level is 112 solar cold storage containers.
TABLE 3.50. Technology potential of solar cold storage systems for vegetables in Kenya.
Item Value Source
Membership of ‘other agricultural’ cooperative societies and unions 142,000 KNBS (2013)
Number of ‘other agricultural’ societies and unions 1,436 KNBS (2013)
Number of farms/collection point (or number of member in each society or union)
100 Authors’ calculation
Amount of tomatoes and beans produced by one association (100 farmers) (tonne/year)
1,400 Authors’ calculation
Amount of tomatoes and beans produced at country level (tonne/year)
522,870 USAID and HCD (2014) and MALF Kenya (2015)
Access to electricity 30% World Bank (2016b) and Kunen et al., (2015)
Installable systems at national level 112 Authors’ calculation
Source: Authors.
Cost-benefit analysis
FINANCIAL CBAA 35 m3 cold storage unit for Kenya costs around US$ 100,000. The energy consumption of one unit is 23–30 kWh/day (25 kWh/day assumed for the CBA). The PV array (44 panels of 250 Wp or around 20–320 Wp), the battery (24 V, able to supply 716 Ah for 8 hours of reserve power at 60% depth discharge) and the inverter (1,000 W of capacity) can be sourced nationally for around US$ 11,000, US$ 3,500 and US$ 250 respectively81. The total capital cost assumed is US$ 115,000, while the replacement costs of batteries are US$ 3,500 every 5 years. The system runs continuously and requires little maintenance. Operating costs sum up to US$ 1,500/year, which include grid connection cost (US$ 455/year), water to clean the system (0.5 m3 of water once a week), as well as labour cost for a guard at night and a skilled worker for the maintenance and operation. The salary costs assumed are US$ 70/month and US$ 94/month respectively (WageIndicator, 2016).
81 Examples of national providers are: for panels Cat (http://cat.co.ke/store/bluesolar-mppt-charge-controller-15035-12-24-36-48-volt/) or Sollatek (http://sollatek.co.ke/shop/solar-systems/solar-panel-14w-120w/), for inverters GWL Power (https://www.ev-power.eu/Inverters-DC-AC/), for batteries OLX (https://www.olx.co.ke/) or several providers (http://www.the-star.co.ke/classifieds/home-living/home-solar-panels-for-sale.html).
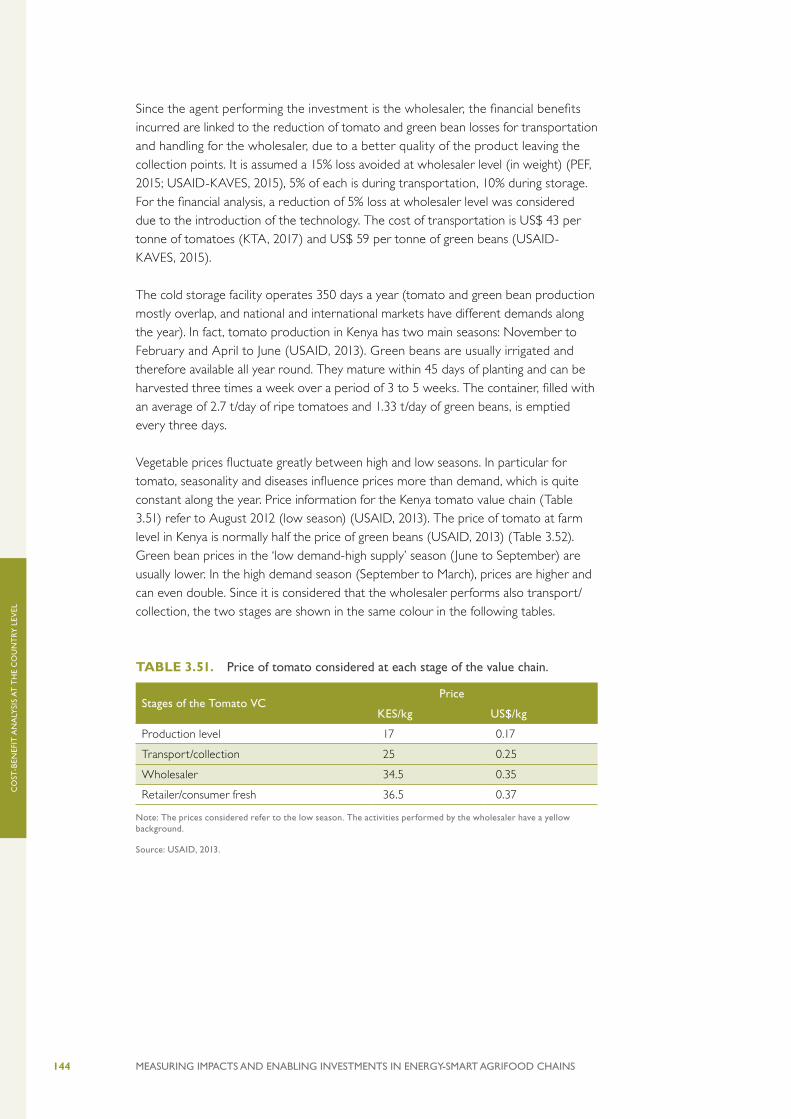
144 MEASURING IMPACTS AND ENABLING INVESTMENTS IN ENERGY-SMART AGRIFOOD CHAINS
CO
ST-B
ENEF
IT A
NA
LYSI
S A
T T
HE
CO
UN
TRY
LEV
EL
Since the agent performing the investment is the wholesaler, the financial benefits incurred are linked to the reduction of tomato and green bean losses for transportation and handling for the wholesaler, due to a better quality of the product leaving the collection points. It is assumed a 15% loss avoided at wholesaler level (in weight) (PEF, 2015; USAID-KAVES, 2015), 5% of each is during transportation, 10% during storage. For the financial analysis, a reduction of 5% loss at wholesaler level was considered due to the introduction of the technology. The cost of transportation is US$ 43 per tonne of tomatoes (KTA, 2017) and US$ 59 per tonne of green beans (USAID-KAVES, 2015).
The cold storage facility operates 350 days a year (tomato and green bean production mostly overlap, and national and international markets have different demands along the year). In fact, tomato production in Kenya has two main seasons: November to February and April to June (USAID, 2013). Green beans are usually irrigated and therefore available all year round. They mature within 45 days of planting and can be harvested three times a week over a period of 3 to 5 weeks. The container, filled with an average of 2.7 t/day of ripe tomatoes and 1.33 t/day of green beans, is emptied every three days.
Vegetable prices fluctuate greatly between high and low seasons. In particular for tomato, seasonality and diseases influence prices more than demand, which is quite constant along the year. Price information for the Kenya tomato value chain (Table 3.51) refer to August 2012 (low season) (USAID, 2013). The price of tomato at farm level in Kenya is normally half the price of green beans (USAID, 2013) (Table 3.52). Green bean prices in the ‘low demand-high supply’ season (June to September) are usually lower. In the high demand season (September to March), prices are higher and can even double. Since it is considered that the wholesaler performs also transport/collection, the two stages are shown in the same colour in the following tables.
TABLE 3.51. Price of tomato considered at each stage of the value chain.
Stages of the Tomato VCPrice
KES/kg US$/kg
Production level 17 0.17
Transport/collection 25 0.25
Wholesaler 34.5 0.35
Retailer/consumer fresh 36.5 0.37
Note: The prices considered refer to the low season. The activities performed by the wholesaler have a yellow background.
Source: USAID, 2013.

145MEASURING IMPACTS AND ENABLING INVESTMENTS IN ENERGY-SMART AGRIFOOD CHAINS
CO
ST-B
ENEF
IT A
NA
LYSI
S A
T T
HE
CO
UN
TRY
LEV
EL
TABLE 3.52. Price of green beans considered at each stage of the value chain.
Stages of the Green Bean VCPrice
KES/kg US$/kg
Production level 40 0.40
Transport/collection 45.9 0.46
Wholesaler 60 0.60
Retailer/consumer fresh 85 0.85
Note: The activities performed by the wholesaler have a yellow background.
Source: USAID-KAVES, 2015.
ECONOMIC CBA
Value added along the value chainIntroducing solar cold storage for vegetables at collection points not only benefits the wholesaler (more effective transport and handling of vegetables and more product reaching the market) but it also avoids losses up and down the value chain, generating extra income for value chain operators. At farm level, the introduction of refrigeration allows the farmer to avoid production losses, since a part of the production can be refrigerated and stored so that other more recently harvested products are available for other local markets82. More produce reaches the retail stage and thus the margin for this extra product is a benefit for the retailer. Since green beans are assumed to be delivered to exporters83, there are no impacts on the national VC after the wholesaler stage.
Table 3.53 illustrates the value up and down the tomato value chain associated with food losses. The losses avoided due to the solar cold storage system are considered to be 4% at production level and 2% at retail level (on the basis of PEF, 2015). The production cost of tomatoes is US$ 0.17/kg since their production is labour and water intensive (USAID, 2013). The profit of the farmer is the price of the tomato at farm level (US$ 0.07/kg) minus the production costs. The value added along the value chain is US$ 3,528 per year.
TABLE 3.53. Value added from avoided loss at farm and retail level in the tomato value chain.
Value chain stagePrice Profit Quantity saved Value Added
US$/kg US$/kg tonne/year US$/year
Production level 0.17 0.07 37 2,613
Retailer/consumer fresh 0.365 0.02 46 915
Source: USAID, 2013.
82 In particular, USAID-KAVES (2015) mentions a trend for beans of production deficit, therefore it is assumed no constraint on demand (p. 24).
83 An aggregator “assembles produce in rural production areas and prepares them for transport and marketing in wholesale markets at collection points. Aggregators are often responsible for sorting, grading and transport of goods to wholesale outlets and even sometimes transport the produce” (USAID, 2013). Farmers and traders can also sell the products informally in roadsides or kiosks, or formally to markets and supermarkets.

146 MEASURING IMPACTS AND ENABLING INVESTMENTS IN ENERGY-SMART AGRIFOOD CHAINS
CO
ST-B
ENEF
IT A
NA
LYSI
S A
T T
HE
CO
UN
TRY
LEV
EL
Table 3.54 illustrates the value added in the green bean value chain due to avoided losses. At production level, the avoided losses considered are 2% (USAID-KAVES, 2015). The production cost of beans is US$ 0.2/kg. High production costs of beans are normally due to the use of greenhouses, irrigation and several harvests a year, which are labour and water intensive. The profit for the farmer is the price of the green beans at farm level (US$ 0.4/kg) minus the production cost. The value added at post-wholesaler stages of the value chain is not considered since the final market of green beans is usually export. Therefore, the value added along the value chain is US$ 1,875 per year, equal to value added at farm level.
TABLE 3.54. Value added from avoided loss at farm level in the green bean value chain.
Value chain stagePrice Profit Quantity saved Value added
US$/kg US$/kg kg/year US$/year
Retailer/consumer fresh 0.4 0.199 9,333 1,857
Source: USAID–KAVES, 2015.
Subsidies and taxes The import duty of the fridge container is 25% (Pitney Bowes, 2017) and there is no VAT or internal subsidies to vegetables in Kenya. If the PV array cannot be sourced locally, the Kenya Revenue Authority does not impose an import duty84. The VAT for electricity is included in the financial cost of electricity.
Assessment of environmental and socio-economic impacts at national level
TABLE 3.55. Environmental and socio-economic impacts associated with the technical potential of solar cold storage systems for vegetables in Kenya (112 systems).
Impact Description Impact indicator
Monetized impact
Fertilizer use No impact – –
Water use and efficiency
The water needed for each system is 0.5 m3 per week to be cleaned, which means 2,400 m3 per year at national level. It is therefore considered negligible.
– –
Food loss The avoided food losses at the handling and transportation level (wholesaler) are already accounted for in the CBA. The value added up and down the value chain (at farm level and at retail level) is accounted in the economic CBA. The quantity saved per year by each system multiplied by the national potential results in 7,850 t/year at the wholesale level; 5,230 t/year at the producer level and 5,120 t/year at the retailer level. They correspond to an added value of US$ 3,400,000/year, US$ 500,000/ year and US$ 100,000/year respectively at national level.
Considered in financial CBA (7,850 t/year, wholesaler) and value added along the value chain (10,350 t/year)
Considered in financial CBA (US$ 3400,000/year, wholesaler) and value added along the value chain (around US$ 600,000/year)
Land requirement
One unit requires 15 m2 of land, corresponding to around 1,445 m2 at national level. The overall impact is therefore negligible.
– –
84 Solar powered equipment and accessories (including deep cycle sealed batteries which exclusively use and/or store solar power) are exempt from import duty (KRA, 2016).

147MEASURING IMPACTS AND ENABLING INVESTMENTS IN ENERGY-SMART AGRIFOOD CHAINS
CO
ST-B
ENEF
IT A
NA
LYSI
S A
T T
HE
CO
UN
TRY
LEV
EL
GHG emissions
The GHG emissions from the generation of electricity needed for the grid back-up (10 kWh/day for one system) are 243 tonnes CO2eq/year at national level. By assuming a SCC of US$ 36/t CO2eq (growing 2% yearly), it corresponds to about US$ 78/year per plant or about US$ 8,739/year at national level. This represents a cost for the society.
243 tonnes CO2eq/year
US$ 8,739/year
Health risk due to indoor air pollution
No impact.
Fossil fuel consumption
Around 20% of electricity generated comes from fossil fuel, in particular from crude oil. One unit requires 3.5 MWh/year of electricity from the grid, which corresponds to 12.6 GJ/year. At national level, this amounts to 282 GJ generated by fossil fuels per year.
282 GJ/year (from imported crude oil)
–
Access to energy
No impact because the technology is used in on-grid areas and the refrigerator uses all power generated by the PV array.
Household income
The number of farmers served by one system is 100, or 11,200 at national level. Farmer associations will likely use the solar cold storage for cash crops. Men are traditionally responsible for cash crops and members of farmer associations, so they will more likely benefit from increased revenue. However, the rural-urban migration of men means that women are increasingly responsible for cash crops. Providing that these women are empowered and encouraged to participate in farmer associations, women can bring home higher incomes.
Around 11,200 people
Considered in value added along the value chain (US$ 500,000/year)
Time saving At producer level, without the solar cold storage, the farmers were carrying their produce every three days (when the wholesaler came to pick it up). With the technology, they are likely to bring the produce more often (every day), hence the impact may be negative, although it is difficult to quantify.
– –
Employment The introduction of the technology creates 2 part-time long-term jobs: an unskilled guard job (US$ 418/year) and a skilled technician that takes care of the maintenance (US$ 562/year). At national level, this means 112 skilled and 112 unskilled part-time long-time jobs for a total wage of around US$ 110,000/year). The transportation cost and personnel remains the same. The jobs could be filled by men or women, providing that the recruitment and training are gender-sensitive.
112 skilled and 112 unskilled part-time long-time jobs
US$ 110,000/year
Colour code: Positive impact Variable impact Negative impact No or negligible impact
Source: Authors.
Profitability
Table 3.56 summarizes the main financial and economic costs and benefits in Kenya, both at intervention and national scale. The benefits from value added along the value chain, import duty and job creation overcome the negative financial flows in the first 6 years (Figure 3.35).
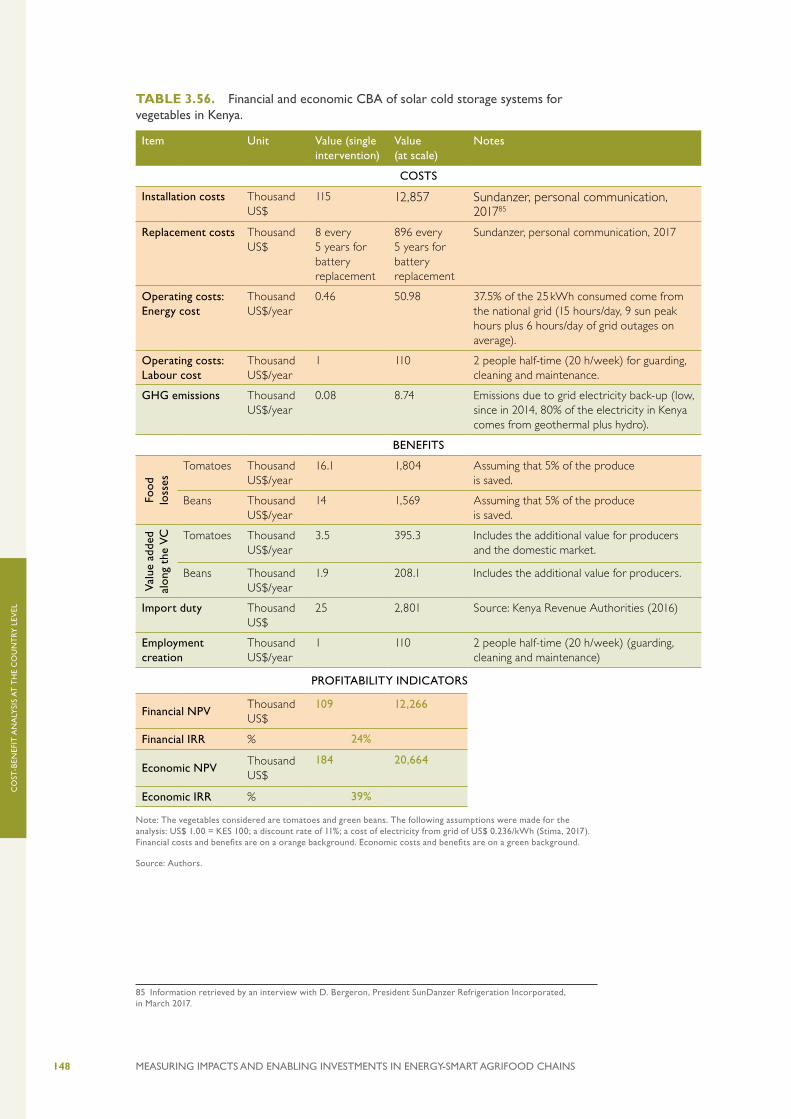
148 MEASURING IMPACTS AND ENABLING INVESTMENTS IN ENERGY-SMART AGRIFOOD CHAINS
CO
ST-B
ENEF
IT A
NA
LYSI
S A
T T
HE
CO
UN
TRY
LEV
EL
TABLE 3.56. Financial and economic CBA of solar cold storage systems for vegetables in Kenya.85
Item Unit Value (single intervention)
Value (at scale)
Notes
COSTS
Installation costs Thousand US$
115 12,857 Sundanzer, personal communication, 201785
Replacement costs Thousand US$
8 every 5 years for battery replacement
896 every 5 years for battery replacement
Sundanzer, personal communication, 2017
Operating costs: Energy cost
Thousand US$/year
0.46 50.98 37.5% of the 25 kWh consumed come from the national grid (15 hours/day, 9 sun peak hours plus 6 hours/day of grid outages on average).
Operating costs: Labour cost
Thousand US$/year
1 110 2 people half-time (20 h/week) for guarding, cleaning and maintenance.
GHG emissions Thousand US$/year
0.08 8.74 Emissions due to grid electricity back-up (low, since in 2014, 80% of the electricity in Kenya comes from geothermal plus hydro).
BENEFITS
Food
lo
sses
Tomatoes Thousand US$/year
16.1 1,804 Assuming that 5% of the produce is saved.
Beans Thousand US$/year
14 1,569 Assuming that 5% of the produce is saved.
Val
ue a
dded
al
ong
the
VC
Tomatoes Thousand US$/year
3.5 395.3 Includes the additional value for producers and the domestic market.
Beans Thousand US$/year
1.9 208.1 Includes the additional value for producers.
Import duty Thousand US$
25 2,801 Source: Kenya Revenue Authorities (2016)
Employment creation
Thousand US$/year
1 110 2 people half-time (20 h/week) (guarding, cleaning and maintenance)
PROFITABILITY INDICATORS
Financial NPVThousand US$
109 12,266
Financial IRR % 24%
Economic NPVThousand US$
184 20,664
Economic IRR % 39%
Note: The vegetables considered are tomatoes and green beans. The following assumptions were made for the analysis: US$ 1.00 = KES 100; a discount rate of 11%; a cost of electricity from grid of US$ 0.236/kWh (Stima, 2017). Financial costs and benefits are on a orange background. Economic costs and benefits are on a green background.
Source: Authors.
85 Information retrieved by an interview with D. Bergeron, President SunDanzer Refrigeration Incorporated, in March 2017.

149MEASURING IMPACTS AND ENABLING INVESTMENTS IN ENERGY-SMART AGRIFOOD CHAINS
CO
ST-B
ENEF
IT A
NA
LYSI
S A
T T
HE
CO
UN
TRY
LEV
EL
RESULTSThe initial investment required for 112 units is about US$ 13 million with a payback period of 6 years. For each system, both the financial and the economic NPV are positive (US$ 109,000 and US$ 184,000 respectively) with IRRs of 24% and 39% respectively. The financial results show that the investment is attractive since the IRR is higher than the Kenyan National Bank Rate of 10% and higher than a non-risk bank deposit interest rate, which in Kenya is 6–8% (Central Bank of Kenya, 2017). As Figure 3.36 shows, the difference between the economic and financial NPV is mainly due to the value added along the value chain (US$ 4.8 million in 20 years), the import taxes (US$ 2.8 million) and the job creation (US$ 0.9 million). With the introduction of this technology, there would be a small cost for society in terms of increased GHG emissions and fossil fuel consumption due to the grid back-up. Finally, the impact of the solar cold storage for vegetables at collection points on time saving of producers should be taken into account. However, this is difficult to calculate for a ‘typical’ intervention and is expected to be minor: Depending on the fact if an aggregator exists, the farmers either go every day to the collection point or pay them to collect the produce.
FIGURE 3.35. Financial and economic cumulative discounted costs and benefits over 20 years of a solar cold storage system for vegetables in Kenya.
Financial net benefits
Subsidies and taxes
Value added along the VC
GHG emissions
years
Tho
usan
d U
S$
Employment
0 1 2 3 4 5 6 7 8 9 10 11 12 13 14 15 16 17 18 19 20
–100
–150
0
50
100
150
200
–50
Note: Additional non-monetized impacts on time saving and fossil fuel consumption occur (Table 3.56). The vegetables considered are tomatoes and green beans.
Source: Authors.

150 MEASURING IMPACTS AND ENABLING INVESTMENTS IN ENERGY-SMART AGRIFOOD CHAINS
CO
ST-B
ENEF
IT A
NA
LYSI
S A
T T
HE
CO
UN
TRY
LEV
EL
Data sources
Figure 3.37 illustrates the information needed for estimating the technical potential of the technology, and Table 3.57 summarizes the information and data input needed, and actually used, for the techno-economic analysis.
FIGURE 3.36. Cumulative economic costs and benefits of solar cold storage systems for vegetables in Kenya at national level after 20 years (112 systems).
10
5
15
0
20
25
0.9
2.8
4.8
12.3
0.1
–5
US$ 13 million For 112 systems
INITIAL INVESTMENTOVER 20 YEARS
US$ 20.7 millionECONOMIC NPV
FINANCIAL IRR
24%
US$ 12.3 millionFINANCIAL NPV
Mill
ion
US$
Financial net bene�ts
GHG emissions
Subsidies and taxes
Employment
Value added along the VC
Time saving
Fossil fuel consumption282 GJ/year
Note: The vegetables considered are tomatoes and green beans. The sum of the financial NPV and the economic co-benefits and costs is the economic NPV.
Colour code for non-monetized impacts: Positive impact Variable impact Negative impact
Source: Authors.
FIGURE 3.37. Input data for the assessment of the technology potential of solar cold storage systems for vegetables in Kenya.
Note: Blue boxes represent country-related primary input data, green boxes are calculated data,
and the grey box represents the result.
Source: Authors.
Number of farmers supplying a
collection point
Capacity of a cold storage container
Distribution of producers without
access to cold storage
Solar cold storage for vegetables
technical potential Type and quantity of products that can be stored at collection level
Amount of product to be cooled per collection point
Total number of cold storage
containers needed
Grid distribution

151MEASURING IMPACTS AND ENABLING INVESTMENTS IN ENERGY-SMART AGRIFOOD CHAINS
CO
ST-B
ENEF
IT A
NA
LYSI
S A
T T
HE
CO
UN
TRY
LEV
EL
TABLE 3.57. Data sources for the CBA of solar cold storage systems for vegetables in Kenya.
Data input International source Source used
Average number of members per farmer society/union (number of farmers supplying a collection point)
– Government data
Type and quantity of products that can be stored at collection level
– Government data and literature
Distribution of producers without access to cold storage
– Literature and personal communication
Grid distribution World Bank, 2016b World Bank, 2016b
Average solar energy production per day depending on location
JRC, 2017 (PVGIS) JRC, 2017 (PVGIS)
Amount of avoided losses at different stages of the value chain
– Literature, personal communication and Government data
Electricity costs – Literature
Tomato and bean prices along the value chain – Literature
GHG emission factor IPCC, 2006 IPCC, 2006
Fossil fuel consumption IEA, 2017 IEA, 2017
Operating days/year – Literature
Food loss along the value chain – Literature and expert opinion
Labour cost ILO, 2017 (for some countries) Literature
Note: Shaded rows represent country-related primary input data.
Source: Authors.
Barriers to technology adoption
The main knowledge barriers which hinder the adoption of solar cooling technologies are a lack of trained technicians and a lack of awareness about the benefits of the technology. In the vegetables sector, this is summed at a lack of information between demand and supply, which often generates product loss, overcrowding and congestion in market places, as well as price volatility. This also creates difficulties in sizing the systems to match supply and demand.
In the solar sector, common barriers for the technology are the weak enforcement of quality standards of solar technology (to avoid counterfeit products) as well as low efficiency and coverage of technology supplier networks. In the vegetable chain, lack of good roads in remote areas makes it difficult to reach the collection centres, increasing the depletion of fresh product. As the technology is very costly, credit market failures to farmers or cooperatives are a main barrier to its adoption.
Potential barriers and risks to the adoption of solar cold storage in Kenya are summarized in Table 3.58.

152 MEASURING IMPACTS AND ENABLING INVESTMENTS IN ENERGY-SMART AGRIFOOD CHAINS
CO
ST-B
ENEF
IT A
NA
LYSI
S A
T T
HE
CO
UN
TRY
LEV
EL
TABLE 3.58. Key barriers to the adoption of solar cold storage systems for vegetables in Kenya.
Knowledge and infor-mation
Organization/ social
Regulations/ Institutions
Support services/ structures
Financial returns
Access/cost of capital
Lack of trained technicians
Lack of awareness about the technology and its benefits
Lack of information between demand and supply (leading to product loss, overcrowding and con gestion in market places, and price volatility), making it difficult to size the systems
No enforce-ment of quality standards of solar technology (to avoid counterfeit products)
Low efficiency and coverage of technology supplier net-works
Lack of good roads in re-mote areas to reach the collection centres
– Credit market failures to farmers or cooperatives
Source: Authors.
SOLAR-POWERED WATER PUMPING FOR VEGETABLES
Technology potential
The solar-powered water pumping CBA shows the financial viability and socio-economic impacts of introducing a solar-powered water pump assuming as benchmark the utilization of a petrol pump. Benefits and costs associated to the introduction of a solar-powered water pump in areas not previously irrigated are not shown in this study.
Solar-powered water pumping yields benefits in terms of access to energy, GHG emissions and employment creation. © Jeffrey M. Walcott/Futurepump

153MEASURING IMPACTS AND ENABLING INVESTMENTS IN ENERGY-SMART AGRIFOOD CHAINS
CO
ST-B
ENEF
IT A
NA
LYSI
S A
T T
HE
CO
UN
TRY
LEV
EL
The water pump used for the case study can work with a maximum head of 8 meters and can therefore be applied only to some areas in the country. Figure 3.38 shows the minimum dynamic head and population in different agricultural areas in Kenya. The data on water tables and boreholes in Kenya show that only two counties (Migori and Siaya, both in Western Kenya) have a total dynamic head range lower than 10 meters. Therefore. the potential for adoption of the technology is assumed to be in these two counties only. In Kenya there are several other providers of solar-powered water pumping technologies (SPIS), some of which with a higher head and capacity (but also a higher capital cost). These pumps could be applied to the other areas of Kenya.
In 2012, only 6.7% of rural population had access to electricity (World Bank, 2016b). Hence, the 41,539 ha of irrigated areas for vegetables in Kenya are likely to rely mostly on irrigation systems powered by diesel or other fossil fuels which can be potentially replaced by a solar technology.
In the two counties considered in the analysis, the total irrigated area for vegetables is about 1,255 ha (based on data for 2010). In addition, being the total area dedicated to vegetables in these two counties about 4,500 ha in 2010, it is assumed that the remaining hectares which are not irrigated may potentially host the PV pumping
FIGURE 3.38. Dynamic head and population in agricultural areas in Kenya.
Source: Winrock international (2017), based on Ministry of Water and Irrigation data.
<10 m
10 – 25 m
25 – 50 m
>50 m
KAVES counties
Minimum total dynamic head
Estimated population in agricultural areas
100
1,000
10,000
100,000 200100500
Kilometers
N

154 MEASURING IMPACTS AND ENABLING INVESTMENTS IN ENERGY-SMART AGRIFOOD CHAINS
CO
ST-B
ENEF
IT A
NA
LYSI
S A
T T
HE
CO
UN
TRY
LEV
EL
technology86. This leads to the technology potential showed in Table 3.59 of about 11,059 solar-powered water pumping systems (with a head of less than 8 metres on average).
TABLE 3.59. Technology potential of solar-powered irrigation systems for vegetables in Kenya.
Item All Kenya Siaya & Migori Sources
Harvested irrigated temporary crop area for vegetables (2010) (ha) 45,200 1,255 FAO 2015 and AQUASTAT 2016
Total area harvested dedicated to vegetables (2010) (ha) 162,380 4,508 AQUASTAT 2016
Estimated land dedicated to vegetables not irrigated (2010) (ha) 117,180 3,253 Authors’ calculations
Reference land extension of farm (FAO and GIZ, 2018) (ha) 0.4 FAO/GIZ, 2018
Percentage of rural area with no electricity (2012) (%) 93.3% World Bank, 2016b
Assumed petrol-powered irrigation area (2010) (ha) 42,172 1,171 Authors’ calculations
Number of installable technology (assumption to substitute petrol-powered irrigation)
105,429 2,927 Authors’ calculations
Number of installable technology (assumption to substitute petrol-powered irrigation plus no irrigated areas)
398,379 11,059 Authors’ calculations
Source: Authors’ elaboration based on FAO 2015; FAOSTAT 2016; AQUASTAT 2016; World Bank, 2016b; FAO and GIZ 2018.
Cost-benefit analysis
FINANCIAL CBAA ‘typical’ farm buying a solar-powered SF1 pump has 0.4 ha of agricultural land (FAO and GIZ, 2018). These farmers produce crops for their own consumption and/or for sale at the local markets and typically would not be connected to structured value chains87. The following assumptions regarding the plot have been made: The farmer grows maize on 0.2 ha of the land and the remaining 0.2 ha is used for tomatoes and cabbage that are sold at local markets. Maize is rain-fed and the other crops are irrigated.
The benchmark situation for the CBA is that the solar pump replaces a petrol pump. The assumed lifetime of a locally purchased and operated petrol pump is 3 years and the capital cost US$ 250. It would require no maintenance costs as smallholder farmers typically replace the pump if it fails.
Conversely, the SF1 pump does not have any fuel costs and the only operating costs for the use of the pump are labour costs. Farmers typically irrigate 2–3 times a week during the dry season for an average of 6 hours per day (based on interviews with 38 Futurepump customers). An average irrigation period of three days per week (over 34 week cycles) has been assumed for the CBA. The farmer will save on the fuel costs for irrigating the land with a petrol pump. Approximately 85 litres of petrol are
86 The solar-powered water pumping CBA shows the financial viability and socio-economic impacts of introducing a solar-powered water pump assuming as benchmark the utilization of a petrol pump. Benefits and costs associated to the introduction of a solar-powered water pump in areas not previously irrigated are not shown in this study.
87 The types of crops and yields vary considerably depending on specific farming practices, preferences and experience of the farmers. For this case study, typical crops and average yields based on information gathered from 38 current Futurepump customers have been used as the basis for yield estimates for each crop.

155MEASURING IMPACTS AND ENABLING INVESTMENTS IN ENERGY-SMART AGRIFOOD CHAINS
CO
ST-B
ENEF
IT A
NA
LYSI
S A
T T
HE
CO
UN
TRY
LEV
EL
Impact Description Impact indicator
Monetized impact
Fertilizer use No impact, as fertilizers and pesticides are commonly used before and after the energy intervention.
– –
Water use and efficiency
No impact associated with a switch of the pump technology itself (the risk of overuse by solar PV pumps depends on the usage of the pump).
– –
Food loss No impact. – –
Land requirement
Land occupied by a PV pump (max 0.6 m2) is usually larger than a conventional petrol pump. The overall impact at country level is anyway negligible (less than 1 ha).
– –
GHG emissions A petrol pump consumes around 85 litres of petrol per year resulting in 0.2 tonnes CO2eq (IPCC, 2006). At national level, this is equivalent to about 2,000 tonnes CO2eq/year or US$ 420,000/year (ERC, 2017).
2,000 tonnes CO2eq/year
US$ 420,000/year
Health risk due to indoor air pollution
No impact. – –
consumed annually for irrigating 0.2 ha of land (FAO and GIZ, 2018), leading to fuel costs savings of US$ 82 per year with the current price of petrol (ERC, 2017).
Replacing a petrol pump with a solar irrigation pump does not affect the yields since in the benchmark scenario the farmer is already irrigating with a petrol pump. Nonetheless, with the assumptions used in this study, the financial NPV of the intervention is positive (US$ 331) over an investment period of 10 years.
ECONOMIC CBA
Value added along the value chainPump customers already irrigate and the introduction of the new pump has no important impact on yields. The farmer’s value added on the vegetable value chains would thus only be impacted by the reduction in cost of inputs for the farming activities. There is no impact on the subsequent steps of the vegetable value chain.
Subsidies and taxesThe impact of the introduction of SF1 pump on subsidies and taxes is explained in FAO and GIZ (2018), the result is summarized in Table 3.61. The overall impacts on subsidies and taxes take into consideration: the taxation on the equipment, the reduced tax revenue from fuel, the avoided cost of local infrastructure and service provision for fossil fuel sector, and the avoided cost of local and global externalities caused by fossil fuel consumption.
Assessment of environmental and socio-economic impacts at national level
TABLE 3.60. Environmental and socio-economic impacts associated with the technical potential of solar-powered water pumps in Kenya (11,000 systems).
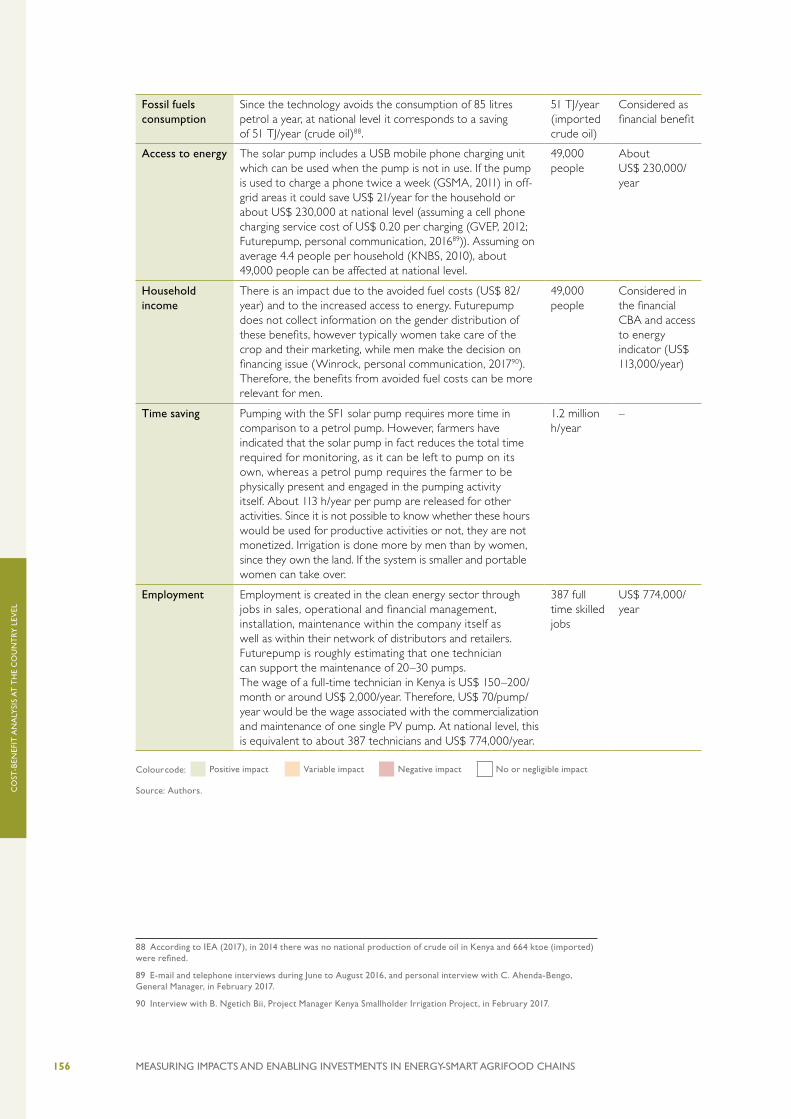
156 MEASURING IMPACTS AND ENABLING INVESTMENTS IN ENERGY-SMART AGRIFOOD CHAINS
CO
ST-B
ENEF
IT A
NA
LYSI
S A
T T
HE
CO
UN
TRY
LEV
EL
Fossil fuels consumption
Since the technology avoids the consumption of 85 litres petrol a year, at national level it corresponds to a saving of 51 TJ/year (crude oil)88.
51 TJ/year (imported crude oil)
Considered as financial benefit
Access to energy The solar pump includes a USB mobile phone charging unit which can be used when the pump is not in use. If the pump is used to charge a phone twice a week (GSMA, 2011) in off-grid areas it could save US$ 21/year for the household or about US$ 230,000 at national level (assuming a cell phone charging service cost of US$ 0.20 per charging (GVEP, 2012; Futurepump, personal communication, 201689)). Assuming on average 4.4 people per household (KNBS, 2010), about 49,000 people can be affected at national level.
49,000 people
About US$ 230,000/year
Household income
There is an impact due to the avoided fuel costs (US$ 82/year) and to the increased access to energy. Futurepump does not collect information on the gender distribution of these benefits, however typically women take care of the crop and their marketing, while men make the decision on financing issue (Winrock, personal communication, 201790). Therefore, the benefits from avoided fuel costs can be more relevant for men.
49,000 people
Considered in the financial CBA and access to energy indicator (US$ 113,000/year)
Time saving Pumping with the SF1 solar pump requires more time in comparison to a petrol pump. However, farmers have indicated that the solar pump in fact reduces the total time required for monitoring, as it can be left to pump on its own, whereas a petrol pump requires the farmer to be physically present and engaged in the pumping activity itself. About 113 h/year per pump are released for other activities. Since it is not possible to know whether these hours would be used for productive activities or not, they are not monetized. Irrigation is done more by men than by women, since they own the land. If the system is smaller and portable women can take over.
1.2 million h/year
–
Employment Employment is created in the clean energy sector through jobs in sales, operational and financial management, installation, maintenance within the company itself as well as within their network of distributors and retailers. Futurepump is roughly estimating that one technician can support the maintenance of 20–30 pumps. The wage of a full-time technician in Kenya is US$ 150–200/month or around US$ 2,000/year. Therefore, US$ 70/pump/year would be the wage associated with the commercialization and maintenance of one single PV pump. At national level, this is equivalent to about 387 technicians and US$ 774,000/year.
387 full time skilled jobs
US$ 774,000/year
Colour code:
Positive impact Variable impact Negative impact No or negligible impact
Source: Authors.888990
88 According to IEA (2017), in 2014 there was no national production of crude oil in Kenya and 664 ktoe (imported) were refined.
89 E-mail and telephone interviews during June to August 2016, and personal interview with C. Ahenda-Bengo, General Manager, in February 2017.
90 Interview with B. Ngetich Bii, Project Manager Kenya Smallholder Irrigation Project, in February 2017.

157MEASURING IMPACTS AND ENABLING INVESTMENTS IN ENERGY-SMART AGRIFOOD CHAINS
CO
ST-B
ENEF
IT A
NA
LYSI
S A
T T
HE
CO
UN
TRY
LEV
EL
PROFITABILITYTable 3.61 shows that both the financial and the economic NPV of a solar-powered water pump are very positive, compared with the benchmark of a petrol pump. Figure 3.39 shows that the investment pays back in less than 4 years and that the main economic benefits are in terms of access to energy, GHG emissions and employment creation.
TABLE 3.61. Financial and economic CBA of solar-powered water pumps in Kenya.
Item Unit Value (single intervention)
Value (at scale)
Notes
Costs
Capital costs US$ 650 7,188,470 Every 10 years. Benchmark petrol pump: US$ 250 every 3 years
Maintenance costs US$/year 33 364,953 Starting from Year 3.
Fuel costs US$/year –82 –906,853 Fuel cost (ERC, 2017)
Missing tax revenue from fuel
US$/year 32 353,894 ERC (2017)
Net tax revenue from imported technology
US$ 29 (Year 0)58 (Year 4)69 (Year 7)
320,716 (Year 0)641,433 (Year 4)763,084 (Year 7)
KKRA, 2016 and personal communication with Futurepump
Benefits
VAT revenue US$/year 6 (Year 1)3 (Year 2–6)2 (Year 7–9)1 (Year 10)
66,355 (Year 1)33,178 (Year 2–6)22,118 (Year 7–9)11,059 (Year 10)
FAO and GIZ, 2018
Avoided costs of infrastructure and services facilitated by local governments
US$/year 2 (Year 6–10)1 (Year 1–5)
11,059 (Year 1–5)22,118 (Year 6–10)
UNEP, 2016
GHG emissions US$/year 38 420,249 Petrol pump consumes 85 l/year, mitigating 0.2 t CO2eq (IPCC, 2006; UNEP, 2016; personal communication with Futurepump).
Access to energy US$/year 21 230,031 Using the pump to charge a phone twice a week can save US$ 21/year per household (GSMA, 2011; GVEP, 2012; Futurepump, personal communication, 2016).
Employment US$/year 70 774,143 1 technician to maintain 25 pumps, with a wage of a US$ 2,000/year (Futurepump, personal communication, 2016).
PROFITABILITY INDICATORS
Financial NPV US$ 331 3,655,784
Financial IRR % 27
Economic NPV US$ 986 10,904,419
Economic IRR % 52
Note: Life expectancy of the technology is 10 years. Discount rate is 11%. Compared with the benchmark of a petrol pump. Financial costs and benefits are on a orange background. Economic costs and benefits are on a green background.
Source: Authors.

158 MEASURING IMPACTS AND ENABLING INVESTMENTS IN ENERGY-SMART AGRIFOOD CHAINS
CO
ST-B
ENEF
IT A
NA
LYSI
S A
T T
HE
CO
UN
TRY
LEV
EL
FIGURE 3.39. Financial and economic cumulative discounted costs and benefits over 10 years of a solar-powered water pump for vegetables in Kenya.
0 1 2 3 4 5 6 7 8 9 10
– 0.4
– 0.6
0
1.2
1.3
1.4
1.5
1.6
1.7
– 0.2
Financial net benefits
Subsidies and taxes
GHG emissions Employment
Tho
usan
d U
S$
years
Access to energy
Note: Additional non-monetized impacts on time saving and fossil fuel consumption occur (Table 3.61).
Source: Authors.
RESULTSBy assuming that nationally 11,000 solar-powered water pumps for vegetables (tomatoes and beans) can be installed, the initial investment requires about US$ 7 million. For each system, both the financial and the economic NPV are positive (US$ 3.6 and 10.9 million respectively) with IRRs of 27% and 51% respectively. As Figure 3.40 shows, the difference between the economic and financial NPV (with an investment horizon of 10 years) is mainly due to GHG emission reduction (US$ 2.8 million), improved access to energy (US$ 1.7 million in 10 years) and job creation in the technology sector (US$ 4.6 million). The benefits in terms of access to energy are however to be interpreted as generous, since it is assumed that the pumps are used to power small appliances such as phones in off-grid areas. This latter benefit could in reality be much lower and even negligible. Avoided revenues from various taxes is the only cost for society. Additional non-monetized benefits are in terms of reduction in fossil fuel consumption and time savings.

159MEASURING IMPACTS AND ENABLING INVESTMENTS IN ENERGY-SMART AGRIFOOD CHAINS
CO
ST-B
ENEF
IT A
NA
LYSI
S A
T T
HE
CO
UN
TRY
LEV
EL
Data sources
Figure 3.41. Input data for the assessment of the technology potential of solar-powered water pumps for vegetables in Kenya illustrates the information needed for estimating the technical potential of the technology, and Table 3.62 summarizes the information and data input needed, and actually used, for the techno-economic analysis.
FIGURE 3.40. Cumulative economic costs and benefits of solar-powered water pumps for vegetables in Kenya at national level after 10 years (11,000 systems).
4
2
6
0
8
10
12
14
4.6
1.7
3.7
–1.8
2.8
–2
US$ 7 million For 11,000 systems
INITIAL INVESTMENTOVER 10 YEARS
US$ 10.9 millionECONOMIC NPV
FINANCIAL IRR
27%
US$ 3.7 millionFINANCIAL NPV
Mill
ion
US$
Financial net bene�ts
GHG emissions
Subsidies and taxes
Employment
Access to energy
Time saving
Fossil fuel consumption51TJ/year
Note: The sum of the financial NPV and the economic co-benefits and costs is the economic NPV.
Colour code for non-monetized impacts: Positive impact Variable impact Negative impact
Source: Authors.

160 MEASURING IMPACTS AND ENABLING INVESTMENTS IN ENERGY-SMART AGRIFOOD CHAINS
CO
ST-B
ENEF
IT A
NA
LYSI
S A
T T
HE
CO
UN
TRY
LEV
EL
FIGURE 3.41. Input data for the assessment of the technology potential of solar-powered water pumps for vegetables in Kenya.
Note: Blue boxes represent country-related primary input data, green boxes are calculated data
and the grey box represents the result.
Source: Authors
Areas with a dynamic head appropriate
for the technology
Area where the technology can
be applied
Land area served by one pump
Solar powered water pumps for vegetables
technical potential
Area harvested dedicated
to vegetables
Harvested irrigated temporary crop area
for vegetables
Percentage of rural area with
no electricity
TABLE 3.62. Data sources for the CBA of solar-powered water pumps for vegetables in Kenya.
Data input International source Source used
Areas with a dynamic head appropriate for the technology
– Literature
Total area harvested dedicated to vegetables
AQUASTAT, 2016 AQUASTAT, 2016
Harvested irrigated temporary crop area for vegetables
AQUASTAT, 2016 FAO, 2015 and AQUASTAT, 2016
Percentage of rural area with no electricity
World Bank, 2016b World Bank, 2016b
Reference land area of farm Literature
Labour costs ILO, 2017 (for some countries) Literature
Fuel cost – Government data and literature
Local taxes – Government data and literature
Duty on technology import – Government data and literature
GHG emission factor IPCC, 2006 IPCC, 2006
Fossil fuel consumption IEA, 2017 IEA, 2017
Saving on cell phone charging service – Literature
Note: Shaded rows represent country-related primary input data.
Source: Authors.

161MEASURING IMPACTS AND ENABLING INVESTMENTS IN ENERGY-SMART AGRIFOOD CHAINS
CO
ST-B
ENEF
IT A
NA
LYSI
S A
T T
HE
CO
UN
TRY
LEV
EL
Barriers to technology adoption
A first barrier to the uptake of irrigation technologies is the inadequate technical capacity of technicians and the limited farmer business skills. In some cases, the PV pump is not as powerful as fuel pumps and needs longer pumping time, which can hinder its adoption. If the technology uptake is relevant and concentrated in a region, it can lead to underground water overexploitation.
In addition to regulation in the water sector, regulation in the solar sector also affects the adoption of the technology. The rules for the import duty exemption of solar pumps must be certain and the enforcement for quality standards of solar technology must be able to avoid counterfeit products.
The Government’s current policy of structural adjustment can be seen as a barrier to the expansion of irrigation, as its withdrawal from the input supply system, extension service, marketing, primary processing and ginneries has not yet been replaced by the uptake of the private sector in these areas (FAO and IFC, 2015).
Finance for farm inputs is one of the biggest challenges. Some technology providers offer in-house payment plan and report very few defaults, but often late payment. They often partner with microfinancing institutions (MFIs). Systemic risks associated with investment in agriculture are production risks (drought, flood), informality of farmers who do not keep records, and administrative cost to reach remote farmers.
TABLE 3.63. Key barriers to the adoption of solar-powered water pumps for vegetables in Kenya.
Knowledge and information
Organization/social
Regulations/ institutions
Support services/structures
Financial returns
Access/cost of capital
Low farmer business skills
Lack of market awareness by farmers
Lack of technical capacity of technicians
PV pump is not as powerful as fuel pumps and needs longer pumping time
Risk of underground water over-exploitation
PV panels are valuable and subject to thefts
Rules for the import duty exemption of solar pumps are uncertain/unclear
No enforcement of quality standards of solar technology (to avoid counterfeit products)
Support services are low although developing at fast pace
Production risks
Difficult access to microcredit for small-holders (due to lack of collateral)
Source: Authors.

© GIZ/Meissner
3.3 RICE VALUE CHAIN

163MEASURING IMPACTS AND ENABLING INVESTMENTS IN ENERGY-SMART AGRIFOOD CHAINS
CO
ST-B
ENEF
IT A
NA
LYSI
S A
T T
HE
CO
UN
TRY
LEV
EL
3.3.1 PHILIPPINES: ENERGY INTERVENTIONS IN THE RICE CHAIN
Value chain description
Rice represents the most important staple crop in the Philippines. The rice sector employs 2.5 million households broken down into 2.1 million farmers, 110,000 workers for post-farm activities and 320,000 for ancillary activities (Gonzales, 2013). Total number of palay (paddy or pre-husked rice) farm holdings is above 2 million (Bureau of Agriculture Statistics BAS, 2002). IRRI estimates 2.4 million Philippine rice farmers with an average farm size of 1.14 ha (IRRI, 2015).
Typically, the palay is sold by the farmers to traders, who then sell paddy rice to rice mills. Rice millers process the paddy into milled rice. From the mill, the milled rice goes to wholesalers, who may also obtain milled rice from importers. Wholesalers then sell it to retailers, who can sell the (often loose) rice in traditional outlets (public or wet markets, or roadside stalls), or pre-packed and sealed rice in modern outlets (i.e. supermarkets and retail chains).
FIGURE 3.42. Rice value chain in the Philippines.
Source: Philippine Institute for Development Studies (PIDS), 2015.
Production Marketing (farmgate)
Marketing (wholesalers) RetailMilling
(processing)
Farmers Paddy traders Millers Wholesalers
Retailers (traditional,
modern retail); Consumers
ImportersImport

164 MEASURING IMPACTS AND ENABLING INVESTMENTS IN ENERGY-SMART AGRIFOOD CHAINS
CO
ST-B
ENEF
IT A
NA
LYSI
S A
T T
HE
CO
UN
TRY
LEV
EL
In recent years, domestic rice production has been increasing, due to both rising area and yield. Table 3.64 shows the production of palay in tonnes, and the milled equivalent when data are available, over the last four years in the Philippines (CountrySTAT Philippines, 2016). According to the National Food Authority (NFA), in 2013 there were over 8,000 registered rice mills operating all over the Philippines, but the actual number is hard to estimate (Philippine Institute for Development Studies (PIDS), 2015). Milling costs are around PHP 60/sack (US$ 1.35) (PIDS, 2015). At present, there is scattered information on energy usage and energy source in rice and rice-based farming (PhilRice, 2014).
TABLE 3.64. Paddy production in the Philippines per year.
Year 2012 2013 2014 2015
Palay (paddy) (million tonnes) 18.0 18.4 19.0 18.1
Rice (milled equivalent) (million tonnes) 12.0 12.3 – –
Source: CountrySTAT, 2016; FAOSTAT, 2016.
The total amount of rice husk produced can be approximately estimated in first instance from the volume of rice production, considering that 1 tonne of milled rice generates 0.22–0.23 tonnes of husks, hence husk is approximately 20% of rice production by weight (GIZ, 2015). Annually, around 2–3 million metric tonnes of rice husk are totally produced in the country (PhilRice, 2016).
Rice husks gasification applications exist in the Philippines both for small farm operations and for grid electricity generation. The availability of the feedstock all year round is a concern for large plants, while for small generators the problems mainly relate to barriers to access incentives for renewable energy (the administrative work takes long, is difficult and costly, with the consequence that investments in small RE applications are discouraged) (B. Tadeo, personal communication, 2016).
In the absence of study-based figures, some experts assume a 50% recoverability factor, meaning that out of the computed theoretical amount of rice husks produced in an area, only 50% can be made available for utilization as fuel (GIZ, 2015). Rice husks utilization as feedstock for biomass power plants selling electricity to the grid under the FIT system is a practice in Mindanao and Luzon (B. Tadeo, personal communication, 2016). Although rice husks can also be used as fuel for cookstoves, kilns, ovens or dryers, they are considered a waste and a disposal problem by many rice mills in the Philippines (Militar, 2014).
GENDER ANALYSISEven in the poorest rural regions of the Philippines, the majority of women today is strongly involved in community development activities, compared to the past (IFAD, 2014). Nevertheless, gender inequality continues to pervade rural areas and the agricultural sector, limiting equitable economic growth and development. Despite being one of the largest sectors of women’s (formal and informal) employment in the country and undergoing agrarian reform, significant gender issues persist (ADB, 2013):

165MEASURING IMPACTS AND ENABLING INVESTMENTS IN ENERGY-SMART AGRIFOOD CHAINS
CO
ST-B
ENEF
IT A
NA
LYSI
S A
T T
HE
CO
UN
TRY
LEV
EL
• Women have lower access to land ownership (owing to inheritance laws, land titling systems and their ability to purchase land), credit, irrigation, farm equipment, cash crops and the resulting income and skilled wage employment.
• Women are substantially underrepresented among university students studying agriculture, as well as law, information technology and engineering.
• There is a lack of sex-disaggregated data collected and analysed to understand women’s work in agricultural subsectors and value chains.
• Overarching agricultural policies and plans do not pay adequate attention to women’s constraints.
Evidence suggests that women’s access to extension services varies, from low access compared to men (ADB, 2013) to direct contact with extension officers and more active participation in extension meetings than men (Akter et al., 2017).
Women are mainly responsible for kitchen gardens, small livestock and subsistence crops to feed their families and generate a small income. As the government promotes more diversified cropping systems and cash crops for export, there is some evidence that women have become more marginalised (ADB, 2013). Although women are increasingly engaged in paid work in general, paid work in agriculture represents 6% of women’s employment as opposed to 22% of men’s employment. A higher proportion of men than women is also engaged in off-farm and non-farm paid work. Women are active members of women-only mixed agricultural organizations as well as non-agricultural organizations and they often play strong leadership roles (Akter et al., 2017). Domestic and care work consume much of women’s time as gendered social norms and relatively high fertility rates continue to demand women’s unpaid labour at home (ADB, 2013).
In traditional rice farming systems in the Philippines, there are tasks performed by men or women and tasks that are shared. Men are more involved at the input stage, while women provide most of the labour in rice production and post-production tasks as well as in marketing, see Figure 3.43. Traditionally, men have almost exclusive use of machinery. The manual nature of women’s agricultural work means that they are overwhelmed by the heavy peak season workload, which reduces their wellbeing and can cause numerous health problems (Akter et al., 2017).

166 MEASURING IMPACTS AND ENABLING INVESTMENTS IN ENERGY-SMART AGRIFOOD CHAINS
CO
ST-B
ENEF
IT A
NA
LYSI
S A
T T
HE
CO
UN
TRY
LEV
EL
Major changes have occurred over recent decades to traditional rice farming systems in the Philippines, leading to less gendered tasks in some areas. The proportion of de facto and de jure91 female-headed households in the Philippines has increased in the last fifty years from less than 1% in the mid-1960s to 19% in 2013 (IRRI, 2015; World Bank data, 2015). Leading reasons for women’s greater participation in rice farming systems include: migration away from rain-fed and irrigated-farming systems by men (20% and 20%, respectively) and women (34% and 20%, respectively) in search of more reliable and higher earning employment; the even higher proportion of sons and daughters migrating than parents; and, the growing number of young people working in the non-farm sector (IFAD, 2010).
In most cases, the absence of men, sons and daughters has not increased women’s workload because women use remittances to hire labour for land preparation, the spraying of chemicals and other heavy tasks. However, de facto female-headed households have faced problems in managing their farms, due to lack of access to new seed varieties and technical knowledge of improved methods of crop management. In such cases, women rely on other information sources, including other farmers and input dealers. Research suggests that overall rice yields of households with migrants have not declined (IFAD, 2010).
In male-headed households, men tend to dominate farm-related decision-making, including what crop to grow and crop management, and they take decisions about credit (ADB, 2013; IFAD, 2010). Women make decisions regarding seed selection and harvesting, deciding how much of the harvest to sell, how to allocate earnings and what to feed their families (ADB, 2013). Joint decisions by men and women are made on children’s education. In households where men have migrated, women make more farm-related decisions (ADB, 2013; IFAD, 2010). While this gives them greater voice
91 De facto female-headed households are those where the male head is absent for long periods of time or, less commonly, when a woman is the self-reported head while the man is still present. De jure female-headed households are those headed by women with legal and customary rights i.e. widows or single, divorced or separated women.
FIGURE 3.43. Gender roles along the rice value chain in the Philippines.
Legend: Size of the men/women icons indicates the extent of their participation in each step of the chain.
Orange font: Activities usually performed by women; Blue font: Activities typically done by men.
Source: Authors’ elaboration based on Buag-ay, 2008; IFAD, 2010; ADB, 2013; FAO (date unknown); Akter et al., 2017.
Inputs• Land preparation• Seedbed preparation• Fertilizer application• Spraying pesticides • Irrigation• Hiring and super-vision of labourers
Production• Sowing • Transplanting• Weeding• Reaping• Threshing• Cleaning• Cooperative
members• Cooperative
members
Transport & Collection• Transportation
Storage & Handling• Storage • Paddy traders
Processing • Drying • Manual milling • Mechanized milling
(in rice mills)

167MEASURING IMPACTS AND ENABLING INVESTMENTS IN ENERGY-SMART AGRIFOOD CHAINS
CO
ST-B
ENEF
IT A
NA
LYSI
S A
T T
HE
CO
UN
TRY
LEV
EL
and influence over important decisions, many women report that it brings increased stress (IFAD, 2010). In the Philippines, income from remittances provides a substantial share of average annual household income, at 59% (IFAD, 2010). Women reportedly control remittance income and generally spend it on food, followed by children’s education and farm inputs.
ENERGY ASPECTSEnergy consumption in the Philippines accounted for 19 GJ per capita in 2013 (World Bank, 2016). In the Philippine primary energy mix, oil provides the highest share at 31%, followed by geothermal at 22%. Coal come close next at 20%, biomass at 12%, natural gas at 8%, hydro at 6% and bio-fuels at 1%. Wind and solar come last, although developments in the local energy sector have shown that solar and wind are among the fastest growing renewable energy sources in the Philippines (GIZ, 2015).
The national power grid is under the management of the National Grid Corporation of the Philippines (NGCP). The total installed capacity of the national grid stands at 16,162 MW with a dependable capacity at 14,477 MW (GIZ, 2015).
Table 3.65 summarizes the status of energization in the Philippines at level of barangay (village or district), sitio (territorial enclaves, usually rural, far from the barangay center) and connection, at October 2016.
TABLE 3.65. Status of energization in the Philippines, in 2016.
BARANGAYS SITIOS CONNECTIONS
Potential Energized % Unenergized Potential Energized % Unenergized Potential Energized %
Total 36,061 36,051 99 10 142,157 118,693 83 23,464 13,335,500 11,724,640 88
Source: National Electrification Administration, 2017.
Electricity tariffs in the Philippines in 2013 ranged between PHP 2.97/kWh (US$ 0.06/kWh) and PHP 5.69/kWh (US$ 0.11/kWh) with unbundling rate and between PH P2.10/kWh (US$ 0.04/kWh) and PHP 7.24/kWh (US$ 0.15/kWh) with Time of Use (TOU) rate, according to the location (Energypedia, 2016b).
Between 1996 and 2001, the government deregulated the downstream oil and electricity sectors and, at the same time, phased out price subsidies, including the removal of the Oil Price Stabilization Fund and the privatization of the National Power Corporation. Consecutive Philippine governments have managed to keep subsidies at bay. Challenges of this choice have included major reviews and a constitutional challenge. Rather than using subsidies, the Philippines has mitigated the impact of high world oil prices through non-pricing efforts. For instance, the government encouraged domestic oil companies to discount diesel prices. The Philippines has also expanded its social welfare programs, notably the Pantawid Pamilyang Pilipino Program (4P), introduced in 2007. Through 4P, the government can target support to vulnerable households in poorer parts of the country when energy prices are rising. When fuel and food prices rose in the wake of the global financial crisis in 2008, the government temporarily expanded the program’s eligibility criteria (IISD, 2015).

168 MEASURING IMPACTS AND ENABLING INVESTMENTS IN ENERGY-SMART AGRIFOOD CHAINS
CO
ST-B
ENEF
IT A
NA
LYSI
S A
T T
HE
CO
UN
TRY
LEV
EL
New generating capacity needs to be put in place to meet the increasing demand for power as the economy and the population grows. The Department of Energy has presented a sustainable low-carbon scenario for the years ahead following the Policy Thrusts of the Philippines Energy Plan 2012–2030, forecasting the development of additional generation capacity that is clean, renewable and sustainable for the whole country (GIZ, 2015). The Philippines National Renewable Energy Program targets geothermal, wind, hydro, solar, ocean and biomass energy (REMB, no date).
The Energy Regulatory Commission (ERC) published the Feed-in Tariff Rules in 2010, mandated in the 2008 Renewable Energy Law. The main incentives for renewable energy under the Renewable Energy Law are:
• Feed-in tariff: FiT for biomass of PHP 6.63/kWh (US$0.15/kWh). Starting in January 2017, the FiT rate will be decreased every two years by 0.5% (GIZ, 2015). To be eligible for a FIT, power utilities must receive a Certificate of Compliance from the ERC. The Department of Energy is in charge of certifying the agents that want to sell electricity and access the FiT. This is a rather complicated and costly process that discourages small producers. The mandatory system impact study (SIS) to access the FiT alone costs more than PHP 100,000 (US$ 2,222).
• Net metering: End-users with RE generation can supply the distribution unit with up to 100 kW of excess generation capacity.
• Priority dispatch: Qualified/registered RE generators enjoy priority access to dispatch and to the transmission and distribution grid.
• Duty-free importation for RE equipment and other tax-based incentives (Militar, 2014).
The access to these incentives can be costly and requires time. These high transaction costs can be a barrier particularly for small economic agents with limited capital.
On the off-grid islands, the price of electricity has to be negotiated with the local DU (usually electricity cooperatives) and then approved by ERC (Energy Regulation Commission). The National Powered Corporation Small-power Utilities Group (NPC-SPUG) is mandated by law to undertake the electrification of areas not connected to the main transmission grid, also referred to as Missionary Areas. It applies subsidised approved generation rates (SAGRs) that range from PHP 4.80 to PHP 7.06/kWh (US$ 0.11 to US$ 0.16/kWh) (NPC-SPUG, 2016). In these areas, an average subsidy of PHP 5.931/kWh (US$ 0.13/kWh) is therefore considered. However, also transaction costs to get these SAGRs are very high, which is a major barrier for small power units.
Diesel prices in the Philippines varied between US$ 0.47 and US$ 0.60/litre in 2016 (GlobalPetrolPrices.com, 2016). The Philippines removed all consumer fossil energy subsidies as part of a wider structural reform. Details are explained in the following analysis for PV for rice milling.

169MEASURING IMPACTS AND ENABLING INVESTMENTS IN ENERGY-SMART AGRIFOOD CHAINS
CO
ST-B
ENEF
IT A
NA
LYSI
S A
T T
HE
CO
UN
TRY
LEV
EL
Sale of power or fuel generated through renewable sources of energy such as biomass and solar are subject to 0% VAT rate. However, the zero-rating does not extend to the sale of services related to the maintenance or operation of plants generating said power. Still, services by agricultural contract growers, such as milling of palay into rice for others, are considered VAT-exempt transactions (Bureau of Internal Review BIR, 2016). Therefore, the milling services are considered VAT-exempted.
Technologies assessed
Risk husk gasification can be viable in off-grid areas of the Philippines, since it can be viable if electricity is produced by a diesel generator, while it is hardly competitive with grid electricity. The actual amount of rice husks which can be mobilized in a specific area is determined by the presence of stationary rice mills where rice husk is usually found piled up at mill sites, and by the competitive uses of the husk. Mills usually do not haul their husks to another site since its bulky and dusty nature causes high costs (not excluding the possibility to carry out such operation under different market prices). A previous study on the utilization of rice husks for energy generation found out that the most viable scheme is to put up the power plant at the mill site., near the mill site, or near a cluster of adjacent mill sites where the amount of rice husks generated is sufficient to supply the gasification plant (GIZ, 2015).
Small scale PV rice processing technologies are not well-known in the Philippines in spite of their potential. This technology is hardly competitive with large and medium size traditional rice processing in the country but is suitable for small rice processors. In the main islands, numerous rice mills compete for paddy rice markets, also across provinces, as widening their procurement area allows mills to obtain rice over different harvesting seasons, thereby avoiding excess capacity (PIDS, 2015). However, solar- powered domestic rice processing systems seem a valid technology to be adopted in off-grid areas and in small islands where production quantities are not high, or where rice has to be transported for long distances before being processed (Department of Energy (DOE), personal communication, 201692).
92 Information retrieved during a meeting with Mario C. Marasigan, Director; Fortunato S. Sibayan, Chief; Ruby B. de Guzman, OiC; and Cristina P. Valasco, in August 2016.

170 MEASURING IMPACTS AND ENABLING INVESTMENTS IN ENERGY-SMART AGRIFOOD CHAINS
CO
ST-B
ENEF
IT A
NA
LYSI
S A
T T
HE
CO
UN
TRY
LEV
EL
TABLE 3.66. Energy interventions considered for the rice value chain in the Philippines.
Rice husk gasification Solar-powered domestic rice processing
• Viable in off-grid areas if it replaces a diesel generator
for milling. • It can be installed at, or close to, the
mill site, or can serve a cluster of mill sites.
• Valid technology in off-grid areas and in small islands where production quantities are not high or where rice has to be transported for long distances before being processed.
Source: Authors.
During rice production, rice husk is considered a waste product. However, rice husk gasification for energy production can be viable in off-grid areas of the Philippines. © “Biomass Power Station at Paper Mill”, photo by Land Rover Our Planet via flickr, licensed under CC BY 2.0
RICE HUSK GASIFICATION
Technology potential
After a preliminary analysis and discussions with local experts, it became evident that rice husk gasification (RHG) for electricity is hardly competitive with grid electricity. It was therefore decided to assume that the technology has potential exclusively in off-grid areas (the RHG technology can displace on average two thirds of diesel consumption (FAO, 2017))93. Table 3.67 resumes the most essential information
93 However, rice husks are already used as a feedstock for biomass power plants in the Philippines selling to the grid under the feed-in-tariff system. Examples of which production is known are the Isabela Biomass Energy Corp. (20 MW), the San Jose iPower (12 MW) and the Lamsan corn starch cogeneration plant (3.5 MW) (B. Tadeo, personal communication, 2016).

171MEASURING IMPACTS AND ENABLING INVESTMENTS IN ENERGY-SMART AGRIFOOD CHAINS
CO
ST-B
ENEF
IT A
NA
LYSI
S A
T T
HE
CO
UN
TRY
LEV
EL
related to rice husks for estimating the potential of the technology in the Philippines. The energy potential of rice husks assumed (the lowest value found in literature was adopted), the recoverability factor and the percentage of rice husks by weight of palay are summarized in Table 3.67.
TABLE 3.67. Rice husk data for the Philippines.
Item Value
Energy potential (kWh/tonne) 410
Recoverability factor (%) 50
Percentage of husk by rice weight (%) 22
Source: GIZ, 2015.
Based on the map of the electricity grid extension in the Philippines, the relevant provinces are mostly small islands as reported in Table 3.68. The amount of rice husks produced in off-grid areas has been evaluated starting from the average palay production over 2013, 2014 and 2015.
TABLE 3.68. Palay production in off-grid provinces in the Philippines, 2013–2015.
Off-grid provinceProduction (thousand tonnes/year)
2013 2014 2015 Average
Basilan 5.2 3.8 2.7 3.9
Batanes 0.01 0.09 0.07 0.06
Bohol 256.4 255.1 252.8 254.8
Catanduanes 29.5 35.5 35.7 33.6
Marinduque 17.4 15.1 15.9 16.1
Masbate 168.76 180.2 147.8 165.5
Occidental Mindoro 335.8 346.5 362.5 348.3
Oriental Mindoro 391.9 413.5 392.2 399.2
Palawan 256.4 274.2 280.2 270.3
Romblon 32.5 32.6 31.0 32.0
Sulu 2.3 2.1 2.4 2.3
Surigao del Norte 69.7 63.7 60.6 64.6
Tawi-tawi 0.6 0.6 0.4 0.6
Source: Palay production is obtained from FAO CountrySTAT, accessed on September 2016.
Local experts revealed that the technology is mostly viable for medium scale applications. Consequently, the capacity of the ‘typical’ RHG plant in the country was assumed to be 100 kW. A plant of this size would require about 244 kg of rice husks as feedstock per hour of activity. Based on Table 3.68 and the palay production in off-grid areas of the Philippines, the technical potential of this energy intervention is presented in Table 3.69.

172 MEASURING IMPACTS AND ENABLING INVESTMENTS IN ENERGY-SMART AGRIFOOD CHAINS
CO
ST-B
ENEF
IT A
NA
LYSI
S A
T T
HE
CO
UN
TRY
LEV
EL
TABLE 3.69. Technology potential of rice husk gasification in off-grid areas of the Philippines.
Item Value Source
Rice husk produced off-grid (thousand tonnes/year) 318 Authors’ calculations based on FAO CountrySTAT data
Potential electricity generation from recoverable rice husk in off-grid Philippines (GWh/year)
65.2 Authors’ calculations based on GIZ 2015
Potential electricity capacity from recoverable rice husk in off-grid Philippines (MW)
7.4 Authors’ calculations
Installable gasification plants 75 Authors’ calculations
Source: Authors.
Cost-benefit analysis
FINANCIAL CBAThe benchmark situation for this intervention assumes that the electricity generated replaces a diesel generator for a mill (including transporters, shakers, threshers, polishers, etc.) with a capacity of about 0.8 tonnes/hour. Millers of this size in rural areas typically have old machinery, including old (often second-hand) diesel generators. The cost of procuring such diesel generator is typically around US$ 10,000 (UNFCCC, 2013), and it can work for about 12,000 hours. For the mill, an operating window of 8 hours per day for 25 days per month is assumed in a first scenario (Scenario 1). In this case, about 19,000 litres of diesel would be needed every year to run a diesel-powered mill and the diesel generator would need to be replaced every 5 years. An alternative scenario (Scenario 2) is made where the system runs on a double shift of 16 hours per day. In this case, the cost of fuel and labour doubles and the diesel generator needs to be replaced every 2–3 years.
The technical coefficients used (calorific values of rice husk and diesel fuel; efficiency of the dual-fuel electricity generator; average lifetime of diesel motors) are consistent with the case study in FAO and GIZ (2017). Prices of husk and paddy rice through the value chain come from private communication and the National Food Authority data94. The model has assumed a 30/70 split of fragrant to mixed rice (World Bank, 2015).
Rice husk gasification brings about an additional benefit due to the production of biochar: rice husk char (RHC) is often used as an additive to construction materials (e.g. bricks, tiles, insulators, etc.), or to fertilizers as a soil amendment. The technology provider, Ankur, provides a dry char discharge system to separate the dry biochar from tar and other liquid by-products. Given the high ash content of rice husk, the gasifier is likely to generate approximately 35% rice husk char (dry weight proportion of feedstock) (Shackley et al., 2011). In the Philippines, the price for biochar is around US$ 0.09–0.10/kg (IBI, 2014). By multiplying this price for the quantity of RHC produced, it is possible to quantify an additional benefit to be accounted for in the CBA.
94 Available at http://www.nfa.gov.ph/

The technology provider Ankur sells a dry char discharge system to separate the dry biochar from tar and other liquid by-products. ©Ankur

174 MEASURING IMPACTS AND ENABLING INVESTMENTS IN ENERGY-SMART AGRIFOOD CHAINS
CO
ST-B
ENEF
IT A
NA
LYSI
S A
T T
HE
CO
UN
TRY
LEV
EL
The financial CBA of the project for a RHG technology shows a long-term benefit in terms of cost savings due to less fuel being required to operate the mill. The project outcomes are dependent upon the comparison of fixed and running costs of the diesel-powered and the RHG technology, which is in turn reliant on the price of fuel. In the Philippines, in 2016 official diesel prices varied between US$ 0.47 and US$ 0.60/litre (GlobalPetrolPrices.com, 2016), even though they can be up to five times higher in remote areas (DOE, personal communication, 2016). An average price of US$ 0.55/litre was initially assumed for the assessment. However, since the price of diesel is very volatile and uncertain, an additional analysis is performed with different diesel price scenarios.
Fuel costs for the mill are much lower in the case of RHG system than in the case of the diesel-powered mill. However, maintenance costs are higher for the RHG than for the basic diesel-powered milling, demanding increased labour to clean the system and dispose of by-product, as well as filters and additional maintenance equipment. The model assumes that an additional power plant operator or engineer is required to run and maintain the RHG system at a cost of US$ 600/month (based on GIZ, 2015).
Assuming that the rice husk has a market price around PHP 1.3/kg (US$ 28.9/tonne), the financial CBA depends significantly on the price of rice husks. In fact, the rice husks used to power the RHG system cannot be sold on the market, thus reducing revenues. With a price of US$ 28.9/tonne of rice husk, both the financial and the economic NPV are negative and therefore the investment is unattractive (Scenario 1). However, assuming that there is no market for rice husk in these off-grid areas, and therefore its price is low or zero, the economic NPV turns positive. For instance, Figure 3.45 shows that already at a husk price lower than US$ 22/tonne makes the economic return is positive.
A further scenario in which the system runs 16 hours per day (two shifts) is also shown. Also in this case, the financial NPV is negative if the price of rice husk is higher than US$ 6/tonne (Scenario 2). Figure 3.45 shows that the economic NPV with a double shift is instead positive as long as the rice husk price does not go above US$ 40/tonne.
If the RHG system had the possibility to sell excess electricity to a local mini-grid, the scenario would change significantly. In the Philippines, the NPC-SPUG is to undertake the electrification of areas not connected to the main transmission grids. An average SAGR of PHP 5.931/kWh (US$ 0.13/kWh) is considered (NPC-SPUG, 2016). In the presence of this rate, if the system runs a double shift (16 hours), the financial NPV would be very positive since the subsidised rate represents an additional revenue of about US$ 32,600/year. Accessing this SAGR is however a costly process since it requires the approval of ERC. A capital cost of about PHP 100,000 (US$ 2,200) is considered to cover the transaction costs paid by the power unit.
ECONOMIC CBA
Value added along the value chainNearly a quarter of the total profit of rice production occurs after the milling process in the rice value chain (ADB, 2012). Based on the value chain marketing mark-up estimates (upon which the pricing progression assumptions are based, see Table 3.70),

175MEASURING IMPACTS AND ENABLING INVESTMENTS IN ENERGY-SMART AGRIFOOD CHAINS
CO
ST-B
ENEF
IT A
NA
LYSI
S A
T T
HE
CO
UN
TRY
LEV
EL
one tonne of milled rice would yield approximately US$ 222 in value chain profit (with a single 8 hours shift). However, since this energy intervention does not result in a change in volume or quality of rice processed by the miller, there is no impact at subsequent stages of the value chain with respect to the benchmark situation.
TABLE 3.70. Approximate rice prices in the Philippines.
Fragrant(PHP/kg)
Mixed(PHP/kg)
Farmer (farm gate) 17 17
Collector 20 20
Miller 30 25
Transporter 32 27
Wholesaler 37 32
Retailer 40 35
Sources: PIDS, 2015; World Bank, 2016e.
Subsidies and taxes In the Philippines there are no taxes on diesel. As described in the energy sector analysis, the Philippines has also duty-free import for renewable energy equipment and other tax-based incentives (Militar, 2014). Therefore, under these assumptions, no transfer payment affects the economic CBA of the RHG technology.
In the case in which a subsidised generation rate is assumed, this represents a cost for the government and is therefore accounted for as a cost in the economic CBA. As a consequence, in the economic CBA, net benefits from the SAGRs are zero.
Assessment of environmental and socio-economic impacts at national level
TABLE 3.71. Environmental and socio-economic impacts associated with the technical potential of rice husk gasification in the Philippines (75 systems).
Impact indicator Description Impact indicator
Monetized impact
Fertilizer use No direct impact on fertilizer use although biochar could be sold and used as soil amendment, therefore indirectly contributing to reducing the need for chemical fertilizers.
– –
Water use and efficiency
For a gasification system comprising a dry system for gas cleaning (dry gasification), water is only needed to cool the system, but this water is not exposed to the producer gas (like in the case of wet scrubbing of flue gases) and as such it can be recycled. There are anyway minor water losses due to evaporation but they are considered negligible.
– –
Food loss No impact – –
Land requirement No impact – –
GHG emissions The diesel-powered milling machinery has an emission factor of 0.051 tonnes CO2eq/tonne of rice, whereas the RHG-diesel generator has an emission factor of 0.016 tonnes CO2eq/tonne of rice (UNFCCC, 2013). For the purposes of this case study, the US EPA estimation
4,900 tonnes CO2eq/year
US$ 0.15 million/year

176 MEASURING IMPACTS AND ENABLING INVESTMENTS IN ENERGY-SMART AGRIFOOD CHAINS
CO
ST-B
ENEF
IT A
NA
LYSI
S A
T T
HE
CO
UN
TRY
LEV
EL
of the SCC of US$ 36 per tonne of CO2eq, is used. This value grows at a rate of 2.3% per year to reach US$ 55 in 2035 (EPA, 2015). At this valuation a diesel-powered rice mill of the processing capacity in this case is responsible for US$ 3,500 in “carbon damage” annually; a RHG system (Scenario 1) by comparison is responsible for US$ 1,120 in carbon damages. At national level, this difference amounts to US$ 150,000 annually.
Health risk due to indoor air pollution
No impact – –
Fossil fuels consumption
This intervention would displace on average two thirds of diesel consumption (FAO and GIZ, 2018). It displaces about 12,700 litres of diesel per year, and nationally about 950,000 litres of diesel per year.At national level, 37.5 million MJ of diesel can be saved yearly by adopting the RHG system at full potential, which corresponds to 150 million MJ of oil, as explained in the indicator.
150 million MJ oil/year
–
Access to energy No impact. In the case study, the electricity generated is used entirely for milling operations.
– –
Household income
No impact – –
Time saving No impact – –
Employment There is an increase in employment due to the additional staff needed to operate, clean and maintain the RHG system (cost of US$ 7,200 per year (Scenario 1)). Since this is the market value of the employment generated in the local economy, the full amount is credited to the economic CBA. A higher proportion of men are engaged in non-farm employment. The jobs generated here would be held by men (unless a gender quota is proposed and adhered to).
About 75 new jobs
US$ 540,000/year
Colour code:
Positive impact Variable impact Negative impact No or negligible impact
Source: Authors.
PROFITABILITYTable 3.72 summarizes the financial and economic CBA of one RHG system in the Philippines in the scenarios described above (1 shift; 2 shifts; 2 shifts with SAGR). The main environmental and social benefits are in terms of GHG emission reduction and employment creation.
TABLE 3.72. Financial and economic CBA of rice husk gasification in the Philippines.
Data Unit Value (single intervention)
Value (at scale)
Notes
Costs
Capital costs Thousand US$
46.0 3,425.8 Diesel generator replaced every 12,000 hours at a cost of US$ 10,000.
Labour costs Thousand US$/year
7.2 536.2 1 power plant operator or engineer at US$ 600/month.

177MEASURING IMPACTS AND ENABLING INVESTMENTS IN ENERGY-SMART AGRIFOOD CHAINS
CO
ST-B
ENEF
IT A
NA
LYSI
S A
T T
HE
CO
UN
TRY
LEV
EL
Fuel costs (1 shift)
Thousand US$/year
–7.1 –526.9 Reduction of 2/3 of diesel consumption. For shift 1: 2/3 of 19,000 litres, for shift 2 it is 2/3 of 38,000 litres. Diesel price of US$ 0.55/litre.
OR Fuel costs (2 shifts)
Thousand US$/year
–14.2 –1,053.8
Maintenance & Repair
Thousand US$/year
2.4 175.0 Maintenance equals 5% of equipment costs.
System impact study (SIS)
Thousand US$
2.2 163.8 In case of excess electricity sold with FiT
Benefits
Revenues from rice (1 shift)
Thousand US$/year
–3.7 –278.5 Assuming 8 h/day, and a husk price of US$ 28.9/t, including char.
OR Revenues from rice (2 shifts)
Thousand US$/year
–7.5 –557.0 Assuming 16 h/day, and a husk price of US$ 28.9/t, including char.
OR Revenues from rice (2 shifts with SAGR)
Thousand US$/year
32.6 2,430.2 Average subsidised approved generation rate (SAGR) of PHP 5.931/kWh.
GHG emission (1 shift)
Thousand US$/year
–2.5 –183.1 Reduction of 66 tCO2eq/year. SCC of US$ 36 per tonne of CO2eq.
OR GHG emission (2 shifts)
Thousand US$/year
–4.9 –366.1 Reduction of 132 tCO2eq/year. SCC of US$ 36 per tonne of CO2eq.
Employment (1 shift)
Thousand US$/year
7.4 548.5 1 power plant operator or engineer at US$ 600/month.
OR Employment (2 shifts)
Thousand US$/year
14.7 1,097.1 2 power plant operators or engineers at US$ 600/month.
Profitability indicators
Financial NPV (1 shift)
Thousand US$
–87.0 –6,477.4
Financial IRR (1 shift)
% negative
OR Financial NPV (2 shifts)
Thousand US$
–103.7 –7,720
OR Financial IRR (2 shifts)
% negative
OR Financial NPV (2 shifts with SAGR)
Thousand US$
115.3 8,587
OR Financial IRR (2 shifts with SAGR)
% 51%
Economic NPV (1 shift)
Thousand US$
–15.0 –1,119
Economic IRR (1 shift)
% 0%
OR Economic NPV (2 shifts)
Thousand US$
40.2 2,996
OR Economic IRR (2 shifts)
% 24%
OR Economic NPV (2 shifts with SAGR)
Thousand US$
42 3,160
OR Economic IRR (2 shifts with SAGR)
% 25%
Note: Life expectancy of the technology is 10 years. Discount rate is 8%. Financial costs and benefits are in orange. Economic (non-financial) costs and benefits are in green.
Source: Authors.

178 MEASURING IMPACTS AND ENABLING INVESTMENTS IN ENERGY-SMART AGRIFOOD CHAINS
CO
ST-B
ENEF
IT A
NA
LYSI
S A
T T
HE
CO
UN
TRY
LEV
EL
SENSITIVITY ANALYSIS
Rice husk priceAs mentioned in the financial CBA, the benefits of the RHG system depend on the price of rice husk. In fact, if there is a market price for the husk, the RHG will reduce the mill’s revenue with respect to the case of diesel generator, in which all the husks produced at the mill can be sold to the market. The decrease in fuel cost with the RHG system may not be enough to compensate this loss in revenues.
Figure 3.45 shows how financial and economic NPV change according to the price of rice husk. The financial NPV is always negative in the 1 shift scenario, no matter what the price of the rice husk is. However, the economic NPV in the case of 1 shift is positive if the price of husk is lower than about US$ 22/tonne. In the case of a double shift, the financial NPV is negative if the price of rice husk is higher than US$ 6–7/tonne. The economic NPV in the case of 2 shifts is positive if the price of husk does not go above US$ 37/tonne.
FIGURE 3.44. Financial and economic cumulative discounted costs and benefits over 10 years of a rice husk gasification system in the Philippines.
Note: Additional non-monetized impacts on fertilizer use and fossil fuel consumption occur (Table 3.72).
Source: Authors.
0 1 2 3 4 5 6 7 8 9 10 years
Tho
usan
d U
S$
Financial net benefits
Subsidies and taxes
GHG emissions
Employment
Value added along the VC
1 shift 2 shift 2 shift SAGR
300
250
200
150
100
50
0
–50
–100
–150
–200
–250

179MEASURING IMPACTS AND ENABLING INVESTMENTS IN ENERGY-SMART AGRIFOOD CHAINS
CO
ST-B
ENEF
IT A
NA
LYSI
S A
T T
HE
CO
UN
TRY
LEV
EL
In the case of 2 shifts and the possibility to access the SAGR, both the financial and the economic NPV would be positive until the price of husk exceeds about US$ 38/tonne (Figure 3.46).
FIGURE 3.45. Financial and economic NPV for the 1-shift and 2-shifts scenarios according to rice husk price.
Source: Authors.
150
100
50
0 5 10 15 20 25 30 35 40 45 500
–50
–100
–150
200
Tho
usan
d U
S$
Rice husk price (US$/tonne)
Economic NPV 1 shiftFinancial NPV 1 shift Financial NPV 2 shifts Economic NPV 2 shifts
–200
–250
FIGURE 3.46. Financial and economic NPV for the 2-shifts scenario with SAGR according to rice husk price.
Source: Authors.
300
250
200
5 10 15 20 25 30 35 40 45 50
150
100
50
0
Tho
usan
d U
S$
Rice husk price (US$/tonne)
years
–50
–100
Financial NPV SAGR Economic NPV SAGR

180 MEASURING IMPACTS AND ENABLING INVESTMENTS IN ENERGY-SMART AGRIFOOD CHAINS
CO
ST-B
ENEF
IT A
NA
LYSI
S A
T T
HE
CO
UN
TRY
LEV
EL
Diesel priceAnother key variable for the costs and benefits of the RHG system is the price of diesel. The price of diesel is very volatile and uncertain, therefore Figure 3.47 shows how financial and economic NPVs would change according to diesel price. Obviously, the higher the diesel price, the higher the NPVs, since the benefits of replacing a diesel-powered mill with a RHG system increase. At the current rice husk price and assuming 1 shift, the financial NPV will be positive just with a diesel price above US$ 1.4/litre. The economic NPV will instead turn positive with a diesel price slightly above US$ 0.7/litre.
Figure 3.48 shows the same sensitivity analysis in the case of a double shift system with SAGR. In this case, both the financial and the economic NPV would be positive at the current diesel price (US$ 0.55/l).
FIGURE 3.47. Financial and economic NPV for the 1-shift scenario according to diesel price.
Source: Authors.
150
100
50
0.5 0.6 0.7 0.8 0.9 1 1.1 1.2 1.3 1.4 1.5 1.6 1.7 1.8 1.9 20
–50
–100
Tho
usan
d U
S$
Diesel price (US$/l)
Financial NPV 1 shift Economic NPV 1 shift

181MEASURING IMPACTS AND ENABLING INVESTMENTS IN ENERGY-SMART AGRIFOOD CHAINS
CO
ST-B
ENEF
IT A
NA
LYSI
S A
T T
HE
CO
UN
TRY
LEV
EL
RESULTSBy considering the estimated potential for RHG in the Philippines of 75, Figure 3.49 shows the estimated financial and economic returns of RHG at national level over 10 years, for the scenarios assumed. The main economic benefits come from increasing GHG emission reduction and employment creation.
From a financial point of view the investment looks negative unless there is a very low rice husk price or a quite high diesel cost. In the case of a single shift, the financial NPV could be positive (at the current rice husk price) only if the diesel price exceeds US$ 1.4/litre. Instead, the economic NPV would turn positive with a rice husk price lower than about US$ 22/tonne or a diesel price above US$ 0.7/litre.
In the scenario assuming two 8-hour shifts, the estimated financial returns of RHG at national level over 10 years would be positive if the rice husk price did not exceed US$ 7/tonne. The economic NPV is positive if the price of husk does not go above US$ 37/tonne.
If the powering unit can sell excess electricity at a SAGR, the financial NPV would be positive unless the rice husk price exceeds about US$ 40/tonne. The economic NPV in case of a SAGR is equal to the economic NPV without SAGR, since the SAGR is a benefit for the investor, but a cost for the government.
Additional non-monetized benefits occur in terms of fertilizer use and reduced fossil fuel consumption.
FIGURE 3.48. Financial and economic NPV for the 2-shifts scenario with SAGR scenario according to diesel price.
Source: Authors.
Diesel price (US$/l)
150
200
0.4 0.5 0.6 0.7 0.8 0.9 1.0
100
50
0
250
Tho
usan
d U
S$
Financial NPV SAGR Economic NPV SAGR

182 MEASURING IMPACTS AND ENABLING INVESTMENTS IN ENERGY-SMART AGRIFOOD CHAINS
CO
ST-B
ENEF
IT A
NA
LYSI
S A
T T
HE
CO
UN
TRY
LEV
EL
Data sources
Figure 3.50 illustrates the information needed for estimating the technical potential of the technology, and Table 3.73 summarizes from which international source data could be obtained and, if not available, which source was used instead for the techno-economic analysis.
FIGURE 3.49. Cumulative economic costs and benefits of rice husk gasification in the Philippines at national level after 10 years (75 systems).
0
–5
5
–10
10
15
20
–15
–20
Mill
ion
US$
US$ 4.2 million For 75 systems
INITIAL INVESTMENT OVER 10 YEARS
FINANCIAL IRR
%
ECONOMIC NPV
Million US$
FINANCIAL NPV
Million US$
0% 24% 25%
–6.5 –7.7 8.6
–1.1 3.0 3.2
1 Shift(8h/day)
2 Shifts(16h/day)
2 Shiftswith SAGR
Financial net bene�ts
GHG emissions
Subsidies and taxes
Employment
Fertilizer use
Fossil fuel consumption150,000TJ/year
–6.5
1.3
4.0
–7.7
8.1
2.7
–16.1
8.6
8.1
2.7
Note: The sum of the financial NPV and the economic co-benefits and costs is the economic NPV.
Colour code for non-monetized impacts: Positive impact Variable impact Negative impact
Source: Authors.

183MEASURING IMPACTS AND ENABLING INVESTMENTS IN ENERGY-SMART AGRIFOOD CHAINS
CO
ST-B
ENEF
IT A
NA
LYSI
S A
T T
HE
CO
UN
TRY
LEV
EL
FIGURE 3.50. Input data for the assessment of the technology potential of rice husk gasification in the Philippines.
Note: Blue boxes represent country-related primary input data, green boxes are calculated data
and the grey box represents the result.
Source: Authors.
Percentage of farmes who could benefit
from an intermediate milk cooling step
Mean annual palay production
Mean annual palay production in off- grid areas
Percentage of rice husks by weight of
palay
Rice husks production in off-grid areas
per year
Rice husks recoverabilitiy factor
Energy potential of rise husks
Electricity generation potential from rice husks in off-grid areas
Typical size of rice husks
gasification plant
Rice husk gasification
plants technical potential
TABLE 3.73. Data sources for the CBA of rice husks gasification in the Philippines.
Data Input International source with consistent country or global coverage
Source used
Mean annual palay production CountrySTAT (http://www.countrystat.org/) for regional-level data OR FAOSTAT (http://faostat3.fao.org/download/Q/QC/E) for national-level data
CountrySTAT (http://www.countrystat.org/)
Distribution of the grid or Access to electricity
World Bank, 2016b Literature (for distribution of the grid)
Percentage of rice husks by weight of palay – Literature
Rice husks recoverability factor – Literature
Energy potential of rice husks – Literature
Typical size of rice husks gasification plant – Expert opinion
Duty on technology import – Government data and literature
Prices of husk and paddy rice along the value chain
– Government data and literature
Labour costs ILO, 2017 Literature
Fuel costs – Government data and literature
Average SAGR – Government data and literature
GHG emission factor IPCC, 2006 IPCC, 2006
Note: Shaded rows represent country-related primary input data.
Source: Authors.

184 MEASURING IMPACTS AND ENABLING INVESTMENTS IN ENERGY-SMART AGRIFOOD CHAINS
CO
ST-B
ENEF
IT A
NA
LYSI
S A
T T
HE
CO
UN
TRY
LEV
EL
Barriers to technology adoption
Potential barriers and risks to the adoption of RHG in the Philippines are summarized in Table 3.74. Apart from the financial difficulties discussed above (which are highly dependent on the utilization factor of the equipment), the adoption of RHG systems highly depends on local regulation relative to the environmental limit on the rice husk disposal (e.g. the ban to burn the husk in open fires) and the biochar market price (e.g. duties on biochar export can be an important barrier) (B. Tadeo, personal communication, 2016).
From a technical point of view, finding the required skilled workers to clean and maintain the systems may be difficult in rural areas, and especially in small Philippine islands.
Due to lack of evidence and experience it is sometimes difficult to get the appropriate plant size for gasification, and improved awareness to properly assess the technology potential is needed. The availability of the feedstock all year round is a concern for large plants which can significantly increase risks associated with the investment.
Since the viability of this technology is heavily dependent on market price of husks, of biochar, and the local energy cost, the lack of insurances and risk hedging on assured production of electricity (risk sharing scheme) is an important barrier which contributes to limiting the adoption of RHG systems.
According to the information collected during the missions in the Philippines (August and December 2016), RHG systems are hardly competitive with combustion for large-scale power plants feeding into the national grids. The technology is particularly interesting for smaller-scale applications, such as on-farm or rural applications, or for powering mini grids (50 to 150 kW power capacity).
In this report only ‘dry gasification’ (a technology with a dry gas cleaning system, in which cooling water is not directly exposed to the producer gas and as such can be recycled after cooling and neutralization) was considered, while ‘wet gasification’, a less sustainable option, which has major environmental impacts95, was not considered. In case of wet gasification, a relevant issue is tar disposal, odour and the need for appropriate wastewater treatment, which often make this option non-viable from an economic point of view. Even though the system considered provides a discharge system to separate the dry biochar from tar and other liquid by-products, the lack of incentive for millers to invest in and use this system leads to the fact that the mixed waste can be simply deposited in surrounding waterways, resulting in highly unpleasant and potentially hazardous chemical and odorous pollution. This can severely affect the water quality of the recipient water body in terms of changes in pollutants loadings.
The lack of appropriate storage practices for rice husk is an important barrier for this technology. In fact, sometimes millers store husks at moisture concentrations higher than 11–12% in order to have the necessary buffers for operating an RHG plant on a
95 In the Philippines, a 600 KW wet gasification plant for rice husk can consume as much as 1,000 m3 per week if operated continuously with a wet scrubbing system.

185MEASURING IMPACTS AND ENABLING INVESTMENTS IN ENERGY-SMART AGRIFOOD CHAINS
CO
ST-B
ENEF
IT A
NA
LYSI
S A
T T
HE
CO
UN
TRY
LEV
EL
regular basis. At such moisture concentrations, the husk starts fermenting, which results in a loss of calorific power and feedstock quality.
Finally, in case of on-grid systems, there is no possibility to sell electricity to the grid on small islands if an adequate grid is not available. Moreover, the administrative procedure to be eligible for a FiT or SAGR may be too costly and complicated for small electricity producers.
TABLE 3.74. Key barriers to the adoption of rice husk gasification in the Philippines.
Knowledge and information
Organization/ social
Regulations/ Institutions
Support services/ structures
Financial returns Access/cost of capital
Lack of awareness of the technology potential
Lack of know-how on biochar as soil amendment
Lack of appropriate storage practices for husks
Lack of evidence and experience to appropriately size RHG
Lack of risk sharing scheme
In case of wet gasification, the disposal and odour of the tar is a major problem
Environmental regulation on waste influences rice husk disposal
Duties on biochar export (e.g. to Japan) are high
Access to FiT may be too costly and complicated for small electricity producers
Lack of skilled workers and of support services for RHG in rural areas and especially on small islands
In case of low diesel price, the RHG system does not pay back
Competitive uses of rice husks bring up the market price making RHG non-viable
Feedstock price volatility
No incentive in investing in tar and liquid by-products treatment systems
Credit market failures
Upfront investment cost is high
Source: Authors.
SOLAR-POWERED DOMESTIC RICE PROCESSING
Technology potential
For the estimate of the technical potential of the technology, it is assumed that it can be successfully introduced among the small rice producers in off-grid areas of the Philippines. The off-grid provinces are already reported in Table 3.68, however, some of these provinces are still relevant rice producers both in terms of palay production (more than 150,000 tonnes/year) and in terms of concentration of rice farmers. In these provinces, solar-powered domestic rice processing may be less relevant since rice production is more concentrated, therefore cheap and/or efficient medium-size mills can be available. For these reasons, the off-grid provinces considered for the assessment of the potential of solar-powered domestic rice processing are the smallest ones in terms of rice production and population: Romblon, Surigao del Norte, Basilan, Sulu, Tawi-tawi, Batanes and Catanduanes.
In order to estimate how many solar-powered domestic rice processing systems can be potentially used in these provinces, a ‘typical’ PV mill has been considered and its technical performance is summarized in Table 3.75 (this is the same technology assessed in the PV rice processing case study in FAO and GIZ, 2018).

186 MEASURING IMPACTS AND ENABLING INVESTMENTS IN ENERGY-SMART AGRIFOOD CHAINS
CO
ST-B
ENEF
IT A
NA
LYSI
S A
T T
HE
CO
UN
TRY
LEV
EL
Rice is a staple food in many countries, making it one of the leading food crops in the world. © GIZ/Joerg Boethling
TABLE 3.75. Sample technology data of solar-powered domestic rice processing systems.
Sample solar-powered domestic rice processing systems
Max capacity [kg/day] 120
Days can work per year 293
Rice milled per year [tonne] 35.2
Percentage of husk by rice weight [%] 20 (GIZ, 2015)
Palay milled per year [tonne] 42.2
Source: FAO and GIZ, 2018
Over the smallest off-grid provinces of the Philippines, the average palay production and yield of the last three available years in FAOSTAT (2013–2015) have been considered in order to include fluctuations due to natural conditions such as climate impact on harvests. The resulting technical potential of solar-powered domestic rice processing systems is summarized in Table 3.76.

187MEASURING IMPACTS AND ENABLING INVESTMENTS IN ENERGY-SMART AGRIFOOD CHAINS
CO
ST-B
ENEF
IT A
NA
LYSI
S A
T T
HE
CO
UN
TRY
LEV
EL
TABLE 3.76. Technical potential of solar-powered domestic rice processing technology in off-grid areas of the Philippines.
Item Value
Average annual palay production in the smallest areas off-grid (thousand tonnes)
153
Average annual yield in off-grid smallest areas (tonnes/ha) 2.36
Potential installable solar-powered domestic rice processing systems in off-grid Philippines
3,630
Source: Authors.
Taking into consideration the average area of a farm holding in the Philippines (PSA, 2015) and the mean palay yield in off-grid areas (CountrySTAT, 2016), it is possible to estimate the mean palay production of an off-grid farm holding per year and, consequently, the number of farm holdings that a solar-powered domestic rice processing system could serve. The results are shown in Table 3.77.
TABLE 3.77. Number of farm holdings served by one solar-powered domestic rice processing system in off-grid areas of the Philippines.
Item Value
Average area of farm holdings (ha) 1.29
Mean palay yield (tonne/ha*year) 2.36
Mean palay production of a farm holding (tonnes/year) 3.05
Farm holdings provided by one PV mill 14
Source: Authors.
Cost-benefit analysis
FINANCIAL CBAAn average community in off-grid islands would produce around 40–45 tonnes of paddy per year. In order to hull and polish this quantity, the solar-powered domestic rice processing system would require about 1,700–1,800 hours per year, working maximal 6 hours per day. A PV mill of this kind has a milling recovery of 65% and produces 5% waste. Therefore, on average a solar-powered domestic rice processing system in off-grid islands in the Philippines can produce 30–35 tonnes of milled white rice with 35% broken.
The benchmark option for rice farmers in this context is to mill their rice with a diesel rice mill of 200 kg/hour capacity, usually located in bigger towns. Sometimes the rice has to be shipped to reach the nearest mill, with high transportation costs. To mill 40–45 tonnes of rice, a small 2–3 kW diesel rice mill (100 kg/hour) would require about 350 hours and consume around 400–450 litres of fuel per year, costing around US$ 200–250 per year96. In these areas, farmers would pay a service fee of around US$ 0.03/kg to a conventional diesel mill (PIDS, 2015). A transport cost to the diesel mill of US$ 1 (round trip) is assumed. For the benchmark, it is assumed that the milling
96 As mentioned above, diesel price in the Philippines varied between 0.47 and US$ 0.60/litre in 2016.

188 MEASURING IMPACTS AND ENABLING INVESTMENTS IN ENERGY-SMART AGRIFOOD CHAINS
CO
ST-B
ENEF
IT A
NA
LYSI
S A
T T
HE
CO
UN
TRY
LEV
EL
recovery in a conventional diesel mill is 60% and waste is 10% of the total (PIDS, 2015). Therefore, the farmers get about 30 tonnes of white rice per year with 40% broken grains.
A discount rate of 8% is applied for the financial CBA97. Other important parameters are the real daily wages for rice workers in the Philippines, which is about US$ 5 (ODI, 2014). The rice producer price is PHP 17/kg (US$ 0.38/kg), well-milled rice is PHP 30/kg (US$ 0.67/kg), and regular-milled rice PHP 25/kg (US $0.56/kg) (NFA data).
Under these assumptions, the financial NPV of a solar-powered domestic rice processing system in the Philippines is about US$ 2 510, with an IRR of 16%.
ECONOMIC CBA
Value added along the value chainBy decreasing the quantity of wasted and broken rice during the milling process, the solar-powered domestic rice processing systems would increase the value added through the value chain. Every year, about 1.7 tonnes of rice can be saved by using a PSS98 solar-powered domestic rice processing system. The approximate price at the paddy, wholesale and retail levels are shown in Table 3.78. The producer gets the highest margin (as a share of the retail price), ranging from 40 to 45%. This paddy to wholesale margin covers processing cost and quantity adjustment for milled rice recovery as well as assembly cost from paddy farmers to millers (PIDS, 2015). A quarter of the value added takes place after the milling, therefore saving 1.7 tonnes of rice every year adds to the value chain approximately US$ 250–300 per year per each solar-powered domestic rice processing system.
TABLE 3.78. Approximate price at the paddy, wholesale and retail levels.
Average price in PHP/kg
Average price in US$/kg
% Margin
Producer 17 0.38 43% 43%
Paddy trader 20 0.44 50% 8%
Miller/wholesaler 30 0.67 75% 25%
Transport 32 0.71 80% 5%
Retail 40 0.89 100% 20%
Sources: PIDS, 2015; World Bank, 2016e.
Subsidies and taxesThere are no public subsidies for the oil and electricity sectors in the Philippines and no import duties on renewable energy equipment, therefore no transfer payments (taxes or subsidies) are accounted for this analysis.
97 The Philippines 10-year bond rate is about 4% and a World Bank project in Renewable Energy and Energy efficiency assumed a discount rate of 10% (World Bank, 2016d).
98 PSS is the producer of the solar-powered mill analysed in this case study.

189MEASURING IMPACTS AND ENABLING INVESTMENTS IN ENERGY-SMART AGRIFOOD CHAINS
CO
ST-B
ENEF
IT A
NA
LYSI
S A
T T
HE
CO
UN
TRY
LEV
EL
Assessment of environmental and socio-economic impacts at national level
TABLE 3.79. Environmental and socio-economic impacts associated with the technical potential of solar-powered domestic rice processing in the Philippines (3,630 systems).
Impact Indicator Description Impact indicator
Monetized impact
Fertilizer use No impact.
Water use and efficiency
The technology has no direct impact on water use and efficiency. An indirect impact on water is linked to the avoided waste during processing. Therefore, a saving of about 5% of water used to grow rice can be achieved. According to Chapagain and Hoekstra (2010), in the Philippines the blue and green water footprint of rice is 0.0013 million m3/tonne of rice. Therefore, saving 1.7 tonnes of rice per year can reduce wastewater of about 2.14 million litres/year per mill. At national level, this is equal to about 7,763 million litres of water per year.
7,763 million litres/year
–
Food loss reduction
A PSS solar-powered domestic rice processing system uses rubber rollers which reduce grain breakage and losses if compared with conventional diesel mills. With diesel mills, the percentage of broken rice is around 10% of the paddy production, whereas after the intervention this percentage is estimated to be about 5%. This can therefore lead to marginal increases in rice household consumption, benefiting all family members depending on intra-household food allocation, or rice sales in the market. Assuming a production of 42 tonnes/year, the financial analysis incorporated benefits from food loos reduction of US$ 1,125/year per mill (assuming a rice price of US$ 0.67/kg). Moreover, the avoided losses allow to add value down the value chain.
6,127 tonnes/year
US$ 4 million/year (considered in financial CBA)
Land requirement
Negligible impact. – –
GHG emissions In the financial analysis, the PV domestic rice processing system avoided the consumption of about 400–450 litres of diesel per year. Since combustion of a litre of diesel fuel emits approximately 3.16 kg of CO2eq, the benefit of a solar mill amounts to about 1.3 tonnes CO2eq per year. At national level, this is equal to about 5,000 tonnes CO2eq per year. The avoided GHG emissions can be monetized and included as benefits in the economic CBA. As in the previous cases, a SCC of US$ 36/tonne (increasing of 2.3% each year) is assumed. The monetized benefit due to GHG emission reduction is thus about US$ 0.17 million/year.
5,000 tonnes CO2eq/year
US$ 0.17 million/year
Health risk due to indoor air pollution
No impact. – –
Fossil fuel consumption
Each PV solar-powered domestic rice processing system avoided the consumption of about 400–450 litres of diesel per year (15,000–18,000 MJ/year). At national level, this equals to about 57–64 million MJ of diesel per year or 244 million MJ of oil on average.
244 million MJ oil/year
–

190 MEASURING IMPACTS AND ENABLING INVESTMENTS IN ENERGY-SMART AGRIFOOD CHAINS
CO
ST-B
ENEF
IT A
NA
LYSI
S A
T T
HE
CO
UN
TRY
LEV
EL
Access to energy A PV system for rice mills is designed to power small appliances, thus improving access to electricity in off-grid areas. Since each solar-powered domestic rice processing system can serve about 14 households, at national level about 50,000 households can improve their access to energy. Assuming on average 4.4 people per household (PSA, 2015), about 224,000 people can be affected at national level.PSS estimated that in Papua New Guinea the ability to power small appliances such as phone batteries and small electric appliances can provide a value of US$ 2 per day, or US$ 600 per year for farmers in off-grid villages, if fully exploited. We assume here that in the Philippines not all the households will benefit from these increase access to energy, since some could already have an alternative reliable source of energy. Therefore, we estimate a benefit of US$ 300/year for each system adopted. At national level, this is equal to US$ 1 million per year. In small off-grid villages, women from poor male-headed and female-headed households mill rice manually or travel significant distances to pay for mechanized diesel-powered milling services. With support from local extension services in these villages, solar powered rice mills have the potential to provide poor farming households with accessible and affordable access to modern energy services, for milling as well as for charging or running small electrical appliances. The extent to which this occurs depends on who owns the technology and how the service is run. For example, the tariffs to access the energy services would need to be set at a level or be adaptable to ensure full cost recovery as well as access by poor women. Rice cooperatives (women-only or mixed) that own, manage and operate village-based solar milling services could ensure that their members have reliable access.
224,000 people
US$ 1 million/year
Household income
Since each solar-powered domestic rice processing system can serve about 14 households, at national level about 224,000 people (4.4 per household) could benefit from the above-mentioned access to electricity and increased revenues due to reduced food loss. These benefits are already accounted for in the financials and in the access to energy co-benefit. Men and women farmers stand to benefit from increased income from food loss reduction after switching from diesel-powered mills. The switch from manual to solar-powered rice milling increases the productivity of processing tasks performed by women who could then sell more rice and generate a higher income.Rice cooperatives (women-only or mixed) that own, manage and operate village-based solar milling services could generate additional small incomes. When women are able to generate higher incomes, they are economically empowered and have more influence in decision-making at home (in male-headed households), in groups and in the community. There is a risk that local businessmen might take over village-based solar rice milling services from small rice cooperatives if they prove highly profitable.
224,000 people
(already monetized as financial and access to energy benefits)

191MEASURING IMPACTS AND ENABLING INVESTMENTS IN ENERGY-SMART AGRIFOOD CHAINS
CO
ST-B
ENEF
IT A
NA
LYSI
S A
T T
HE
CO
UN
TRY
LEV
EL
Time saving Compared to large diesel mills, PSS solar solar-powered domestic rice processing systems require more time to process the same quantity of rice. However, the possibility of installing solar mills in smaller villages can significantly reduce the time spent by mainly women and, to a lesser extent, men in transport to and from the next mill, as accounted for in the financial CBA. Solar mills can also save significant amounts of women’s time otherwise spent on manually milling rice. Overall, considering the benchmark scenario, the transport time avoided is partly offset by the additional time spent milling at the solar mill. Therefore, no relevant change in time saving is accounted for due to the energy intervention.
– –
Employment The introduction of the solar-powered mills does not create direct employment since the system is typically owner-operated and does not require the presence of technical agents. Around 3 new skilled jobs are needed to train 100 solar-powered domestic rice processors, with decreasing returns to scale. For large scale deployment of the technology we can assume that around 3 skilled jobs are needed for training and maintenance of 100 units installed. In terms of salary, the value of the created jobs would be around US$ 0.8 million per year (at 0.64 US$/hour). A higher proportion of men are engaged in non-farm employment. It is more likely that the jobs generated here would be held by men, unless a gender quota is proposed and adhered to when possible.
3 new skilled jobs every 100 systems installed or 109 jobs in total
US$ 0.8 million/year
Colour code:
Positive impact Variable impact Negative impact No or negligible impact
Source: Authors.
PROFITABILITYTable 3.80 summarizes the financial and economic CBA of one solar-powered domestic rice processing system in the Philippines, assuming as a benchmark a diesel mill. The main monetized environmental and social benefits are in terms of GHG emission reduction, access to energy and employment. Due to the reduction in food losses, the value added along the value chain is very positive. Overall the economic NPV is close to US$ 11,000, with a 37% economic IRR.
TABLE 3.80. Financial and economic CBA of solar-powered domestic rice processing systems in the Philippines.
Item Unit Value (single intervention)
Value (at scale)
Notes
COSTS
Installation costs Thousand US$
4.8 17,607 FAO and GIZ, 2018
Replacement costs Thousand US$/year
0.4 1,495 US$ 3,830 every 5–10 years (for rice huller and polisher) US$ 300 every 3 years for battery (FAO and GIZ, 2018).
Maintenance costs Thousand US$/year
0.03 115 Cleaning the sieve and maintaining system (1 h/week).

192 MEASURING IMPACTS AND ENABLING INVESTMENTS IN ENERGY-SMART AGRIFOOD CHAINS
CO
ST-B
ENEF
IT A
NA
LYSI
S A
T T
HE
CO
UN
TRY
LEV
EL
Processing costs Thousand US$/year
–0.7 –2,410
Processing tariff Thousand US$/year
–1.3 –4,595 Assuming as a benchmark a diesel mill with a service fee of US$ 0.03/kg.
Labour cost Thousand US$/year
0.9 3,249 Wage in the Philippines: US$ 0.6/hour (ODI, 2014).
Transport cost Thousand US$/year
–0.3 –1,064 Assuming US$1 per travel to reach the diesel mill.
BENEFITS
Revenues from rice sale
Thousand US$/year
1.1 4,085 Assumption: 5% reduction in broken rice (FAO and GIZ, 2018).
Value added along the value chain
Thousand US$/year
0.28 1,021 Assuming a rice price of US$ 0.67/kg and an average margin of 25%.
GHG emissions Thousand US$/year
0.05 174 Assuming 420 litres diesel are avoided. Combustion of 3.16 kg of CO2eq/litre of diesel. SCC of US$ 36/tonne of CO2eq.
Access to energy Thousand US$/year
0.30 1,089 Assuming a benefit of US$ 300/year for each system by using the system to power small appliances.
Employment Thousand US$/year
0.22 817 FAO and GIZ, 2018
PROFITABILITY INDICATORS
Financial NPV Thousand US$
2.5 9,113
Financial IRR % 16%
Economic NPV Thousand US$
11 39,887
Economic IRR % 37%
Note: Life expectancy of the technology is 20 years. Discount rate is 8%. Financial costs and benefits are in orange. Economic (non-financial) costs and benefits are in green.
Source: Authors.

193MEASURING IMPACTS AND ENABLING INVESTMENTS IN ENERGY-SMART AGRIFOOD CHAINS
CO
ST-B
ENEF
IT A
NA
LYSI
S A
T T
HE
CO
UN
TRY
LEV
EL
RESULTSThe financial NPV of the investment turns positive after 9 years (Figure 3.51). Figure 3.52 shows the financial and economic returns of PV mills at national level over 20 years. The main economic benefits are due to increased household access to energy. However, this co-benefit can materialize just in specific contexts, which is only where there is a need for powering small appliances close to the location where the mill is installed, and where there is somebody willing to provide this service, hence diversifying the business. At any rate, the investment looks positive even without this co-benefit, due to the creation of employment, the value added along the rice value chain and the GHG emission reduction.
FIGURE 3.51. Financial and economic cumulative discounted costs and benefits over 20 years of a solar-powered domestic rice processing unit in the Philippines.
Note: Additional non-monetized impacts on water use and efficiency, time saving and fossil fuel consumption occur (Table 3.80).
Source: Authors.
Financial net benefits
Subsidies and taxes Value added along the VCGHG emissions
Tho
usan
d U
S$
Employment
0 1 2 3 4 5 6 7 8 9 10 11 12 13 14 15 16 17 18 19 20 years
Access to energy
– 4
– 6
0
2
4
6
8
10
12
– 2

194 MEASURING IMPACTS AND ENABLING INVESTMENTS IN ENERGY-SMART AGRIFOOD CHAINS
CO
ST-B
ENEF
IT A
NA
LYSI
S A
T T
HE
CO
UN
TRY
LEV
EL
FIGURE 3.52. Cumulative economic costs and benefits of solar-powered domestic rice processing in the Philippines at national level after 20 years (3,630 systems).
Mill
ion
US$
15
10
20
5
0
25
30
35
408.02
10.69
2.04
10.03
–9.11
US$ 17.6 millionFor 3,600 systems
INITIAL INVESTMENTOVER 20 YEARS
US$ 39.9 millionECONOMIC NPV
FINANCIAL IRR
16%
US$ 9.1 millionFINANCIAL NPV
Water use and ef�ciency
Time saving
Financial net bene�ts
GHG emissions
Employment
Access to energy
Value added along the VC
244,000GJ/year Fossil fuel consumption
7,763million l/year
Note: The sum of the financial NPV and the economic co-benefits and costs is the economic NPV.
Colour code for non-monetized impacts: Positive impact Variable impact Negative impact
Source: Authors.
Data sources
Figure 3.53 illustrates the information needed for estimating the technical potential of the technology, and Table 3.81 summarizes from which international source data could be obtained and, if not available, which source was used instead for the techno-economic analysis.

195MEASURING IMPACTS AND ENABLING INVESTMENTS IN ENERGY-SMART AGRIFOOD CHAINS
CO
ST-B
ENEF
IT A
NA
LYSI
S A
T T
HE
CO
UN
TRY
LEV
EL
FIGURE 3.53. Input data for the assessment of the technology potential of solar-powered domestic rice processing technology in the Philippines.
Note: Blue boxes represent country-related primary input data, green boxes are calculated data
and the grey box represents the result.
Source: Authors.
Grid Distribution
Mean annual palay production
Mean annual palay production in off- grid areas
Palay milled capacity of
solar-powered mill per year
Percentage of rice husks by weight of
palay
Rice milling capacity of
solar-powered mill per year
Solar-powered domestic rice
processing technical potential
TABLE 3.81. Data sources for the CBA of solar-powered domestic rice processing in the Philippines.
Data input International/national public database Source used
Mean annual palay production CountrySTAT (http://www.countrystat.org/) for regional-level data OR FAOSTAT (http://faostat3.fao.org/download/Q/QC/E) for national-level data
CountrySTAT (http://www.countrystat.org/) –
Distribution of the grid or access to electricity
World Bank, 2016b Literature (for distribution of the grid)
Rice milling capacity of solar-powered mill per year
– Expert opinion
Percentage of rice husks by weight of palay
– Literature
Duty on technology import – Government data and literature
Prices of rice along the value chain – Government data and literature
Labour costs ILO, 2017 Literature
GHG emission factor IPCC, 2006 IPCC, 2006
Access to energy (value of powering small appliances)
– Literature
Note: Shaded rows represent country-related primary input data.
Source: Authors.

196 MEASURING IMPACTS AND ENABLING INVESTMENTS IN ENERGY-SMART AGRIFOOD CHAINS
CO
ST-B
ENEF
IT A
NA
LYSI
S A
T T
HE
CO
UN
TRY
LEV
EL
Barriers to technology adoption
Potential barriers and risks to the adoption of solar-powered domestic rice processing in the Philippines are summarized in Table 3.82.
Although micro mills powered by a conventional engine have been promoted and developed in the Philippines since the 1990s, with the purpose of being used by remote farmers mostly for milling their own produce for home consumption, small-scale PV rice processing technologies are currently not a well-known technology, and rice processors are often not aware of this option.
The Government of the Philippines is developing community-based programmes for promoting solar systems for household electrification and collective use of electricity (such as PV irrigation pumps or solar cold storage facilities for fisheries), in particular in off-grid rural areas (DOE, personal communication, 201699). However, there is no specific regulations for incentivizing PV rice processing or incentive schemes for the development of agriculture and food processing sectors.
Small-scale PV systems are normally adopted in remote islands. The efficiency and coverage of supplier networks and maintenance companies can be an issue for the uptake of the technology. In off-grid areas, rural electrification cooperatives are responsible for supervising the installation of PV systems and monitoring against misuse.
The initial investment needed to buy the solar mill on the market, although relatively small, can hardly be borne by small rice producers or processors, and appropriate financing and access to credit schemes for smallholders are lacking (sometimes small farmers do not mill their rice and sell it whole in exchange for loans). In particular, access to credit is a problem for farmers who do not own their land, since they cannot use land as collateral for loans and hence often do not obtain credit.
Finally, the adoption of PV rice processing technologies at the level of community requires collective actions since such energy intervention (and the related investment) should be undertaken by groups of farmers. This can be a barrier in case of lack of social capital and mistrust among households.
99 See note 92.

197MEASURING IMPACTS AND ENABLING INVESTMENTS IN ENERGY-SMART AGRIFOOD CHAINS
CO
ST-B
ENEF
IT A
NA
LYSI
S A
T T
HE
CO
UN
TRY
LEV
EL
TABLE 3.82. Key barriers to the adoption of solar-powered domestic rice processing in the Philippines.
Knowledge and information
Organization/ social
Regulations/ Institutions
Support services/ structures
Financial returns Access/ cost of capital
Lack of awareness of the technology (costs and benefits)
Collective action needed for technology to take off (e.g. through farmer associations)
Lack of specific regulations or incentive schemes for PV rice processing technologies and other clean technologies in the food sector
Low efficiency and coverage of supplier networks
Low efficiency and coverage of maintenance companies
– Credit market failures to farmers or cooperatives
Lack of financing schemes for small-scale rice producers/processors, especially landless farmers
Source: Authors.


CO
ST-B
ENEF
IT A
NA
LYSI
S A
T T
HE
CO
UN
TRY
LEV
EL
199MEASURING IMPACTS AND ENABLING INVESTMENTS IN ENERGY-SMART AGRIFOOD CHAINS
INST
RU
MEN
TS
TO
OV
ERC
OM
E B
AR
RIE
RS
AN
D D
ELIV
ERY
MO
DEL
S
4. INSTRUMENTS TO OVERCOME BARRIERS AND DELIVERY MODELS
Based on the analyses undertaken for the four case study countries (Chapter 3), this chapter outlines the main barriers, options and measures to deploying clean energy technologies in agrifood value chains. The aims are to provide an understanding of the nature of the individual barriers, identify which barriers are the most critical, and suggest measures to overcome them. For example, limited access to support services for project financing, plant installation, maintenance, etc. could be perceived as a major barrier to the national deployment of a technology.
If a government, financier, or international investor wishes to overcome a barrier and achieve greater uptake by introducing appropriate measures, this could result in gaining economic returns, such as from increased tax revenue, import duties, greater sales of the technology and added value along the supply chain. The measures would need to be an incentive for stimulating a higher rate of adoption and deployment.
This chapter also seeks to identify whether each barrier has a specific impact on certain potential adopters (including gender groups) relative to others. For example, credit constraints may discourage investors along the food supply chain, but other stakeholders may seek to adopt clean energy technologies regardless of lack of credit, if aiming to significantly reduce GHG emissions.
Lack of access to finance is a crucial barrier identified in all case studies. Often the land of rural smallholder farmers is collectively owned so a farmer does not have private ownership that could be used as collateral. Micro-finance institutions (MFIs) can help farmers acquire assets that can then serve as collateral, such as taking out insurance cover on their animals. MFIs can also link farmers to veterinary and medical services and can capitalize the costs of insurance and services into loans. They often have clients in self-help groups (typically with 10 to 15 members) where the members are willing to undertake guarantees for each other for mutual assistance. MFIs usually use a loan guarantee fund to receive a loan, and charge an interest which can go above 20% in countries like Kenya. Only less than 5% of clients do not need co-guarantees, mainly value chain agents.
Suggestions for innovative policies, business models100, instruments and drivers for de ploy ment of clean-energy technologies analysed in this study are offered in Section 4.3.
100 A business model is the way in which a company structures its resources, partnerships and customer relationships in order to create and capture value. In other words, it is what enables a company to make money. The degree of inclusiveness is measured by how ownership, voice, risk and reward are shared between the business partners.

© GIZ / Sumi Teufel
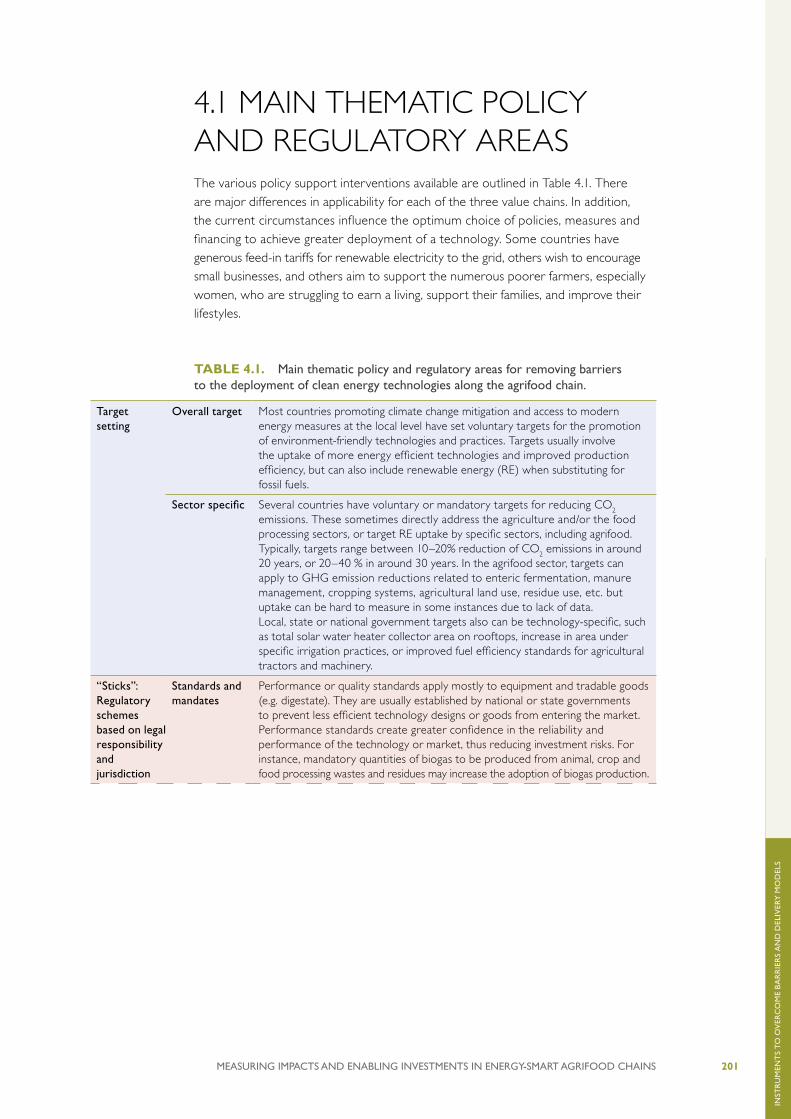
CO
ST-B
ENEF
IT A
NA
LYSI
S A
T T
HE
CO
UN
TRY
LEV
EL
201MEASURING IMPACTS AND ENABLING INVESTMENTS IN ENERGY-SMART AGRIFOOD CHAINS
INST
RU
MEN
TS
TO
OV
ERC
OM
E B
AR
RIE
RS
AN
D D
ELIV
ERY
MO
DEL
S
4.1 MAIN THEMATIC POLICY AND REGULATORY AREASThe various policy support interventions available are outlined in Table 4.1. There are major differences in applicability for each of the three value chains. In addition, the current circumstances influence the optimum choice of policies, measures and financing to achieve greater deployment of a technology. Some countries have generous feed-in tariffs for renewable electricity to the grid, others wish to encourage small businesses, and others aim to support the numerous poorer farmers, especially women, who are struggling to earn a living, support their families, and improve their lifestyles.
TABLE 4.1. Main thematic policy and regulatory areas for removing barriers to the deployment of clean energy technologies along the agrifood chain.
Target setting
Overall target Most countries promoting climate change mitigation and access to modern energy measures at the local level have set voluntary targets for the promotion of environment-friendly technologies and practices. Targets usually involve the uptake of more energy efficient technologies and improved production efficiency, but can also include renewable energy (RE) when substituting for fossil fuels.
Sector specific Several countries have voluntary or mandatory targets for reducing CO2 emissions. These sometimes directly address the agriculture and/or the food processing sectors, or target RE uptake by specific sectors, including agrifood. Typically, targets range between 10–20% reduction of CO2 emissions in around 20 years, or 20–40 % in around 30 years. In the agrifood sector, targets can apply to GHG emission reductions related to enteric fermentation, manure management, cropping systems, agricultural land use, residue use, etc. but uptake can be hard to measure in some instances due to lack of data.Local, state or national government targets also can be technology-specific, such as total solar water heater collector area on rooftops, increase in area under specific irrigation practices, or improved fuel efficiency standards for agricultural tractors and machinery.
“Sticks”:Regulatory schemes based on legal responsibility and jurisdiction
Standards and mandates
Performance or quality standards apply mostly to equipment and tradable goods (e.g. digestate). They are usually established by national or state governments to prevent less efficient technology designs or goods from entering the market. Performance standards create greater confidence in the reliability and performance of the technology or market, thus reducing investment risks. For instance, mandatory quantities of biogas to be produced from animal, crop and food processing wastes and residues may increase the adoption of biogas production.

202 MEASURING IMPACTS AND ENABLING INVESTMENTS IN ENERGY-SMART AGRIFOOD CHAINS
INST
RU
MEN
TS
TO
OV
ERC
OM
E B
AR
RIE
RS
AN
D D
ELIV
ERY
MO
DEL
S
Tax impositions
A carbon or clean technology levy has been introduced in some countries by state or national governments. Taxation may be specific to industrial-related technology and practices such as food processing stages (heating, drying, cooling, etc.). Therefore, tax policies may be more appropriate to incentivise changes.
Emissions trading schemes
A number of “cap and trade” schemes exist around the world whereby the emitter of GHGs pays per emitted tonne of CO2eq if emitting above an amount allocated by the government. It is usually a government-mandated, market-based approach with the carbon price per tonne depending on the market and the amount of certificates/credits initially allocated to market actors. Groups of companies have also adopted such a scheme. Those emitters who stay below their cap, as well as land owners who remove CO2 from the atmosphere through certified forest production or improved soil management (under the rules of the UNFCCC101), can sell credits to any emitters who find it is cheaper to buy these credits than to reduce their own emissions.
“Carrots”:Financial incentive schemes
(i) Investment incentives
Capital grants and rebates
While some technological and system interventions have relatively low initial capital requirements, others require significant investments. For instance, solar thermal and geothermal heating installations, and some irrigation systems may be capital intensive but with relatively low running costs.
Capital grants are a straightforward incentive to reduce the up-front investment costs for the purchaser. This is a very common type of support used by central governments as it is relatively easy to administer. Grants or subsidies may be offered either to the owners or developers of the installations, or directly to the manufacturers of the technologies. It is more usual that grants are offered in support of the demand-side market (owners and developers), as grants for selected manufacturers may interfere with competition.
In Kenya, as an example, fiscal incentives include imported irrigation equipment being exempt from customs duties and VAT 102, making it an attractive market opportunity. Other incentives include capital deductions and investment allowances. A new irrigation policy and a large irrigation program have been developed, aimed at the expansion of irrigation in the country. This ambitious programme is in itself an opportunity for irrigation development and provides critical business for irrigation supply and service companies.
Operating grants
Once a new technology/system is adopted, the operating costs affect the payback time of the technology. The policymaker can intervene by providing grants to cover these costs for a period of time. For instance, in the case of electricity generating technologies, these incentives provide cash payments based on the amount of energy generated, typically on a US$/kWh basis for the production of RE, or US$/GJ for heat. Payments based on system performance, rather than on capital investment, place more emphasis on choosing better quality installations. The distributed nature of heat supply at the small- to medium-scale complicates the implementation of operation grants due to a lack of cost-effective metering and monitoring procedures that are often only practical for larger systems. As an example, the French Heat Fund, of around EUR 400 million/year, has supported the operation of around 3,200 RE heating installations since 2009. Funding support is based on the measured production of real heat during the first two years of operation.
Soft loans and loan guarantees
Financial assistance in the form of low- or zero-interest loans over a long term, and/or loan guarantees (see next section 4.2. on financing instruments), effectively lowers the cost of capital. Since high up-front costs are often a deterrent for potential investors, lowering them can effectively bring down the average cost per unit and hence reduce the investment risk. Loans offered at subsidised interest rates (defined as soft loans) may also incorporate long repayment periods and/or payment deferments. This type of incentive is easily implemented by banking institutions that normally provide investment support
101102
101 Under the UN Framework Convention on Climate Change, the rules of the Paris Climate Agreement with respect to land use, land use change and forests, and the trading of emissions between governments, are still being negotiated.
102 For more information see http://www.fao.org/3/a-i5074e.pdf

CO
ST-B
ENEF
IT A
NA
LYSI
S A
T T
HE
CO
UN
TRY
LEV
EL
203MEASURING IMPACTS AND ENABLING INVESTMENTS IN ENERGY-SMART AGRIFOOD CHAINS
INST
RU
MEN
TS
TO
OV
ERC
OM
E B
AR
RIE
RS
AN
D D
ELIV
ERY
MO
DEL
S
to developers. Using the Kenya example, a range of agricultural credit services such as seasonal crop loans, crop establishment loans, fertiliser and seed purchase loans etc. are available from the AFC (Agricultural Finance Cooperation) and equity banks103.
Banks often hesitate to provide loans for technologies/practices that are still developing a market presence, but when they become “bankable”, this may pave the way for project developers to accrue additional funding sponsorship. Very little risk for the administrative body is associated with soft loans and loan guarantees, but they do not necessarily encourage investors to purchase the most reliable systems or maintain them adequately because of lack of knowledge of technology.
(ii) Fiscal Incentives
Tax credits and planning cost reductions
Under the definition of a tax deduction support scheme, investments in new technology/practice represent an ‘expense’ to a taxpayer. Credits or deductions may be a percentage of the total investment or a pre-defined, fixed sum per intervention.
Only parties with an income or property tax can usually benefit, which therefore provides no incentive to potential investors without such tax liabilities (unless they receive a tax credit from the government that then, one year after the expenditure, pays about half of the eligible amount within a fixed limit). Investment tax credits cover either a percentage or the full costs of intervention. These are especially suitable for the initial diffusion of early-market technologies whose costs are relatively high, since they increase the rate of return or decrease the payback period.
Tax reductions and accelerated depreciation
A tax reduction or tax exemption system reduces the amount of tax that must be paid in total, thus reducing the total cost of investment in a project. The incentive option usually has a relatively low burden for administrative and transaction costs, but the overall level of fiscal incentive needs to be carefully established to achieve successful outcomes.
Tax reduction systems could include relief from taxes on sales and property, and exemptions from paying value-added tax on sustainable technologies and practices. External benefits provided to support these interventions could occur in the form of exemptions from eco-taxes and carbon charges, or local energy taxes imposed on conventional fuels.
(iii) Financing incentives
Flexible products
Finance arrangements can be flexible and customised to suit the specific technology and the location of its deployment. A number of financial products can incentivise greater investment in clean energy technologies along the value chain. Options include: • initial equipment renting-to-ownership models;• contract farming where the farmer clients produce according to strict
guidelines on planting dates, crop management etc. by the processing company that then purchases the raw product from them for processing (such as fresh peas destined for freezing);
• farmer co-operatives where a processing plant (cheese producer or fruit packing shed) is owned by a group of producer shareholders who can then attract finance since there is less risk than when financing an individual;
• insurance and medical services for farmers and processors being included in the loan; and
• loan repayments for seasonal horticultural production being customized to be repaid after the time of harvest.
“Guidance”Knowledge and education schemes
Information and promotion
A lack of information regarding resource availability, technology development and potential, and product availability may inhibit investment in applications simply due to a lack of awareness. Education should aim to promote clean energy technologies and practices by enhancing the general awareness of the general public, specific stakeholders, or private businesses by undertaking information campaigns and promotional activities, such as project demonstrations.
103
103 For more information see table 8, http://www.fao.org/3/a-i5074e.pdf

204 MEASURING IMPACTS AND ENABLING INVESTMENTS IN ENERGY-SMART AGRIFOOD CHAINS
INST
RU
MEN
TS
TO
OV
ERC
OM
E B
AR
RIE
RS
AN
D D
ELIV
ERY
MO
DEL
S
This support may take the form of technical assistance, financial advice, labelling of appliances, or information distribution. Information on resource availability (and analysis where needed), the benefits and potential of clean energy technologies and practices, and assistance with applying for available central government incentives can be provided in a variety of forms.
Training Training programmes may be established in schools, universities, or amongst key professional groups such as farmer associations. Skilled professionals are needed to foster the adoption of clean energy technologies and practices, particularly when they involve advanced technical knowledge. Information and knowledge-based promotion must be provided in conjunction with other political tools, including geographic information system (GIS) databases and media campaigns.
Source: Adapted from FAO/EBRD, 2017.
4.2 FINANCING INSTRUMENTS TO HEDGE RISKS In addition to policy instruments, financing instrument are required for promoting the deployment of clean energy technologies. In order to allow farmers and food processors to adopt clean energy technologies and implement energy interventions, it is important to provide them with suitable financing models, especially if the adopters have limited financial resources and are located in developing countries. A number of financing instruments exist which can be generally categorized as:
• guarantee instruments;
• currency risk mitigation instruments; and
• liquidity risk mitigation instruments.
Guarantee instruments are very important especially in developing countries where financing institutions have difficulty in profiling their clients for risk of insolvency. They are therefore reluctant to lend money even for low-capital farmer investments such as for a small solar water pump. By addressing various risks, guarantee instruments can improve the structure and quality of a clean technology investment, therefore making projects more attractive to private investors.
Guarantees supporting energy interventions are usually issued by public entities such as governments and international finance institutions to address political, policy, credit and currency risk. Guarantee instruments dedicated to mitigating a technology-specific risk (e.g. a new technology like a solar milk chiller) are an exception to this. The use of guarantees for energy interventions in the agrifood sector can differ from those used in other sectors due to the limited track record thus far in applying, issuing and using the guarantees in contexts where the technology is particularly innovative. The limited track record was mentioned as a key concern for preventing loans for innovative technologies in both Kenya and Tanzania.

CO
ST-B
ENEF
IT A
NA
LYSI
S A
T T
HE
CO
UN
TRY
LEV
EL
205MEASURING IMPACTS AND ENABLING INVESTMENTS IN ENERGY-SMART AGRIFOOD CHAINS
INST
RU
MEN
TS
TO
OV
ERC
OM
E B
AR
RIE
RS
AN
D D
ELIV
ERY
MO
DEL
S
However, guarantee instruments for small investments in energy interventions in agrifood are different from the classic guarantees that are issued to single medium- to large-scale investments, as they need to reach a large number of users in rural areas which would result in very high transaction costs. An intermediate actor with a strong local network and knowledge of the local context is needed to manage the guarantee instruments (such as an MFI) with tailored instruments, such as pay-as-you-go systems or leasing coupled with extension services for the use of the new technology.
A government guarantee is where governments underwrite investment risks that they are in a better position to take (e.g. to develop a milk cold chain). This can help enable financing. The need for a government guarantee was mentioned several times among practitioners during the stakeholder workshops, especially in the East African countries. Lenders and financing institutions supporting energy interventions in the agrifood chain could consider three possible alternatives to government guarantees (IRENA, 2016a):
a) national bank guarantee, in which a development bank or a state-level bank (public finance institution) guarantees the adoption of a technology instead of the Ministry of Finance;
b) guarantee fund set up by reciprocal guarantee partnerships (as used by Spain, Argentina and other countries) could also play this role with the partnerships usually set up by local or provincial government banks, having a liquid fund used as collateral; and
c) corporate guarantee fund or trust with a credit-risk rating which ensures compliance with international solvency standards.
Political risk insurance is another guarantee instrument which is particularly relevant in politically unstable countries, particularly for medium- to long-term investments. This insurance product was advocated by stakeholders at the Kenyan workshop. Investors are highly sensitive to the potential impact of political risk, making the transfer of such risks essential, especially in countries with inadequate rule of law. Political risk insurance issued by public finance institutions can provide a broad coverage of risks related to government action, building on their strong credit worthiness and government membership (IRENA, 2016b).
Partial risk guarantee is another guarantee instrument to cover a wider range of political risks than those covered by the insurance market. It can also be used to mitigate policy and regulatory risks and be provided to investors to ensure a government’s obligation to compensate for loss of regulated revenues resulting from defined regulatory risk. This could happen when the government or regulatory agency changes, repeals or fails to comply with the key provisions of the regulatory framework. It can also be used to back up a government commitment made in the early stages of power sector reform to ensure reliable and timely enforcement of the measures required for the reform (AfDB, 2013a). A typical example, relevant for those interventions which foresee the sale of electricity produced to the grid (e.g. grid-connected biogas power plant system), is the timely access to the grid. Uncertain grid access is one of the most significant factors in determining the commercial viability of

206 MEASURING IMPACTS AND ENABLING INVESTMENTS IN ENERGY-SMART AGRIFOOD CHAINS
INST
RU
MEN
TS
TO
OV
ERC
OM
E B
AR
RIE
RS
AN
D D
ELIV
ERY
MO
DEL
S
new power projects (Clean Energy Pipeline, 2015). Partial risk guarantees can be particularly important for covering transmission line and grid interconnection risks because such infrastructure systems are often owned by government entities (IRENA, 2016a).
Currency risk mitigation instruments are useful in situations in which the project has revenue in one currency and loan payments in another. This applies to all the technologies investigated as the examples in this study since the equipment was always imported and not manufactured locally. A mismatch between the financing currency and the currency of the revenue, the repayment (in cases where the technology is lent directly from the technology provider to the user) or local market currency (in cases where the technology is placed on the local market) can often be a problem for debt repayment. While currency hedging instruments exist to mitigate currency risk, they are accompanied in some countries by high costs, increasing the cost of capital. Alternative options to address currency risk, such as a currency risk guarantee fund or a local currency lending instrument, can be used (IRENA, 2016a).
Liquidity risk mitigation instruments and Liquidity guarantees are used to overcome liquidity constraints of technology adopters or employed when the timing of cash receipts and payments is mismatched (e.g. an investment in solar irrigation and the harvest). Liquidity risk mitigation instruments can involve various financial instruments to provide short-term cash flow to users or to extend the time needed to improve the liquidity profile (IRENA, 2016a). Also inadequate loan terms expose projects to liquidity risks. These can occur when the maturity of the loan is mismatched with the lifetime of the asset and is particularly acute in low-income African countries where it is difficult for farmers to access a credit to be repaid in over one year.
All these financial instruments can be adopted and tailored to specific clients including technology providers, technology users, or intermediaries such as farmer cooperatives. Moreover, the choice of the most appropriate financing instrument depends not only on the level of investment (the economic actor) but also on the business model chosen. For example, a small farmer adopting the technology directly and seeking financing from a micro-credit institution is a different business case than a cooperative adopting the technology for the benefit of its farmers using its own financial resources. There is a large array of possible combinations but the business models selected as illustrated in the next section narrow down the number of possibilities.

CO
ST-B
ENEF
IT A
NA
LYSI
S A
T T
HE
CO
UN
TRY
LEV
EL
207MEASURING IMPACTS AND ENABLING INVESTMENTS IN ENERGY-SMART AGRIFOOD CHAINS
INST
RU
MEN
TS
TO
OV
ERC
OM
E B
AR
RIE
RS
AN
D D
ELIV
ERY
MO
DEL
S
4.3 BARRIERS, SUPPORT INTERVENTIONS AND BUSINESS MODELS TO ENCOURAGE ENERGY INTERVENTIONS FOR THE SELECTED VALUE CHAINS AND TECHNOLOGIES For each of the clean energy technologies employed in the milk, vegetable and rice value chain the following sections outline specific policy support measures and business models to help overcome barriers to deployment and enhance the current rates of uptake.
The technologies chosen for this study are purely examples, stemming from the INVESTA project experience, to provide some ideas and assistance for policy-makers and project financiers wishing to deploy new energy technologies with the aim to reduce total GHG emissions in the agrifood sector. The principles and lessons learned from experience, as outlined here, can be adapted and used to encourage deployment at the country level of many clean energy technologies in many agrifood value chains (beyond those analysed in chapter 3).
4.3.1 MILK VALUE CHAIN
Potential support interventions and business models that could be addressed by policy makers, regulators and financing institutions to foster the deployment of clean energy technologies for the milk value chain are provided on the basis of lessons learned from the country case studies (Section 3.1).
1) BIOGAS FOR POWER GENERATION FROM MANURE
Support from governments, international funding agencies, foundations or private companies can help to develop the market for renewable electricity produced from biogas combustion in gas engines and lower existing barriers (Table 4.2).

208 MEASURING IMPACTS AND ENABLING INVESTMENTS IN ENERGY-SMART AGRIFOOD CHAINS
INST
RU
MEN
TS
TO
OV
ERC
OM
E B
AR
RIE
RS
AN
D D
ELIV
ERY
MO
DEL
S
TABLE 4.2. Policy support interventions to overcome barriers to deployment of biogas for power generation from manure.
Possible support intervention Barriers to be tackled Responsible actors
Target setting – – –
“Sticks”:Regulatory schemes based on legal responsibility and jurisdiction
Establish codes and standards to boost confidence in the use and trade of the biogas digestate to develop a local market as a fertiliser or soil conditioner.
Facilitate the procedure for a power purchase agreement (PPA) with the local generator and/or lines company.
Prioritize energy-from-waste (e.g. by instigating a higher feed-in tariff than for solar or wind)
Lack of standard, codes and certification affect quality of the digestate and acceptability for sale.
Process to negotiate a PPA can be long and complicated.
Low financial returns.
Ministry.
Local government.
“Carrots”:Financial incentive schemes
Develop financing programmes including government-backed financial mechanisms or preferential loans.
Spur the development of a local market for the digestate.
Low financial returns.
Lack of access to credit. No market for digestate.
Ministries.
Local government.
Financing institutions.
Local banks.
“Guidance”:Knowledge and education schemes
Establish awareness raising activities of the benefits of anaerobic digestion of agri-residues and organic wastes to private companies and local officials.
Develop capacity to give a better understanding of biogas technology systems to financing institutes, administrative bodies and biogas plant developers.
Build capacity of both women and men aiming to hold managerial and technical roles by liaising with professional organizations, universities and vocational training schools.
Limited knowledge amongst public officials.
Lack of awareness on nutrient value of digestate.
Low awareness of modern biogas technologies, including gas cleaning.
Lack of qualified experts, both men and women, in the sizing, design, and safety of biogas production systems, particularly of engineers and technicians specialising in biogas plants.
Lack of support services for installation, operation and maintenance of plants.
Ministries.
Private sector companies.
Unions and farmer associations.
Local NGOs.
Source: Authors.

CO
ST-B
ENEF
IT A
NA
LYSI
S A
T T
HE
CO
UN
TRY
LEV
EL
209MEASURING IMPACTS AND ENABLING INVESTMENTS IN ENERGY-SMART AGRIFOOD CHAINS
INST
RU
MEN
TS
TO
OV
ERC
OM
E B
AR
RIE
RS
AN
D D
ELIV
ERY
MO
DEL
S
The business model is at the core of any successful start-up. Three possible business models identified for biogas generation plants are outlined in Table 4.3.
TABLE 4.3. Suitability of various business models for deployment of biogas for power generation from manure.
Business model
Description Pros Cons Suitability
Electricity company as partner (farm spin-off)
Farm owner manages the biogas plant using animal manure and/or crop residues as feedstocks. The electricity produced is sold to the local or national grid.
Operational risk is not entirely on the farmer.
Electricity sales guaranteed under the PPA.
Less flexibility to sell electricity to local users or to use it directly on the farm.
Only relevant for large livestock farms (hundreds of animals) where a low to medium voltage electricity line passes nearby the farm so that grid connection can be achieved.
Owned by farm
Farmer owns and operates the biogas plant to generate electricity used directly on farm. Surplus heat can also be utilized for animal housing, crop drying etc.
Farmer has full control of the business and operations.
Transaction costs are minimized.
Electricity demand on farm must be consistent in order to justify such an investment. Biogas storage is needed for when electricity demand is low.
Farmer takes all the investment risks.
Access to capital could be a barrier for many livestock farmers.
Not applicable to farms where there is insufficient skilled labour available to feed, run and maintain the biogas plant.
Owned by community with electricity fed into local mini-grid or into main grid
Biogas plant is owned by members of a small rural community and the electricity is fed into the local micro-grid. Manure and crop residues are collected from one or more dairy and other livestock farms nearby.
Benefits and risks are spread across community members.
Labour is employed to provide the feedstock and maintain the plant.
Plant feedstock has to be found on the local market and supply is not secured.
Transport costs of the feedstock can make the business less economically viable, though this would be partly offset by economies of scale.
It requires a local management board to ensure that the farmers are paid.
More suitable for a larger (commercial) scale plant than if individually owned by one farmer. Large plants improve efficiency and have a positive impact on local employment.
Source: Authors.

210 MEASURING IMPACTS AND ENABLING INVESTMENTS IN ENERGY-SMART AGRIFOOD CHAINS
INST
RU
MEN
TS
TO
OV
ERC
OM
E B
AR
RIE
RS
AN
D D
ELIV
ERY
MO
DEL
S
2) BIOGAS DOMESTIC-SCALE MILK CHILLER
The potential support to be addressed by policy makers, local government authorities, private sectors, financial institutions and associations to promote the deployment of biogas milk chiller technologies is outlined in Table 4.4.
TABLE 4.4. Policy support interventions to overcome barriers to deployment of biogas domestic milk chillers.
Possible support intervention Barriers to be tackled Responsible actors
Target setting Setting milk quality standards and desired rates of cooling down to a pre-determined temperature after milking.
Enforce milk quality standards.
Lack of incentive for dairy farmers and milk processors to improve milk quality and hygiene.
No enforcement of the ban to sell milk to informal channels.
Ministry of agriculture.
Dairy board.
“Sticks”:Regulatory schemes based on legal responsibility and jurisdiction
Regulate milk quality standards for milk collected at collection points.
Lack of knowledge by farmers on how to improve milk quality and hygiene.
Ministry of agriculture.
Dairy board.
Milk processing associations.
Dairy companies.
“Carrots”:Financial incentive schemes
Develop and facilitate access to gender responsive financial products in partnership with financial institutions and/or NGOs.
Develop specific guarantee funds for farmers who want to become part of a cold milk chain.
High initial investment costs for small-scale dairy farmers who find it difficult to gain access to credit, particularly for women.
Milk price variability can make the investment financially less viable.
Ministries of agriculture, energy, finance.
Commercial banks.
Impact investors.
Micro-finance institutions (MFIs).
Savings and Credit Cooperative Societies (SACCOS).
“Guidance”:Knowledge and education schemes
Facilitate technical assistance to public officials to ensure that they offer high quality extension services to meet the needs and expectations of the farmer and small agri-business end-users.
Capacity building of both women and men so they can equally hold managerial and technical roles by liaising with professional organizations, universities and vocational training schools.
Use public extension services, associations and local NGOs to educate dairy farmers on the benefits and effective usage of technology.
Limited knowledge amongst public officials.
Lack of access to extension services for farmers.
Lack of incentives for a farmer to gain knowledge or invest in order to improve milk quality and hygiene.
Lack of awareness of the technology and its benefits.
Private sector.
Local government authorities.
Livestock extension officers at local government authorities.
Local NGOs.
Sectorial associations.
Source: Authors.

CO
ST-B
ENEF
IT A
NA
LYSI
S A
T T
HE
CO
UN
TRY
LEV
EL
211MEASURING IMPACTS AND ENABLING INVESTMENTS IN ENERGY-SMART AGRIFOOD CHAINS
INST
RU
MEN
TS
TO
OV
ERC
OM
E B
AR
RIE
RS
AN
D D
ELIV
ERY
MO
DEL
S
In the milk sector context, there are a number of potential business models that can be followed to promote biogas production for milk chilling (Table 4.5).
TABLE 4.5. Suitability of various business models for deployment of biogas domestic milk chillers.
Business model
Description Pros Cons Suitability
Owned by small-scale dairy farmer
Small-scale dairy farmer invests own money and gains all the related benefits.
Smallholder dairy farmers without access to electricity can store and later sell the chilled evening milk, thus increasing their income.
Improve quality of milk supplied, especially in most isolated rural areas.
Access to capital can be a major barrier.
Breakage of the equipment or technical failure can directly impact on the farmer.
For small-scale farmers with limited access to markets.
Owned by cooperative/ small-scale dairy farmer as co-operative shareholder
Farmer owns the chilling system through the cooperative that acts as a guarantee for any bank loans etc.
As the farmer is responsible for the system, breakages are reduced.
Cooperative facilitates access to credit for farmers (acting as a guarantor).
Cooperative shares some risk with its farmer members.
Needs several dairy farmers in fairly close proximity to initially establish a small cooperative; though later it can expand to cover a greater region.
Dairy company or cooperative leases the technology to its farmers (contract leasing)
Farmer invests in the milk chiller and the dairy cooperative buys the cooled milk at a premium price.
Avoids the access to credit barrier for farmers.
Stabilizes and, over time, increases the quantity of milk received by the cooperative, thus improving the value chain.
Trust among parties is required since this business model requires long-term contracts.
For farmer cooperatives, dairy companies or farmer groups.
Owned by dairy company who distributes the chillers
Milk processor buys the milk chillers and distributes them to its affiliate farmer suppliers with the agreement that they will use them for the evening milking.
Avoids the barrier of poor access to credit for farmers.
Stabilizes and, over time, increases the quantity of milk received by the milk processor.
Trust among parties is required since farmers can use the chilling facility for other purposes. The risk is entirely on the processor.
Needs several farmers nearby who supply the same local processor.
Source: Authors.

212 MEASURING IMPACTS AND ENABLING INVESTMENTS IN ENERGY-SMART AGRIFOOD CHAINS
INST
RU
MEN
TS
TO
OV
ERC
OM
E B
AR
RIE
RS
AN
D D
ELIV
ERY
MO
DEL
S
3) SOLAR MILK COOLERS
The adoption of milk cooling systems on large dairy farms or at centrally located MCCs using solar-power requires significant collective effort to reduce the investment costs and improve performance efficiency, as outlined in Table 4.6.
TABLE 4.6. Policy support interventions to overcome barriers to deployment of solar milk coolers.
Possible support intervention Barriers to be tackled Responsible actors
Target setting Setting of minimum milk quality standards for milk collected from farmers.
Lack of farmer knowledge and incentives to improve and ensure milk quality.
Lack of clear development strategy for improvement of milk cold chains.
Dairy board.
“Sticks”:Regulatory schemes based on legal responsibility and jurisdiction
Enforce strict milk quality and temperature checks at collection points.
Complement the effort for eradication of counterfeit solar PV panels and batteries.
No strict milk quality check at the collection stage reduces any incentive for farmers to cool their milk.
No enforcement of quality standards of solar technology (counterfeit product).
Ministry of agriculture.
Dairy board.
“Carrots”:Financial incentive schemes
Facilitate financial incentives to make technology more affordable.
Low interest subsidized loans or loan guarantees could be suitable incentives.
Introduce a price premium for refrigerated quality milk.
Low financial returns.
High initial investment costs, especially for dairy smallholder groups.
Lack of financing solutions for dairy smallholder groups, particularly for women.
Lack of incentives for a farmer to wants to improve milk quality and hygiene.
Ministry of agriculture.
Ministry of finance.
Commercial banks.
MFIs.
International finance institutions (IFIs).
SACCOS.
Dairy board.
Dairy companies.
“Guidance”:
Knowledge and education schemes
Establish programmes for educating and training technicians, especially women.
Use public extension services, associations, private sectors and local NGOs to educate users on the benefits and effective use of coolers.
Initiate informative programmes to promote the technology.
Shortage of qualified technicians in rural areas to install and maintain the systems.
Lack of skilled women in labour market to become technicians, relative to men.
Lack of awareness of the technology by potential users.
Private sector companies.
Local government authorities.
Livestock extension officer at local government authorities.
Local NGOs.
Sector associations.
Source: Authors.
Three business models can be followed to distribute and sell solar milk coolers (Table 4.7). Milk aggregators who collect milk from numerous suppliers can be competitors to MFIs since they give loans to their farmer members. Conversely, milk aggregators can provide guarantees for MFIs by giving them information on the credit history of the supplying farmers if requested by the respective farmer (except where the legislation is restrictive by maintaining confidentiality).

CO
ST-B
ENEF
IT A
NA
LYSI
S A
T T
HE
CO
UN
TRY
LEV
EL
213MEASURING IMPACTS AND ENABLING INVESTMENTS IN ENERGY-SMART AGRIFOOD CHAINS
INST
RU
MEN
TS
TO
OV
ERC
OM
E B
AR
RIE
RS
AN
D D
ELIV
ERY
MO
DEL
S
MFIs usually seek guarantees and a short pay-back period from the technology providers to be able to value the equipment throughout its lifetime. They partner only with technologies that add value to the value chain and they also offer technical training to farmers and provide advice (through IT systems as well as face to face).
TABLE 4.7. Suitability of various business models for deployment of solar milk coolers.
Business model
Description Pro Cons Suitability
Owned by cooperative
Dairy cooperative owns the system and farmers pay for the services.
Profits remain within the cooperative, which empowers the cooperative.
Easier access to capital for the initial investment.
Demand can be very variable and the system capacity can easily result in being underused or insufficient.
Needs many small dairy farmers that are in close proximity.
Owned by large-scale farmer
Farmer owns the system used to improve on-farm milk management and quality.
Can facilitate access to premium markets (e.g. direct sales to supermarkets).Reduces milk spoilage on farm, especially where the livestock and pastures are relatively isolated.
Investment costs can be limiting.
For a large dairy farm where the number of cows warrants the investment in a cooler.
Owned by dairy processor
Dairy processor installs the cooling system at collection points and affiliated farmers can bring their milk.
Favours value-added efficiency gains along the value chain. Processors will benefit, especially when using refrigerated trucks to transport the milk to the processing plant.
Reduces overall milk spoilage significantly, particularly in warmer regions.
Requires a proper milk quality test of the milk when received from each farmer before accepting it into the pool of milk.
For most commercial-scale milk processors.
Source: Authors.

214 MEASURING IMPACTS AND ENABLING INVESTMENTS IN ENERGY-SMART AGRIFOOD CHAINS
INST
RU
MEN
TS
TO
OV
ERC
OM
E B
AR
RIE
RS
AN
D D
ELIV
ERY
MO
DEL
S
4.3.2 VEGETABLE VALUE CHAIN
Potential support interventions and business models that could be addressed by policy makers, regulators and financing institutions to foster the deployment of clean energy technologies for supplying vegetables are provided on the basis of lessons learned from the country case studies (Section 3.4).
1) SOLAR COLD STORAGE SYSTEMS
Delivering fresh vegetables (and fruit and fish) to market without losing quality can be a challenge for many growers with poor road access living long distances away from markets. Inefficient infrastructure can hamper sustainable value chain development with investment needed to improve roads, distribute reliable and affordable electricity, and provide cold storage facilities. Capacity building at both upstream and downstream ends of the value chain is needed to enable a cold-chain to develop to keep freshly harvested products cool till the point of sale. Policy support can stimulate deployment (Table 4.8).
Delivering fresh vegetables to the market proves difficult in regions with poor road access. Solar cold storage can offer a viable solution. © GIZ/Wohlmann

CO
ST-B
ENEF
IT A
NA
LYSI
S A
T T
HE
CO
UN
TRY
LEV
EL
215MEASURING IMPACTS AND ENABLING INVESTMENTS IN ENERGY-SMART AGRIFOOD CHAINS
INST
RU
MEN
TS
TO
OV
ERC
OM
E B
AR
RIE
RS
AN
D D
ELIV
ERY
MO
DEL
S
TABLE 4.8. Policy support interventions to overcome barriers to deployment of solar cold storage for vegetables.
Possible support intervention Barriers to be tackled Responsible actors
Target setting – – –
“Sticks”: Regulatory schemes based on legal responsibility and jurisdiction
Complement the effort for eradication of low efficiency solar panels and batteries, usually imported and counterfeit.
No enforcement for quality standards of solar systems used for the cold stores.
Ministry of trade.
“Carrots”: Financial incentive schemes
Support guarantee schemes for farmers and cooperatives interested in adopting the solar cold storage technology.
Credit market failures for farmers or cooperatives wishing to invest.
Local banks.
IFIs.
“Guidance”: Knowledge and education schemes
Public extension services, associations and local NGOs can educate practitioners on the benefits and effective use of the technology.
Knowledge sharing events on e-commerce and real-time information systems can be organised.
Lack of trained technicians.
Lack of awareness about the technology and potential benefits.
Lack of information between demand and supply (leading to product loss, overcrowding and congestion in market places, and price volatility).
Difficult to correctly size the required storage volume.
Poor coverage of technology supplier networks, especially for repairs and maintenance.
Ministries of agriculture, energy.
Local governments.
Sector associations.
Source: Authors.
Farmer associations and networks can create economies of scale as a result of aggregating product outputs and enhance the collective bargaining power of their members. Therefore, a business model supporting associations of farmers and partnerships between farmers and the wholesaler (Table 4.8) may be able to gain discounts on purchased inputs for farmers, gain better access to markets, and access credit through MFIs and commercial banks.

216 MEASURING IMPACTS AND ENABLING INVESTMENTS IN ENERGY-SMART AGRIFOOD CHAINS
INST
RU
MEN
TS
TO
OV
ERC
OM
E B
AR
RIE
RS
AN
D D
ELIV
ERY
MO
DEL
S
TABLE 4.9. Suitability of various business models for deployment of solar cold storage for vegetables.
Business model
Description Pro Cons Suitability
Owned by wholesaler-owned
Wholesaler adopts the technology at vegetable collection points. These may be off-grid or with unreliable grid supply.
The owner/investor has full control over operation, maintenance and use of the system.
Local growers will have to transport their freshly harvested produce to the cold store that may be at a distance.
For medium-scale wholesale enterprises.
Owned by farmer group or cooperative
Informal farmer group or formal cooperative invests in the cold storage system and the farmer members pay a reduced fee to store their fresh produce.
The group or cooperative can offer collateral, therefore facilitating access to credit.
Unit storage costs are lower than for a small farmer-owned storage system which would probably also be less efficient.
Typical size of system would be relatively expensive given the size of most farmer groups or cooperatives.
Requires a good organization with responsibility for managing the system.
Cooperative shares some risk with its farmer members.
For groups or cooperatives in a region with a large number of vegetable growers who will gain mutual benefits.
Contract agreement between farmers and wholesaler
The wholesaler invests in the cold storage system and farmers pay a fee for the use of the system.
Farmers have flexibility on the type and quantity of products they wish to store.
Risk for the wholesaler is reduced if there are sufficient users in the vicinity.
Lack of full control by the growers needs good trust between the wholesaler and the users.
System needs to be oversized in comparison with system used/managed by wholesaler only.
For medium to large wholesale enterprises with a sufficient number of users/farmers in the vicinity.
Owned by large farmer
Large-scale farmers in remote locations invest in a cold store to optimize the transport of vegetables to markets.
Owner/investor has full control of the system.
Transport costs are reduced if trucks can be filled to greater capacity to reduce the number of journeys.
Investment risk is entirely on the farmer investor.
If the location is completely off-grid, the investment cost would be higher in order to include storage batteries.
For growers with sufficient volumes of produce, ideally all year round, to warrant the investment.
Third party provision of the cold store facility
Cold-chain is a service provided by a commercial enterprise other than the farmers or wholesalers.
Benefits and risks are shared between famers, wholesalers, and the third party.
Risky for farmers and wholesalers if the third party pulls out or becomes insolvent.
Where local growers and wholesalers do not have the knowledge or capacity to invest.
Source: Authors.

CO
ST-B
ENEF
IT A
NA
LYSI
S A
T T
HE
CO
UN
TRY
LEV
EL
217MEASURING IMPACTS AND ENABLING INVESTMENTS IN ENERGY-SMART AGRIFOOD CHAINS
INST
RU
MEN
TS
TO
OV
ERC
OM
E B
AR
RIE
RS
AN
D D
ELIV
ERY
MO
DEL
S
2) SOLAR-POWERED WATER PUMPS
Irrigation schemes tend to be capital intensive, but a return on investment results from increased yields and greater resilience to possible future droughts as a result of climate change. Hence policy support interventions are warranted. Larger vegetable farms tend to use boom or central pivot irrigation systems and pressurised drip irrigation, whereas small farms tend to be limited to gravity fed water-inefficient surface irrigation and low-pressure drip.
TABLE 4.10. Policy support interventions to overcome barriers to deployment of solar-powered water pumps.
Possible support intervention Barriers to be tackled Responsible actors
Target setting Regulate share of total water pumping powered by solar (including waterways with down-stream users).
Risk of over-exploitation of water resources.
Ministry of agriculture.
“Sticks”:Regulatory schemes based on legal responsibility and jurisdiction
Clarify the rules for import tax exemption of DC solar pumping systems.
Complement the effort for eradication of imported counterfeit solar PV panels and batteries with low performance efficiencies by setting minimum performance standards and intensify controls.
Rules for the import duty exemption of solar pumps are sometimes uncertain and not clear.
No enforcement of minimum performance standards of solar technologies.
Ministry of finance.
“Carrots”:Financial incentive schemes
Develop specific micro-credit lines coupled with support services for small farmers wanting to adopt solar water pumping, including instruments that hedge against production risks.
Provide a subsidy for medium and large solar pumping systems but only if there is a monitoring system (meters) to enable strict management of underground aquifers.
Difficult access to micro-credit for smallholders with a lack of collateral, particularly for women.
Production risks. Risk of over-exploitation of water resources.
Local banks.
IFIs.
SACCOs.
Ministry of agriculture.
Ministry of water.
“Guidance”: Knowledge and education schemes
Provide training to make farmers more aware of the financial benefits of solar pumping. Provide advice with their production plans and raise awareness of financing opportunities. Train retailers so that they can offer a ‘whole package’ for solar-powered irrigation, including support services.
Low business skills of many small farmers.
Lack of market awareness of farmers.
A typical solar PV-powered pump needs longer pumping time or more pumps to apply a similar volume of water as pumps powered by grid electricity or diesel generator.
Support services for maintenance and repair are often low initially, although have developed fast in many locations once the technology becomes mainstream.
Ministry of agriculture.
Cooperatives.
Private sector.
Source: Authors.

218 MEASURING IMPACTS AND ENABLING INVESTMENTS IN ENERGY-SMART AGRIFOOD CHAINS
INST
RU
MEN
TS
TO
OV
ERC
OM
E B
AR
RIE
RS
AN
D D
ELIV
ERY
MO
DEL
S
Business models suitable for encouraging solar water pump deployment are summarised in Table 4.10.
TABLE 4.11. Suitability of various business models for deployment of solar-powered water pumps.
Business model
Description Pro Cons Suitability
Owned by individual farmer
Farmer invests in the solar pump.
All benefits are accrued by the farmer.
The investment risks are entirely on the farmer.
Without extension services by the system provider it can be difficult for the farmer to optimize the use of the pump and to maintain it.
Access to credit is difficult for individual farmers.
For small farmers with some technical knowledge and adequate water supply nearby.
Owned by cooperative or informal farmer group
The pump is entirely, or in-part, purchased by the cooperative that then leases the use to individual farmers. At the end of the leasing period the farmer becomes owner of the pump.
All benefits are accrued by the cooperative/farmers.
Risk of insolvency is shared among members.
Capital costs are spread over several users.
Support services are not provided to each individual farmer but to the group.
Operational risk is entirely on the farmer.
Geographic location limitations and the management of timing/schedule of water distribution within the group can be challenging.
For existing farmer group or cooperative where water supplies are adequate.
Owned by pump manufacturer or financial institution, who leases the pump to farmers
Pump is leased to the farmer (together with other support services) by the manufacturer or by a FI. The farmer pays a fee to access the service and then a tariff based on the amount of water pumped.
Risk for the farmer is minimized.
Access to credit for small farmers is not a problem.
Farmer gains knowledge of efficient use and operation of the pump.
Trust is required between the parties.
If installed with a remote metering system there is a risk of hacking.
Source: Authors.
4.3.3 RICE VALUE CHAIN
Potential support interventions and business models that could be addressed by policy makers, regulators and financing institutions to foster the deployment of clean energy technologies in the rice value chain are based on lessons learned from the country case studies (Section 3.5).

CO
ST-B
ENEF
IT A
NA
LYSI
S A
T T
HE
CO
UN
TRY
LEV
EL
219MEASURING IMPACTS AND ENABLING INVESTMENTS IN ENERGY-SMART AGRIFOOD CHAINS
INST
RU
MEN
TS
TO
OV
ERC
OM
E B
AR
RIE
RS
AN
D D
ELIV
ERY
MO
DEL
S
1) RICE HUSK GASIFIERS FOR ELECTRICITY GENERATION
Potential support interventions to foster the deployment of rice husk gasifiers are outlined in Table 4.11.
TABLE 4.12. Policy support interventions to overcome barriers to deployment of rice husk gasifiers.
Possible support intervention Barriers to be tackled Responsible actors
Target setting Set targets and strategies for rural electrification.
Lack of support services in remote rural areas.
Ministry of Energy.
“Sticks”:
Regulatory schemes based on legal responsibility and jurisdiction
Coordinated planning with ministries on minimum standards for agricultural and food waste disposal.
Introduce more stringent environmental standards to protect the environment from agriculture and food residues disposal, as well as from effluents arising from processing plants.
Reflect the need to balance mini-grids, stand-alone systems, and extension of main grid to achieve universal access in a timely manner (and at least cost).
Consider clear trends in the energy sector where the falling price of RE is making hybrid mini-grids cost-competitive with grid connections. Mini-grids can be least-cost solutions if externalities are included in estimating total investment costs.
Consider the inequity of grid electricity being offered at prices well below costs during electrification planning, whereas off-grid solutions are expected to achieve full cost recovery.
Simplify procedures to connect to the grid for small renewable energy producers making it possible to sell the entire production to the grid, up to a certain power capacity.
In case of using feedstock with high moisture content, the disposal and odour of the tar produced is a major problem.
No incentive to invest in tar and liquid by-product treatment systems.
Access to feed-in tariffs (FiT) for electricity sales may be too costly and complicated for small electricity producer.
Ministries.
Local government.
“Carrots”:Financial incentive schemes
Introduce and mainstream insurance products to hedge against market price for the feedstock.
Remove any direct or indirect subsidies for diesel fuel.
Decrease or remove biochar export duty if the char produced is to be sold as a by-product.
Upfront investment cost is high.
Credit market failures.
Feedstock price volatility.
Lack of risk sharing scheme.
Low diesel price gives long payback for gasifier alternative.
Duties on biochar export (e.g. to Japan) are high.
Financing institutions.
Ministries.
Local government.
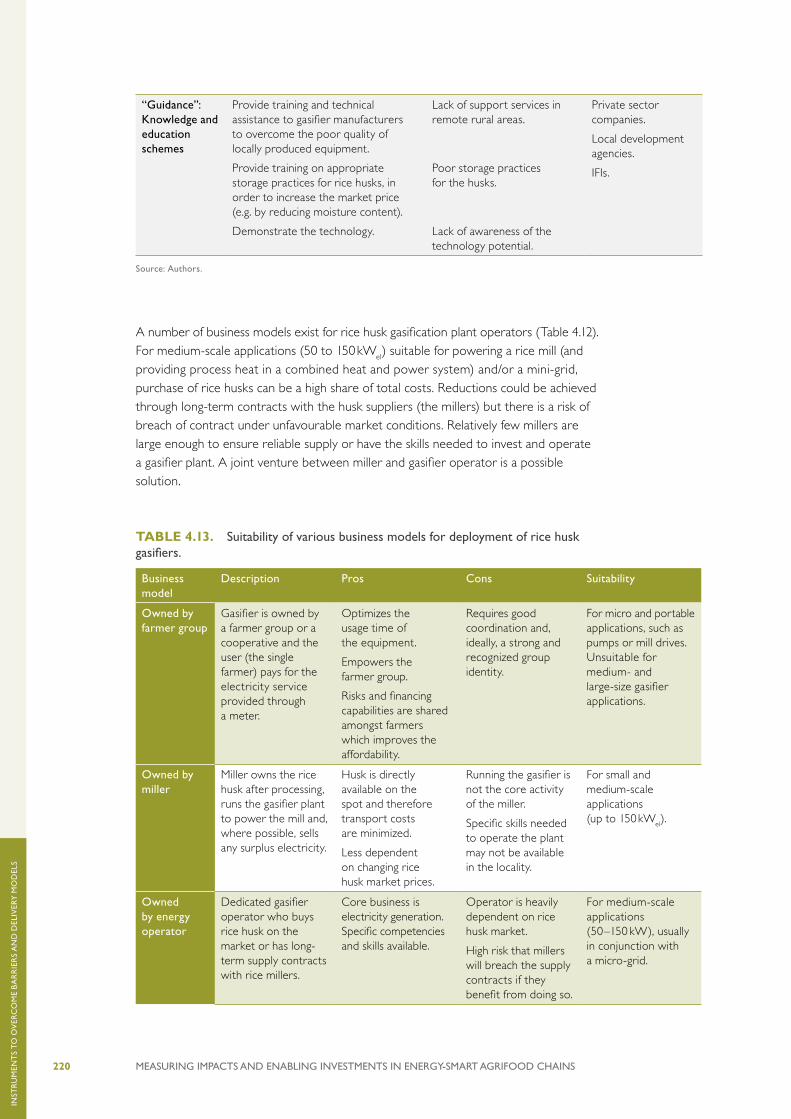
220 MEASURING IMPACTS AND ENABLING INVESTMENTS IN ENERGY-SMART AGRIFOOD CHAINS
INST
RU
MEN
TS
TO
OV
ERC
OM
E B
AR
RIE
RS
AN
D D
ELIV
ERY
MO
DEL
S
“Guidance”:Knowledge and education schemes
Provide training and technical assistance to gasifier manufacturers to overcome the poor quality of locally produced equipment.
Provide training on appropriate storage practices for rice husks, in order to increase the market price (e.g. by reducing moisture content).
Demonstrate the technology.
Lack of support services in remote rural areas.
Poor storage practices for the husks.
Lack of awareness of the technology potential.
Private sector companies.
Local development agencies.
IFIs.
Source: Authors.
A number of business models exist for rice husk gasification plant operators (Table 4.12). For medium-scale applications (50 to 150 kWel) suitable for powering a rice mill (and providing process heat in a combined heat and power system) and/or a mini-grid, purchase of rice husks can be a high share of total costs. Reductions could be achieved through long-term contracts with the husk suppliers (the millers) but there is a risk of breach of contract under unfavourable market conditions. Relatively few millers are large enough to ensure reliable supply or have the skills needed to invest and operate a gasifier plant. A joint venture between miller and gasifier operator is a possible solution.
TABLE 4.13. Suitability of various business models for deployment of rice husk gasifiers.
Business model
Description Pros Cons Suitability
Owned by farmer group
Gasifier is owned by a farmer group or a cooperative and the user (the single farmer) pays for the electricity service provided through a meter.
Optimizes the usage time of the equipment.
Empowers the farmer group.
Risks and financing capabilities are shared amongst farmers which improves the affordability.
Requires good coordination and, ideally, a strong and recognized group identity.
For micro and portable applications, such as pumps or mill drives. Unsuitable for medium- and large-size gasifier applications.
Owned by miller
Miller owns the rice husk after processing, runs the gasifier plant to power the mill and, where possible, sells any surplus electricity.
Husk is directly available on the spot and therefore transport costs are minimized.
Less dependent on changing rice husk market prices.
Running the gasifier is not the core activity of the miller.
Specific skills needed to operate the plant may not be available in the locality.
For small and medium-scale applications (up to 150 kWel).
Owned by energy operator
Dedicated gasifier operator who buys rice husk on the market or has long-term supply contracts with rice millers.
Core business is electricity generation. Specific competencies and skills available.
Operator is heavily dependent on rice husk market.
High risk that millers will breach the supply contracts if they benefit from doing so.
For medium-scale applications (50–150 kW), usually in conjunction with a micro-grid.

CO
ST-B
ENEF
IT A
NA
LYSI
S A
T T
HE
CO
UN
TRY
LEV
EL
221MEASURING IMPACTS AND ENABLING INVESTMENTS IN ENERGY-SMART AGRIFOOD CHAINS
INST
RU
MEN
TS
TO
OV
ERC
OM
E B
AR
RIE
RS
AN
D D
ELIV
ERY
MO
DEL
S
Joint venture between energy operator and farmers
Plant is operated by an energy company and the rice millers are shareholders.
Shareholder millers have an interest in maximizing the electricity generation (hence profit) of the plant. This ensures a low-cost and constant husk supply.
Offsets the risks of breaking long-term contracts between the plant operator and the millers.
When husk market price is high, there is an opportunity cost for the miller.
For medium-scale applications (50–150 kW), usually in conjunction with a micro-grid.
Source: Authors.
Rice field at the International Rice Research Institute (IRRI), an international agricultural research and training organization with headquarters in Los Baños, Laguna, in the Philippines. © FAO/Stefania Bracco

222 MEASURING IMPACTS AND ENABLING INVESTMENTS IN ENERGY-SMART AGRIFOOD CHAINS
INST
RU
MEN
TS
TO
OV
ERC
OM
E B
AR
RIE
RS
AN
D D
ELIV
ERY
MO
DEL
S
2) SOLAR-POWERED DOMESTIC RICE PROCESSORS
The main thematic policy and regulatory areas to be addressed by policy makers, regulators and financing institutions to foster the deployment of solar-powered domestic rice processing in off-grid areas are outlined in Table 4.13.
TABLE 4.14. Policy support interventions to overcome barriers to deployment of solar-powered domestic rice processors.
Potential support intervention Barriers to be tackled Responsible actors
Target setting – – –
“Sticks”: Regulatory schemes based on legal responsibility and jurisdiction
Technical assistance to develop minimum performance quality standards for solar PV systems, including all major components (where a quality standard for rice processing equipment is lacking) which ensure that high quality of systems is maintained without damaging the overall market.
Lack of specific regulations for PV rice processing technologies or clean energy technologies in the food sector.
Ministry.
Local government.
“Carrots”: Financial incentive schemes
Develop specific loan packages to allow farmers to overcome the relatively high upfront costs of solar processing systems. This includes micro-financing for farmers and millers without land or guarantees.
Technical and financial assistance to microfinance and local savings organisations, such as service and credit associations, to help them develop and market specific saving products for small rice processors.
Credit market failures.
Lack of financing schemes for small-scale rice producers and processors, especially for landless farmers and women.
Financial Institutions
“Guidance”: Knowledge and education schemes
Provide technical and financial assistance to improve consumer awareness levels of the potential benefits, particularly in rural areas. This can include promotional campaigns, radio advertising, product demonstrations and extension support.
Use capacity building and energy literacy to bring productive technologies to remote areas.
Provide technical assistance to manufacturing companies to help them produce, develop, market, distribute, retail and deliver their products.
Demonstrate solar micro-millers to cooperatives or farmer groups and offer a complete ‘package’ for financing and post-sale assistance.
Lack of awareness of the technology.
Collective action needed for technology to take off.
Poor efficiency and coverage of technology supplier networks and maintenance providers.
Ministries.
Local government.
Private sector companies.
Source: Authors.

CO
ST-B
ENEF
IT A
NA
LYSI
S A
T T
HE
CO
UN
TRY
LEV
EL
223MEASURING IMPACTS AND ENABLING INVESTMENTS IN ENERGY-SMART AGRIFOOD CHAINS
INST
RU
MEN
TS
TO
OV
ERC
OM
E B
AR
RIE
RS
AN
D D
ELIV
ERY
MO
DEL
S
TABLE 4.15. Suitability of various business models for deployment of solar-powered domestic rice processors.
Business model
Description Pros Cons Suitability
Owned by farmer
Rice producer is also the owner of the technology.
Farmer has freedom to mill anytime, without the risking of having to wait several days before accessing shared equipment.
Access to capital is a major barrier for small farmers.
Mill does not work at full capacity.
For small and micro mills able to meet the demand of one farmer.
Owned by small farmer group
Group or cooperative of farmers owns the technology and farmers pay for the service provided.
Profits remain within the group or cooperative, which empowers the group.
Facilitates access to capital for the initial investment.
Management of the facility could be difficult.
Learning how to manage and operate the system requires time and experience.
For small- and medium-size mills able to satisfy the demand from the group members.
Owned by community
Shared ownership by members of a small community or village.
Profits and risks are shared among all community members.
Facilitates inclusion of women.
Demand can be variable (everyone needs the equipment at the same time). Mill capacity not always appropriate.
Low ownership of technology and shared responsibility of proper maintenance can be a challenge.
Difficult to manage the system and ensure savings for maintenance and depreciation over time.
For small and micro mills addressing the needs of a few small farmers.
Owned by miller
System owned by company whose core business is rice milling.
As milling is the core activity, may favour efficiency gains.
Primary interest is to maximize profits and ensure long-term economic sustainability of business.
Large- and commercial-scale operations allow for investments in innovative technologies.
Growers have to pay price to use equipment as set by miller/owner.
Large mills addressing the needs of a multitude of farmers.
Source: Authors.

224 MEASURING IMPACTS AND ENABLING INVESTMENTS IN ENERGY-SMART AGRIFOOD CHAINS
INST
RU
MEN
TS
TO
OV
ERC
OM
E B
AR
RIE
RS
AN
D D
ELIV
ERY
MO
DEL
S
4.4 DISCUSSIONThe tables above provide a wide range of examples of policy measures and business models that could be applied to increase the deployment of clean energy interventions to add value to agrifood chains whilst reducing dependence on fossil fuels, avoiding GHG emissions, and aiming for greater sustainability overall. Chapter 3 outlined the financial and economic costs and benefits for selected case studies. It included environmental and socio-economic impacts from an intervention by using consistent indicators throughout the cost-benefit analyses.
The challenge for a policy maker, financier or funding agency is to apply the messages as outlined in this study and use a similar methodology to ascertain priority areas when working to make a specific agrifood chain more “energy-smart”. Each country is different. A wide range of clean energy technologies has been developed that can be applied to reduce local and global environmental impacts whilst providing greater food security.
There is little doubt that the existing global food supply system is not sustainable in the longer term due to its reliance on fossil fuel inputs; its emissions of around one quarter of total GHGs; its increasing demands for freshwater extractions; and concerns about greater levels of soil degradation from intensive farming activities. Hence, there is an urgent need for governments to help overcome the barriers to the deployment of clean energy technologies and encourage the uptake of business models that can help deliver the concept of a more sustainable agrifood supply system.
It is difficult to generalize the findings of the specific technology case studies also because the national policies can make impossible the development of a certain business model. To ease the task, the technologies analysed in this study can be grouped into:
a) renewable heat and electricity generation at the commercial scale of around 150 kWel capacity (from anaerobic digestion and rice husk gasification) with the electricity being exported to the grid, used on-site, or supplied to a local mini-grid;
b) medium-scale systems where small enterprises or farmer cooperatives can invest to obtain multi-benefits (solar-powered milk cooler for 600 litres/day and 25 m3 solar-powered cold vegetable storage facility); and
c) domestic-scale systems used by small family-scale farms to increase revenue by reducing food losses, increasing crop yields, or becoming less dependent on fossil fuels (biogas milk cooler for 20 litres/day, solar water pumps for irrigating 0.2 ha, and solar-powered rice processors for up to 120 kg/day). The additional revenue is often used to improve animal health, pay for school fees, etc.
For each energy interventions group, the main barriers which have been mentioned by stakeholders can be generalized as reported in the table below.

CO
ST-B
ENEF
IT A
NA
LYSI
S A
T T
HE
CO
UN
TRY
LEV
EL
225MEASURING IMPACTS AND ENABLING INVESTMENTS IN ENERGY-SMART AGRIFOOD CHAINS
INST
RU
MEN
TS
TO
OV
ERC
OM
E B
AR
RIE
RS
AN
D D
ELIV
ERY
MO
DEL
S
TABLE 4.16. Main support interventions identified for each technology group.
Technology group
Target setting
Regulatory framework Investment and fiscal incentives
a) – Establishment of codes and standards for by-products to spur the develop of a new market for these products, which in turn improves the financial viability of the energy technology.
Introduce environmental standards including on waste disposal which favour the use of waste for bioenergy.
Facilitate the administrative process to obtain permits for new plants and grid connection.
Consider the inequity of grid electricity being offered at prices below costs during electrification planning.
Consider the falling price of renewable energy during electrification planning.
Mainstream insurance products to hedge against market price for the feedstock (if a market exists).
Develop government-backed financial mechanisms or preferential loans, especially to spur the development of a local market for the by-products.
Remove any direct or indirect subsidy for fossil fuels.
b) Set minimum food quality standards at an early stage of the value chain.
Enforce quality checks at an early stage of the agrifood value chain that can make the adoption of the new energy technology necessary (e.g. for milk).
Eradicate low-efficiency or counterfeit equipment (e.g. batteries).
Support guarantee schemes and products to hedge against risks for farmers and farmer groups/cooperatives.
Facilitate financial incentives to make technology more affordable.
Support low interest subsidized loans or loan guarantees.
Introduce a price premium for technology adopters (e.g. for cooled milk).
c) National renewable energy targets and water management targets (against the risk of water over-exploitation).
Regulate food quality standards at an early stage of the value chain.
Provide technical assistance to develop minimum performance quality standards for energy equipment.
Develop and facilitate access to gender-responsive financial products in partnership with financial institutions and/or NGOs.
Develop specific guarantee funds for farmers who want to adopt the technology.
Develop specific loan packages for farmers to tackle relatively high upfront investments. This includes micro-financing for technology adopters without collaterals (e.g. no land titles).
Provide technical and financial assistance to microfinance and local savings organisations, such as service and credit associations, to help them develop and market savings products for processors.
Source: Authors.

226 MEASURING IMPACTS AND ENABLING INVESTMENTS IN ENERGY-SMART AGRIFOOD CHAINS
INST
RU
MEN
TS
TO
OV
ERC
OM
E B
AR
RIE
RS
AN
D D
ELIV
ERY
MO
DEL
S
In addition to the regulatory and incentive support interventions mentioned above, the improvement of knowledge and education schemes, especially in rural areas, were highlighted for all the technology groups during the discussions. These can be summarized as follows:
• Establish awareness raising activities of the benefits of energy technologies to private companies and local officials.
• Develop capacity to give a better understanding of energy technologies to financing institutes, administrative bodies, equipment providers and plant developers. This includes technology demonstration.
• Build capacity of both women and men aiming to hold managerial and technical roles by liaising with professional organizations, NGOs, universities and vocational training schools.
• Provide training on appropriate technologies and good practices.
A different approach would be to look at the instruments to overcome barriers from a value chain perspective. In developing countries, inefficient infrastructure and marketing are often reported as main barriers to sustainable value chain development. In order to create a conducive environment for business, investment is needed for tarmac roads, cold storage, improved power distribution and lower power costs. Capacity building will also be required at both upstream and downstream ends of the relevant value chains. A positive example is the creation of a centralized produce collection point with cold chambers by the Horticultural Crops Directorate in Kenya. Strong support can be sought from the NGOs and private companies interested in extending postharvest and marketing assistance to smallholders in remote locations (FAO and IFC, 2015).
At the initial stages of the agrifood value chain – at the farmer or small processor level – the main barriers relate to low awareness of the technological solutions, in the inexistent or inadequate instruments available to adopt them and in the low access to financial institutions. This latter barrier is most evident in Sub-Saharan Africa (Figure 4.1 and 4.2).

CO
ST-B
ENEF
IT A
NA
LYSI
S A
T T
HE
CO
UN
TRY
LEV
EL
227MEASURING IMPACTS AND ENABLING INVESTMENTS IN ENERGY-SMART AGRIFOOD CHAINS
INST
RU
MEN
TS
TO
OV
ERC
OM
E B
AR
RIE
RS
AN
D D
ELIV
ERY
MO
DEL
S
Chapter 5 provides the lessons learned from this study to enable stakeholders to take actions within their own countries to transition towards a more sustainable future.
FIGURE 4.1. Percentage of adults (> 15 years) in rural areas borrowing and savings in 2014 (Global).
Source: FINDEX database.
Borrowed any moneyin the past year
Borrowed from a�nancial institution
Saved any money inthe past year
Saved at a �nancial institution
44%
9%
54%
24%
FIGURE 4.2. Percentage of adults (> 15 years) in rural areas borrowing and savings in 2014 (Sub-Saharan Africa).
Source: FINDEX database.
Borrowed any moneyin the past year
Borrowed from a�nancial institution
Saved any money inthe past year
Saved at a �nancial institution
54%
6%
57%
13%


229
LESS
ON
S LE
AR
NED
FR
OM
TH
E C
ASE
ST
UD
IES
MEASURING IMPACTS AND ENABLING INVESTMENTS IN ENERGY-SMART AGRIFOOD CHAINS
5. LESSONS LEARNED FROM THE CASE STUDIES
5.1 INSTRUMENTS TO PRIORITIZE ENERGY INTERVENTIONS BASED ON THEIR NET CO-BENEFITSThe CBA methodology devised by the INVESTA project can be a powerful tool for impact investors, donors and national decision-makers to focus their impact investments and to determine the level of (public) support needed to achieve development objectives. For that purpose, this section illustrates different analysis tools, based on the CBA approach, that could be applied to the 11 case studies presented in chapter 3.
Distribution of co-benefits and prioritization among clean energy interventions
The CBA of clean energy interventions in the agrifood sector can be used to analyse how economic benefits (financial benefits and co-benefits) and hidden costs are distributed. Figure 5.1 presents the distribution of economic benefits in the 11 case studies analysed in this study. Each energy interventions could have only benefits (from 0 to 100%) or only costs (0 to –100%). The net benefits are positive if the share above 0 is larger than the share below 0. The blue bar represents the financial benefit (or cost).
It is interesting to note that, depending on the country conditions and on the choice of benchmarks, the impact of the same energy intervention can be significantly different (see for example biogas for power generation in Tunisia and Kenya, or solar milk coolers in Tunisia, Kenya and Tanzania). Although the actual benefits can be significantly different in absolute terms, such a representation helps identify priorities for interventions in order to maximize a certain benefit. For example, if the objective of a donor or a development practitioner is to maximize the impact of investments on employment, interventions prioritized would be solar milk coolers in Tunisia, rice husk gasification in the Philippines or solar powered water pumping in Kenya. Likewise, a government actor may want to identify the energy intervention (or technology) that can maximize the impact on value added down the value chain in the country. In the case of Kenya,

230
LESS
ON
S LE
AR
NED
FR
OM
TH
E C
ASE
ST
UD
IES
MEASURING IMPACTS AND ENABLING INVESTMENTS IN ENERGY-SMART AGRIFOOD CHAINS
FIG
UR
E 5
.1.
Dis
trib
utio
n of
ben
efits
in t
he 1
1 ca
se s
tudi
es a
naly
sed
in t
his
stud
y in
Ken
ya, T
unis
ia, T
anza
nia
and
the
Phili
ppin
es.
100% 80%
60%
40%
20% 0%
– 20%
– 40%
– 60%
Wat
er u
se a
nd e
ffici
ency
Food
loss
GH
G e
mis
sion
sLa
nd r
equi
rem
ent
Subs
idie
s an
d ta
xes
Fina
ncia
l net
ben
efits
Foss
il fu
el c
onsu
mpt
ion
Acc
ess
to e
nerg
y
Valu
e ad
ded
alon
g
the
valu
e ch
ain
Empl
oym
ent
Tim
e sa
ving
Hou
seho
ld in
com
eFe
rtili
zer
use
Hea
lth r
isk
due
to
indo
or a
ir p
ollu
tion
Biogas for power generation – TUN
Biogas for power generation – KEN
Solar milk cooler – TAN
Domestic biogas milk chiller – KEN
Domestic biogas milk chiller – TAN
Solar milk cooler – TUN
Solar cold storage – KEN
Solar-powered water pumping – KEN
Rice husk gasification – PHI
Solar rice milling – PHI
Solar milk cooler – KEN
Not
e: T
he s
hare
s re
port
ed h
ere
take
into
acc
ount
onl
y th
e m
onet
ized
impa
cts.
Non
-mon
etiz
ed im
pact
s ca
n be
pos
itiv
e ,
have
unc
erta
in im
pact
,
or b
e ne
gati
ve
.
Sour
ce: A
utho
rs.

231
LESS
ON
S LE
AR
NED
FR
OM
TH
E C
ASE
ST
UD
IES
MEASURING IMPACTS AND ENABLING INVESTMENTS IN ENERGY-SMART AGRIFOOD CHAINS
the choice would fall on solar milk coolers, followed by domestic biogas milk chillers and solar cold storage for tomatoes and beans.
The approach to investments in (or support for) clean energy interventions in the agrifood chain can be useful to give an indication of net co-benefits and therefore to prioritize different options.
Financial versus economic returns
Figure 5.2 highlights the difference between the financial returns (blue bars) and economic returns (orange bars) for each clean energy intervention analysed in this study. The returns have been divided by the initial investment. Therefore, the graph highlights the returns for one unit of money invested (in this case 1 US$ in year 0). For interventions such as solar milk coolers, biogas for power generation in Tunisia, rice husk gasification and solar rice milling in the Philippines, economic returns (including net co-benefits) largely exceed financial benefits. In certain cases, such as rice husk gasification in the Philippines, solar milk coolers and biogas for power generation in Tunisia, each US$ invested corresponds to a negative return in financial terms at the end of the investment timeframe whereas the economic return is positive. This can be the case when the energy intervention leads to co-products or services (e.g. a soil amendment or the possibility to power small appliances in the household) which are not sold or traded (so have no financial value). Figure 5.1 displays the environmental and socio-economic variables contributing to this difference.

232
LESS
ON
S LE
AR
NED
FR
OM
TH
E C
ASE
ST
UD
IES
MEASURING IMPACTS AND ENABLING INVESTMENTS IN ENERGY-SMART AGRIFOOD CHAINS
FIG
UR
E 5
.2.
Fina
ncia
l and
eco
nom
ic r
etur
ns o
f the
11
ener
gy in
terv
entio
ns a
sses
sed
fo
r 1
US$
of i
nitia
l inv
estm
ent.
–2.0
–1.0
1.0
2.0
3.0
4.0
5.0
6.0
Wat
er u
se a
nd e
ffici
ency
ECO
NO
MIC
RET
UR
NS
FOR
1
US$
INV
EST
EDFo
od lo
ssFI
NA
NC
IAL
RET
UR
NS
FOR
1
US$
INV
EST
EDG
HG
em
issi
ons
Land
req
uire
men
tFo
ssil
fuel
con
sum
ptio
nA
cces
s to
ene
rgy
Empl
oym
ent
Tim
e sa
ving
Hou
seho
ld in
com
eFe
rtili
zer
use
Hea
lth r
isk
due
to
indo
or a
ir p
ollu
tion
Sola
r ri
ce m
illin
g –
PHI
Ric
e hu
sk g
asifi
catio
n –
PHI
Sola
r-po
wer
ed w
ater
pu
mpi
ng –
KEN
Sola
r co
ld s
tora
ge –
KEN
Dom
estic
bio
gas
milk
chi
ller
– TA
N
Dom
estic
bio
gas
milk
chi
ller
– K
EN
Sola
r m
ilk c
oole
r –
TAN
Sola
r m
ilk c
oole
r –
KEN
Sola
r m
ilk c
oole
r –
TU
N
Biog
as fo
r po
wer
ge
nera
tion
– K
EN
Biog
as fo
r po
wer
ge
nera
tion
– T
UN
0.0
Not
e: N
on-m
onet
ized
impa
cts
can
be p
osit
ive
, ha
ve u
ncer
tain
impa
ct
, or
be
nega
tive
.
Sour
ce: A
utho
rs.

233
LESS
ON
S LE
AR
NED
FR
OM
TH
E C
ASE
ST
UD
IES
MEASURING IMPACTS AND ENABLING INVESTMENTS IN ENERGY-SMART AGRIFOOD CHAINS
Mitigation costs
Using the same data on economic returns and tonnes of CO2eq saved by each clean energy intervention over the investment period, it is easy to calculate the mitigation cost, an important parameter to measure how effective the investments are in mitigating emissions. The results are reported in Figure 5.3. The mitigation cost is negative when the financial returns of the investment are positive and the technology contributes to GHG reduction. When the technology NPV is negative, its mitigation cost is positive (see for instance biogas for power generation and rice husk gasification). Just in one case (solar cold storage for vegetables in Kenya), as the technology is backed up by the grid, the intervention actually slightly increases the GHG emission compared to the benchmark situation. Hence, the mitigation cost is very negative despite the investment had a positive NPV.
Contribution to Sustainable Development Goals
Section 2.2 of this study and FAO and GIZ (2018) highlight the link between impact indicators and the specific targets under each SDG (Table ES.1). As such, it is possible to conclude that, if an energy intervention has a positive or negative impact on one indicator, it will also impact on the related SDGs. As an example, the impact that each energy intervention assessed in this study is having on SDG 8 (Promote sustained, inclusive and sustainable economic growth, full and productive employment and decent work for all) is shown in Figure 5.4. It highlights the share of total environmental and social benefits as well as costs associated with the implementation of an energy intervention with impact on SDG 8 (e.g. with biogas for power generation in Tunisia,
FIGURE 5.3. Greenhouse gas mitigation costs of the 11 energy interventions assessed.
300
200
100
0
–100
Biog
as fo
r po
wer
gene
ratio
n – T
UN
Biog
as fo
r po
wer
gene
ratio
n –
KEN
Solar
milk
coo
ler
– KE
N
Dom
estic
bio
gas
milk
chi
ller
– KE
N
Dom
estic
bio
gas
milk
chi
ller
– TAN
Solar
col
d st
orag
e –
KEN
Solar
-pow
ered
wat
er
pum
ping
– K
EN
Rice
hus
k
gasifi
catio
n –
PHI
Solar
rice
milli
ng –
PH
I
– 200
– 300
– 400
US$
/t C
O2e
q
Source: Authors.

234
LESS
ON
S LE
AR
NED
FR
OM
TH
E C
ASE
ST
UD
IES
MEASURING IMPACTS AND ENABLING INVESTMENTS IN ENERGY-SMART AGRIFOOD CHAINS
38% of the benefits is linked to SDG 8 while the remaining 62% is not). If targets under SDG 8 are to be promoted, the interventions ‘solar milk coolers’ in Tunisia and Tanzania, ‘solar cold storage’ for vegetables in Kenya and rice husk gasification in the Philippines should be prioritized104.
104 The impact on SDG 8 of ‘solar milk coolers’ in Kenya is less relevant than in Tanzania and Tunisia, since in Kenya it is assumed that this technology is introduced in existing MCCs, therefore no direct jobs are created along the value chain (see Section 3.1.3).
FIGURE 5.4. Contribution of the 11 energy interventions assessed to SDG 8.
100%
90%
80%
70%
60%
50%
40%
30%
20%
10%
0%
Biog
as fo
r po
wer
gene
ratio
n – T
UN
Biog
as fo
r po
wer
gene
ratio
n –
KEN
Solar
milk
coo
ler
– TU
NSo
lar m
ilk c
oole
r –
KEN
Solar
milk
coo
ler
– TAN
Dom
estic
bio
gas
milk
chi
ller
– KE
ND
omes
tic b
ioga
s
milk
chi
ller
– TAN
Solar
col
d st
orag
e –
KEN
Solar
-pow
ered
wat
er
pum
ping
– K
ENRi
ce h
usk
gasifi
catio
n –
PHI
Solar
rice
milli
ng –
PH
ISDG 8 Others
Note: SDG 8 is “Promote sustained, inclusive and sustainable economic growth, full and productive employment and decent work for all”. This analysis takes into account only the monetized environmental and social impacts.
Source: Authors.
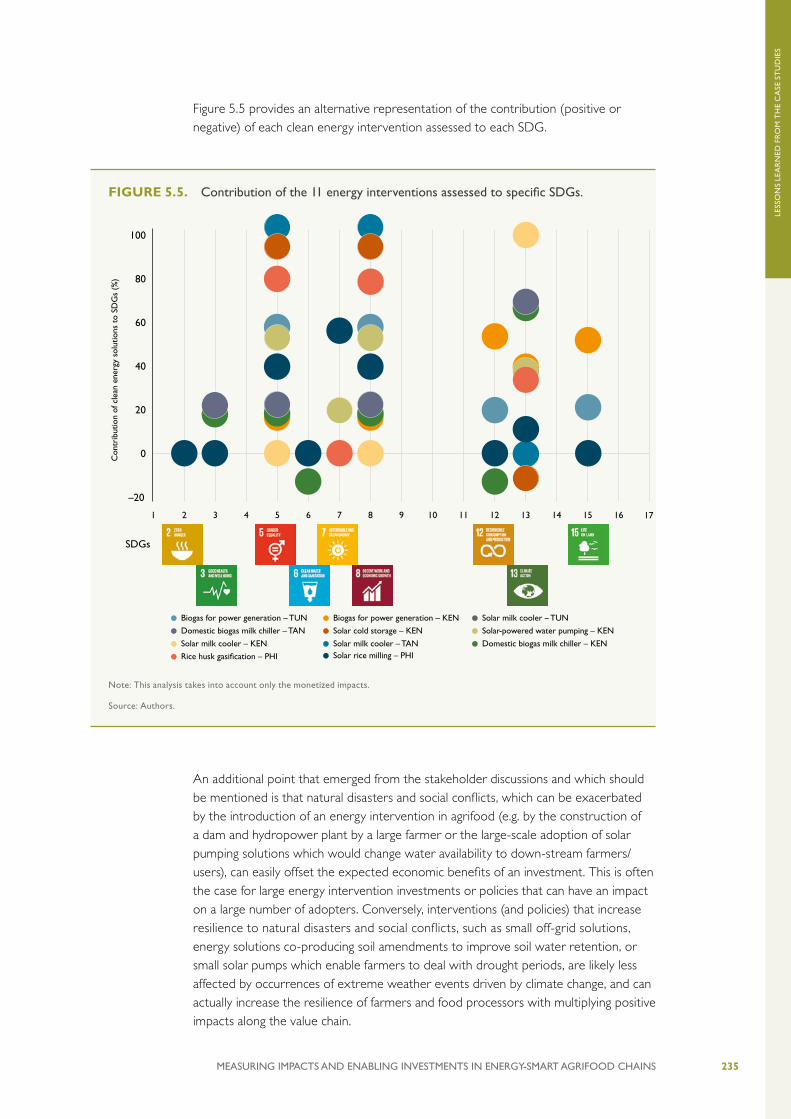
235
LESS
ON
S LE
AR
NED
FR
OM
TH
E C
ASE
ST
UD
IES
MEASURING IMPACTS AND ENABLING INVESTMENTS IN ENERGY-SMART AGRIFOOD CHAINS
Figure 5.5 provides an alternative representation of the contribution (positive or negative) of each clean energy intervention assessed to each SDG.
An additional point that emerged from the stakeholder discussions and which should be mentioned is that natural disasters and social conflicts, which can be exacerbated by the introduction of an energy intervention in agrifood (e.g. by the construction of a dam and hydropower plant by a large farmer or the large-scale adoption of solar pumping solutions which would change water availability to down-stream farmers/users), can easily offset the expected economic benefits of an investment. This is often the case for large energy intervention investments or policies that can have an impact on a large number of adopters. Conversely, interventions (and policies) that increase resilience to natural disasters and social conflicts, such as small off-grid solutions, energy solutions co-producing soil amendments to improve soil water retention, or small solar pumps which enable farmers to deal with drought periods, are likely less affected by occurrences of extreme weather events driven by climate change, and can actually increase the resilience of farmers and food processors with multiplying positive impacts along the value chain.
FIGURE 5.5. Contribution of the 11 energy interventions assessed to specific SDGs.
Con
trib
utio
n of
cle
an e
nerg
y so
lutio
ns t
o SD
Gs
(%)
Biogas for power generation – TUN
Solar milk cooler – KEN
Domestic biogas milk chiller – TAN
Rice husk gasification – PHI
Domestic biogas milk chiller – KEN
Solar milk cooler – TUN
Solar-powered water pumping – KEN
Solar milk cooler – TANSolar rice milling – PHI
Biogas for power generation – KEN
Solar cold storage – KEN
0
60
80
100
40
20
–20
SDGs
4 9 11 1410 16 171 2 3 5 6 7 8 12 13 15
Note: This analysis takes into account only the monetized impacts.
Source: Authors.

236
LESS
ON
S LE
AR
NED
FR
OM
TH
E C
ASE
ST
UD
IES
MEASURING IMPACTS AND ENABLING INVESTMENTS IN ENERGY-SMART AGRIFOOD CHAINS
5.2 INSTRUMENTS TO DETERMINE LEVEL OF PUBLIC SUPPORTIn this report, the difference between financial and economic returns were highlighted on several occasions, as well as the fact that economic net benefits are often much higher than financial benefits. However, it has not yet been explained how the level of support for an energy intervention required to make the investment attractive from a financial point of view and still bring positive net economic returns (i.e. support, for example, in terms of subsidies, which is lower than the non-financial co-benefits), can be determined. From a sustainable development perspective, this is a useful information to determine, for example, the amount of matching grants for investments or public support. A sensitivity analysis can serve the purpose and is illustrated below for the relevant case studies.
EXAMPLE: FEED-IN TARIFF FOR BIOGAS FOR POWER GENERATION FROM CATTLE MANURE IN TUNISIAIn Tunisia, the cost of electricity from grid is around TND 0.15/kWh (US$ 0.07/kWh) and electricity is heavily subsidized. By removing the direct subsidy of US$ 0.06/kWh (Alcor, 2014), the actual cost of electricity would be around US$ 0.13/kWh (2016 data). As Figure 5.6 shows, with a non-subsidized price of electricity (e.g. a grid electricity price above US$ 0.12/kWh), the NPV would be around US$ 38,000.
FIGURE 5.6. Financial NPV of biogas for power in Tunisia according to the cost of grid electricity.
0
100
50
–500 0.04 0.05 0.060.01 0.02 0.03 0.07
–100
–150
–200
–250
Direct subsidy on electricity from the grid (US$/kWh)
–300
–350
– 400
Fina
ncia
l NPV
(th
ousa
nd U
S$)
Note: Grey line indicates actual value of subsidies
Source: Authors.

237
LESS
ON
S LE
AR
NED
FR
OM
TH
E C
ASE
ST
UD
IES
MEASURING IMPACTS AND ENABLING INVESTMENTS IN ENERGY-SMART AGRIFOOD CHAINS
On the other hand, the policy-maker could choose to increase the price paid for electricity generated by biogas for power. Currently STEG pays about US$ 0.07/kWh generated and sold to the grid. Figure 5.7 shows that a feed-in tariff higher than US$ 0.17/kWh would be required in order to make the investment financially viable.
A FiT, which is a cost in terms of public expenditures, would be justified so long as the cost remains below the net co-benefits brought by the adoption of the technology. In Tunisia the net co-benefits were estimated to be worth US$ 86 million. Therefore, a FiT up to US$ 0.185/kWh could be justified, corresponding to a financial IRR of 10% and a financial NPV of US$ 19,132, which would make the investment moderately attractive for investors105 (Figure 5.8).
105 Please note that in this and following examples, the non-monetized impacts are not taken into account.
FIGURE 5.7. Financial NPV of biogas for power in Tunisia according to the price paid for electricity produced by the biogas plant.
300
0.05 0.13 0.15 0.170.07 0.09 0.11 0.19 0.21 0.23 0.25
200
100
0
–100
Biogas electricity selling price (US$/kWh)
–200
–300
– 400
Fina
ncia
l NPV
(th
ousa
nd U
S$)
Source: Authors.

238
LESS
ON
S LE
AR
NED
FR
OM
TH
E C
ASE
ST
UD
IES
MEASURING IMPACTS AND ENABLING INVESTMENTS IN ENERGY-SMART AGRIFOOD CHAINS
By way of comparison, in the case of Kenya, there is already an existing FiT for electricity from biogas for power generation of US$ 0.10/kWh. With a FiT slightly above US$ 0.11/kWh, the IRR would be higher than the discount rate for Kenya of 11%. This would make the investment viable, however, the cost to society would be about US$ 2.8 million/year, which is higher than the co-benefit value of the technology (import duty, digestate use, GHG emission reduction and employment creation). Therefore, the investment would be even less interesting from an economic point of view.
EXAMPLE: PRICE PREMIUM FOR QUALITY COOLED MILK IN TUNISIAWithout a price premium for cooled milk, farmers in Tunisia receive US$0.336/litre (TND 0.776/litre) and the investment in a solar milk cooler does not pay back from a financial point of view. Figure 5.9 shows that with a price premium for cooled milk that brings the price paid at the collection centre above US$ 0.341/litre, the financial NPV of the investment turns positive. With a price premium of about US$ 0.015/litre, the payback time is reduced to about 10 years and the IRR is 14%.
FIGURE 5.8. National cost of feed-in tariff for the case study ‘biogas for power from dairy cattle manure’ in Tunisia and financial IRR.
120
100
80
60
40
20
0
Nat
iona
l cos
t (m
illio
n U
S$/2
0 ye
ars)
0.02
0.00
0.07 0.09 0.11 0.13 0.15 0.17 0.19 0.21 0.23 0.25
0.06
0.04
0,10
0.08
0.12
0.14
IRR
(%
)
Electricity selling price (US$/kWh)
The FiT cost is NOT justifi ed in economic terms
The FiT cost is justifi ed in economic terms
National cost IRR
– 0.02
Note: The case study project installed 73 biogas systems.
Source: Authors.
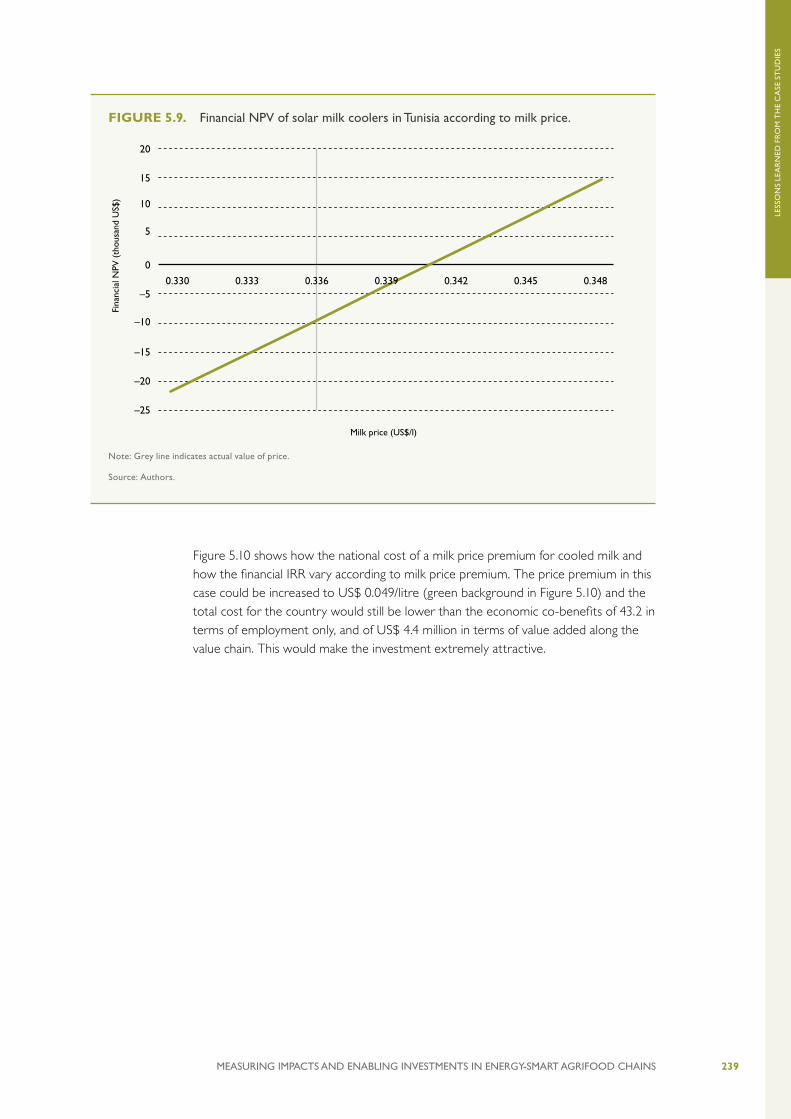
239
LESS
ON
S LE
AR
NED
FR
OM
TH
E C
ASE
ST
UD
IES
MEASURING IMPACTS AND ENABLING INVESTMENTS IN ENERGY-SMART AGRIFOOD CHAINS
Figure 5.10 shows how the national cost of a milk price premium for cooled milk and how the financial IRR vary according to milk price premium. The price premium in this case could be increased to US$ 0.049/litre (green background in Figure 5.10) and the total cost for the country would still be lower than the economic co-benefits of 43.2 in terms of employment only, and of US$ 4.4 million in terms of value added along the value chain. This would make the investment extremely attractive.
FIGURE 5.9. Financial NPV of solar milk coolers in Tunisia according to milk price.
15
20
10
5
0
–5
–10
Milk price (US$/l)
–15
–20
–25
Fina
ncia
l NPV
(th
ousa
nd U
S$)
0.330 0.342 0.3450.333 0.336 0.339 0.348
Note: Grey line indicates actual value of price.
Source: Authors.

240
LESS
ON
S LE
AR
NED
FR
OM
TH
E C
ASE
ST
UD
IES
MEASURING IMPACTS AND ENABLING INVESTMENTS IN ENERGY-SMART AGRIFOOD CHAINS
The figures presented below report a similar analysis for other energy interventions analysed in this study. Only those were considered that show low financial profitability but a positive economic net benefit, namely the introduction of solar milk coolers in Tanzania and Kenya.
FIGURE 5.10. National cost of a price premium for cooled milk for the case study ‘solar milk coolers’ in Tunisia and financial IRR.
30
25
20
15
10
5
0
Nat
iona
l cos
t (m
illio
n U
S$/2
0 ye
ars)
5
0
0.0 0.3 0.6 0.9 1.2 1.5 1.8 2.1 2.3
15
10
25
20
IRR
(%
)
Price premium (US$ cent/I)
The price premium is NOT justifi ed in economic terms
The price premium is justifi ed in economic terms
National cost million US$ Financial IRR (%)
45
40
35
Note: The case study project installed 580 solar milk coolers.
Source: Authors.

241
LESS
ON
S LE
AR
NED
FR
OM
TH
E C
ASE
ST
UD
IES
MEASURING IMPACTS AND ENABLING INVESTMENTS IN ENERGY-SMART AGRIFOOD CHAINS
FIGURE 5.11. National cost of a price premium for cooled milk for the case study ‘solar milk coolers’ in Tanzania and financial IRR.
0 8 10 122 4 6 14 16 18
30
25
20
15
Price premium (US$ cent/l)
10
5 20
0
40
60
80
100
120
140
0
45
40
The price premium is NOT justified in economic terms
35
Nat
iona
l cos
t (m
illio
n U
S$/2
0 ye
ars)
IRR
(%
)
National cost Financial IRR (%)
The price premium is justified in economic terms
Note: The case study project installed 128 solar milk coolers.
Source: Authors.
FIGURE 5.12. National cost of a price premium for cooled milk for the case study ‘solar milk coolers’ in Kenya and financial IRR.
0 8 10 122 4 6 14 16 18
2.0
1.5
Price premium (US$ cent/l)
1.0
0.5
2
0
4
6
8
10
12
20
16
18
14
0
2.5The price premium is NOT justified in economic terms
Nat
iona
l cos
t (m
illio
n U
S$/2
0 ye
ars)
IRR
(%
)
National cost Financial IRR (%)
The price premium is justified in economic terms
Note: The case study project installed 125 solar milk coolers.
Source: Authors.

242
LESS
ON
S LE
AR
NED
FR
OM
TH
E C
ASE
ST
UD
IES
MEASURING IMPACTS AND ENABLING INVESTMENTS IN ENERGY-SMART AGRIFOOD CHAINS
In the example of Figure 5.11, net co-benefits amount to US$ 17.3 million at national level and therefore a public support to increase the price of cooled milk up to US$ 0.18/litre may be justified. This would make the investment highly attractive (financial IRR above 100%).
Likewise, in the example of Figure 5.12, net co-benefits amount to US$ 1.32 million at national level and a price premium up to around US$ 0.12/litre may be justified in economic terms. This would bring the investment to a financial IRR of around 17%.
This type of analysis can help decision-makers get a clearer picture as to what extent a support subsidy for a given kind of clean energy intervention is justified in economic terms, and therefore inform investment decisions and planning.
5.3 GENDER ANALYSIS FOR CLEAN ENERGY INTERVENTIONS IN AGRIFOOD CHAINSThis section identifies lessons learned about the impact of the clean energy interventions in agrifood value chains on gender issues, as well as the main instruments to promote gender equality and women’s empowerment.
Table 5.1 provides a comparative analysis of the case studies described in chapter 3. It shows the gender balance of participants in the steps of each value chain using a colour code. Moreover, the table indicates where and what type of impact a given energy intervention would have for women and/or men.
Women account for almost half of the agricultural labour force in developing countries and should be specifically targeted in clean energy interventions. © GIZ/Michael Tsegayeg

243
LESS
ON
S LE
AR
NED
FR
OM
TH
E C
ASE
ST
UD
IES
MEASURING IMPACTS AND ENABLING INVESTMENTS IN ENERGY-SMART AGRIFOOD CHAINS
TABLE 5.1. Comparative analysis of the impact on gender issues of the 11 clean energy interventions assessed.
Value chain
Energy intervention Value chain steps
Inputs Production Transport &Collection
Storage & Handling
Processing Outside the VC
Milk
Biogas for power generation from dairy cattle manure – Tunisia
+ EMP men
Biogas for power generation from dairy cattle manure – Kenya
+ EMPmen
Solar milk cooler – Tunisia
+ HHYMEN & women
+ EMPmen
Solar milk cooler – Tanzania
+ HHYMEN & women
+ EMPmen
Solar milk cooler – Kenya
+ HHYwomen&men
+ EMPmen
Biogas domestic milk chiller – Tanzania
– TSVwomen
+ AENwomen & men+ HHYMEN & women
+HLT/AEN/TSVwomen+ EMPmen
Biogas domestic milk chiller – Kenya
– TSVwomen
+ AENwomen & men+HHYWOMEN & men
+HLT/AEN/TSVwomen+ EMPmen
Vege
tabl
e
Solar cold storage – Kenya
+ HHYMEN & women
– TSVMEN & women
+ EMPmen
Solar powered water pumping – Kenya
+ TSVmen
+ HHYmen
+ AENmen+ EMPmen
Ric
e
Rice husk gasification – Philippines
+ EMPmen
Solar powered domestic rice processing – Philippines
+ HHYWOMEN & men
+ TSVwomen
+ HHYwomen & men– TSVwomen
+ AENmen+ EMPmen
Notes: Colour code showing the gender balance in the steps of each value chain:
Only male participants
Equal number of male and female participants
Only female participants
Mainly male and fewer female participants
Mainly female and fewer male participants
The impact indicatwfected by the energy intervention and whether they affect men and/or women are identified and shown in the relevant step of the value chain. Positive and negative impacts are presented by a plus and a minus sign, respectively. If the impact only affects one gender, only men or women are mentioned. If the impact affects both genders, both are mentioned. If the impact notably affects one gender more than the other, it is expressed in bold type. The impact indicators are abbreviated: HLT – Health risk due to indoor air pollution; AEN – Access to energy; HHY – Household income; TSV – Time saving; EMP – Employment.
Source: Authors.

244
LESS
ON
S LE
AR
NED
FR
OM
TH
E C
ASE
ST
UD
IES
MEASURING IMPACTS AND ENABLING INVESTMENTS IN ENERGY-SMART AGRIFOOD CHAINS
A short summary of the gender impacts by energy intervention is provided below:
• Biogas for power generation from dairy cattle: This CES has the potential to provide a significant amount of skilled full-time and long-term technician jobs nationwide in relevant middle- and low-income countries. The impact on gender issues depends on the balance of men and women employed as technicians. The case studies in Tunisia and Kenya suggest that there may be a lack of local labour with the required training and skill set available and that those available are nearly all men. There are instruments available to overcome these barriers in the long-term, see below (section ‘Instruments to foster investments’).
• Solar milk coolers: This CES represents an interesting opportunity to increase the incomes of smallholder dairy farmers. The extent to which both men and women, or male- and female-headed households, benefit from this is context-specific and closely linked to who controls livestock related income at home and who are the members of dairy cooperatives. For example, research suggests that in Kenya, dairy cooperatives can be evenly mixed or include mainly men or mainly women, and that, at home, women control income they earn from milk sales. At scale, women therefore stand to benefit fairly from increased income generated by dairy cooperatives compared to men. The situation differs in Tunisia and Tanzania, where men make up most dairy cooperative members and control income from milk at home, although there is evidence that this is changing in Tanzania. Equitable access to dairy cooperatives is a prerequisite for pro-poor and gender equitable smallholder dairy development. It is also particularly important in certain rural areas experiencing the out-migration of men. The supply chain of solar milk coolers would provide significant employment in a country. As mentioned above, the employment of women as well as men in technical/field/operational roles can be challenging in developing countries, see possible instruments to overcome this below.
• Biogas domestic milk chillers: The analysis suggests that the widespread adoption of biogas domestic chillers and cookstoves could lead to multiple benefits for men and women, although there are several barriers to gender equality to address. The system improves household access to energy for milk cooling and cooking. In many countries, female-headed households may find it harder to purchase the technology compared to male-headed households owing to poorer access to information and credit, unless enabling instruments are put in place, see below. The extent to which men and women benefit from an increase in income from sales of milk and digestate is context-specific and closely linked to who controls what income at home. For example, research suggests that relatively more women in male-headed households in Kenya have sole control of the income from their milk sales or make joint decisions with men about how to spend the money, than in Tanzania. With continued efforts to empower women at home, the increase in household income from this intervention, at scale, has the potential to economically empower many rural women, improving their standing in society. In addition, the biogas powered cookstoves bring significant benefits to women: health improvements from no longer or less cooking with fuelwood and breathing

245
LESS
ON
S LE
AR
NED
FR
OM
TH
E C
ASE
ST
UD
IES
MEASURING IMPACTS AND ENABLING INVESTMENTS IN ENERGY-SMART AGRIFOOD CHAINS
in harmful smoke, as well as time saved from reduced or no more fuelwood collection for cooking. However, the time saved by women may be lost if they are also responsible for fetching water on a daily basis for the biogas digester, and there is inadequate access to water for households in terms of accessibility (on-site, nearby or distant), reliability of supply, cost of water, and method of hauling water (foot, donkey, wheelbarrow). An enabling environment would require investment in and/or promotion of improved access to sustainable water supplies for multiple uses by farmers. The supply chain of biogas powered domestic chillers and cookstoves would provide significant employment in a country. As mentioned above, the employment of women as well as men in technical/field/operational roles can be challenging in developing countries, see possible instruments to overcome this below.
• Solar cold storage interventions for tomatoes and beans: Farmers that cultivate and manage cash crops and belong to farmers’ associations that own the technology stand to benefit. Men are traditionally responsible for cash crops and members of farmer associations, so they will benefit more from the increased revenue generated than women. However, in countries, such as Kenya, where women have increasingly more power and agency at home due to changing gender roles, relations and/or the out-migration of men from rural areas, women are becoming more often responsible for cash crops. Providing that these women are empowered and encouraged to participate in farmer associations, women could also benefit from solar cold storage interventions and bring home higher incomes. Men or women responsible for the cash crop may need to transport their produce more frequently than before from farm to the cold storage, or pay somebody else to do so, creating local work opportunities. The supply chain of biogas-powered domestic chillers and cookstoves would provide significant employment opportunities for skilled and unskilled workers. As mentioned above, the employment of women as well as men in technical/ field/operational roles can be challenging in developing countries, see possible instruments to overcome this under employment below.
• Solar-powered water pumping: Men are generally the main owners, operators, maintenance workers and beneficiaries of irrigation systems in many contexts. Barriers to irrigation systems for women vary but often include one of more of the following: no or limited ownership of land; no or poor access to credit; lack of information and understanding (from lower levels of literacy and technical training and lower mobility) about opportunities and new technologies; and no or limited access to water user associations. In many situations, men are therefore more likely to learn about, purchase, operate and maintain the solar pumps than women, unless enabling measures are put in place. Men are therefore more likely to benefit from the interventions in terms of: avoided fuel costs from not using diesel-powered pumps; time saving during pumping because they do not have to be present; and control and use of the mobile charging unit. It is important to note however that women who rely on rainfed farming or manual irrigation from male- and female-headed households that are facilitated to buy,

246
LESS
ON
S LE
AR
NED
FR
OM
TH
E C
ASE
ST
UD
IES
MEASURING IMPACTS AND ENABLING INVESTMENTS IN ENERGY-SMART AGRIFOOD CHAINS
operate and maintain the solar water pump, could benefit from: improved access to modern energy for water pumping; improved yields and higher income from market sales; increased amount of nutritious food available for the family; and time savings from no longer manually irrigating the land. Enabling measures are elaborated below and include literacy training, social empowerment training, and improved access to extension services, land and credit. The supply chain of solar-powered water pumps would provide significant employment in a country. As mentioned above, the employment of women as well as men in technical/field/operational roles can be challenging in developing countries, see possible instruments to overcome this below.
• Rice husk gasification intervention: This CES has the potential to provide a small amount of skilled employment to operate, clean and maintain the systems. The impact on gender issues depends on the balance of men and women employed as technicians. The case study in the Philippines suggests that there can be a lack of local labour with the required training and skill set available, particularly in remote areas, and that those available are nearly all men. However, there are instruments available to overcome these barriers in the long term, see below.
• Solar-powered domestic rice processing: Like for irrigation technology, men are generally the main owners, operators and maintenance workers of mechanical processing systems. Women are usually less able to purchase the machinery owing to: no or limited ownership of land and therefore less access to credit; heavy workloads undertaking domestic chores and manual subsistence activities on-farm that restrict time for more productive activities; and social norms, such as men should use machinery. However, apart from business entrepreneurs, also rice cooperatives (women-only or mixed) can buy, operate and maintain village-based solar milling services that can ensure that their members have reliable and affordable access. The case study in the Philippines showed that women are responsible for the production and post-production of rice. They are therefore the main beneficiaries of the increased income generated by using the solar-powered rice processing system thanks to the reduction in rice broken after switching from diesel-powered milling services. Furthermore, the possibility of installing solar mills in smaller villages can significantly reduce the time spent by women transporting the rice to and from distant locations with mechanized rice mills. Businessmen that own the technology could benefit from the use of the outlet to power small electrical appliances. Men stand to benefit from the employment opportunities in the supply chain for solar-powered rice processing systems more than women owing to prevailing gender inequalities. See below for instruments to overcome this barrier. It is important to note that in small off-grid villages where the technology is most applicable, women from poor male- and femaleheaded households may mill rice manually or travel significant distances to pay for mechanized diesel-powered milling services. Through enabling measures to promote gender equality in these
247
LESS
ON
S LE
AR
NED
FR
OM
TH
E C
ASE
ST
UD
IES
MEASURING IMPACTS AND ENABLING INVESTMENTS IN ENERGY-SMART AGRIFOOD CHAINS
villages, solar-powered rice mills have the potential to provide poor farming households, in particular the women, with accessible and affordable access to modern energy services for milling, as well as for charging or running small electrical appliances. The switch from manual to solar-powered rice milling increases the productivity of processing tasks performed by women who are then able to sell more rice and generate a higher income. Solar mills can also save significant amounts of women’s time otherwise spent manually milling rice.
Women farmers are commonly under-targeted and underserved in traditional and clean energy interventions. Yet, female customers, like male customers, represent business, financial and social sense to the private sector, development agencies and the government. Women account for almost half of the agricultural labour force in developing countries and in some rural areas the out-migration of men is leaving increasing numbers of women in charge of the farm, and hence purchasing decisions. Women are also the fastest growing group of entrepreneurs and business owners in developing countries (Gill et al., 2012). Many investors require businesses and projects looking for funding to mainstream gender considerations throughout their operations, and to monitor and report on gender outcomes.
5.4 DATA AVAILABILITYOne objective of the INVESTA project is to assess the available data needed to perform the analysis in order to make the methodology replicable. Ideally, it would be possible to perform the assessment using country-specific data taken from publicly available databases such as FAOSTAT, UN DATA, ILOSTAT or the World Bank Open Data database. However, the publicly available data, and even the official data that could be retrieved during field missions, was only a minor share of the data needed.
Figure 5.13 and Figure 5.14 report the share of data used in the case studies obtained from a public international database (using official data), from official data available in the country, from the literature and from expert opinion, disaggregated by value chain and by country (this latter only for the milk value chain case studies, the only value chain assessed in more than one country). Only around 30% of all data needed could be retrieved from an international source (database) and around 40% had to be sourced from the available literature.

248
LESS
ON
S LE
AR
NED
FR
OM
TH
E C
ASE
ST
UD
IES
MEASURING IMPACTS AND ENABLING INVESTMENTS IN ENERGY-SMART AGRIFOOD CHAINS
FIGURE 5.13. Sources of data used for the CBAs in the 11 case studies assessed.
100%
90%
80%
70%
60%
50%
40%
30%
20%
10%
0%
International source Official data from Government Other literature Expert opinion
Total 3 VCs Total Milk Total Vegetables Total Rice
Source: Authors.
FIGURE 5.14. Sources of data used for the CBAs in the 7 milk value chain case studies assessed.
100%
90%
80%
70%
60%
50%
40%
30%
20%
10%
0%
International source Official data from Government Other literature Expert opinion
Kenya Tanzania Tunisia
Source: Authors.

249
LESS
ON
S LE
AR
NED
FR
OM
TH
E C
ASE
ST
UD
IES
MEASURING IMPACTS AND ENABLING INVESTMENTS IN ENERGY-SMART AGRIFOOD CHAINS
This analysis presented above summarizes the data availability analysis performed for each case study in chapter 3. It demonstrates that there are significant gaps in terms of data collection and open share of data and statistics. These gaps are progressively being filled by international initiatives such as the System of Environmental-Economic Accounting Central Framework (SEEA-CF)106 which aims to aggregate and put in relation environmental and economic statistics (e.g. in a single relational database). FAO is leading the development of the System of Environmental-Economic Accounting for Agriculture, Forestry and Fisheries (SEEA-AFF), a statistical framework that facilitates description and analysis of agriculture, forestry and fisheries as economic activities and their relationship with the environment107. The SEEA-AFF extends to these primary sectors the environmental-economic structure and principles of the SEEA-CF, the official UN statistical standard. Another important instrument, which is available to countries to improve their statistical reporting system, is the Global strategy to improve agricultural and rural statistics108, a FAO programme to support its member countries. Besides these instruments which relate to the agriculture sector, similar instruments exist to assess the environmental and social country data and statistics needed for the CBA of clean energy interventions in the agrifood chain.
5.5 INSTRUMENTS TO FOSTER INVESTMENTSSince energy interventions in agrifood value chains are cross-cutting, the instruments to foster investments are often common to other sectors. The linkages with the renewable energy and energy efficiency sector are very strong109. Moreover, national incentives for the clean energy sector exist in several countries which are applicable and influence the attractiveness of energy interventions in the agrifood chain. Other instruments to foster investments in energy technologies for agrifood are very country-specific and are linked to the simplification of the regulatory environment110.
106 See https://unstats.un.org/unsd/envaccounting/seea.asp for more information on the SEEA.
107 More information on the SEEA-AFF is available at http://www.fao.org/economic/ess/environment/methodology/en/
108 See http://www.fao.org/economic/ess/ess-capacity/ess-strategy/en/
109 For example, the financial attractiveness of the energy technologies in the milk value chain assessed in Tunisia is strictly linked to the energy sector regulation. In 2016, Tunisia had a law on energy conservation which gave the possibility to the private sector to produce renewable electricity for own consumption, and to feed the electricity surplus into the grid within the limits of 30% of the electricity produced annually. STEG exclusively buys this electricity at domestic market prices and no specific incentives were available to promote mass-scale production (Reegle, 2012). The government determines the purchase prices in annual terms (RCREEE, 2013). Tunisia did not have long-term PPAs neither feed-in tariffs for renewable energy. A FiT for electricity was only possible on the basis of ad-hoc contracts between private producers and STEG (Kurokawa et al., 2007). However, this law has been revised during the preparation of this report, and today it is possible to exceed the 30% limit mentioned above. This would significantly change the analysis results.
110 For example, the institutional setup of the dairy industry in Tanzania is quite complex with multiple regulatory frameworks, policies and related institutions and policy makers involved. There is quite a number of overlaps of functions and mandates of some of the regulatory agencies, especially those responsible for food quality and safety i.e. Tanzania Food and Drugs Authority (TFDA), Tanzania Bureau of Standards (TBS) and the Government Chemist Laboratory Agency (GCLA), Department of Veterinary Services (DVS), Tanzania Dairy Board and Local Government Authorities by-laws. There have been concerted efforts by stakeholders, particularly the milk processors organization working in collaboration with TFDA, to try and influence some policy changes regarding taxation, inspection, registration and related fees.

250
LESS
ON
S LE
AR
NED
FR
OM
TH
E C
ASE
ST
UD
IES
MEASURING IMPACTS AND ENABLING INVESTMENTS IN ENERGY-SMART AGRIFOOD CHAINS
Barriers to financial service provision
Choosing the adequate instrument depends on the particular barrier that needs to be tackled. Based on this study, different catagories of barriers to financial service provision were identified.
Low awareness of available energy solutions: The main findings from the field visits and meetings concerning instruments available to foster investments often stress the importance of training and raising awareness of the available clean energy solutions among smallholders and food processors. In particular, farmer groups and cooperatives are identified as good entry points to foster the adoption of good practices and clean technologies.
Costs can be optimized and the purchasing power of value chain actors improved, for example, by strengthening farmer networks to create economies of scale (aggregation of outputs) and enhance the collective bargaining and purchasing power of their members. As a result, members will be able to buy inputs at more reasonable prices due to volume discounts; access output markets; and access credit through microfinance institutions and commercial banks to sustain their investments (World Bank, 2016f).
Risk management and mitigation strategies: However, clean energy interventions have often a positive impact also for other actors of the value chain. It is therefore important to understand how access to markets and financial services can be increased by collaboration of the different VC actors. Establishing and tightening linkages within these actors is particularly important in agriculture, to mitigate production and market risks. This also requires enabling access to risk management tools and information for farmers.
Transaction costs and deferred payments: Value could also be added optimizing transaction costs and deferring payments among value chain actors. It is important to find win-win collaborative arrangements to reduce product delivery cost and improve the cooperation among actors working closer to potential clients. This is particularly relevant for the energy interventions that have a direct impact on the product quality (e.g. solar cold storage for vegetables or milk cooling technologies). Market inefficiencies that contribute to these product delivery costs include lack of storage in wholesale markets leading to product loss, overcrowding and congestion in market places, and price volatility.
Lack of capacity to assess business opportunities: Often, value chain actors do not adopt energy technologies because they have too low profits due to a lack of capacity to assess the business opportunities. This is gradually improving due to the recent availability of quality and quantity data (as a result of new platforms, IT, etc.) which were not available to small farmers and processors in the past. A lack of coordination between actors as well as inefficiencies in institutional structures force more actors than necessary to be involved in marketing activities and enables actors to cheat or otherwise engage in collusion and other rent-seeking activities (USAID, 2013). For example, in Kenya, the use of new technologies such as mobile banking, GPS and weather stations is significantly changing the flow of information available to all value

251
LESS
ON
S LE
AR
NED
FR
OM
TH
E C
ASE
ST
UD
IES
MEASURING IMPACTS AND ENABLING INVESTMENTS IN ENERGY-SMART AGRIFOOD CHAINS
chain actors. These technologies also allow the identification of alternatives to traditional collateral-based lending as, for example, they allow value chain actors without a track credit history to demonstrate their financial solvency who thus access credits at lower interest rates.
In Kenya for example, most farmers and SMEs rely on family and friends to stay in business, microfinance from banks (such as Equity, Kenya Women Finance Trust and Kenya Commercial Bank) or statutory bodies such as the Kenya Investment Authority (KenInvest) that have the main objective of promoting investments in Kenya through the implementation of new investment projects111. However, the cost of financing is very expensive, ranging from 13% to above 20% annually, making it very difficult to profit from the energy interventions. This creates shortcuts in best practices and deviations from standard operating procedures leading to lower quality products (GCCA, 2016).
Lack of complex products to meet demand: Finally, the adoption of new energy technologies helps producers and processors to diversify from the standardized general products, which do not fit to the complexity of the agribusiness environment and the actual consumer demand. Value chain analysis, mapping and client-centred design could justify the investment in the energy technology (e.g. in solar milk cooling technologies to produce higher value dairy products or in solar water pumping to allow the production of higher value crops).
TABLE 5.2. Main barriers to financial service provision for clean energy technologies and possible solutions.
111 A list of Agricultural Credit Services by Equity and AFC Banks is available in table 8 of the FAO publication “Kenya: Irrigation market brief” available at http://www.fao.org/3/a-i5074e.pdf
Main barriers to financial services provision
Possible solutions to overcome them
Low awareness of the available energy solutions
Provide training and campaigns through farmers’ groups and cooperatives
High risk and weak risk management and mitigation strategies
Production risks: enable access to risk management tools and information for farmersMarket risks: establish and tighten linkages between the value chain actors and align trade policies and strategies
High costs due to transaction costs and deferred payments
Cooperation with actors working closer to potential clients established through value chain linkagesFind win-win collaborative arrangements to reduce product delivery costs
Low profit/lack of capacity to assess business opportunities
New availability of qualitative and quantitative data (new platforms, IT, etc.)Use of technologies: mobile banking, GPS, weather stationsIdentify alternative to collateral-based lending
Standardized general products that do not fit to the complexity of the agribusiness environment
Value chain analysisMappingClient-centred design
Source: Authors.

252
LESS
ON
S LE
AR
NED
FR
OM
TH
E C
ASE
ST
UD
IES
MEASURING IMPACTS AND ENABLING INVESTMENTS IN ENERGY-SMART AGRIFOOD CHAINS
Key elements to innovative agricultural financeOne important conclusion from the national stakeholder meetings is that credit alone will not improve productivity unless it is combined with relevant technical proposals. The weaknesses and risks found in agriculture are not solved by financial institutions with financial products. Credit by itself does not make the wheat grow taller, and agricultural insurance does not stop the weather from destroying the crop. To have an impact on the agrifood sector, financial services must be structured to induce farmers and processors to make innovations in their operations.
The key elements to innovative agricultural finance are (Jessop et al., 2012):
(i) reduced delivery costs (efficient lending methodologies, technology);
(ii) adaptation to agricultural growth patterns and cash flow cycles; and
(iii) use of value chains to ensure proper loan repayment (credit is used for the intended purpose when it results in increased productivity, which the farmer sells to the intended buyer, for a fair price allowing repayment).
Regarding the third key element, the value chain is central to nearly all agrifood finance innovations and key to risk management by banks. Credit risk is reduced by a viable sales contract and implicit technology transfer. The trigger in value chain finance is the linking of the value chain partners. Likewise, most successful examples of agricultural credit guarantees or insurance cover aim to make value chains operate smoothly. By mitigating performance and price risks, producers and buyers can efficiently collaborate in the value chain (HLPE, 2013).
Opportunities to strengthen investment in clean energy solutions
Multi-lateral finance institutions certainly play an important role in developing countries but they are not the solution for supporting agricultural investments unless they receive adequate means to operate in that direction. Financial products developed by multi-lateral finance institutions are not targeted to support investment in energy interventions.
Energy interventions that bring significant co-benefits along the value chain can also be very interesting for so-called “impact investors”, as far as positive environmental and social impacts are significant. The approach and impact indicators illustrated in this report can be used to assess those impacts. Additional features such as innovative business and community models have to be shown to attract (impact) investors and balance the initial cost of the technologies. Three distinct dimensions of sustainability along the value chain can be identified (FAO, 2015):
• In terms of economic sustainability, the upgraded value chain model should provide greater (or at least not reduced) profits or incomes relative to the status quo for each stakeholder, and these should be sustained over time. Unless all stakeholders along the value chain benefit, the model will not be sustainable even in the short term.

253
LESS
ON
S LE
AR
NED
FR
OM
TH
E C
ASE
ST
UD
IES
MEASURING IMPACTS AND ENABLING INVESTMENTS IN ENERGY-SMART AGRIFOOD CHAINS
• In terms of environmental sustainability, the upgraded value chain model should create additional value without permanently depleting natural resources (water, soil, air, flora, fauna, etc.). If this is not the case, the model will not be sustainable in the long term.
• In terms of social sustainability, the upgraded value chain model should generate additional value (additional profits and wage incomes in particular) that benefits sufficiently large numbers of poor households, is equitably distributed along the chain (in proportion to the added value created) and has no impacts that would be socially unacceptable. That is to say, every stakeholder (farmers and processors, young and old, women and men etc.) should feel that they receive their fair share (win-win), and that there are no socially objectionable practices, such as unhealthy work conditions, child labour and mistreatment of animals or violations of strong cultural traditions. Unless this is the case, the model will not be sustainable in the medium term.
Another important lesson learned from the INVESTA project is that RE, and in particular solar PV products at the small/pico scales, are experiencing a remarkable and unprecedented diffusion in developing countries. This stands in contrast to the donor- and government-driven model of rural electrification. In sub-Saharan Africa, the traditional model of rural electrification mainly involves donor- and government-supported programs. This development is driven by an increasing number of private firms supplying solar systems to customers on a commercial basis to serve their electricity and lighting needs. Solar water pumping is one example. System suppliers take advantage of the substantial improvement in the price and efficiency of core technology components, the emergence of smart metering technologies, and the wide spread use of mobile phones and mobile payment schemes. Suppliers are therefore able to target poor customers located mainly in off-grid, rural areas through new pay-as-you-grow112 or pay-as-you-go113 business models that avoid high upfront costs (Nygaard et al., 2016). The successful products are usually designed for a developing country context.
Indeed, a number of failures in the transfer of energy technologies in the agrifood sector seems to be due to the replication of technological solutions designed in and for industrialized countries. The production of biogas from animal wastes and crop residues is an example. A modern biogas plant makes financial sense in a context where there is a reliable and modern grid, which is able to receive the electricity produced and where there is a significant and constant supply of biogas feedstock. These two conditions are not common in developing countries, which, conversely, are well endowed in terms of solar resources. In developing country contexts, hybrid solar PV-biogas commercial power plants, specifically conceived for the technical support services locally available, could perform better. However, this model is not widespread in developing countries, which still struggle to replicate the European model of biogas production.
112 Pay-as-you-grow is a flexible payment structure that minimizes front-end costs when acquiring new agricultural equipment and provides the flexibility to ramp-up deployment for the new technologies or practices. It is particularly effective at allowing businesses to properly match early ramp-up usage by distributing agricultural costs more equitably across harvest periods.
113 Pay-as-you-go involves households or individuals procuring the system from a supplier by making a down payment, followed by daily, weekly or monthly payments for services that are set at affordable levels. Such an arrangement could take the form of a perpetual lease or of eventual system ownership after a defined period of time. The monthly payments are usually pre-paid and are mostly collected through a mobile payment platform.


255MEASURING IMPACTS AND ENABLING INVESTMENTS IN ENERGY-SMART AGRIFOOD CHAINS
POLI
CY
REC
OM
MEN
DA
TIO
NS
6. POLICY RECOMMENDATIONSAimed at policy makers, international finance institutions and investors, the report focused on identifying the main barriers impeding the full deployment of clean energy technologies in the case study countries, and recommends possible solutions to overcome them. Based on the analysis and conclusions presented in this report, as well as on the analysis done over the two years of implementation of the INVESTA project, the following holistic policy recommendations are provided to enable investments in energy-smart agrifood chains.
Financial versus economic returns
1. From the sustainable development perspective, it is important to assess not only the financial attractiveness of an investment in energy technology in the agrifood chain, but also the associated co-benefits and hidden costs. This includes impacts that can take place at different stages of the value chain. The CBA methodology presented here and in FAO and GIZ (2018) is tailored to energy interventions in the agrifood chain and can help donors, impact investors and national decision makers in assessing a number of investment options in a consistent manner.
2. In national planning, establish proper baselines and well-defined, quantitative indicators, and an effective results and impact monitoring. Most countries lack reliable and up-to-date disaggregated data that allow baselines to be established and progress of energy interventions to be monitored. For measuring the performance of investments and technical assistance it is essential to improve the databases in all agrifood-related areas. Verifiable results and consistent impact indicators need to be defined, which would allow to determine the degree of achievement and draw lessons learned for future interventions.
3. When developing energy interventions or policies targeting the agrifood value chain, keep in mind potential issues related to the water-energy-food nexus and look for opportunities to de-couple them. Many interventions put additional pressure on already stressed resources. As a result, economic gains may be lost or existing water/food problems may worsen under pressure of climate change. Water and electricity tariffs that cover costs will help. Grid electricity, often subsidized and thus widely available and inexpensive, could potentially exacerbate the water problems by allowing farmers e.g. to pump large amounts of water, thus depleting ground water resources. As the electricity is cheap, it is less likely that water saving practices such as drip irrigation will be adopted. Farmers growing more dependent on cheap electricity will be hit harder when the groundwater becomes salty, wells become depleted, or the grid fails. By increasing energy efficiency, the pressure for water resources to be used for energy generation will be reduced.
4. Prioritize interventions and policies that increase resilience to natural disasters and social conflicts due to bad natural resource management. Interventions that are vulnerable to such events should be discouraged. Small and off-grid interventions are likely less affected by occur rences of extreme weather events such as storms and floods (driven by climate change), while heavy reliance on the public grid can leave populations vulnerable to social and ethnic conflicts.

256 MEASURING IMPACTS AND ENABLING INVESTMENTS IN ENERGY-SMART AGRIFOOD CHAINS
POLI
CY
REC
OM
MEN
DA
TIO
NS
Regulatory framework
5. Reform electricity tariffs so that they cover the real electricity production cost (including generation, distribution, operation and maintenance, and externalities). Doing so will unlock private sector investments in clean energy solutions (renewable energy, energy efficiency and rural energy access) in the agrifood sector as well as in other sectors and directly contributes to the SDGs. Also, recent trends in terms of falling prices of renewable energy should be considered in national planning.
6. When planning decentralized technology options, make sure to foster local ownership, maintenance, local repair and availability of spare parts. In addition, a saving scheme for maintenance is recommended to assure long-term maintenance. This sounds trivial, but is often not sufficiently addressed. There are many examples of failed decentralized rural electrification programs and projects organized by government agencies and funded by donors. For successful, sustainable projects, local ownership is essential, e.g. in the form of cooperatives or the involvement of local communities, entrepreneurs and institutions. This can be assured by involving (and training) local businesses to provide service and spare parts.
7. Create a conducive framework for energy interventions in the agrifood chain that attracts local entrepreneurs and private investments. This can be done by reducing the regulatory and tax burden (waive import duties, sales tax, corporate tax, license obligations, etc.) for companies that clearly have a social impact (net positive co-benefits) which the government could only achieve at a higher cost. Energy technologies for agrifood chains are an effective ‘instrument’ to contribute to achieving the SDGs in time (for their scalability). It is likewise important for donors not to distort the market with subsidies to large agribusiness or to ‘pick winners’ through support programs.
8. Establish codes and standards for equipment and by-products to foster the development of a new market for these products which in turn can improve the financial viability of the investment in energy technology. For example, quality standards for anaerobic digestate or rice husks can help the development of a local markets for these products, and thus adding value to them. Codes and standard for equipment contribute to eradicate the commercialization of low-efficiency or counterfeit equipment (e.g. batteries, solar panels).
9. Introduce environmental standards including on waste disposal, and favour the use of waste for bioenergy. Such a regulation would have multiple benefits: It would safeguard the environment limiting pollution, would add value to a product that was considered a waste, and would develop a new market and its supporting industry. The EU experience in developing a bioenergy sector from agrifood waste, along with its failures and successes, could be used as example.
10. Set minimum food quality standards and enforce quality checks already at an early stage of the agrifood value chain. Although the link with clean energy interventions is not straightforward, food quality standards often require value chain actors to adopt modern energy technologies (thus moving away from manual or traditional fossil fuel-based work). The milk value chain is a relevant example:

257MEASURING IMPACTS AND ENABLING INVESTMENTS IN ENERGY-SMART AGRIFOOD CHAINS
POLI
CY
REC
OM
MEN
DA
TIO
NS
Milk cooling becomes a necessary technology, especially for most rural and remote farmers, if stricter milk quality standards are requested and enforced.
11. Facilitate the administration process to obtain permits for commercial RE producing systems and grid connection. This process can be a major burden, both in terms of cost and time, especially for developers of small energy interventions.
12. Set and properly communicate national renewable energy and food quality targets specific for the agriculture or food industry sectors. They can foster the adoption of clean energy technologies. With a clear national target, public support and private resources are channeled towards a common goal.
Mechanisms to foster investments
13. Mainstream insurance and financing products tailored to agrifood energy interventions. Insurance products should:
a) hedge against market price spikes of biomass feedstock (if a market exists). This is applicable for example to bioenergy technologies which make use of agri-residues or food wastage; and
b) protect early adoption of a technology against low yields. Early adopters of solar water pumps or innovative RE-powered equipment need to be protected against impacts of extreme events (such as droughts), and be provided after-sales support by the technology provider. Bad experiences of early adoption can discourage new adopters. In agriculture, support guarantee schemes for producers should be tailored to farmers and farmer groups/cooperatives.
Financing products include concessional loans which match the specific businesses. For example, in agriculture, the loan should be spread over a sufficient number of harvests/cropping cycles to allow flexibility in case of bad seasons. Financing products should be tailored to value chain actors and take into account that smallholder farmers and processors often do not have a credit track records and/or collateral. New technologies such as smart meters and the wide spread use of mobile phones and mobile payment schemes can be used to provide alternative financing products114. Gender-responsive financial products should be developed and facilitated. This includes pay-as-you-go products, in partnership with financial institutions and/or international organizations115. In the case of highly indebted countries, concessional debt may be a more cost effective way than subsidies to make RE interventions attractive to developers (since it may reduce the total project support required to make the intervention viable and governments have advantages that may enable them to provide dollar-equivalent debt subsidies more cheaply than price supports.
114 Kenya is leading the development of mobile payment systems integrated with GPS and other IT technologies. A successful example is provided by the fruit and vegetable wholesale company Twiga Foods (http://twigafoods.com/) which is revolutionizing the Nairobi market.
115 Refer to the Powering Agriculture gender guide on financial products for further details: Powering Agriculture guide on integrating gender in the financing of clean energy solutions https://poweringag.org/docs/guide-integrating-gender-financing-clean-solutions

258 MEASURING IMPACTS AND ENABLING INVESTMENTS IN ENERGY-SMART AGRIFOOD CHAINS
POLI
CY
REC
OM
MEN
DA
TIO
NS
14. Reduce or (whenever possible) remove any direct or indirect subsidy for fossil fuels and develop government-backed financial mechanisms or preferential loans for early adopters. In the milk VC, a price premium for quality cooled milk is an effective measure to convince early technology adopters. The support should be guaranteed for a period sufficient to recover the difference between conventional and off-grid equipment. Subsidies should be used only for specific finite interventions to generate the products or when expansion can occur with a fixed public commitment in order to minimize market distortion. The business and development case for including agricultural finance in the portfolio of products offered to poor rural households has never been stronger.
15. Experiences of for-profit financial institutions confirms that a profitable investment in an energy technology can be developed to serve a poor rural clientele when there is: a) knowledge of client needs, market and value chain dynamics; b) appropriate risk management technologies; and c) cost-effective delivery strategies. In this context, win-win public-private partnerships should be prioritized as they are critical to the sustainable provision of non-financial services which complement and support agricultural finance product delivery.
16. Provide technical and financial assistance, possibly backed by international support, for micro-finance and local savings organizations, such as service and credit associations, to help them develop and market savings products for farmers and processors. This includes assistance on the most appropriate business models116.
17. Foster knowledge and education schemes, especially in rural areas. These can be summarized as follows:• Develop capacity to give a better understanding of energy technologies and
good practices in agriculture and food processing to local financing institutes, administrative bodies, equipment providers and system developers. This includes technology demonstration to farmer groups, cooperatives and practitioner groups.
• Build capacity of both women and men aiming to hold managerial and technical roles by liaising with professional organizations, universities and vocational training schools. The capacity building and technical assistance activities would include awareness levels of clean energy solutions, technical and financial assistance to raise awareness of the potential benefits, effective business models, particularly in rural areas. A range of activities could be foreseen ranging from promotional campaigns, including radios adverts, to demonstrations and extension officer support.
116 A number of business models have been mentioned and analysed in this report, and some are more suitable than others to specific country contexts (see section 4.3). There is clearly no one-size-fits-all solution and the project could not draw specific recommendations about their suitability, since the suitability is influenced by the local laws, regulation and value chain.
259MEASURING IMPACTS AND ENABLING INVESTMENTS IN ENERGY-SMART AGRIFOOD CHAINS
POLI
CY
REC
OM
MEN
DA
TIO
NS
Gender equality
18. Mainstream gender considerations throughout the innovation process – concept development, research and development, piloting, early adoption/distribution, market growth, wide-scale adoption117. Targeting women and men makes social sense to improve their ability to work together to participate in economic opportunities, generate higher incomes, increase household food and nutrition security and improve family health and wellbeing. Moreover, women should be empowered as ‘pull’ motivation (opportunity-based entrepreneurship) seem to be more effective than ‘push’ motivation (unemployment, job loss, etc.) to engage women (UNIDO, 2017).
19. Promote equal rights for men and women in legal and customary land law at policy, institutional and community level; empower women to secure access to land; and support women’s access to, and participation in, land initiatives. This includes the promotion of gender equitable and single-sex cooperatives by changing membership rules, such as fees, and organizational governance and structures, for example through quotas, building institutional capacity, and ensuring a supportive national policy environment118.
Data gaps
20. Support the collection, processing, storage and appropriate sharing of data and statistics on agriculture and the food industry in partnership with international organizations such as the UN FAO. International organizations can support the development of national statistics reporting processes and the dissemination and publication of data.
21. National statistical offices should ensure that the data collected are consistent with international standards. This is necessary to ensure a sound comparison of assessments (CBAs of energy interventions in our case) done across countries. The SEEA-AFF119 should be considered as a reference for the combination of environmental and economic statistical data for the agriculture sector.
22. Facilitate the collection of sex-disaggregated data in agricultural sub-sectors, in the steps of agrifood value chains and throughout the adoption, use and outcomes of clean energy interventions.
117 Refer to the Powering Agriculture gender guides for further details: https://poweringag.org/resources
118 Refer to Kaaria et al. (2013) for further details.
119 For more information see http://www.fao.org/economic/ess/environment/methodology/en/


261
REFERENCES AND FURTHER READING
Abdelli, M. 2016. Evaluation des paramètres technico-économiques de la production laitière en Tunisie. Institut National Agronomique de Tunisie. Département des Ressources Animales, Halieutiques et des Technologies Agro-Alimentaires. Projet de fin d’études du cycle ingenieur.
ADB. 1999. Guidelines for the economic analysis of water supply projects.
ADB. 2012. Technical Assistance Consultant’s Report. The Rice Situation in Cambodia. Asian Development Bank.
ADB. 2013. Gender equality in the labor market in the Philippines. Mandaluyong City, Philippines: Asian Development Bank. (Available at https://www.adb.org/sites/default/files/publication/31194/gender-equality-labor-market-philippines.pdf).
AfDB. 2013. Needs Assessment for Risk Mitigation in Africa: Demands and Solutions, Initiative for Risk Mitigation in Africa (IRMA), African Development Bank.
AfDB. 2015. Renewable Energy in Africa – Tanzania Country Profile.
AHK Kenya. 2015. Zielmarktanalyse. Optimierung der Stromversorgung im kommerziellen und industriellen Sektor mit erneuerbaren Energien in Kenia.
Akter, S., Rutsaert, P., Luis, J., Nyo MeHtwe, Su Su San., Raharjo, B. and Pustika A. 2017. Women’s empowerment and gender equity in agriculture: A different perspective from Southeast Asia. Food Policy journal, Volume 69, May 2017, Pages 270–279.
AllAfrica. 2016. Tanzania: REA, Norway Invest in Biogas. Tanzania Daily News, 23 January. (Available at http://allafrica.com/stories/201601251504.html).
Alcor. 2010. Etude sur le développement de la méthanisation industrielle – Rapport préliminaire – Etat des lieux de la méthanisation industrielle en Tunisie.
Alcor. 2014. Energy situation in Tunisia. Presentation by Rafik Missaoi, Alcor. EU Delegation.
ANME. 2012. Nouvelle Version du Plan Solaire Tunisien. Programmation, conditions et moyens de la mise en oeuvre.
AQUASTAT. 2015. (Available at http://www.fao.org/nr/water/aquastat/countries_regions/KEN/KEN-map_detailed.pdf).
AQUASTAT 2016. Available at http://www.fao.org/nr/water/aquastat/data/query/results.html).
Baitilwakea, M. A. S., De Bolleb, J., Salomezb, J. P. and Mremac, S. D. 2011. Effects of manure nitrogen on vegetables’ yield and nitrogen efficiency in Tanzania. International Journal of Plant Production 5(4): 1735–6814.
Banque Centrale de Tunisie. 2017. Statistiques. (Available at https://www.bct.gov.tn/bct/siteprod/cours.jsp)
BAS. 2002. Philippines – The 2002 Census of Agriculture. (Available at http://www.fao.org/fileadmin/templates/ess/documents/world_census_of_agriculture/countries_for_website/PHILIPPINES_ 2002.pdf).
BIR. 2016. Value-Added Tax. Republic of the Philippines. (Available at http://www.bir.gov.ph/index.php/tax-information/value-added-tax.html).
Bonjour, S., Adair-Rohani, H., Wolf, J., Bruce, Nigel, Mehta, S., Pruss-Ustun, A., Lahiff, M., Rehfuess, E., Mishara, V. and Smith, K. 2013. Solid fuel use for household cooking: country and regional estimates for 1980–2010. Environmental Health Perspectives. 2013; 121(7):784-90. doi: 10.1289/ehp.1205987. PubMed PMID: 23674502; PubMed Central PMCID: PMC3701999.

262
Brander, M., Sood, A., Wylie, C., Haughton, A. and Lovell, J. 2011. Electricity-specific emission factors for grid electricity. Technical Paper. Ecometrica.
Buag-ay, F. D. 2008. Gender Roles and Labor Utilization of Rice Farming in Besao, Mountain Province. Benguet State University, La Trinidad Benguet.
Central Bank of Kenya. 2017. (Available at https://www.centralbank.go.ke/).
Chapagain, A. K., and Hoekstra, A. Y. 2010. The green, blue and grey water footprint of rice from both a production and consumption perspective. The Value of Water Research Report Series No. 40. UNESCO-IHE Institute for Water Education, Delft, the Netherlands.
Chivenge, P., Vanlauwe, B. and Six, J. 2011. Does the combined application of organic and mineral nutrient sources influence maize productivity? A meta-analysis. Plant Soil 342: 1–30.
Clean Energy Pipeline. 2015. Clean Energy Africa Finance Guide 2015 Edition, Clean Energy Pipeline.
CountrySTAT Philippines. 2016 (Available at http://countrystat.psa.gov.ph/).
DANIDA. 2016. Baseline study of the dairy value chain in Tanzania.
Diesel Service and Supply. 2017. Approximate Diesel Fuel Consumption Chart. (Available at http://www.dieselserviceandsupply.com/Diesel_Fuel_
Consumption.aspx).
EADD. 2008. The Dairy Value Chain in Kenya.
EADD. 2015. Dairy consumer market study for EADD II in Tanzania. Draft research report prepared by Ipsos Limited for EADD.
ECA. 2012. Cost-Benefit Analysis for Regional Infrastructure in Water and Power Sectors in Southern Africa. Addis Ababa, Ethiopia.
Egerton, Tegemeo and MSU. 2000. Rural Household Survey 2000. Unpublished.
Energydata.info. 2017. Kenya electricity transmission network. (Available at https://energydata.info/dataset/kenya-electricity-transmission-network/resource/dbbb6370-d57b-45c8-8501-59488d0e23c8).
Energypedia. 2016a. Tunisia Energy Situation. (Available at https://energypedia.info/wiki/Tunisia_Energy_Situation).
Energypedia. 2016b. Philippines Energy Situation. (Available at https://energypedia.info/wiki/Philippines_Energy_Situation).
Enterprise Surveys. 2017. Infrastructure. The World Bank. (Available at http://www.enterprisesurveys.org/data/exploretopics/infrastructure#--1).
EPA. 2016. EPA Fact Sheet: Social Cost of Carbon.
ERC. 2017. All Prices. (Available at http://www.erc.go.ke/index.php?option=com_content&view=article&id=162&Itemid=666).
EWURA. 2017. Application for Electricity Licence- Form No. 100. (Available at http://www.ewura.go.tz/wp-content/uploads/2015/04/Application-for-Electricity-Licence-Form-No.-100-current-version2017-1.pdf).
EWURA. 2016. Annual report for the year ended 30th June 2016. (Available at http://www.ewura.go.tz/wp-content/uploads/2015/04/Annual-Report-for-the-Year-Ended-30th-June-2016.pdf).
Ezzati M, Lopez AD, Rodgers A, Vander Hoorn S, Murray CJL. 2002. Selected major risk factors and global and regional burden of disease. Lancet. 2002;360(9343):1347–60. 2.
FAO. 2006. Tunisia: Country Pasture/Forage Resource Profiles. By Chedly Kayouli.
FAO. 2008. Forests and Energy. Key issues. FAO Forestry paper 154. Rome.

263
FAO. 2011a. Global Food Losses and Food Waste. (Available at http://www.fao.org/fileadmin/user_upload/suistainability/pdf/Global_Food_Losses_and_Food_Waste.pdf).
FAO. 2011b. Dairy development in Kenya. (Available at http://www.fao.org/docrep/013/al745e/al745e00.pdf).
FAO. 2011c. The Global Bioenergy Partnership Sustainability: Indicators for Bioenergy. Global Bioenergy Partnership (GBEP). ISBN 978-92-5-107249-3. Rome. (Available at http://www.globalbioenergy.org/fileadmin/user_upload/gbep/docs/Indicators/The_GBEP_Sustainability_Indicators_for_Bioenergy_FINAL.pdf).
FAO. 2014a. Food Loss Assessments: Causes and Solutions. Case Studies in Small-scale Agriculture and Fisheries Subsectors. Kenya. Global Initiative on Food Loss and Waste Reduction – Save Food. Food and Agriculture Organization of the United Nations. Rome.
FAO. 2014b. A regional rice strategy for sustainable food security in Asia and the Pacific. Final edition. Food and Agriculture Organization of the United Nations Regional Office for Asia and the Pacific. Bangkok. (Available at http://www.fao.org/fileadmin/templates/rap/files/aprc32/regional-rice-strategy-for-asia-pacific_final-edition.pdf).
FAO. 2015. Kenya. (Available at http://www.fao.org/nr/water/aquastat/countries_regions/KEN/).
FAO. 2016a. Developing gender-sensitive value chains – A guiding framework. Rome. (Available at http://www.fao.org/3/a-i6462e.pdf).
FAO. 2016b. Planning, implementing and evaluating Climate-Smart Agriculture in Smallholder Farming Systems. The experience of the MICCA pilot projects in Kenya and the United Republic of Tanzania. (Available at http://www.fao.org/3/a-i5805e.pdf).
FAO. 2017a. Adoption of climate technologies in the agrifood sector Methodology. Prepared under the FAO/EBRD Cooperation. (Available at http://www.fao.org/3/a-i7022e.pdf).
FAO. 2017b. Gender and land rights database. Tunisia. (Available at http://www.fao.org/gender-landrights-database/country-profiles/countries-list/general-introduction/en/?country_iso3=TUN).
FAO BEFSRA. 2016. Bioenergy and Food Security (BEFS) Rapid Appraisal. Natural Resources – Biomass Potential Assessment. Agricultural Residues Tool. Livestock residues spreadsheet. (Available at http://www.fao.org/fileadmin/user_upload/energy/befs/natural_resources/internal/Agricultural_Residues_tool_1.0f.xlsm).
FAO BEFSRA. 2017. Rapid Appraisal Tool for Biogas Production Industrial Scale. (Available at http://www.fao.org/energy/bioenergy/befs/assessment/befs-ra/energy-end-use/en/).
FAO and GIVLAIT. 2016. The Dairy Milk Sector in Tunisia, Priorities and Challenges – Value chain milk analysis in Tunisia.
FAO and GIZ. 2018. Costs and Benefits of Clean Energy Technologies in the Milk, Vegetable and Rice Value-Chains. Intervention level.
FAO and IFC. 2016. Kenya Irrigation Market Brief: Country Highlights. Prepared under the FAO/IFC Cooperation. (Available at: http://www.fao.org/3/a-i5074e.pdf).
FAO and USAID. 2015. Opportunities for Agri-Food Chains to become Energy-Smart. (Available at http://www.fao.org/3/a-i5125e.pdf).
FAOSTAT. 2016. Crops. (Available at http://www.fao.org/faostat/en/#data/QC).
FAOSTAT. 2017. Data on Milk, whole fresh cow (Item). Livestock Primary (Production). (Available at http://www.fao.org/faostat/en/?#search/Milk%20Fresh%20%2B%20Total).
GACC. 2016. Kenya Drops Trade, Tax Barriers to Aid Adoption of Cleaner Cooking Technologies. (Available at http://cleancookstoves.org/about/news/06-22-2016-kenya-drops-trade-tax-barriers-to-aid-adoption-of-cleaner-cooking-technologies.html).

264
GCCA. 2016. Kenya Cold Chain Assessment.
Gender Concern International. 2017. The Situation of Women in Tunisia. (Available at http://www.genderconcerns.org/country-in-focus/tunisia/the-situation-of-women-in-tunisia/).
Gestione dei Servizi Energetici. 2013. Tunisia – Energy Country Report – Focus on electricity sector and renewable energy policies.
Gill, K., Patel, P., Kantor, P. and McGonagle, A. 2012. Invisible Markets: Energy and agricultural technologies for women’s economic advancement. International Center for Research on Women (ICRW). (Available at https://www.icrw.org/publications/invisible-market/).
GIVLAIT. 2015. Field testing of an innovative solar powered milk cooling solution for the higher efficiency of the dairy subsector in Tunisia. Le froid à la ferme et Collecte du lait en Tunisie. Aspects Quantitatifs et Qualitatifs. Hammamet.
GIVLAIT. 2016. Présentation de la filière lait. (Available at http://www.givlait.com.tn/index.php?option=com_content&view=article&id=56&Itemid=80).
GIZ. 2012. Renewable energy and energy efficiency in Tunisia – Employment, qualification and economic effects.
GIZ. 2014. 30/30. Stratégie Nationale de Maitrise de l’énergie. Objectifs, moyens et enjeux. Mandate par Direction Générale de l’Energie du Ministère de l’Industrie, de l’Energie et des Mines, Agence Nationale pour la Maitrise de l’Energie. Tunis.
GIZ. 2015. Use of Biomass as Renewable Energy Source in Panay – Final report.
GIZ. 2016. Etude d’Opportunité du Solaire Photovoltaïque dans les Secteurs Agricole & Agroalimentaire. Mandaté par: Ministère fédéral allemand de la Coopération économique et du Développement (BMZ). Publié par: Deutsche Gesellschaft für Internationale Zusammenarbeit (GIZ) GmbH. Bonn and Eschborn, Germany.
GlobaPetrolPrices.com. 2016. Philippines Diesel prices, liter. (Available at http://www.globalpetrolprices.com/Philippines/diesel_prices/).
Gonzales, L. 2013. Global Cost and Price Competitiveness of Philippine Rice.
GSE. 2013. Tunisia. Energy Country Report. Focus on electricity sector and renewable energy policies.
GSMA. 2011. Community Power from Mobile-Charging Services.
GTZ. 2010. Agro-Industrial Biogas in Kenya.
GVEP. 2012. Availability of Phone Charging Services in Off-grid Areas of the Lake Zone Region, Tanzania.
Heinrich Böll Foundation. 2013. Powering Africa through feed-in tariffs. Advancing renewable energy to meet the continent’s electricity needs. A Study for the World Future Council (WFC), the Heinrich Böll Stiftung (HBS) and Friends of the Earth England, Wales & Northern Ireland (FoE-EWNI). Authored by: Renewable Energy Ventures (K) Ltd., Nairobi, Kenya: Joseph Nganga, Marc Wohlert, Matt Woods. Meister Consultants Group Inc., Boston, USA: Christina Becker-Birck, Summer Jackson, Wilson Rickerson. (Available at https://www.boell.de/sites/default/files/2013-03-powering-africa_through-feed-in-tariffs.pdf).
HLPE. 2013. Investing in smallholder agriculture for food security. A report by the High Level Panel of Experts on Food Security and Nutrition of the Committee on World Food Security, Rome.
IBI. 2014. 2013 State of the Biochar Industry. A Survey of Commercial Activity in the Biochar Field. By Stefan Jirka and Thayer Tomlinson, International Biochar Initiative.
ICARDA, INRAT and GIZ. 2016. Analysis report of the baseline survey for the project “Field testing of an innovative solar powered milk cooling solution for the higher efficiency of the dairy subsector in Tunisia”. Socioeconomic Team: Dhraief MZ, Souissi A, Jebali O.

265
ICEX. 2016. El Mercado de las energias renovables en Tunez. Estudios de Mercado realized by Luis Antonio Tapias under the supervision of the Oficina Economica y Comercial de la Embajada de Espana en Tunez.
IEA. 2016. Tunisia: Renewables and Waste for 2013. (Available at https://www.iea.org/statistics/statistic ssearch/report/?country=Tunisia&product= RenewablesandWaste).
IEA. 2017. IEA Country Statistics. World: Electricity and Heat for 2014. (Available at https://www.iea. org/statistics/statisticssearch/report/?country= WORLD&product=electricityandheat&year= 2014).
IEA. 2018. IEA Country Statistics Tanzania for 2015. (Available at https://www.iea.org/statistics/statisticssearch/report/?country=Tanzania&product=balances).
IFAD. 2010. Interrelationships between labour outmigration, livelihoods, rice productivity and gender roles. Occasional Papers; knowledge for development effectiveness. IFAD Asia and the Pacific Division. (Available at https://www.ifad.org/documents/10180/20e27f8a-1db0-4a17-ad89-2a3f3dd9bb29).
IFAD. 2012. Programme de Developpement Agro-Pastoral et de Promotion des Initiatives Locales pour le Sud-Est, Phase II (PRODESUD II). Final project design report. Volume I. Rome.
IFAD. 2013. Republic of Kenya, Country Strategic Opportunities Programme. Rome. (Available at https://webapps.ifad.org/members/eb/109/docs/EB-2013-109-R-14.pdf).
IFAD. 2014. Convergence on Value Chain Enhancement for Rural Growth and Empowerment (CONVERGE) in the Republic of the Philippines. Design completion report, main report and appendices. Rome.
IFAD. 2016a. Projet de promotion des filières pour le développement territorial de Siliana (PROFITS). Rapport de conception finale, Rapport principal et appendices. Rome.
IFAD. 2016b. United Republic of Tanzania, Country Strategic Opportunities Programme. IFAD, Rome, April 2016.
IISD. 2015. Country Case Studies on Fossil Fuel Subsidy Reform. (Available at http://fffsr.org/wp-content/uploads/2015/08/case-study-fossil-fuel-subsidy-reform3.pdf).
ILO. 2017. ILOSTAT. Key Indicators of the Labour Market (KILM). Labour Costs. (Available at http://www.ilo.org/ilostat/).
ILRI. 2012. Efforts to improve the dairy industry in Tanzania. (Available at http://www.slideshare.net/ILRI/efforts-to-improve-the-dairy-industry-in-tanzania).
ILRI. 2013. Overview of the Tanzanian dairy industry challenges and opportunities. (Available at http://www.slideshare.net/ILRI/cleaned-project-mutagwabasep2013-26691249).
IPCC. 2006. IPCC Guidelines for National Greenhouse Gas Inventories, Vol.4, Annex 10A.2. (Available at http://www.ipcc-nggip.iges.or.jp/public/2006gl/).
IRENA. 2014. IRENA Handbook on Renewable Energy Nationally Appropriate Mitigation Actions (NAMAs). 2nd edition. (Available at http://www.irena.org/DocumentDownloads/Publications/IRENA_NAMAs_handbook_2014_EN.pdf).
IRENA. 2016a. Unlocking Renewable Energy Investment: The Role of Risk Mitigation and Structured Finance. The International Renewable Energy Agency. Abu Dhabi. (Available at https://www.irena.org/DocumentDownloads/Publications/IRENA_Risk_Mitigation_and_Structured_Finance_2016.pdf).
IRENA. 2016b. Renewable Energy benefits: Decentralised Solutions in the Agri-food Chain. The International Renewable Energy Agency. Abu Dhabi. (Available at http://www.irena.org/DocumentDownloads/Publications/IRENA_Decentralised_solutions_for_agrifood_chain_2016.pdf).

266
IRRI. 2015. Rice farming in the Philippines: some facts and opportunities. Presentation by: V. Bruce J. Tolentino, Ph. D. Deputy Director-General International Rice Research Institute.
Jessop, R., Diallo, B., Duursma, M., Mallek, A., Harms, J. and van Manen, B. 2012. Creating access to agricultural finance based on a horizontal study of Cambodia, Mali, Senegal, Tanzania, Thailand and Tunisia. Paris, AFD.
Journal Officiel de la République Tunisienne. 2015. Loi n° 2015-12 du 11 mai 2015, relative à la production d’électricité à partir des énergies renouvelables. N. 38 pg. 926.
JRC. 2017. PV Potential Estimation Tool: Photovoltaic Geographical Information System – Interactive Maps. (Available at http://re.jrc.ec.europa.eu/pvgis/apps4/pvest.php?map=africa).
Kaaria, S., Osorio, M., Wagner, S. and Gallina, A. 2013. Rural women’s participation in producer organizations: An analysis of the barriers that women face and strategies to foster equitable and effective participation. Social Policies and Rural Institutions Division, Food and Agriculture Organization of the United Nations (FAO). Journal of Gender, Agriculture and Food Security Vol. 1, Issue 2, pp 148–167, 2016. (Available at http://www.fao.org/partnerships/forest-farm-facility/44848-0f3298679857a7087f83abce5ed4b06c7.pdf).
Kadigi, M. 2013. Economic Value of Manure as a Driver for Safe Manure Management. BSU Project Report in Morogoro Urban, Morogoro.
Kato M.P and Kratzer J. 2013. Empowering Women through Microfinance: Evidence from Tanzania. ACRN Journal of Entrepreneurship Perspectives Vol. 2, Issue 1, p. 31-59. ISSN 2224-9729 (Available at http://www.acrn.eu/resources/Journals/201302c.pdf).
Katothya, G. 2017. Gender assessment of dairy value chains: Evidence from Kenya. Rome, FAO. (Available at http://www.fao.org/3/a-i6786e.pdf).
KDB. 2017. Business units in Kenya. (Available at http://www.kdb.co.ke/contact/business-units-in-kenya).
KENDAT, IFRTD and TCP. 2013. Horticultural value chains in Kenya. Booklet a product of the Africa Community Access Programme (AFCAP) funded by the UK Government (DFID). (Available at http://www.kendat.org/wp-content/uploads/2015/01/illustrated-booklet-final.pdf).
KFIE. Feed the Future Kenya Innovation Engine from the U.S. Government’s Global Hunger and Food Security Initiative. 2015. Innovative Cooling Option for Smallholder Farmers (CoolBot). (Available at http://www.kfie.net/images/pdfs/Innovative-cooling-option-for-smallholder-farmers.pdf).
Kirigia, A., Jesse, T., Njoka, P. I., Kinyua, D. and Truman, P. Y. 2013. Characterizations of livestock manure market and the income contribution of manure trade in Mukogodo, Laikipia, Kenya. Academic Journals 8(46): 5864–5871.
KNBS. 2010. The 2009 Kenya Population and Housing Census. Volume II. Population and Household Distribution by Socio-economic Characteristics. (Available at https://www.knbs.or.ke/2009-kenya-population-and-housing-census-volii-population-and-household-distribution-by-social-economic-characteristics/).
KNBS. 2013. Membership of co-operative by type of society (2006–2012) and number of societies and unions by type. (Available at https://www.knbs.or.ke/download/membership-of-co-operative-societies-by-type-of-society-2006-2012/).
KRA. 2016. Customs Services Department, Frequently Asked Questions. (Available at http://www.revenue.go.ke/customs/faqcustoms.html).
KTA. 2016. Logistics: moving to enhance truck turn around. (Available at http://www.kta.co.ke/index.php/news-resources-smedia/news-highlights).
Kuipers, H. 2017. Role of Women in Agriculture. Unpublished. GFA Consulting Group GmbH, GIZ.

267
Kunen, E., Pandey, B., Foster, R. E. and Ngetich, B. 2015. Solar Water Pumping: Kenya and Nepal Market Acceleration. Conference paper. ISES Solar World Congress 2015. (Available at https://www.researchgate.net/publication/284098829_Solar_Water_Pumping_Kenya_and_Nepal_Market_Acceleration).
Kurokawa, K., Koivoto, K., V. D. Vleuten, P. and Faiman, D. 2007. Energy from the desert – Practical proposals for very large scale photovoltaic systems.
Kurwijila, R. L. 2015. Milk quality improvement strategy; Report for Tanga Fresh Ltd.
Kurwijila, R. L., Mdoe, N., Nyange, D. N., Auerbock, M. R. and Malya, U. N. 1995. Assessment of Fresh Milk and Milk Products Market and Consumption in Dar es Salaam, The Austro Project Association.
Kurwijila, R. L. and Sikira, N. A. 2013. Draft Report for Scoping Study for Value Addition and Marketing of Milk for Smallholders (VAMMS) in Muheza and Bagamoyo Districts: Ministry of Agriculture and Fisheries, Livestock Institute Training Agency and Sokoine University of Agriculture.
LACTIMED. 2013. Valorisation des produits laitiers typiques de Bizerte et Beja – Diagnostic et strategie locale.
La Presse de Tunisie. 2010. Nouvelle unité de biogaz et cogénération en Tunisie.
Laws of Tanzania. 1997. Tanzania Investment ACT. (Available at http://tanzania.eregulations.org/media/INVESTMENT%20ACT.pdf).
Lim, S. S., Vos, T., Flaxman, A. D., Danaei, G., Shibuya, K. and Adair-Rohani, H. 2012. A comparative risk assessment of burden of disease and injury attributable to 67 risk factors and risk factor clusters in 21 regions, 1990–2010: a systematic analysis for the Global Burden of Disease Study 2010. The Lancet. 2012; 380(9859):2224-60. doi: 10.1016/S0140- 6736(12)61766-8.
Lusato, R. K.; Omore, A. and Grace, D. 2012. The Tanzania Dairy Industry. (Available at https://cgspace.cgiar.org/bitstream/handle/10568/33865/TanzaniaDairyIndustryOverview2012.pdf?sequence=1).
Makanga, J. T., Shitanda, D., Njoroge, C. and Ong’era, M. G. 2012. Application of renewable energies for storage of horticultural produce in marginal areas of Kenya. (Available at http://journals.jkuat.ac.ke/index.php/jscp/article/download/708/653).
Makoni, N., Mwai, R., Redda, T., Zijpp, A. van der., Lee, J. van der. 2014 White Gold; Opportunities for Dairy Sector Development Collaboration in East Africa. Centre for Development Innovation, Wageningen UR (University & Research centre). CDI report CDI-14-006. Wageningen.
MALF Kenya. 2009. Livestock production 2008 Annual Report. Rift Valley Provinces. Unpublished.
MALF Kenya. 2015. Economic Review of Agriculture (Era). Nairobi.
MALF Kenya. 2017. Phase II: EAAPP in Kenya. Sub-Component: Improving dairy productivity. Draft concept note. Unpublished.
MALF Tanzania. 2016. Baseline study of the dairy value chain in Tanzania: Assessment of challenges and opportunities for investment.
Malla, M. B., Bruce, n., Bates, E. and Rehfuess, E. 2011. Applying global cost-benefit analysis methods to indoor air pollution mitigation interventions in Nepal, Kenya and Sudan: Insights and challenges. Energy Policy 39 (2011): 7518–7529.
Mangesho, W. E. 2012. Leguminous fodder trees as protein source and carbon sink in smallholder dairy production systems in Muheza district, Tanga region, Tanzania. M.sc. Thesis, Dept. Animal Sci. Sokoine University of Agriculture.
Marr, A. 2012. Effectiveness of rural microfinance: what we know and what we need to know. Journal of Agrarian Change.

268
Mchau, K. W., Balakana, J. Laffa, J., Kilima, Kadigi, R. and Banya, P. 2007. Improving the Competitiveness of the Dairy Industry through Rationalization of Regulatory Compliance and Cost of Doing Business. TAMPA.
MEM Tanzania. 2015. The National Energy Policy. Ministry of Energy and Minerals.
Michael, A., Kuznetsov, D., and Mirau, S. 2014. Analysis of the irrigation water price in rice production Tanzania. Appl. Comput. Math. 2014, 3, 177–185.
Militar, J.G. 2014. The energetic utilisation of rice husks in rice mills in the Philippines. (Available at https://www.giz.de/fachexpertise/downloads/2014-en-militar-pep-infoveranstaltung-biogas-biomasse-philippinen-thailand.pdf).
Ministry of Energy Kenya. 2012. Feed-in tariffs policy for wind, biomass, small-hydro, geothermal, biogas and solar generated electricity.
Ministry of Finance and Planning Tanzania. 2016. Import Duty.
MLFD. 2006. National livestock policy. (Available at https://www.tnrf.org/files/E-INFO_National_Livetock_Policy_Final_as_per_Cabinet_Dec-2006.pdf).
Mlozi, M. R. S. 1996. Urban agriculture in Dar es Salaam: Its contribution to solving the economic crisis and the damage it does to the environment. Development Southern Africa 13 (1): 47–65.
MMA. 2016. Economic Market Analysis of Agribusiness Sector in Mwanza and Mara Regions in Tanzania for Swisscontact.
Mokhtari, G., Baba-Aissa, A., Harguem, L. and George, T. 2017. Renewable Energy in Tunisia – A brief look at recent developments and an ambitious energy action plan in light of May’s call for projects. Bennani & Associés LLP. (Available at http://enrpartner.com/wp-content/uploads/2017/05/Tunisia-Article-Final.pdf).
Muhi El-Dine Hilali. 2016. Field testing of an innovative solar powered milk cooling solution for the higher efficiency of the dairy subsector in Tunisia. Presentation to the Innovation Transfer into Agriculture – Adaptation to Climate Change (ITAACC) 7 Steering Committee Meeting.
NAFIS. 2017. National Farmers Information Service. (Available at http://www.nafis.go.ke/).
National Electrification Administration. 2017. Status of energization. (Available at http://www.nea.gov.ph/status-of-energization/category/119-2016-monthly-reports). Accessed November, 2017.
NBS. 2012. National Livestock Sample Census October 2007–2008. Tanzania.
NBS. 2014. Basic Demographic and Socio-Economic Profile Statistical Tables Tanzania Mainland. National Bureau of Statistics Ministry of Finance Dar es Salaam and Office of Chief Government Statistician Ministry of State, President’s Office, State House and Good Governance Zanzibar. (Available at http://tanzania.countrystat.org/fileadmin/user_upload/countrystat_fenix/congo/docs/2012%20Tanzania%20Population%20and%20Housing%20Census-Basic%20Demographic%20and%20Socio-Economic%20Profile.pdf).
NBS and REA. 2017. Energy Access Situation Survey Report, 2016 Tanzania Mainland. (Available at http://www.nbs.go.tz/nbstz/index.php/english/other-statistics/849-energy-access-situation-report-2016).
Nell, A. J., Schiere, H. and Bol, S. 2014. Quick Scan – Dairy Sector Tanzania. (Available at http://www.best-dialogue.org/wp-content/uploads/TanzDairyScanReport-14Jan14-Final1.pdf?eae10f).
NPC-SPUG. 2016. Existing effective rates. (Available at http://report.spug.ph/rates/SPUG RatesApril2016.pdf).
Nygaard, I., Hansen, U. E. and Larsen, T. H. 2016. The emerging market for pico-scale solar PV systems in Sub-Saharan Africa: From donor-supported niches toward market-based rural electrification. UNEP DTU Partnership.
269
ODI. 2014. Rural Wages in Asia. (Available at https://www.odi.org/sites/odi.org.uk/files/odi-assets/publications-opinion-files/9186.pdf).
Ogutu, C., Kurwijila, R. L. and Omore, A. 2014. Review of successes and failures of dairy value chain development interventions in Tanzania: for CGIAR Research Program on Livestock and Fish.
Omondi, I., Zander, K., Bauer, S. and Baltenweck, I. 2014. Using dairy hubs to improve farmer’s access to milk markets: Gender and its Implications. Tropentag: Bridging the Gap between Increasing Knowledge and Decreasing Resources (pp. 1–22). Prague, Czech Republic, Tropentag.
ONAGRI. 2016. Households with Electricity 2016. (Available at http://onagri.opendataforafrica.org/apps/atlas/maps/Households-with-Electricity).
PEF. 2015. Measuring postharvest losses of fresh fruits and vegetables in developing countries. White paper 15-02. (Available at http://postharvest.org/pef_white_paper_15-02_phfvmeasurement.pdf).
PhilRice. 2014. Farming without Fossil Energy. National Rice R&D Highlights.
PhilRice. 2016. Biomass energy for rice farming. (Available at http://www.philrice.gov.ph/biomass-energy-rice-farming/).
PIDS. 2015. Competition Reform in the Philippine Rice Sector. (Available at http://dirp3.pids.gov.ph/webportal/CDN/PUBLICATIONS/pidsdps1504.pdf).
Pitney Bowes. 2017. Global Trade Solutions. Import duty & taxes calculation. (Available at: https://www.dutycalculator.com/new-import-duty-and-tax-calculation/).
PSA. 2012. 2009 Annual Survey of Philippine Business and Industry (ASPBI) – Agriculture, Hunting and Forestry for All Establishments: Final Results. (Available at http://psa.gov.ph/content/2009-annual-survey-philippine-business-and-industry-aspbi-agriculture-hunting-and-forestry).
PSA. 2013. 2010 Annual Survey of Philippine Business and Industry (ASPBI) – Manufacturing Sector: Final Results. (Available at http://psa.gov.ph/content/2010-annual-survey-philippine-business-and-industry-aspbi-manufacturing-sector-final-results).
PSA. 2015. Special report – Highlights of the 2012 census of agriculture. (Available at http://psa.gov.ph/content/special-report-highlights-2012-census-agriculture-2012-ca).
Raynk, S. 2004. Management and utilization of animal manure as sources for crop production under two major grazing systems in Tanzania.
RCREE. 2013. Tunisia 2012 – Renewable Energy Country Profile. (Available at http://www.rcreee.org/sites/default/files/tunisia_fact_sheet_print.pdf).
Reegle. 2012. Tunisia – 2012. (Available at http://www.reegle.info/policy-and-regulatory-overviews/TN).
REMB. No date. Philippines Renewable Energy Policy Updates.
Salary Explorer. 2015. Average Salary Survey in Tunisia. Salary Comparison by Job Category (Average Monthly Salary). (Available at http://www.salaryexplorer.com/salary-survey.php?&loctype%20=1&loc=220).
Schmitz, T. D. and GTZ. 2007. Feasibility Study for a National Domestic Biogas Programme in Tanzania.
SEAI. 2009. Potential of Farm Scale AD in Ireland.
Shackley, S., Carter, S., Knowles, T., Middelink, E., Haefele, S., and Haszeldine, S. 2012. Sustainable gasification–biochar systems? A case-study of rice-husk gasification in Cambodia, Part II: Field trial results, carbon abatement, economic assessment and conclusions. Energy Policy, 41, 618–623.
SIMGAS. 2016. Business Plan for the Biogas Milk Chiller.
270
Smith, K. R., Bruce, N., Balakrishnan, K., Adair-Rohani, H., Balmes, J., Chafe, Z., Dherani, M., Hosgood, D., Mehta, S., Pope, D. and Rehfuess, E. 2014. Millions dead: How do we know and what does it mean? Methods used in the comparative risk assessment of household air pollution. Annual Review of Public Health; Vol 35:1, 185–206. (Available at http://www.annualreviews.org/doi/abs/10.1146/annurev-publhealth-032013-182356).
SNV. 2012. The beans value chain in Kenya. (Available at http://www.fao.org/3/a-at264e.pdf).
SNV. 2017. Milk chilling with biogas: Market size in Rwanda, Tanzania, Kenya and Zambia. Unpublished.
STEG. No date. Contrat d’achat par la STEG de l’excèdent d’énergie électrique produite a partir d’une installation de cogénération ou d’énergies renouvelables. (Available at http://www.legislation.tn/sites/default/files/files/textes_soumis_avis/texte/contrat.pdf).
Stima. 2017. Electricity cost in Kenya. (Available at https://stima.regulusweb.com/historic).
TANESCO. 2016. Electricity Charges. (Available at http://www.tanesco.co.tz/).
TDB. 2015. Hali ya tasnia ya maziwa ya Tanzania 2013/14 Dar es Salaam: Tanzania Dairy Board.
The Star. 2016. KPLC to expand off-grid power in remote areas. By Constant Munda. November 8, 2016. The Star, Kenya. (Available at http://www.the-star.co.ke/news/2016/11/08/kplc-to-expand-off-grid-power-in-remote-areas_c1451576).
Thomson Reuters Foundation. Climate change talks should focus on food, despite resistance. (Available at http://news.trust.org/item/20170526132835-rjekn/).
TIC. 2015. United Republic of Tanzania President’s Office: Procedure for obtaining TIC certificate of incentives.
TLMI. 2015. Ministry of Livestock and Fisheries Development.
TRA. 2016. Importation report.
Trade Union Congress of Tanzania. 2016. Minimum Wages in Tanzania with effect from 01-07-2013 to 30-06-2016. (Available at http://www.mywage.org/tanzania/home/income/minimum-wage).
Tunisie Conseil Fiscal. 2017. Présentation du système fiscal tunisien. (Available at http://tunisieconseilfiscal.over-blog.com/pages/Presentation_du_systeme_fiscal_tunisien-5529227.html).
UNEP. 2016. Green Economy. Fiscal Policy Analysis – Kenya.
UNFCCC. 2013. CDM proposed standardized baseline: Technology switch in the rice mill sector of Cambodia (ASB0004). Bonn.
UNIDO. 2017. Promoting Women Empowerment for Inclusive and Sustainable Industrial Develop-ment in the Middle East and North Africa region. A study on women entrepreneurship development in Egypt, Jordan, Lebanon, Morocco, Palestine and Tunisia. UNIDO Technical Paper.
USAID. 2012. The Milk Value Chain: Generating employment and income and creating wealth while improving nutrition. Presentation from Jim Yazman, Phd. Bureau for Food Security. Country Strategies and Implementation Office. Washington, DC.
USAID. 2013. The Fresh Fruit and Vegetable Markets of East Africa. (Available at http://d3n8a8pro7vhmx.cloudfront.net/eatradehub/pages/83/attachments/original/1378732967/FFV_Markets_of_East_Africa_final_approved_and_compressed_July_17_2013.pdf?1378732967).
USAID and HCD. 2014. Horticulture Validated report 2014. (Available at http://www.agricultureauthority.go.ke/wp-content/uploads/2016/05/Horticulture-Validated-Report-2014-Final-copy.pdf).
USAID-KAVES. 2015. French Bean Value Chain Analysis. (Available at: http://pdf.usaid.gov/pdf_docs/PA00M2T2.pdf).

271
WageIndicator. 2016. Minimum Wages in Kenya with effect from 01-05-2015. Last update: 28-01-2016. (Available at: https://wageindicator.org/main/salary/minimum-wage/kenya/archive/1).
WHO. 2011. Indoor air pollution and health. Fact sheet no. 292.
WHO. 2014a. Burden of disease from Household Air Pollution for 2012. Description of method. (Available at http://www.who.int/phe/health_topics/outdoorair/databases/HAP_BoD_methods_March2014.pdf?ua=1).
WHO. 2014b. Burden of disease from Household Air Pollution for 2012. Summary of results. (Available at http://www.who.int/phe/health_topics/outdoorair/databases/HAP_BoD_results_March2014.pdf?ua=1).
WHO. 2015a. The Global Health Observatory (GHO) data: Public Health and Environment (PHE): Household air pollution. Population using solid fuels (estimates). Data for 2013. (Available at http://apps.who.int/gho/data/node.main.135?lang=en).
WHO. 2015b. Kenya – Country statistics. (Available at http://www.who.int/countries/ken/en/).
WHO. 2015c. United Republic of Tanzania – Country statistics. (Available at http://www.who.int/countries/tza/en/).
William, F. L. and Robert, G. K. 2015. The Economics of Applying Nutrient-Dense Livestock Waste at Low Rates. Oxford Journal: Review of Agricultural Economics 24(1): 41–159.
Winrock international. 2017. Assessing demand for solar water pumps in Kenya.
World Bank. 2015. Cambodian Agriculture in Transition: Opportunities and Risks (Economic and Sector Work, Report No. 96308-KH). Washington, DC: The International Bank for Reconstruction and Development/World Bank.
World Bank. 2016a. Tunisia. (Available at http://data.worldbank.org/country/tunisia).
World Bank. 2016b. Access to electricity. Sustainable Energy for All (SE4ALL) database from World Bank, Global Electrification database. (Available at http://data.worldbank.org/indicator/EG.ELC.ACCS.ZS).
World Bank. 2016c. Pump price for diesel fuel (US$ per litre). (Available at: http://data.worldbank.org/indicator/EP.PMP.DESL.CD).
World Bank. 2016d. Philippines Renewable Energy Development. Energy and Extractives Global Practice. East Asia and Pacific Region. Report No: 72689-PH. (Available at http://documents.worldbank.org/curated/en/845411468196760448/pdf/72689-PAD-P147646-OUO-9-Box394874B-R2016-0075-1.pdf).
World Bank. 2016e. East Asia and Pacific Economic Update April 2016: Growing Challenges. ISBN 1464809062, 9781464809064.
World Bank. 2016f. Project appraisal document on a proposed loan/credit to the republic of Kenya for a Kenya climate smart agriculture project. Report No: PAD1988.
WTO. 2015. G/AG/N/TUN/45. Domestic Support: Tunisia. Committee on Agriculture.
WTO. 2016. G/AG/N/TUN/49. Domestic Support: Tunisia. Committee on Agriculture.
Yanoubli. 2014. La filiere latiere en tunisie. Office de l’elevage et des pasturages.

272
ANNEX: ORGANIZATIONS AND PEOPLE MET DURING THE DATA COLLECTION MISSIONSPHILIPPINES
Name Institution/Organization
Fely V. Arriola
Asian Development BankElmar Elbling
Grace Yeneza
Anthony Obligado Bureau of Agricultural Research (BAR)
Ethcel Libang
Mario C. Marasigan
Department of Energy (DOE)Fortunato S. Sibayan
Ruby B. De Guzman
Cristina P. Valasco
Aristeo A. Portugal
FAO PhilippinesJasmine E. Magtibay
Tamara Palis Duran
Bernardo D. Tadeo Full Advantage Phils International, Inc.
Matthias Radek GIZ Philippines
Ferdinand Larona
Matthew Morell
International Rice Research Institute (IRRI)
Martin Gummert
Mary Grace Lanuza
Nguyen Van Hung
David E. Johnson
Richievel A. Ibañez
Jocelyn A. Amarante
Ann Yom Steel
Cecilia C. Borromeo
Land Bank of the Philippines (LBP)Generoso S. David
Emellie V. Tamayo
Roger F. Barroga
Philippine Rice Research Institute (PhilRice)Alexis Beloño
Arnold Juliano
Ernesto Vendivil Power plant in Nueva Ecjia
TUNISIA
Name Institution/Organization
Abdessalem El Khazen Agence Nationale pour la Maitrise de l’Energie (ANME)
Ahmed Zairi European Bank for Reconstruction and Development (EBRD)
Afef Ben Abda
FAO TunisiaAhmed Bougacha
Lamourdia Thiombiano
Carsten Schuettel GIZ Tunisia

273
Ben Salem MondherInstitut National Agronomique de Tunisie (INRAT)
Mejri Slah
Sana Zitouni
Ministère de l’Agriculture, des Ressources Hydrauliques et de la Pêche (MARHP)
Najoua Nacef
Afef Ben Rejeb
Henda Hanefi
Taoufik Jnaoui
Zeineb Ben Hmida
Dorsaf Ben Ahmed
Mohamed ToumiMinistère de l’Environnement et du développement durable
Tarek Zrelli
Karim DaoudSyndicat des Agriculteurs de Tunisie (SYNAGRI)
Amor Slama
Mr Ben Aïssa Ayadi TESCO
Chaima Fitomi
Ali Najmeddine Guiza
Union Tunisienne de l’Agriculture et de la Pêche (UTAP)Sarra Ben Hammadi
Marwoua Abdelli
KENYA
Name Institution/Organization
Nicholas Ozor African Technology Policy Studies Network (ATPS)
Evgenia Sokolova Aktiveragrupp
Joram Wambugu AMIRAN
Caroline Makenzi ASD Kenya
Mwende Kusewa CARE Kenya
Katharina Meder
GIZ KenyaMacben Makenzi
Florian Simonsen
Robert Allport
FAO KenyaRobert Allport
Stanley Kimereh
Thomas Were
Joseph Irungu Future pump
Charles Ahenda-Bengo
Hindri Kuipers GIC (Green Innovation Centre)
Samuel Karongo Horticulture Crops Directorate
James Kamao Paul
Albertina Muema JamiiBora Bank
Samwel Tobiko Juhudi Kilimo
Francis Muthami Kenya Agricultural Productivity & Agribusiness Project (KAPAP)
Richard K. Rugendo Kevian Kenya
Roberto AnyosoKilifi plantation
Chris Wilson

274
Benjamin T. Kibor
Ministry of Agriculture, Livestock and fisheriesRobin M Mbae
Benjamin T. Kibor
Robin M Mbae
Samwel Matoke Ministry of Agriculture, Livestock and fisheries - Livestock departmentJoan Otiang
Vincent N. Kabuti National Irrigation Board (NBI)
Manu Schärer Nestlé Equatorial African Region | Nairobi | Kenya
Peter KiboiNew Kenya Co-operative Creameries Ltd (New KCC)
Pacomy Nguli
Quinn Reifmesser REEEP
Jacob Ojal Sam Malanga cooperative
Dorinne Poelhekke SimGas B.V
Florence Kariuki SNV
Samir Ibrahim SunCulture
Gregory Kiluva Sundanzer
Angela Muga The Co-operative Bank of Kenya
Okisegere Ojepat The Fresh Produce Exporters Association of Kenya (FPEAK)
Grant Brooke Twiga Foods
Willy Kirwa Willens Dairy Farm
Bikash Raj Pandey
Winrock International
Bernard Ngetich Bii
Jennifer Holthaus
Robert Foster
Bikash Raj Pandey
TANZANIA
Name Institution/Organization
Fabian Mwakatuma Fabian Mwakatuma and Family Company Limited
Mkani D. WaziriFAO Consultant
Thomas P. Mkunda
Fred KafeeroFAO Tanzania
Ajuaye Sigalla
Herry John Kilimanjaro creameries Ltd, TAMPA
Walim K. Nahdi Milkcom/Dar Fresh
Salim M. Nahdi Milkcom/Dar Fresh/Al-Hushoom ICDV
Nathaniel R. Mbwambo Ministry of Agriculture, Livestock and Fisheries (MALF)
Jacob W. M. Mayalla
Ministry of Energy and Minerals (MEM)Paul Morris Kiwele
Japhari Chinjara
Nyaso Makwaya
Bengiel H. Msofe Rural Energy Agency (REA)
Nelson KilongoziTanzania Dairy Board (TDB)
Deogratius Mlay
Edmund MarikiTanzania Milk Processors Association (TAMPA)
Feddy Tesha
Doreen Maro Tanzania Milk Producers Association (TAMPRODA)


CA4064EN/1/04.19
ISBN 978-92-5-131371-8
9 7 8 9 2 5 1 3 1 3 7 1 8
CA4064EN/1/07.19