measuring human capital driving business results - pwc · pdf filemeasuring human capital...
TRANSCRIPT

Measuring human capital Driving business resultsIndia Human Capital Effectiveness Survey – 2010
www.pwc.com/india
27 March 2011

2 PwC
Background and Context –About Saratoga, its services and value proposition
Saratoga India Human Capital Effectiveness Survey - 2010
Key findings
Way forward
Contents

HumanCapitalEffectiveness 3
Background & Context
PwC Saratoga
The measurement, benchmarking and strategic application of human capital and business function information and advice.
Bringing objectivity and business alignment to human capital activities.
About Saratoga
Using a proven methodology developed over some 25 years across the world, Saratoga benchmarking and measurement services produce an executive appraisal of the strengths and limitations of an organization’s human capital resource, enabling organizations to focus upon those issues that will have a
major impact on improving performance and increasing competitive advantage. By combining metrics with the PwC client experience of best practice, Saratoga benchmarks and measures are used to provide a valuable insight into the key drivers of HR functional effectiveness and human capital performance.
4 PwC
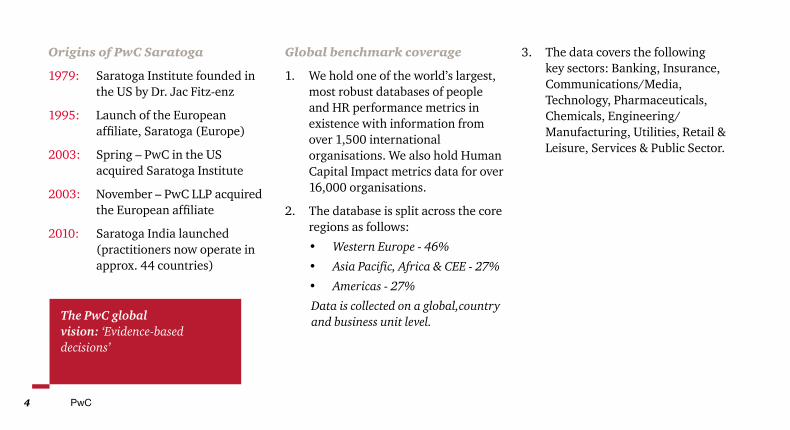
Origins of PwC Saratoga
1979: Saratoga Institute founded in the US by Dr. Jac Fitz-enz
1995: Launch of the European affiliate, Saratoga (Europe)
2003: Spring – PwC in the US acquired Saratoga Institute
2003: November – PwC LLP acquired the European affiliate
2010: Saratoga India launched (practitioners now operate in approx. 44 countries)
Global benchmark coverage
1. We hold one of the world’s largest, most robust databases of people and HR performance metrics in existence with information from over 1,500 international organisations. We also hold Human Capital Impact metrics data for over 16,000 organisations.
2. The database is split across the core regions as follows:
• Western Europe - 46%
• Asia Pacific, Africa & CEE - 27%
• Americas - 27%
Data is collected on a global,country and business unit level.
3. The data covers the following key sectors: Banking, Insurance, Communications/Media, Technology, Pharmaceuticals, Chemicals, Engineering/ Manufacturing, Utilities, Retail & Leisure, Services & Public Sector.
The PwC global vision: ‘Evidence-based decisions’

HumanCapitalEffectiveness 5
Our proposition - How does Saratoga help?
Saratoga is PwC’s human capital measurement and benchmarking business – the most extensive database of HR metrics available.
Our aim is to assist organisations in evaluating their human capital and its contribution to bottom-line profitability.
We offer a range of quantitative and qualitative tools which help organisations to identify the strategic impact of their people, as well as to benchmark themselves against peers in the marketplace in order to identify areas of risk or efficiency, and to evidence best practice and innovation.
This enables HR leaders to gain a clearer understanding of the effectiveness of their function, and of the HR programmes that they implement.
This also enables HR to demonstrate the impact that they are having on the business’ success, and to ensure and evidence the alignment of HR activities to business strategy.

6 PwC
Issue/Event Cost reduction Business growth & expansion New CFO/FD/HRD HR transformation
Planning or implementing an HR shared service
Improving HC/HR management
information
Deals: pre-M&A due diligence and
post-deal integration
Stakeholder CFO/FD Board/C-Suite CFO/FD HRD FD/HRD/Ops HRD Board/C-Suite/HRD
Proposition • Quantify and benchmark both people cost drivers and HR functional cost alignment
• Identify opportunities and make evidence-based decisions regarding strategic cost reductions and workforce alignment
• Identify current state of workforce performance, productivity and impact on the bottom-line
• Benchmark performance against your competition
• Access ROI methodologies for investments in new initiatives
• Develop a fresh baseline of your organisation or function
• Quantify and benchmark HR functional performance (including shared services) and human capital costs
• Provides a measurement of the current state HR function and benchmarks against peers
• Align HR processes to internationally used Saratoga definitions and methodology
• Identify opportunities for improved process efficiency and service delivery
• Understand the contribution of HR business partners
• Understand the cost of HRSS operations
• Align HR processes to Saratoga definitions and methodology
• Benchmark HRSS against peers to understand best practice in performance and service delivery
• Understand performance of outsource providers / SLA relative to benchmarks
• Largest people metrics database (HC Impact, Engagement, HR, HRSS, Talent Management)
• Measurement framework design linked to business/HR strategic goals
• Deep expertise in data governance and definitions
• Masterclass and workshop support to improve HR specialist skills
• Pre-deal: Input to due diligence to identify target cost saving, financial targets, workforce rightsizing etc.
• Post-deal integration: Using HC and HR measurement impact to make evidence-based decisions with regards to workforces integration size and cost, target HR operating model, HR process design, reward system, employee relations and communications

HumanCapitalEffectiveness 7
Saratoga offers measurement & benchmarking in three areas
Human capital: Measuring the Impact of your workforce
Support Function effectiveness: Measuring the impact of Support
Functions Advanced measurement
Current performance
Includes measures in the following categories:
• Human capital ROI
• Financial productivity
• Remuneration
• Turnover
• Organisational structure
• HR function performance
Future
Includes measures in the following categories:
• Bringing in the right people
• Developing your people
• Losing your people
• Involving / motivating your people
Measuring the efficiency and effectiveness of Support Functions
Includes measures in the following categories
• Delivery model
• Activity analysis
• Functional capability
• Including:
• Voice of the customer surveys
• Structured interview
Additional areas of measurement and consultancy
• Talent management
• Shared Services
• Leadership
• Innovation
• Sustainability
• Diversity

8 PwC
Human Capital Effectiveness Survey - 2010
India Human Capital Effectiveness Survey 2010
PwC Saratoga India team conducted human capital effectiveness survey 2010 for Indian companies. The intent of the survey was to help Indian companies to develop an understanding of their
IT/ITeS
Pharma
Manufacturing
FMCG
Others
22%
22%
13%
11%
32%21%
30%27%
22%
0-500
500-1000
1000-5000
>5000
22%
24%
54%
0-100crores
100-500crores
>500crores
human capital contributions to business performance.
37 companies participated in the survey from across sectors.
Saratoga human capital effectiveness report provides detailed human capital performance metrics and benchmarks to allow companies to compare themselves with peers by industry, revenue size and employee size.

HumanCapitalEffectiveness 9
Structure of the HCE report
The 2010 Indian human capital effectiveness report comprises of the following sections, each dealing with a separate area of measurement:
01 Human Capital Impact
Sub section Description Key Metrics Usage & application
Financial impact The effect of human capital activities on financial results
Revenue per FTE, Cost per FTE & Profit per FTE.
• Define productivity standards• Determine resource requirement/resource allocation• Determine effectiveness of various human capital
intervention • Identify future focus area (in terms of cost/revenue per
employee) to drive HCROI
Productivity & ROI The contribution of human capital investment to financial performance
Remuneration/Revenue, Average remuneration, HCROI.
02 Human Capital Engagement
Sub section Description Key Metrics Usage & application
Resourcing Replacing and growing knowledge & skill capabilities
External recruitment rate, External replacement rate, Offer acceptance rate.
Organizations can use the insights drawn from this section of the report to identify specific areas of human capital engagement, (impacting productivity and financial results), for requisite improvement. Further, organizations can design focused interventions around these areas. (like low L&D Investments, low performance related pay, high replacement rate, high attrition etc).
Compensation & benefits
The level & structure of remuneration payments.
Average benefits, PRP, Attendance related pay.
Learning & development
Provision of learning & development opportunities.
FTE per L&D function FTE, L&D hours per FTE, L&D Investments.
Turnover Knowledge & skills departing from the organization.
Termination rate, Resignation rate, Resignation profile by tenure.

10 PwC
03 HR function
Sub section Description Key Metrics Usage & application
HR function The cost & structure of HR & HR process delivery.
FTE per HR dept. FTE, HR Dept. cost per FTE, Process cost per FTE.
Organizations can use the insights drawn from this section to evaluate the effectiveness of HR function (by correlating metrics in this section with human capital engagement metrics) and can restructure the resource allocation, time and budget across various HR processes.
04 Organization & workforce structure
Sub section Description Key Metrics Usage & application
Workforce structure Measure of workforce & organization structure including diversity.
Span of control, Management & Professional %, Workforce diversity.
Organizations can use this section to benchmark the level of employee empowerment, nature of workforce and its impact on (in terms of workforce segments, employee tenure and gender diversity etc) various human capital engagement metrics.

HumanCapitalEffectiveness 11
Key Findings
• Eng/Mfg sector generates the most revenues and profits per employee, followed by FMCG and Pharma sector. All participant organisations within IT/ITeS and Pharma sectors have similar profit margins per employee.
• Organizations with higher revenue base incur higher cost per employee (1.3x) but also earn higher profit per employee (1.4x) compared to organizations with lower revenue base.
• Though organizations across different workforce size have similar productivity levels (with remuneration levels constituting 12 to 14% of revenue), those with larger revenue base enjoy 2.2 times higher productivity, compared to smaller organizations.
Note:1.Smallorganizationsmeanorganizationswithworkforce/revenuesizefrom0to1000FTEand`0to500crore2.Largeorganizationsmeanorganizationswithworkforce/revenuesize>1000FTEand`>500crore
Financial Impact:
• Revenue per FTE
• Cost per FTE
• Profit per FTE
Productivity & RoI:
• Remuneration / Revenues
• Remuneration / Total Costs
• Human Capital Return on Investment (HCROI)

12 PwC
• Larger organizations hire 25% more talent from external markets.
• On average, Indian organizations spend approx. ` 25,500 per hire. However, FMCG and other unclassified sectors spend more than double the amount towards their recruitments. This could be because of the high cost of their recruitment teams.
• Looking at the cost per hire and external recruitment rate together for organizations with workforce size
of FTE 1000-5000 & revenue size of > ` 500 crore, organizations with the maximum external recruitment rate have the least cost per hire, as they spread the fixed costs of hiring over a larger number of hires.
• IT/ITeS sector recruits the most number of graduates with 15% graduate recruitment rate, however when it comes to retaining entry level talent, Eng/Mfg sector leads the Indian industry.
Resourcing
• External Recruitment Rate
• External Addition Rate
• External Replacement Rate
• Cost per Hire
• Time to Accept
• Offer Acceptance Rate
• Graduate Recruitment Rate
• Graduate Retention Rate
Note:1.Smallorganizationsmeanorganizationswithworkforce/revenuesizefrom0to1000FTEand`0to500crore2.Largeorganizationsmeanorganizationswithworkforce/revenuesize>1000FTEand`>500crore
HumanCapitalEffectiveness 13
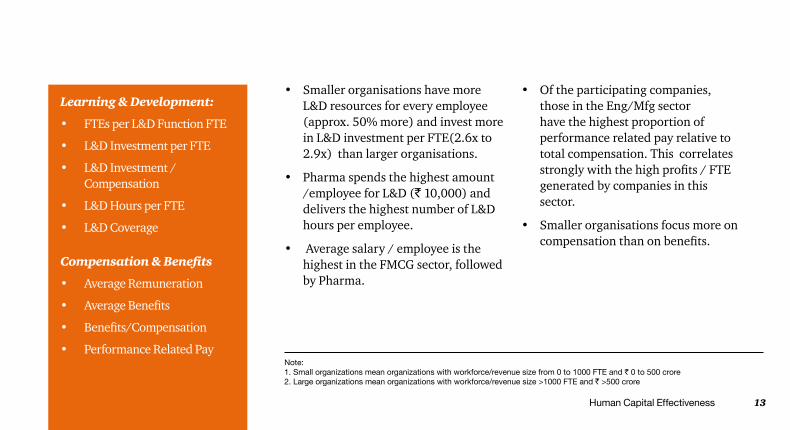
• Smaller organisations have more L&D resources for every employee (approx. 50% more) and invest more in L&D investment per FTE(2.6x to 2.9x) than larger organisations.
• Pharma spends the highest amount /employee for L&D (` 10,000) and delivers the highest number of L&D hours per employee.
• Average salary / employee is the highest in the FMCG sector, followed by Pharma.
• Of the participating companies, those in the Eng/Mfg sector have the highest proportion of performance related pay relative to total compensation. This correlates strongly with the high profits / FTE generated by companies in this sector.
• Smaller organisations focus more on compensation than on benefits.
Learning & Development:
• FTEs per L&D Function FTE
• L&D Investment per FTE
• L&D Investment / Compensation
• L&D Hours per FTE
• L&D Coverage
Compensation & Benefits
• Average Remuneration
• Average Benefits
• Benefits/Compensation
• Performance Related PayNote:1.Smallorganizationsmeanorganizationswithworkforce/revenuesizefrom0to1000FTEand`0to500crore2.Largeorganizationsmeanorganizationswithworkforce/revenuesize>1000FTEand`>500crore

14 PwC
• IT/ITeS sector has the highest termination and resignation rates.
• Among employees resigning, nearly 75% have less than 3 years experience. There is hardly any difference between small & large organizations.
• With more than 33% of the employees resigning within 1 year of their service, Pharma sector has the highest attrition among employees with less than a year’s tenure.
• The resignation rate in smaller organizations is higher than larger organization by factor of 1.4 to 1.8 times.
• The average tenure in the FMCG sector (78 months) is significantly higher than in all the other sectors (approx. 32 months).
Turnover:
• Termination Rate
• Involuntary Termination Rate
• Dismissal Rate
• Resignation Rate
• Resignation Profile by Tenure
- <1 year of service
- 1 ≤ 3 years of service
- 3 ≤ 5 years of service
- 5 ≤ 10 years of service
- 10+ years of service
Note:1.Smallorganizationsmeanorganizationswithworkforce/revenuesizefrom0to1000FTEand`0to500crore2.Largeorganizationsmeanorganizationswithworkforce/revenuesize>1000FTEand`>500crore

HumanCapitalEffectiveness 15
• In Pharma, the size of the HR team relative to the total work force is smaller than in other sectors.
• FMCG companies are at the other end of the spectrum, employing larger HR teams relative to their workforce. Consequently, HR function costs / per employee also tends to be high in that sector relative to other sectors.
• IT/ITES companies employs fewer HR resources, and have lower HR function costs / employee than other sectors.
• Larger organizations (both in terms of revenue and workforce size) service on average 40% more employees and incur 75% to 50% less HR department costs per FTE, when compared with smaller organizations.
• HR Departments costs as a percentage of total cost are significantly higher in the IT/ITeS (1.4%) sectors and organisations with less than `. 100 crore revenue (2.3%).
HR Function
• FTEs per HR Department FTE
• HR Department Costs per FTE
• HR Department Costs/ Total Costs
Note:1.Smallorganizationsmeanorganizationswithworkforce/revenuesizefrom0to1000FTEand`0to500crore2.Largeorganizationsmeanorganizationswithworkforce/revenuesize>1000FTEand`>500crore

16 PwC
• FMCG sector uses the most number of managers for every employee (1 manager for every 3.8 employees) than other sectors.
• Small organizations have 1.6 to 3.6 times more managers per employee as compared to large organizations.
• Smaller organizations (in revenue and workforce size) tend to employ a larger proportion of professional and managerial staff than larger ones.
• IT/ITeS sector employs significantly higher proportion of women in its workforce than other sectors
Workforce Structure:
• Span of Control
• Management & Professional %
• Workforce Diversity: Women
• Rookie Ratio
Note:1.Smallorganizationsmeanorganizationswithworkforce/revenuesizefrom0to1000FTEand`0to500crore2.Largeorganizationsmeanorganizationswithworkforce/revenuesize>1000FTEand`>500crore

HumanCapitalEffectiveness 17
Gender Diversity: Comparativefactor-IndustrySector
Industry sector 25th percentile Median 75th percentile
IT/ITES 23% 30% 40%
Pharma 6% 8% 9%
Eng/Mfg 3% 5% 5%
FMCG 7% 8% 8%
Others 5% 11% 16%
All 5% 9% 22%
All figures are in %.
Termination Rate: Comparativefactor-RevenueSize
Revenue size 25th percentile Median 75th percentile
0-100 crore 14% 21% 30%
100-500 crore 15% 19% 21%
More than 500 crore 8% 11% 15%
All 10% 15% 19%
All figures are in %.
-
-
-
-
--
-
-
-
-
Sample Standard Analysis

18 PwC
Way forward
Saratoga Report
All 2010 India Human Capital Effectiveness Survey participants will get a free copy of the report. Non participants can purchase the report.
India Human Capital Effectiveness Survey -2011
India Human Capital Effectiveness Survey 2011 will open for participation from May 2011 with a participation fee of ` 50,000.All participants will get a free copy of India Human Capital Effectiveness Survey Report-2011.
They will also get company specific quantitative scorecard with benchmarks across 4 comparator groups (i.e. All India, Industry, FTE size and revenue size).
Measuring human capital Driving business resultsHuman capital effectiveness
www.pwc.com/india
SaratogaHuman Capital Effectiveness–Company Scorecard Analysis & Interpretation ReportSingle Comparator Group - Industry
7 Feb 2011
www.pwc.com
Saratoga Human Capital Metrics XXXX Scorecard for XXXX
XXXX XXXX XXXX XXXX XXXX
0 1 1 0 1 1 0 1 1 0 1 1
FINANCIAL IMPACT
Human capital impact
Revenue per FTE (INR) 19,790,689 2,473,520 3,845,551 7,999,075 2,729,513 4,679,681 21,030,472 73% 2,959,637 4,283,607 9,759,127 2,829,017 3,749,774 7,308,896
Cost per FTE (INR) 19,375,677 1,834,851 3,331,451 6,825,350 2,169,061 4,490,233 11,075,260 2,645,699 3,331,451 7,725,183 95% 2,432,917 3,173,612 5,775,767 100%
Profit per FTE (INR) 415,013 249,021 607,163 997,893 40% 281,744 396,891 844,705 55% 360,947 634,565 1,146,088 32% 201,520 426,097 854,226 44%
PRODUCTIVITY AND ROI
Remuneration/Revenue (%) 2% 6.71% 12.56% 18.25% 5% 5.50% 6.84% 17.05% 0% 6.2% 7.6% 16.9% 8% 4% 7% 19% 14%
Compensation/Revenue (%) 2% 6.09% 9.69% 18.54% 9% 4.45% 6.67% 16.02% 9% 4.9% 7.9% 13.0% 11% 4% 7% 9% 11%Compensation/Revenue (%) 2% 6.09% 9.69% 18.54% 9% 4.45% 6.67% 16.02% 9% 4.9% 7.9% 13.0% 11% 4% 7% 9% 11%
Remuneration/Total Costs (%) 2% 8.07% 15.35% 22.07% 5% 5.12% 8.13% 18.10% 0% 5.9% 9.4% 17.0% 8% 5% 7% 24% 14%
Compensation/Total Costs (%) 2% 5.84% 13.28% 25.53% 6% 5.05% 7.94% 21.09% 9% 5% 10% 16% 11% 5% 7% 13% 11%
Outsource Rate (%) 21% 1% 3% 6% 100% 3% 5% 8% 100% 0% 4% 8% 100% 0% 2% 4% 100%
Total Productivity (%) 23% 14.32% 24.42% 34.22% 45% 19.01% 24.42% 25.89% 33% 8% 16% 24% 67% 8% 20% 47% 60%
Core Productivity (%) 3% 8.22% 19.18% 31.11% 4.98% 12.06% 19.84% 4% 9% 14% 4% 7% 42%
Average Remuneration (INR) 473,814 357,240 480,909 646,880 48% 337,994 455,100 552,214 57% 218,165 388,431 488,098 58% 186575 388431 488004 63%
Human Capital ROI (INR) 1.88 1.53 1.79 2.63 52% 1.61 1.78 2.36 57% 1.59 1.88 3.23 50% 1 2 3 43%
results: your result is in the quartile furthest from our target results: your result is in the quartile furthest from our target figures: your result lies within the 25th75th interquartile range figures: your result achieves the suggested target
XXXX XXXX XXXX XXXX XXXX
Average Remuneration (INR) 473,814 357,240 480,909 646,880 48% 337,994 455,100 552,214 57% 218,165 388,431 488,098 58% 186,575 388,431 488,004 63%
Variable Compensation (%) 15% 4.4% 10.7% 14.9% 75% 5.9% 10.7% 14.0% 8% 13% 16% 72% 3% 12% 14%
Performance Related Pay (%) 15% 4.0% 11.0% 15.9% 72% 7.1% 11.4% 14.4% 10% 13% 16% 69% 3% 12% 14%
Compensation and benefits
Performance Related Pay (%) 15% 4.0% 11.0% 15.9% 72% 7.1% 11.4% 14.4% 10% 13% 16% 69% 3% 12% 14%
Attendance Related Pay (%) 0.0% 0.0% 0.0% 0.0% 0.0% 0.0% 0.0% 0% 0.0% 0.0% 0.0% 0% 0.0% 0.0% 0.0% 0%
Average Benefits (INR) 49,441 7,795 15,633 45,012 78% 9,313 13,681 23,085 100% 4,726 13,093 50,408 67% 2,208 6,491 50,408 63%
Benefits/Compensation (%) 11.7% 1.9% 3.5% 11.0% 83% 2.1% 2.9% 6.4% 100% 1.6% 6.4% 11.7% 75% 0.8% 10.8% 11.7% 75%
results: your result is in the quartile furthest from our target figures: your result lies within the 25th75th interquartile range figures: your result achieves the suggested target
XXXX XXXX Sector Percentiles XXXX XXXX XXXX
Turnover
Termination Rate (%) 21% 10% 18% 22% 71% 9% 18% 23% 64% 9% 12% 19% 84% 7% 18% 21% 80%
Involuntary Termination Rate (%) 3.1% 1% 2% 4% 68% 1% 1% 7% 64% 1% 2% 4% 63% 1% 2% 3% 80%
Resignation Rate (%) 18% 9% 15% 19% 66% 8% 13% 19% 64% 8% 11% 15% 89% 6% 15% 17% 90%
Resignation Rate (%) 18% 9% 15% 19% 66% 8% 13% 19% 64% 8% 11% 15% 89% 6% 15% 17% 90%
<1 year of service Resignation Rate (%)<1 year of service Resignation Rate (%) 8% 17% 30% 7% 10% 23% 7% 13% 28% 12% 22% 41%
1 ≤ 3 years of service Resignation Rate (%)1 ≤ 3 years of service Resignation Rate (%) 12% 15% 24% 9% 13% 30% 10% 14% 19% 9% 14% 21%
3 ≤ 5 years of service Resignation Rate (%)3 ≤ 5 years of service Resignation Rate (%) 6% 11% 15% 3% 12% 15% 4% 11% 15% 10% 11% 15%
5 ≤ 10 years of service Resignation Rate (%)5 ≤ 10 years of service Resignation Rate (%) 2% 7% 10% 5% 6% 10% 4% 7% 10% 2% 4% 7%
10+ years of service Resignation Rate (%)10+ years of service Resignation Rate (%) 0% 2% 5% 0% 4% 9% 1% 2% 5% 1% 2% 2%
Saratoga Report
Company Scorecard Analysis and Interpretation Report (Single comparator Group - Industry)
Company Specific Human Capital Effectiveness Scorecard
PwC
Background & Context
• Peers from the pharmaceutical sector
•Legacy Schering Plough
•Aventis Pharmaceuticals Ltd.
•Bristol Myers Squibbs Pvt. Ltd.
•Chiron Panacea Vaccines Private Limited.
•Fresenius Kabi Oncology Limited India
•Dr. Reddys Laboratories Ltd
•Jubilant Life Sciences Ltd.
Jubilant Human Capital Performance Scorecard
PwC Saratoga India team undertook human capital effectivenesssurvey 2010 for Indian companies as part of its launch in India. Theintent of the survey was to build India database and create a platformfor Indian companies to develop an understanding around itshuman capital contributions to business performance.
During the course of the survey 36 companies from across sectorsparticipated to leverage its benefits and shared data points acrossmetrics.
Saratoga team has analyzed & benchmarked Jubilant’s detailedhuman capital performance across metrics categorized under 4major heads Human Capital Impact, Human Capital Engagement,Human Resource Function and Workforce & Organization. Peerbenchmarking is done in 4 categories
• Revenue size- >500 crores
• All companies
• Industry- Pharmaceutical
• FTE size band- >5000
4February 2011
PwC
Key Metric Profile
• Jubilant is well placed on people costs but can improve on people productivity measured by revenues / per FTE, thereby increasing profits generated per employee.
• Relatively low people costs have resulted in a high HCROI.
• But, does Jubilant need to invest more in its people? Are low people costs driving high 1st year attrition (see slide 8)
• Will a higher investment in people in sales and marketing drive higher revenues / FTE? (See slide…)
Lower 2nd 3rd Upper %ileQuartile Quartile Quartile Quartile Rank
HUMAN CAPITAL IMPACT
Rev en u e per FT E (INR) 3,893,951 33%
Cost per FT E (INR) 3,134,531 33%
Opera t in g In com e per FT E (INR)
Gross Writ t en Prem iu m s per FT E (INR)
Net Opera t in g Cost s per FT E (INR)
Profit per FT E (INR) 759,420 40%
Rem u n era t ion /Rev en u e (%) 0%
Rem u n era t ion /T ot a l Cost s (%) 0%
Rem u n era t ion /Gross Writ t en Prem iu m
Rem u n era t ion /Opera t in g In com e (%)
Rem u n era t ion /Net Opera t in g Cost s (%)
A v era ge Rem u n era t ion (INR) 0.0%
Hu m a n Ca pit a l ROI (INR) 3.57 75%
Key m etric profile
4,622,234
1,057,710
1,351,934
7.58% �
9.42% �
295,148
3.77
Jubilant Human Capital Performance Scorecard
6February 2011
PwC
Support Function & Workforce Structure
Jubilant Human Capital Performance Scorecard
• With 2.8 %of the total cost incurred on Sales & R & DJubilant is placed in the lower quartile. Would an increase in spending on these 2 functions (including enhanced performance pay) increase revenues?
• Jubilant is employing the least number of women in the industry with only 4 % of the workforce constituting women.
•Jubilant is employing 1 manager for 17 employees which is low in the industry.
•Jubilant has the least % of management & professional in its overall workforce.
•With 15% of its overall workforce constituting for <2yrs tenured employees, Jubilant has a relatively low rookie ratio.
11February 2011
14 PwC
L&D hrs per FTE L&D investment per FTE
L&D coverage L&D investment/comp.
With approximately ` 7000 of learning & development investments per employee, Indian organizations are delivering 14.6 L&D hours per FTE covering 68% of employee population.
• Smaller organisations have more L&D resources for every employee (approx. 50% more) and invest more in L&D investment per FTE(2.6x to 2.9x) however deliver 10% to 15% fewer L&D hours than larger organizations.
• Pharma spends the highest amount /employee for L&D (` 10,000) and delivers the highest number of L&D hours per employee.
• Eng/Mfg sector delivers high L&D hours (17.1) but to a select employee population (Lowest L&D coverage-34%).
• This sector also has smaller L&D teams & lowest L&D investment (` 3573 per employee)
• Of the participating companies, those in the IT/ITeS have the lowest spend on L&D per employee.
• When reviewing L&D measures of individual organisations we recommend that these be analysed in tandem with productivity and turnover measures.
FTE per L&D function FTE 323.6
14.6`7014
68%1.6%
Note: i. Small organizations mean organizations with workforce/revenue size from 0 to 1000 FTE and ` 0 to ` 500 crore ii. Large organizations mean organizations with workforce/revenue size >1000 FTE and > ` 500 crore
Learning & Development:
• FTEs per L&D Function FTE
• L&D Investment per FTE
• L&D Investment / Compensation
• L&D Hours per FTE
• L&D Coverage
Human Capital Engagement
40 PwC
Human Capital ROI
Definition
Revenue is the total monetary value generated from the sale of goods and services, together with any other income credited to the organisation via transfer price revenues, subsidy or grant.
The total costs of the organisation includes the costs of goods and services produced or purchased for resale, direct labour and materials, transfer prices of goods purchased from other parts of the organisation, operating expenses and overheads including any corporate recharges, financial expenses (depreciation, amortization and interest) and changes in provisions for bad and doubtful debts. It can generally be calculated as the difference between revenue and profit before tax in the profit and loss account.
Compensation is the gross cost to the employer of all salaries and wages, the variable elements, performance-related pay (bonuses, commissions profit-share etc) and attendance related pay (overtime, shift allowances, standby etc) and national insurance/ social security.
Benefits includes all other reward components e.g. pens ions, healthcare, cars, stock options, professional fees, childcare, lifestyle benefits, subsidized products/services etc.
Purpose
Human capital ROI describes the return to the organisation for every unit of expenditure on employees most usefully expressed in the format shown below:
Productivity and ROI
Profit is assumed to be a guiding principal for most organisations, indeed a core KPI, and it underpins the Human capital ROI calculation. However, demands to “Improve profit!” are of little assistance in determining how to achieve this from a human capital management perspective. Human capital ROI has greater value in combining all of the primary business drivers where improvements can be targeted. Positive impact is achieved under the following conditions:
• Revenue improvement
• Non-people cost efficiencies
• Improved alignment of remuneration payments
• Better controlling the number of FTEs employed
In reality, all of these factors move in combination, but it is exactly these interdependencies that are often overlooked in using linear metrics such as Revenue or
• Revenue by business unit (BU)• Revenue by region• Revenue by product line
• Materials costs• Locations• Financing costs• Facilities and overhead costs• Cost of outsourced activities
• FTEs by BU, region & function• Full-time Vs Part-time• Temporary, casual & contract workers• Utilization of overtime• Management structure• Excess absence• Headcount and recruitment control
• Salaries and wage levels• Performance related pay• Attendance related pay• Benefits structure• Grade structure• Social security costs
Revenue - Non-people costs
FTEs x Average remuneration
Revenue - (Costs - (Compensation + Benefits))
Compensation + Benefits
38 PwC
Data classifications
For the purposes of our analyses, participating organisations have been classified into different buckets along the following three parameters:
1. Industry Sector
• Information Technology and Information Technology-enabled Services (IT/ITeS)
• Pharmaceuticals (Pharma)
• Engineering and Manufacturing (Eng/Mfg)
• Fast Moving Consumer Goods (FMCG)
• Others
2. FTE Size
• 0-500 employees
• 500-1000 employees
• 1000-5000 employees
• More than 5000 employees
3. Revenue Size
• ` 0-100 crores
• ` 100-500 crores
• More than ` 500 crores
Metric relationships
We recommend analysis of Remuneration/Total costs in conjunction with the following metrics:
• Revenue per FTE (or industry sector equivalents)
• Cost per FTE (or industry sector equivalents)
• Profit per FTE
• Human capital ROI
• Remuneration/Revenue (or industry sector equivalents)
• Compensation and benefits metrics and salary survey data
• Behavioral measures such as Resignation rates and qualitative measures
• Measures of workforce structure that influence the comparative remuneration bill e.g. Span of control, Management and Professional %
Productivity and ROI
Comparative factor: Industry Sector
Industry sector 25th percentile Median 75th percentile
IT/ITES 43.15% 45.00% 73.89%
Pharma 11.03% 12.56% 15.31%
Eng/Mfg - - -
FMCG 7.15% 7.22% 7.29%
Others 5.50% 6.84% 17.05%
All 7.21% 12.56% 18.25%
All figures are in %.
50%
40%
30%
20%
10%
0%
70%
60%
90%
80%
100%
IT/ITES Pharma FMCG Others All
75th percentile - Median 25th percentile
-
-
- -
--R
emun
erat
ion
/To
tal c
ost
s %
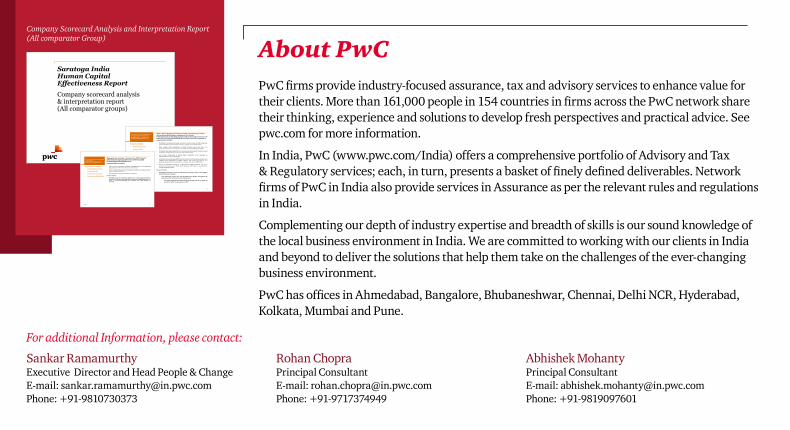
PwC firms provide industry-focused assurance, tax and advisory services to enhance value for their clients. More than 161,000 people in 154 countries in firms across the PwC network share their thinking, experience and solutions to develop fresh perspectives and practical advice. See pwc.com for more information.
In India, PwC (www.pwc.com/India) offers a comprehensive portfolio of Advisory and Tax & Regulatory services; each, in turn, presents a basket of finely defined deliverables. Network firms of PwC in India also provide services in Assurance as per the relevant rules and regulations in India.
Complementing our depth of industry expertise and breadth of skills is our sound knowledge of the local business environment in India. We are committed to working with our clients in India and beyond to deliver the solutions that help them take on the challenges of the ever-changing business environment.
PwC has offices in Ahmedabad, Bangalore, Bhubaneshwar, Chennai, Delhi NCR, Hyderabad, Kolkata, Mumbai and Pune.
About PwCCompany Scorecard Analysis and Interpretation Report (All comparator Group)
Saratoga India Human Capital Effectiveness Report
Company scorecard analysis & interpretation report (All comparator groups)
PwC
When compared with organizations in India, Low Revenue per FTE is driving low profitability per employee for DS Limited. With high people productivity (measured by remuneration/revenue), DS Limited is generating high HCROI (Rs 3.3-Upper Quartile) compared to organizations in India.
• DS Limited is well placed on people cost however lowest revenue per FTE is adverselyaffecting its ability to generate higher profit per employee in the FMCG industry.
• When compared with organizations of similar workforce and revenue size, lowproductivity (measured as revenue per FTE) is affecting its profitability per employee.
• DS Limited enjoys high productivity levels (measured as remuneration/revenue) across allcomparator groups however it is the best in the sectoral analysis.
• Low average remuneration is driving higher productivity levels (measured asremuneration/revenue) for DS Limited.
• DS limited is generating high HCROI (but still below the preferred upper quartile) whencompared with organizations of similar workforce and revenue size however it isgenerating the least profit on remuneration, compared with peers in FMCG sector.
• Absence of performance related pay coupled with low L&D investments and lowerinvestments in line functions like S ales & Marketing, DS Limited is generating lowrevenue and profit per FTE.
Points to Ponder
• DS Limited may like to focus on enhancing revenue per FTE to drive higherprofitability per employee.
• For enhancing revenue per FTE DS limited can further strengthen thefollowing areas of human capital engagement-:
• Introduce Performance Related Pay (In the long run it can target topay 8-10% of the compensation as PRP.
Financial Impact:
• Revenue per FTE
• Cost per FTE
• Profit per FTE
Productivity & RoI:
• Remuneration / Revenues
• Remuneration / Total Costs
• Human Capital Return on Investment (HCROI)
3
-Revenue per FTE = (INR) 27.63 lac-Cost per FTE = (INR) 23.26 lac-Profit Per FTE = (INR) 4.37 lac-Remuneration/Revenue = 7%
PwC
By paying low average remuneration, DS Limited is effectively managing people cost and driving high productivity levels (measured as remuneration/revenue).
• With low average remuneration, DS limited is managing people cost well and drivinghigh productivity levels measured as remuneration/revenue.
• By not rewarding performance at all, DS limited is restricting its potential to generatehigher revenue & profit per FTE.
• DS Limited is also not paying any benefits to its employees.
Points to Ponder
• DS Limited may like to introduce performance related pay and employeebenefits in the form of ESOPs/Healthcare/Insurance/subsidised loans toboost its revenue/profitability per employee and build loyalty forretention.
Compensation & Benefits
• Average Remuneration
• Average Benefits
• Benefits/Compensation
• Performance Related Pay
7
-Average remuneration per employee = INR 1.95 Lac
-Remuneration/Total cost = 8.4%-Remuneration/Total Revenue = 7%
Sankar RamamurthyExecutive Director and Head People & Change E-mail: [email protected] Phone: +91-9810730373
Rohan ChopraPrincipal Consultant E-mail: [email protected] Phone: +91-9717374949
Abhishek MohantyPrincipal Consultant E-mail: [email protected] Phone: +91-9819097601
For additional Information, please contact:

pwc.com/india
Thisreportdoesnotconstituteprofessionaladvice.TheinformationinthisreporthasbeenobtainedorderivedfromsourcesbelievedbyPricewaterhouseCoopersPrivateLimited(PwCPL)tobereliablebutPwCPLdoesnotrepresentthatthisinformationisaccurateorcomplete.AnyopinionsorestimatescontainedinthisreportrepresentthejudgmentofPwCPLatthistimeandaresubjecttochangewithoutnotice.Readersofthisreportareadvisedtoseektheirownprofessionaladvicebeforetakinganycourseofactionordecision,forwhichtheyareentirelyresponsible,basedonthecontentsofthisreport.PwCPLneitheracceptsorassumesanyresponsibilityorliabilitytoanyreaderofthisreportinrespectoftheinformationcontainedwithinitorforanydecisionsreadersmaytakeordecidenottoorfailtotake.
©2011PricewaterhouseCoopersPrivateLimited.Allrightsreserved.Inthisdocument,“PwC”referstoPricewaterhouseCoopersPrivateLimited(alimitedliabilitycompanyinIndia),whichisamemberfirmofPricewaterhouseCoopersInternationalLimited(PwCIL),eachmemberfirmofwhichisaseparatelegalentity.
NJ-148April-2011SaratogaSurvey.inddDesignedby:PwCBrand&Communications,India