measuring for monitoring: the state of data for … · measuring for monitoring: the state ......
TRANSCRIPT

Measuring for Monitoring: The State
of Data for SDGs in Bangladesh
Mustafizur Rahman
Towfiqul Islam Khan
Md. Zafar Sadique
Mostafa Amir Sabbih
September 2015
Dhaka, Bangladesh
2
Content
Acknowledgements ................................................................................................................................. 3
Acronyms and Abbreviations .................................................................................................................. 4
List of Tables and Figures ....................................................................................................................... 5
Report Highlights ..................................................................................................................................... 7
Introduction............................................................................................................................................ 11
Research Process ................................................................................................................................. 16
Post-2015 Priorities for Bangladesh ..................................................................................................... 19
End Poverty ........................................................................................................................................... 21
Ensure Quality Education for All ........................................................................................................... 24
Create Jobs, Sustainable Livelihoods and Inclusive Growth for All ...................................................... 26
Ensure Sustainable Energy and Develop Infrastructure for All ............................................................. 28
Establish a Sustainable, Healthy and Resilient Environment for All ..................................................... 31
Establish Open, Accountable, Inclusive and Effective Institutions, Rule of Law and a Peaceful and
Inclusive Society ................................................................................................................................... 34
Establish a Global Partnership for Sustainable Development .............................................................. 36
Overview of the National Statistical System in Bangladesh ................................................................. 40
Data for Measuring Progress on Post-2015 in Bangladesh .................................................................. 43
Political Economy of the Data Revolution ............................................................................................. 58
Conclusion............................................................................................................................................. 66
References ............................................................................................................................................ 69
Annex 1. Research Team ..................................................................................................................... 71
Annex 2. Inception Workshop Participants ........................................................................................... 72
Annex 3. Key Documents and Resources Consulted for Selecting Targets and Indicators ................. 75
Annex 4. Candidate Targets, Indicators and Definitions ....................................................................... 77
Annex 5. Key Resources Consulted for Testing Data Adequecy at Country Level .............................. 93
Annex 6. Validation Workshop Participants .......................................................................................... 94
Annex 7. List of Goals, Targets and Indicators for the Bangladesh Case Study .................................. 95
Annex 8. Data Quality Assessment Framework ................................................................................. 108

3
Acknowledgements
The Bangladesh research team would like to express its deep gratitude to Dr. Debapriya
Bhattacharya, Distinguished Fellow, Centre for Policy Dialogue (CPD) and Chair, Southern Voice on
Post-MDG International Development Goals, for his guidance and advice over the course of the
Bangladesh case study. The team members would also like to put on record their high appreciation of
the intellectual support provided by the teams at CPD, Southern Voice and the Norman Paterson
School of International Affairs that prepared the Methodology and Implementation Guide for the
country studies under the Post-2015 Data Test initiative. The research team is grateful to all the
participants of the inception and validation workshops for the Bangladesh case study held in Dhaka.
Insights from experts at the Nairobi Mid-Stream Workshop helped the team to clarify many conceptual
issues. The team would like to specially mention the contributions of those who volunteered their time
and knowledge for the key informant interviews and focus group discussions. Excellent support
extended by officials of the Bangladesh Bureau of Statistics and Planning Commission of Bangladesh
also deserves particular mention. Valuable research support by Mr. Mashfique Ibne Akbar, Former
Senior Research Associate, Mr. Gazi Joki Uddin, Former Programme Associate, and Ms. Alaka
Halder, Former Research Intern, CPD, is acknowledged with high appreciation. The team would like
to also gratefully acknowledge the generous support provided by the Hewlett Foundation and
International Development Research Centre (IDRC) in connection with this study. Team members
would like to mention their high appreciation for the partnership and collaboration of the Partnership
for African Social and Governance Research (PASGR) and United Nations Foundation at various
stages of this study. The research team has benefited from the insightful comments and suggestions
of peer reviewers and would like to thank them sincerely.
4
Acronyms and Abbreviations
BANBEIS Bangladesh Bureau of Educational Information and Statistics
BBS Bangladesh Bureau of Statistics
BDHS Bangladesh Demographic and Health Survey
CPD Centre for Policy Dialogue
CO2 CSOs
carbon dioxide civil society organisations
DAC Development Assistance Committee
GoB Government of Bangladesh
HIES Household Income and Expenditure Survey
HIV/AIDS human immunodeficiency virus/acquired immune deficiency syndrome
ICT information and communication technologies
KIIs key informant interviews
LDCs least developed countries
LFS Labour Force Survey
MDG Millennium Development Goal
MICS Multiple Indicator Cluster Survey
NIPORT National Institute of Population Research and Training
NPSIA Norman Paterson School of International Affairs
NSDS National Strategy for the Development of Statistics
NSO national statistics office
ODA official development assistance
OECD Organisation for Economic Co-operation and Development
PPP purchasing power parity
SVRS Sample Vital Registration System
TVET Technical Vocational Education and Training
UN United Nations
WDI World Development Indicators

5
List of Tables and Figures
List of Tables
Table 1. Candidate targets and indicators under broad themes ........................................................... 16 Table 2. Number of KIIs conducted, by type of organisation ................................................................ 17 Table 3. Set of candidate targets and indicators for the Bangladesh case study ................................. 20 Table 4. End poverty: Targets and indicators ....................................................................................... 23 Table 5. Ensure quality education for all: Targets and indicators ......................................................... 25 Table 6. Create jobs, sustainable livelihoods and inclusive growth for all: Targets and indicators ...... 27 Table 7. Ensure sustainable energy and develop infrastructure for all: Targets and indicators ........... 29 Table 8. Establish a sustainable, healthy and resilient environment for all: Targets and indicators .... 32 Table 9. Establish open, accountable, inclusive and effective institutions, rule of law and a peaceful
and inclusive society: Targets and indicators ....................................................................................... 35 Table 10. Establish a global partnership for sustainable development: Targets and indicators ........... 37 Table 11. Ensure primary health services for all: Targets and indicators ............................................. 39 Table 12. Data availability across MDG indicators ............................................................................... 43 Table 13. Data availability across post-2015 indicators ........................................................................ 45 Table 14. Major national sources of data .............................................................................................. 47 Table 15. Data producers and sources that could generate needed data ............................................ 50 Table 16. Data quality assessment for indicators, by goal area ........................................................... 54 Table 17. Assessment of global minimum targets ................................................................................ 56 Table 18. List of global minimum targets and indicators for which data are not available ................... 57
List of Figures
Figure 1. Data availability (% of total) across MDG indicators .............................................................. 44 Figure 2. Data availability (% of all indicators) at the global level by goal area .................................... 46 Figure 3. Data availability (% of all indicators) at the national level by goal area ................................. 46 Figure 4. Distribution of data for global and national indicators by national data producer .................. 48 Figure 5. Distribution of data for global and national indicators by international data producer ........... 49 Figure 6. Baseline data availability (%) across global indicators .......................................................... 51 Figure 7. Baseline data availability (%) across national indicators ....................................................... 52 Figure 8. Baseline data availability (%) across indicators for which data are readily available ............ 52 Figure 9. Indicators for which baseline data are not readily available but which could be estimated .. 53
List of Annex Tables
Table 4.1. End poverty: Targets and indicators .................................................................................... 77
Table 4.2. Ensure quality education for all: Targets and indicators ...................................................... 79
Table 4.3. Create jobs, sustainable livelihoods, and inclusive growth for all: Targets and indicators .. 80
Table 4.4. Ensure sustainable energy and develop infrastructure for all: Targets and indicators ...... 83
Table 4.5. Establish a sustainable, healthy and resilient environment for all: Targets and indicators . 84
Table 4.6. Establish open, accountable, inclusive and effective institutions, rule of law and a peaceful
and inclusive society: Targets and indicators .......................................................... 87
Table 4.7. Establish a global partnership for sustainable development: Targets and indicators ..... 89
Table 4.8. Ensure primary health services for all: Targets and indicators ............................................ 91
Table 7.1. End poverty: Targets and indicators .................................................................................... 95
Table 7.2. Ensure quality education for all: Targets and indicators ...................................................... 96
Table 7.3. Create jobs, sustainable livelihoods, and inclusive growth for all: Targets and indicators .. 97

6
Table 7.4. Ensure sustainable energy and develop infrastructure for all: Targets and indicators ...... 99
Table 7.5. Establish a sustainable, healthy and resilient environment for all: Targets and indicators 100
Table 7.6. Establish open, accountable, inclusive and effective institutions, rule of law and a peaceful
and inclusive society: Targets and indicators ........................................................ 102
Table 7.7. Establish a global partnership for sustainable development: Targets and indicators .... 105
Table 7.8. Ensure primary health services for all: Targets and indicators .......................................... 107
7
Report Highlights
In the context of global efforts to identify the post-2015 sustainable development agenda, various
stakeholders, including the Government of Bangladesh, development partners, non-governmental
organisations and civil society organisations, among others, have highlighted the issue of data.
Stakeholders agree that more and better data are key to measuring progress and it is important to
ensure upfront that adequate preparations are made to generate data for post-2015 in both developed
and developing countries. Indeed, to support a goal-based, universal and country-relevant post-2015
agenda, the United Nations Secretary-General’s High-Level Panel of Eminent Persons on the Post-
2015 Development Agenda called for a “data revolution” in 2013. Despite the success of the
Millennium Development Goals (MDGs) in uniting the international community around a set of
prioritised global agendas for development, the MDGs have been criticised for not being adequately
embedded in national policy processes. Further, the MDGs have been constrained by inadequate
data and information, which have made assessing progress difficult. Consequently, transparency and
accountability have been undermined.
Taking into account the demand-side needs and supply-side possibilities of a data revolution, an
initiative titled “The Post-2015 Data Test: Unpacking the Data Revolution at the Country Level” was
launched by Bangladesh’s Centre for Policy Dialogue (CPD) and Canada’s Norman Paterson School
of International Affairs (NPSIA) in association with Southern Voice on Post-MDG International
Development Goals. This report, the Bangladesh case study, is part of seven country studies under
the initiative. It examines and recommends national-level post-2015 priorities for Bangladesh and
identifies challenges associated with measuring the post-2015 agenda in Bangladesh, focusing on
eight candidate goal areas: poverty, education, employment and inclusive growth, energy and
infrastructure, environmental sustainability and disaster resilience, governance, global partnership for
sustainable development, and health.
The report intends to benefit policy-makers and other stakeholders including academics, civil society
actors and development partners by offering a deeper understanding of the state of data for
measuring Bangladesh’s progress on the post-2015 agenda. The findings of the report will enable
concerned stakeholders to take corrective measures, undertake new initiatives to address data
deficits and take steps to generate new data in view of the post-2015 agenda. The report will also be
helpful to global actors by offering insights into data situations in low-income countries and outlining
technical and financial support measures to help equip these countries to measure progress on and
monitor implementation of the post-2015 agenda.
The Bangladesh case study presents an overall assessment of existing statistical capacity in
Bangladesh in view of emerging demands in connection with the post-2015 agenda. The study
examines data adequacy for measuring post-2015 progress and identifies key opportunities and
challenges at the country level to improve data availability, access, timeliness and quality. The
feasibility of a selected set of candidate post-2015 targets and indicators is also assessed.
The Bangladesh case study’s key findings are:
Bangladesh has seen gradual improvements in data production, dissemination and use with
regard to development issues over the last 10 years.
The global ambition towards a data revolution has begun to gain ground in Bangladesh.
Relevant stakeholders are becoming increasingly aware of emerging data demands.
8
Although data availability has improved in Bangladesh, data are currently not readily available
for a number of candidate indicators. For instance, needed statistics that are not currently
reported in Bangladesh can be estimated or calculated for 42 indicators (out of 120 candidate
indicators examined in this study) from existing administrative information and available
surveys. Data for several important indicators are unavailable at the level of disaggregation
needed.
The dearth of data will likely make it difficult to establish a baseline for measuring progress on
the post-2015 agenda in Bangladesh. Without baseline data it will be difficult for Bangladesh
to establish measurable post-2015 targets.
Available data in Bangladesh are of variable quality. They often suffer from a lack of accuracy
and reliability, timeliness and punctuality, accessibility and clarity, and coherence and
comparability. There is a need to improve overall data quality. This is particularly true for a
number of goal areas, including energy and infrastructure, environmental sustainability and
disaster resilience, governance, and global partnership for sustainable development.
Issues relating to the accessibility and affordability of data need to be urgently addressed. In
connection to this, the dissemination of disaggregated and unit-level data should be promoted
at a minimum cost. Promoting data dissemination digitally and in user-friendly formats (e.g.,
spreadsheets) and establishing interactive websites for data should be a priority.
Global minimum standards for a number of key areas, such as ending extreme poverty by
2030, will be difficult to attain in Bangladesh unless a host of measures are put in place.
These measures will require significant resource allocation.
Although certain efforts have sought to reform the statistical system in Bangladesh, they are
inadequate to meet the growing demands for more and better data. For example, Bangladesh
is currently implementing a National Strategy for the Development of Statistics for the 2013–
23 period. Progress on data improvement activities has not been satisfactory because a
number of actions planned as part of the strategy have not been implemented within the
stipulated timeframe.
Expectations for the data revolution vary from stakeholder to stakeholder in Bangladesh.
Coordination and cooperation among stakeholders will need to be significantly improved to
align expectations. The demands for more frequent, timely, disaggregated, quality data from
policy-makers and non-governmental actors need to be recognised by data producers.
The potential roles of the private sector and modern technology in the data revolution in
Bangladesh have yet to be adequately appreciated. A big push is required for the advantages
of information and communication technologies to be recognised and leveraged.
Beyond these key findings, the study highlights data challenges for Bangladesh. These include:
weak infrastructure;
lack of human resources;
outdated and inadequate legislation;
insufficient financial resources;
inadequate documentation (e.g., metadata, survey methodology);
duplication of sources;
poor access to data producers;
poor coordination among data users, producers and other stakeholders;

9
inadequate commitment to quality data production from development partners;
lack of awareness about importance of statistics among policy designers and decision
makers;
absence of data dissemination policy;
storage of data not being digitized;
lack of coherent approach towards validation of unofficial data; and
absence of transparency and quality control efforts.
Addressing this long list of challenges will not be easy for a country such as Bangladesh and these
challenges cannot be solved in a short span of time. There is a need to urgently design an agenda for
action to address these challenges. Such an agenda should be informed by key considerations about
data production, data availability and access, and capacity and coordination.
Data Production
There is a need to standardise and bring coherence to relevant concepts and definitions of variables
through consultations among major stakeholders. New surveys will be needed to generate data on
various important indicators. This is particularly true for indicators related to governance and
institutional strengthening. There is a need to consolidate existing surveys and data collection
procedures. In many cases, surveys should be conducted more frequently, which may require
increasing financial, technical, logistical resources and improving human resources. As demands for
disaggregated data (e.g., spatial, gender, age-group, ethnicity) grow, data producers should take the
necessary steps to address emerging needs by including disaggregated data on their agendas.
Concerted efforts need to be taken to enhance the quality of data generated through the use of
modern technology. While they are concerned with data related to measuring progress on the post-
2015 agenda, policy-makers are also interested in understanding the key factors that influence the
attainment of better results, so it will be necessary to generate data that not only monitor post-2015
development outcomes but also the variables that impact them.
Data Availability and Access
Data should be made available in a timely manner to facilitate real-time decision making. Raising
administrative efficacy and increasing the use of technology can contribute towards this. Ensuring
transparency in data production and access for data users should be a core dimension of the data
revolution in Bangladesh. In connection to this, the development of a data dissemination plan and
updated legislation are required.
Capacity and Coordination
Adequate funding for strengthening institutional capacity and undertaking new activities needs to be
ensured. Together with the Government of Bangladesh, development partners need to address this
issue upfront in their planning. Coordination among data producers and data users should be
strengthened to harness existing capacities in the private sector. Institutional capacity needs to be
enhanced, keeping medium-term needs associated with the post-2015 agenda in the purview. Above
all, the data revolution in the context of the post-2015 agenda requires a new set of institutional
arrangements. In September 2015, the Ministry of Foreign Affairs will represent the Government of
Bangladesh at the United Nations summit where the post-2015 agenda will be finalised. The General
Economics Division of the Planning Commission is expected to play a key role in planning and
coordinating the subsequent implementation process. The Bangladesh Bureau of Statistics will play a
central role in generating data to track development progress. Local Consultative Groups may
coordinate development partners’ initiatives, while the Ministry of Finance, including its Economic
Relations Division, ought to coordinate financing needs. Civil society organisations and other

10
stakeholder groups will be both generators and users of key data. Analysts, experts and researchers
will use relevant data to measure and assess progress. A comprehensive plan on data that articulates
concrete tasks for specific institutions and stakeholders will need to be designed. Only such a plan will
enable a data revolution to occur in Bangladesh.

11
Introduction
In the context of global efforts to identify the post-2015 sustainable development agenda, the need for
a data revolution has been highlighted by various stakeholders. They agree that more and better data
are key to measuring progress and it is important to ensure upfront that adequate preparations are
made to generate data for post-2015 in both developed and developing countries. Indeed, to support
a goal-based, universal and country-relevant post-2015 agenda, the United Nations (UN) Secretary-
General’s High-Level Panel of Eminent Persons on the Post-2015 Development Agenda called for a
“data revolution” in 2013 (see HLP 2013). Despite the success of the Millennium Development Goals
(MDGs) in uniting the international community around a set of prioritised global agendas for
development, the MDGs have been criticised for not being adequately embedded in national policy
processes. Further, the MDGs have been constrained by inadequate data and information, which
have made assessing progress difficult. Consequently, transparency and accountability have been
undermined. Against this backdrop, the availability of quality data has emerged as a key concern
(Bhattacharya et al. 2013).
The need to spark a data revolution is motivated and primarily informed by four factors: (i) lack of data
did not permit the establishment of reference indicators for a number of MDGs, (ii) inadequacy and
paucity of data did not allow real-time measurement of progress with respect to a number of MDG
targets and indicators, (iii) a number of MDG indicators did not have quantifiable targets in absence of
the required data and (iv) the post-2015 agenda will embrace many “soft issues” such as governance,
which will necessitate formulating and generating new data and information matrices. Given the
availability of new techniques and tools for generating and mobilising information (e.g., the Global
Positioning System, better known as GPS), it is both desirable and feasible to design the post-2015
agenda by keeping emerging opportunities related to modern technology in the purview. In addition to
first proposing and explaining the concept of the “data revolution,” the High-Level Panel expressed the
hope that it would enable governments and policy-makers to better track progress on the post-2015
agenda and articulated that the objective should be to equip relevant stakeholders with the data and
information they needed to establish appropriate benchmarks and demand more from their
governments with regard to monitoring progress on the agenda.
Taking into account the evolving demand-side needs and supply-side possibilities of the data
revolution, the initiative titled “The Post-2015 Data Test: Unpacking the Data Revolution at the
Country Level” was launched by Bangladesh’s Centre for Policy Dialogue (CPD) and Canada’s
Norman Paterson School of International Affairs (NPSIA) in association with Southern Voice on Post-
MDG International Development Goals. The initiative set out the following objectives:
Examine how a universal, country relevant post-2015 agenda can be applied to a select
number of low, middle and high-income countries.
Assess the adequacy of data available for measuring post-2015 progress at the country level
in a select number of countries.
Identify opportunities and challenges that may arise from the implementation of a universal,
country-relevant post-2015 framework.
Enhance the capacity of Southern think tanks to contribute to global policy processes geared
towards shaping the post-2015 agenda, and ensuring that global-level decision making,
particularly on the “data revolution,” is informed by country-level contexts and realities.
As part of the Post-2015 Data Test initiative, seven country studies – Bangladesh, Canada, Peru,
Senegal, Sierra Leone, Tanzania and Turkey – are being conducted. In selecting these countries,
diversity in terms of income level, rate of economic growth, region, demographic factors,

12
climate/environmental factors, geographic factors, political stability and statistical capacity were kept
in perspective. The country studies examine national-level priorities and measurement challenges for
seven goal areas that that touch on roughly 12 of the 17 SDGs included in the post-2015 agenda,
namely poverty, education, employment and inclusive growth, energy and infrastructure,
environmental sustainability and disaster resilience, governance, and global partnership for
sustainable development.1 It may be mentioned in this connection that the Bangladesh study has
included an additional goal area concerning health issues. This is done in view of health being a key
policy priority in Bangladesh and in appreciation of the emphasis put on health issues in the course of
stakeholder consultations.
This report presents the findings of the Bangladesh case study. To service the objectives of the
initiative, the study addresses the following research questions in the particular context of
Bangladesh:
How appropriate or feasible are the candidate goals, targets, indicators and baselines at the
country level?
What is the adequacy of data, including disaggregated data, for measuring post-2015
progress across a select set of goals at the country level? In the absence of required data,
can proxy indicators be used?
What are the implications of data adequacy for setting the baseline that is used in the post-
2015 framework?
How feasible and relevant are select candidate “zero” or “global minimum standard” targets at
the country level?
What are some of the likely challenges of implementing a universal but country-relevant
framework of post-2015 goals, targets and indicators, particularly from a measurement
perspective?
Where improvements in data quality, accessibility and transparency have been made, what
have been the drivers? Where gaps exist, why?
What expectations do different stakeholders have for a data revolution? What are the likely
opportunities and constraints?
Brief Overview of Current Context
The Millennium Declaration, based on the fundamental values of freedom, equality, solidarity, respect
for nature, and shared responsibility, was adopted by the UN General Assembly in 2000. The
consequent MDGs have provided an inspiring vision underpinned by time-bound milestones for global
and national development efforts with the target date of 2015 (UNTT 2012). By setting out ambitions
to address poverty and put human progress at the forefront of development agendas, the MDGs have
no doubt made a historic contribution to human development. It is thus unsurprising that MDG issues
still resonate as the essential building blocks of human development, as indicated by consultations
around the world (UNDG 2013).
The MDGs focus on a limited set of concrete, simple, realistic and achievable human development
goals and targets to help stimulate development efforts, set global and national priorities, and focus
action at all levels by mobilising a vast array of political, financial, technical and human resources for
development. Important progress, particularly on the goal of eradicating extreme poverty, has been
made in the majority of countries, including Bangladesh. Statistics suggest that fewer children are
dying, fewer children are underweight, fewer people are contracting HIV (although the prevalence of
1 The goals examined for this study were determined well in advance of the proposal for the SDGs released by the Open Working Group on Sustainable Development Goals (see Bhattacharya et al. 2015 for details). An examination of the final set of SDGs, which states will adopt 25-27 September 2015 shows that the seven goal areas included in the methodology for this study reflect the bulk of the areas covered by the SDGs.

13
HIV/AIDS is still high in some African countries) and fewer women die in childbirth each year across
the world (UNCT 2013).
Notably, these trends have been uneven within and across countries and regions. For example, the
total number of people living on less than US$1.25 (purchasing power parity [PPP]) per day
decreased from approximately 1.9 billion in 1990 to 1.0 billion by 2011 (World Bank 2014a). However,
the reduction was overwhelmingly concentrated in China, with the number of poor people increasing
in sub-Saharan Africa (UNTT 2012). The geography of poverty has experienced a notable shift –
three-quarters of the world’s poor now live in middle-income countries.
In Bangladesh, moderate progress has been made on the MDGs, particularly on the poverty-related
indicators of MDG 1 (eradicate extreme poverty and hunger), MDG 4 (reduce child mortality), and
MDG 6 (combat HIV/AIDS, malaria and other major diseases), and democratic governance in general.
The proportion of the population below US$1.25 (PPP) per day decreased from 70.2 percent in 1992
to 43.3 percent in 2010 (World Bank 2014b). Strikingly, gender parity has been achieved not only at
the primary education level, but also at the secondary level. Moreover, women outnumber men at the
tertiary level. On the demographic front, life expectancy at birth increased from 67.2 years in 2009 to
70.4 in 2013 (BBS 2015), with females having a slightly higher life expectancy. Maternal mortality
rates have fallen markedly. Housing conditions have significantly improved since the proportion of
solid constructed homes has increased, average household size (number of permanent tenants live in
a house) has declined, and sanitation and access to drinking water have experienced notable
improvements, particularly in rural areas.
Nonetheless, major challenges remain for Bangladesh, especially with regard to the hunger-related
indicators of MDG 1 (eradicate extreme poverty and hunger), MDG 5 (improve maternal health), MDG
7 (ensure environmental sustainability), which is fully off track and is unlikely to be met, and tackling
growing geographical, gender-based and group-based inequalities (UNCT 2013).
It will be important to track progress on the post-2015 agenda in a reliable, timely and comparable
manner. Serious data limitations have constrained the measurement of progress on many MDG
indicators and cross-country comparisons. The current state of data availability and accessibility at the
national and global levels leaves much to be desired, both in terms of data quality and the scope of
required information. In many developing countries, household income and consumption data are
either unavailable or incommensurate with the needs of reliable and timely monitoring of the dynamics
of poverty and inequality, especially for the purposes of time series analysis and international
comparisons. Additionally, available data often cannot be used to measure the inter-linkages of
poverty with issues measured by other surveys, such as health, population, sustainable development,
employment and hunger (UNTT 2013). Compounding this problem, there is a serious scarcity of
quantitative data for measuring governance-related indicators – corruption, perception, press
freedom, gender empowerment and human rights – due to their not readily quantifiable and abstract
nature.
Francesca Perucci (2011) identified several challenges related to the availability of data for the UN
Inter-Agency and Expert Group on MDG Indicators. These include: “the burden on some countries of
data monitoring and reporting; the availability and unreliability of data collected; inconsistencies
between data required for global aggregation and what is available at the country level; a lack of
international standards; the failure to adopt existing international standards at the national level; a lack
of national capacity; and disagreement on the baseline year” (Carin and Bates-Eamer 2012). As is the
case, a country’s national statistics office (NSO) needs to act as the core entity responsible for data
generation and dissemination. But NSOs in developing countries and least developed countries
(LDCs), such as Bangladesh, lack infrastructural capacity and management skills for generating
needs-based data to monitor progress against relevant indicators. In some instances, private sector

14
entities also generate data that measure progress against some indicators, but these data lack
authorisation, validation and authentication from NSOs due to non-compliance with quality assurance
and statistical procedures followed for data collection.
There is a need to recognise that advances in information and communication technologies (ICT)
(e.g., internet and mobile technologies) are creating new opportunities to upgrade and complement
traditional data collection methods. Taking advantage of these opportunities could significantly reduce
transactions costs and increase efficiency in data collection (UNCT 2013). New avenues for data
generation could involve interactive forms of data collection and feedback mechanisms such as
“crowdsourcing.”
Bangladesh’s Engagement in the Post-2015 Process
Bangladesh has been moderately engaged in the post-2015 process. National consultations on post-
2015 provided major stakeholders with an opportunity to reflect on Bangladesh’s rich experience in
MDG implementation and articulate their preferences for the post-2015 agenda. Through these
efforts, Bangladesh highlighted its perspective and was able to contribute to the global discourse on
post-2015 goals, targets and indicators. In Bangladesh, the national discourse on post-2015 goals
began in earnest in 2012 prior to the historic UN Conference on Trade and Development widely
known as Rio+20 in June of that year. The Government of Bangladesh (GoB) organised two high-
level consultations in February and May 2012 where leading policy-makers, experts, private sector
and civil society organisation (CSO) representatives, development partners and UN Country Team
members were invited to contribute (UNCT 2013). Priority was given to the issues of inclusiveness
and participation in these consultations.
The GoB held an inter-governmental side event with the Government of Vietnam at Rio+20 to
showcase the advantages of a green economy and present it as a win-win opportunity for the two
developing countries. A separate Bangladeshi CSO side event on the topic of a green economy was
also organised at Rio+20. A number of other events were organised during the post-Rio+20 period.
For instance, the GoB held a two-day conference on people’s empowerment and development in
August 2012. The government then conducted the first post-2015 National Expert Level Consultation
Conference in November 2012, which brought the national consultation process on the post-2015
agenda to the forefront of national discourse (UNCT 2013). The conference was aimed at identifying
the gaps and challenges in relation to sustainable development and generating ideas on post-2015
goals, targets and indicators.
Apart from these events, the GoB organised nine regional- and district-level consultation meetings
between November 2012 and April 2013 to ensure the robustness of the final post-2015 report that it
would submit to the UN (see UNCT 2013). The consultation process ended in June 2013 with the
holding of the National Level Conference, where a post-2015 framework proposed by Bangladesh
was given final approval (UNCT 2013). In various combinations and partnerships, civil society actors
organised a number of events and discussions to highlight their priorities and influence the process of
government-initiated agenda building. The document prepared as part of this process proposed 11
candidate goals concerning development issues including human potential, poverty and inequality,
food security and nutrition, health and family planning, gender equality, quality education and skills,
employment and worker rights, good governance, sustainable production and consumption,
environmental sustainability and disaster management, and international cooperation and partnership.
Outline of the Report
Following this introduction, the Bangladesh case study is made up of four core sections. The second
section summarises the Bangladesh research team’s research methodology. The following section

15
identifies candidate targets and indicators for measuring progress on post-2015 in Bangladesh that
reflect Bangladesh’s contemporary context and priorities. The state of data for measuring progress on
post-2015 in the country is discussed across the fourth section. The fifth section deals with the
political economy dimensions of the data revolution in Bangladesh by highlighting data gaps, areas for
improvement and the data availability–transparency–accountability nexus. The study concludes by
summarising key findings, offering reflections on the challenges for Bangladesh in implementing the
post-2015 agenda based on these findings, and outlining the findings’ implications for ongoing global
processes.

16
Research Process
Key Activities Undertaken
The research for the Bangladesh case study went through a number of stages guided by the
Methodology and Implementation Guide for the Post-2015 Data Test initiative developed by The
North-South Institute,2 CPD and Southern Voice (see Bhattacharya, Higgins and Kindornay 2014).
The selection of candidate goal areas, targets and indicators to be examined by all research teams
under the initiative was conducted through a robust consultative process.
To identify post-2015 development priorities for Bangladesh, the Bangladesh research team3 first
organised an inception workshop, which brought together 75 participants from a wide range of
relevant stakeholders in the public sector, academia, civil society, the donor community and
international organisations who have dealt with data-related issues.4 The workshop’s aims were to: (i)
provide information about the design of the initiative and collect feedback with regard to the
refinement of its proposed objectives, methodology, implementation and outreach plans, (ii) test the
appropriateness of the preselected goals, targets and indicators at the country level and (iii) develop a
sound understanding of the state of data availability and accessibility.
A comprehensive list of candidate targets and indicators for Bangladesh was presented at the
workshop for participants’ consideration. The list comprised 89 targets and 357 indicators under five
broad themes (see Table 1). These targets and indicators were compiled by the Bangladesh research
team by reviewing various global, regional and national policy documents, research reports and
academic literature.5 Five broad themes were identified to keep the number of workshop working
groups at a manageable level. The research team sought expert opinion, critical appreciation,
validation and suggestions from participants organised into five working groups. Having scrutinised
the targets and indicators, participants suggested that a number of them be dropped and proposed
new targets and indicators for inclusion.
Table 1. Candidate targets and indicators under broad themes
Broad theme Number of
targets
Number of
indicators
Poverty, inequality, food security and employment 23 102
Health, education and gender 17 68
Environment, sustainable energy and water/sanitation 21 96
Governance and peace/security 14 53
Global partnership 24 38
Participants’ perspectives on the following questions were sought during the workshop:
What is the data availability situation with regard to the indicators?
What would be the major challenges in generating data for the indicators?
With regard to the data revolution, what are your views on the following debates:
o Magnitude of the funding required for undertaking various initiatives relating to the
data revolution
o Need for coordination among stakeholders
2 The initiative originally included The North-South Institute as a partner but the closure of the institute in October 2014 led to NPSIA joining the partnership. 3 For details on the research team, see Annex 1. 4 A list of the participants is presented in Annex 2. 5 See Annex 3 for the complete list.
17
o Opportunities for public-private partnership on the data revolution
What capacity-building initiatives (for data producers, analysts, policy-makers) would be
required in view of the data revolution?
What are innovative ways of producing data (including use of ICT and modern technology)?
What are the main challenges in making data easily and widely accessible?
The inception workshop involved detailed discussions that elicited many insights from participants.6
Following this event, the research team finalised the set of candidate targets and indicators for
Bangladesh by taking into account participants’ views and the scope of the overall initiative.7 The
team then conducted desk reviews and literature reviews to examine data availability, sources,
adequacy and quality.8 Various challenges were identified and possible policy recommendations were
discussed. The team also conducted key informant interviews (KIIs) with relevant experts and
stakeholders at the country and global levels in order to assess perceptions about data gaps,
challenges associated with a universal, country-relevant framework, and expectations for the data
revolution. In conjunction with KIIs, the team carried out focus group discussions at the country level.
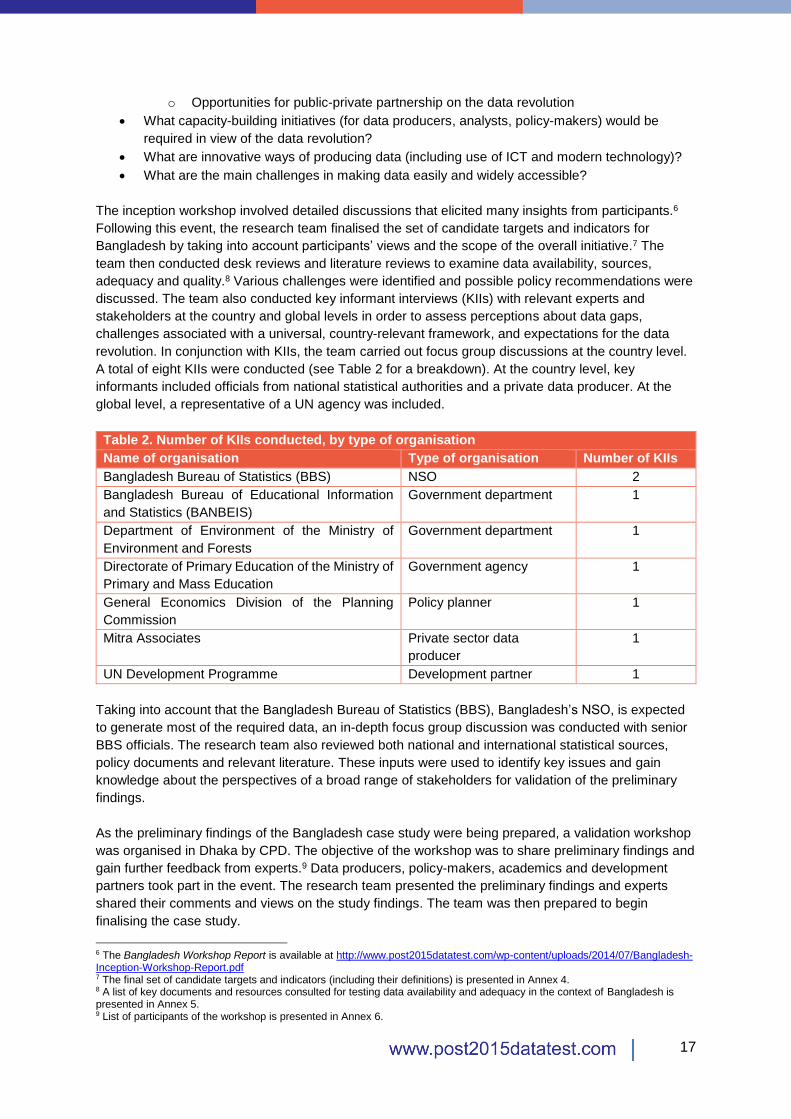
A total of eight KIIs were conducted (see Table 2 for a breakdown). At the country level, key
informants included officials from national statistical authorities and a private data producer. At the
global level, a representative of a UN agency was included.
Table 2. Number of KIIs conducted, by type of organisation
Name of organisation Type of organisation Number of KIIs
Bangladesh Bureau of Statistics (BBS) NSO 2
Bangladesh Bureau of Educational Information
and Statistics (BANBEIS)
Government department 1
Department of Environment of the Ministry of
Environment and Forests
Government department 1
Directorate of Primary Education of the Ministry of
Primary and Mass Education
Government agency 1
General Economics Division of the Planning
Commission
Policy planner 1
Mitra Associates Private sector data
producer
1
UN Development Programme Development partner 1
Taking into account that the Bangladesh Bureau of Statistics (BBS), Bangladesh’s NSO, is expected
to generate most of the required data, an in-depth focus group discussion was conducted with senior
BBS officials. The research team also reviewed both national and international statistical sources,
policy documents and relevant literature. These inputs were used to identify key issues and gain
knowledge about the perspectives of a broad range of stakeholders for validation of the preliminary
findings.
As the preliminary findings of the Bangladesh case study were being prepared, a validation workshop
was organised in Dhaka by CPD. The objective of the workshop was to share preliminary findings and
gain further feedback from experts.9 Data producers, policy-makers, academics and development
partners took part in the event. The research team presented the preliminary findings and experts
shared their comments and views on the study findings. The team was then prepared to begin
finalising the case study.
6 The Bangladesh Workshop Report is available at http://www.post2015datatest.com/wp-content/uploads/2014/07/Bangladesh-Inception-Workshop-Report.pdf 7 The final set of candidate targets and indicators (including their definitions) is presented in Annex 4. 8 A list of key documents and resources consulted for testing data availability and adequacy in the context of Bangladesh is presented in Annex 5. 9 List of participants of the workshop is presented in Annex 6.

18
Lessons Learned
Several key lessons were learned in the course of conducting the Bangladesh case study:
The post-2015 agenda has traction in Bangladesh.
o The emergence of the post-2015 agenda has generated interest and enthusiasm
among various groups of stakeholders working on development issues in
Bangladesh. In general, stakeholders were optimistic about the post-2015 process
and saw it as an opportunity to shape Bangladesh’s development process.
o They indicated that there is a need for an overarching theme for the post-2015
agenda, like how the theme for the MDGs is poverty alleviation.
Ensuring an inclusive though manageable post-2015 agenda will be difficult, but is recognised
as important.
o While selecting candidate targets and indicators, stakeholders agreed that the scope
of the post-2015 agenda needs to be broader than that of the MDGs. They invested
significant efforts to showcase their respective priority areas and had a keen interest
in the inclusion of those areas in the Bangladesh case study. Thus, the final set of
targets and indicators turned out to be large.
o While commenting on indicators, stakeholders understood that they need to be kept
to a manageable number.
Data production requires attention.
o There was a general consensus among stakeholders that the BBS needs to assume
the core responsibility for producing official national statistics and coordinate with
other data producers to generate the needed information.
o Maintaining timeliness in data production was identified as a major challenge for
Bangladesh.
o Producing data at disaggregated levels has also been a major challenge.
Stakeholders appeared to be divided with regard to the required levels of
disaggregation. Data producers urged to keep requirements minimal.
o Enhancing capacity for data generation through financing, technology, logistics and
human capital was identified as another major challenge. Many stakeholders were
unsure and sometimes skeptical about the use of alternative technologies in
producing credible data.
Data analysts demand better access to data in order to make their own contributions to
monitoring and understanding the development progress.
o In general, data analysts faced significant difficulties in accessing data, particularly
micro-level data.
o While data producers were only concerned with monitoring data, data analysts
demanded reliable and relevant data that could be used to undertake further analysis.

19
Post-2015 Priorities for Bangladesh
Overview of Existing National Priorities
The post-2015 agenda is an opportunity to stimulate an effective response to pressing issues such as
poverty, inequality, employment and inclusive growth, child nutrition, maternal health, education,
energy, the environment and governance. As countries move forward with defining new development
goals and targets for the post-2015 agenda, it is important to build on MDG milestones and
achievements and address gaps that remain unresolved.
As mentioned, Bangladesh has performed remarkably well in attaining many of the MDGs, particularly
in the area of poverty reduction as it is on track to achieve the target of halving extreme poverty by the
end of 2015.10 The country has also made notable progress in the areas of achieving gender parity in
education, reducing maternal and child mortality and combating HIV/AIDS and other major diseases.
Despite this progress, Bangladesh needs to address many remaining challenges, such as growing
income disparity, which alienates a large segment of the population (women and ethnic minorities, for
example, are particularly affected), persistent undernourishment of mothers and children, which has
negative inter-generational consequences, and difficulties in attaining safe and unadulterated food,
which has emerged as a new challenge to achieving sustainable economic progress.
With regard to educational goals, Bangladesh has performed well, especially in achieving gender
parity at the primary school level. However, the dropout rate remains high, learning outcomes are not
up to the mark and the transition rate to the secondary level has remained below expectations. Skills
acquired through education remain weak and in many cases they are disconnected from emerging
market demands. Although Bangladesh has made commendable progress in empowering women,
more must be done to ensure that women and men have equal opportunities and access in economic
and social arenas. Significant progress has also been achieved in the health sector, but Bangladesh
is far from ensuring basic health rights for all. Poor and senior citizens of the country need special
attention. More public investment and outreach services are needed on an urgent basis, as health is a
key foundation of human capital formation in developing countries.
Addressing the need to improve access to modern technology, particularly ICT, has been impressive
over the last decade. Bangladesh has promoted and improved access to modern technology through
various policies. Improving public policies and regulations and providing the public with greater access
to the digital economy and ICT could become important ways to promote development. Good
governance plays a key role in successfully implementing development goals at the national and
global levels. Respect for human, social, economic and political rights are prerequisites for creating a
level playing field for various segments of the population so that they can harness their full human
potential. One of the notable gaps in the MDGs has been the lack of goals and targets on governance
or institutions that can support the process of sustainable development. Going forward, environmental
issues deserve much more attention as well. As one of the most climate-vulnerable countries,
Bangladesh must mobilise domestic resources and garner support from the international community
to encourage stakeholders to perform their responsibilities in light of the principle of common but
differentiated responsibilities.
10 This is in accordance with the indicator based on the national poverty line of Bangladesh. However, when measured in terms of income level of $1.25 PPP per day, Bangladesh may not be able to reach the target.
20
Selected Targets and Indicators
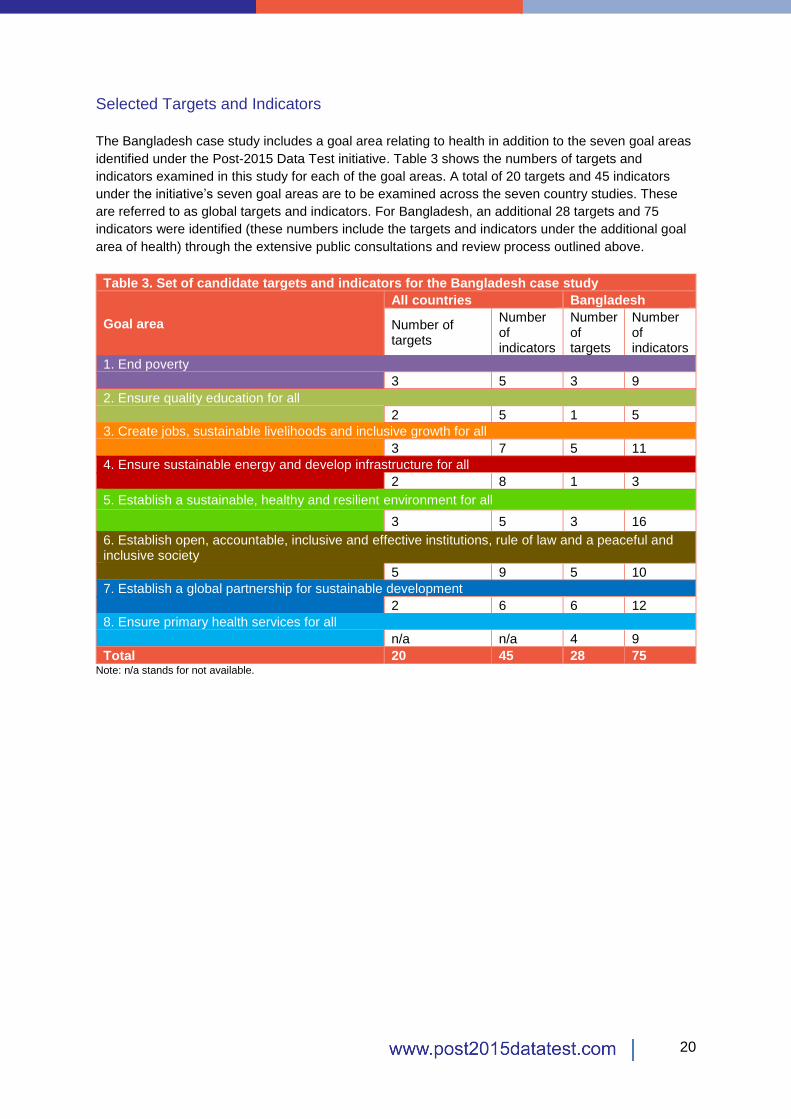
The Bangladesh case study includes a goal area relating to health in addition to the seven goal areas
identified under the Post-2015 Data Test initiative. Table 3 shows the numbers of targets and
indicators examined in this study for each of the goal areas. A total of 20 targets and 45 indicators
under the initiative’s seven goal areas are to be examined across the seven country studies. These
are referred to as global targets and indicators. For Bangladesh, an additional 28 targets and 75
indicators were identified (these numbers include the targets and indicators under the additional goal
area of health) through the extensive public consultations and review process outlined above.
Table 3. Set of candidate targets and indicators for the Bangladesh case study
Goal area
All countries Bangladesh
Number of targets
Number of indicators
Number of targets
Number of indicators
1. End poverty
3 5 3 9
2. Ensure quality education for all
2 5 1 5
3. Create jobs, sustainable livelihoods and inclusive growth for all
3 7 5 11
4. Ensure sustainable energy and develop infrastructure for all
2 8 1 3
5. Establish a sustainable, healthy and resilient environment for all
3 5 3 16
6. Establish open, accountable, inclusive and effective institutions, rule of law and a peaceful and inclusive society
5 9 5 10
7. Establish a global partnership for sustainable development
2 6 6 12
8. Ensure primary health services for all
n/a n/a 4 9
Total 20 45 28 75 Note: n/a stands for not available.

21
End Poverty
Progress and Priorities
Alleviating poverty and boosting inclusive growth remain the key priorities in Bangladesh’s national
development agenda. With regard to MDG 1 (eradicate extreme poverty and hunger), the country’s
progress has been quite impressive. Bangladesh has halved the proportion of its population living
below the national poverty line. That proportion fell from 56.7 percent in 1991–92 to 31.5 percent in
2010.11 The latest estimate from 2013 suggests that the proportion fell to 26.5 percent, which
surpasses the target of 27.8 percent for 2015. Notably, the rate of poverty reduction was faster in the
last decade compared to prior decades. Bangladesh has been able to maintain steady economic
growth in recent years. It is likely that poverty alleviation and inclusive growth will be separate areas of
focus in the post-2015 agenda. Targets relating to poverty, hunger and nutrition will likely be
standalone targets, with separate targets relating to economic growth and reducing inequality. Targets
relating to inclusive growth should involve increased employment opportunities, reduced disparity and
better living standards.
In the MDGs, poverty, inclusive growth and hunger (including nutrition) were considered to be part of
the same goal, MDG 1. Bangladesh met one of the indicators of target 1 by reducing the poverty gap
ratio to 6.5 in 2010, with the target for 2015 being 8.0 (GED 2014). Estimates from the Household
Income and Expenditure Survey (HIES) suggest that the target of halving the proportion of the
population living below the upper poverty line12 at the national level was achieved in 2012. Still,
Bangladesh needs to work toward reducing the proportion of its population living on less than
US$1.25 (PPP) per day, which is a comparable global benchmark.13 As of 2010, around 43.3 percent
of the population remained below that benchmark, with the target for 2015 being 35.1 percent.
Moreover, the gap between the US$1.25 (PPP) and US$2 (PPP) per day benchmarks is increasing,
indicating rising inequality. The difference between the head count ratios of US$1.25 (PPP) and US$2
(PPP) per day was 25.3 percent, 29.2 percent and 32.5 percent in 2000, 2005 and 2010, respectively.
Hence, although more people are moving out of a certain level of poverty (i.e., the US$1.25 (PPP) per
day line), the most marginalised segments of the population remain within the proximity of extreme
poverty. These vulnerable people are susceptible to falling below the poverty line as a consequence
of any sudden shock.
While Bangladesh may be on track to achieve the MDG target of halving poverty by the end of 2015,
there is a flip side to this progress. Income distribution has tended to be asymmetrical, with the Gini
coefficient increasing from 0.39 in the early 1990s to 0.45 in 2000 to 0.47 in 2005, indicating a
growing income gap between the rich and the poor. A marginal improvement was observed in 2010
when HIES data indicated that the Gini coefficient decreased to 0.46.
Another shift to consider is the changing geography of poverty in Bangladesh. An east-west divide is
evident in the country, with HIES data indicating that pockets of poverty have shifted between the two
regions from east zone to west zone. A similar trend is also apparent with regard to the rural-urban
divide. Rural poverty and poverty in urban and peri-urban slums have different dimensions and
separate policy interventions are required to address them.14 In Bangladesh, the HIES produces
11 The latest official data from 2010 show that the incidence of extreme poverty has declined at an annual rate of 2.47 percent during the 1992–2010 period. The MDG target is to maintain a declining annual rate of 2.12 percent for the entire 1992–2015 period (BBS 2011). 12 There were 16 upper poverty lines (and 16 corresponding lower poverty lines) in Bangladesh, one for each stratum. 13 It should be noted that before the revision of MDG indicators in 2007, people living below US$1 (PPP) per day in terms of income level or consumption were considered to be extremely poor. 14 Clear definitions of urban and rural demarcation need to be established in Bangladesh.
22
disaggregated data for 16 strata comprising rural, urban and other urban classifications for all
divisions. The BBS produced poverty estimates at a more disaggregated geo-political level (i.e., sub-
district or upazilla level) by integrating HIES data with the population census sampling frame.
Information and estimates regarding the nature and dimensions of poverty have made one point clear:
there is an acute need for more nationally produced credible poverty numbers that can be used in
aggregate global poverty estimates. This is critically important from the perspective of addressing the
“leave no one behind” principle for the post-2015 period.
Attaining targets relating to food security and nutritional well-being remains a major challenge in
Bangladesh. All indicators on hunger and nutrition require special attention.15 This is due to the under-
achievement of targets by groups in the population that require special attention, such as households
headed by single women, disadvantaged youth and working children, physically challenged people
and others. The lack of significant advancements by ethnic minorities with regard to nutrition also
remains a concern.
Country-Level Post-2015 Targets and Indicators
The post-2015 agenda will likely seek the more ambitious target of ending extreme poverty. The
suggested indicator for monitoring this target is the proportion of world population below US$1.25
(PPP) per day. The aim in this regard is for this proportion to fall to zero by 2030, which makes it a
global minimum standard. For Bangladesh, it will be highly challenging to achieve this target within the
timeline. As mentioned, around 43.3 percent of Bangladesh’s population lived below US$1.25 (PPP)
per day in 2010. Still, attempting to end national extreme poverty is a worthwhile endeavour.
The GoB proposed to the UN that a separate goal on food security and nutrition could improve focus
and thus help countries tackle related problems. Here, however, poverty, hunger and nutrition are
addressed under the same goal area to ensure consistency across country studies under the Post-
2015 Data Test initiative.
Taking into account Bangladesh’s context and priorities, various national targets and indicators have
been proposed for measuring progress on post-2015. A total of 14 indicators (including the five global
indicators) have been suggested to monitor targets on ending extreme poverty, reducing poverty
according to the national upper poverty line and reducing hunger by 2030. These indicators involve
the national extreme poverty line, squared poverty gap ratio, multidimensional poverty index and
wasting (see Table 4). Notably, Bangladesh has identified covering more people under social
protection measures as a national priority. Such measures would help ensure adequate nutrition for
the groups that receive coverage, such as the poor and vulnerable who need it most. To monitor a
national target on social protection measures, indicators relating to nutrition, food production and
pregnant women have been suggested. To ensure that the needs of marginalised people can be
addressed, appropriate disaggregation of these indicators is recommended.
15 Although Bangladesh is on track to meet the target on the prevalence of underweight children under five years of age (targeted to fall to 33 percent by the end of 2015 from 66 percent in 1990, prevalence stood at 36.4 percent in 2011), the target is set on the high side. The percentage of underweight children of that age group should drop at a faster rate.

23
Table 4. End poverty: Targets and indicators
Target Indicator
Global
End extreme income poverty Proportion of population below US$1.25 (PPP) per day
Reduce poverty Proportion of population below US$2 (PPP) per day
Proportion of population living below national poverty line
Share of employed persons living below the nationally-defined poverty line
Reduce the proportion of people who suffer from hunger
Prevalence of child stunting in boys and girls under 5, %
National
End extreme income poverty Proportion of population below national extreme poverty line
Reduce poverty
Reduce severity index (squared poverty gap ratio)
Percentage of population living in poverty according to the multidimensional poverty index
Reduce the proportion of people who suffer from hunger
Proportion of children under 5 years of age with low weight-for-height (wasting)
Cover x% of poor and vulnerable people with social protection measures
Percentage of poor and vulnerable people under social protection measures
End hunger and protect the right of all to have access to sufficient, safe, affordable and nutritious food
Proportion of people (by sex and age) consuming less than 2,122 kilocalories per day
Proportion of people (by sex and age) consuming less than 1,805 kilocalories per day
Per capita production of cereal
Improve nutritional status of pregnant women, lactating mothers and their newborns
Coverage of iron-folic acid supplements for pregnant women, %

24
Ensure Quality Education for All
Progress and Priorities
Primary education enrolment is one development area in which Bangladesh has achieved
commendable progress. Gender parity with regard to the net enrolment rate for primary education has
almost been attained.16 Gender parity has been achieved at the secondary level. Despite significant
improvements in reducing the dropout rate at the secondary level since 1990, further efforts are
needed. Meanwhile, initiatives have been undertaken to introduce pre-primary education and
implement various quality-enhancement measures in primary education. The National Education
Policy of 2010 mandates that “education for all children” is a fundamental right. The GoB has adopted
a resolution to extend the length of primary schooling to the eighth grade (the previous length of
primary schooling was to the fifth grade). These initiatives are indeed welcome.
Since 2011, the GoB has been implementing the third phase of the five-year Primary Education
Development Programme, which is one of the largest development programmes in terms of project
size. This US$2.8 billion programme has received some assistance from development partners.17 The
government has also introduced the primary education stipend programme, school feeding
programme, secondary education quality and access enhancement project, various ICT initiatives for
schools and several Technical and Vocational Education and Training (TVET) programmes, among
others. Besides the government’s initiatives, many donor-supported non-governmental organisation
activities have extended non-formal education opportunities to marginalised groups. Various research
initiatives have been undertaken regarding the expansion of education at different levels.
Bangladesh faces challenges in attaining targets linked to primary education completion rate, youth
literacy rate and adult literacy rate. A large percentage of children suffering from autism spectrum
disorders remain excluded from the country’s education system. The quality of education has been a
major challenge at all tiers of the education system. Experts have called for better mechanisms to
measure the quality of both students and teachers. Grading policy needs to be updated to stay on par
with relevant global standards.
Country-Level Post-2015 Targets and Indicators
The post-2015 agenda ought to include improving the quality of basic education. Bangladesh has a
special interest in this. Notably, the GoB has proposed that “gender,” which is key to addressing many
development challenges, be considered in a separate goal. This proposal is driven by Bangladesh’s
success in promoting gender equality in major areas such as education.18
Two global targets and five global indicators were selected for the Bangladesh case study. They cover
full access to early childhood and primary education, education quality and increasing enrolment in
TVET (see Table 5). For the indicators, benchmarking and generation of data could involve significant
challenges. A module could be added to existing surveys to generate the required data. However, the
conceptualisation of the meaning of “quality” needs to be aligned with relevant global measures to
16 According to data from the Directorate of Primary Education for 2011, the net enrolment rate was 98.7 percent, with girls’ enrolment being 99.4 percent and boys’ enrolment being 97.2 percent (DPE 2011). 17 Development partners including the Asian Development Bank, United Kingdom’s Department for International Development, European Union, Japan International Cooperation Agency, United Nations Children's Fund and World Bank have provided financial support worth about US$423 million. 18 Although success has been limited in the areas of governance (participation of female representatives at the national and local levels) and economic development (wage disparity between male and female labour), the country has made achieving gender equality and women’s empowerment in these areas a priority.

25
ensure conformity and comparability. For Bangladesh, five additional indicators have been proposed
and one additional target on promoting quality research has been suggested. These indicators were
selected to focus attention on and monitor the dropout rate at the secondary level as well as financing
for TVET and research programmes. Teacher-student ratio by level of education was selected to
monitor the quality of education. These indicators are aligned with the GoB’s plans and priorities for
education.
Table 5. Ensure quality education for all: Targets and indicators
Target Indicator
Global
Ensure all children have access to early childhood and quality primary and secondary education
% of girls and boys receiving at least one year in pre-primary programmes
% of girls and boys who complete primary school
% of girls and boys who complete secondary school
% of girls and boys who achieve a passing grade in national learning assessments at the primary school level
Increase the number of adults with skills, including technical and vocational skills
Proportion of individuals enrolled in a Technical and Vocational Education and Training (TVET) institution
National
Ensure all children have access to early childhood and quality primary and secondary education
Dropout rate at secondary level, %
Teacher-student ratio by level of education
Increase the number of adults with skills, including technical and vocational skills
Percentage of education budget for Technical and Vocational Education and Training
Promote quality research (for knowledge creation/innovation)
Proportion of budget allocated to research and innovation
Number of research findings/innovations patented

26
Create Jobs, Sustainable Livelihoods and
Inclusive Growth for All
Progress and Priorities
Creating jobs and supporting sustainable livelihoods is central to the development process. How
marginalised groups, youth and children benefit (or are exploited) through economic growth
processes is also important. Although Bangladesh maintained consistent economic growth measured
in terms of gross domestic product (GDP) over the 2000–10 period, averaging over 6 percent, and
accelerated the rate of growth by one percentage point compared to the preceding decades, income
inequality in Bangladesh remains persistently high. Growth has been achieved, but serious concerns
remain in terms of creating decent jobs and facilitating necessary structural changes in the economy.
According to the 2010 HIES, inequality marginally decreased between 2005 and 2010. At the national
level, the Gini coefficient of consumption expenditure decreased from 0.332 in 2005 to 0.321 in 2010 .
The Gini coefficient of income decreased from 0.467 in 2005 to 0.458 in 2010. The share of top 5
percent earners in total income declined from 26.9 percent in 2005 to 24.6 percent in 2010. Indeed,
income inequality in urban regions has decreased significantly during the period. However, the share
of income of the lowest three deciles19 remained largely stagnant – it marginally fell from 9.4 percent
in 2005 to 9.3 percent in 2010. This indicates that the income share of the most marginalised segment
of the population did not change significantly during the period.
Unemployment remains an acute problem in Bangladesh’s labour-intensive industrial and agricultural
sectors. Youth aged 15–24 years constitute 9 percent of Bangladesh’s population and 23 percent of
the labour force. This group is most vulnerable to unemployment and underemployment. Informal
economic activities have been on the rise in recent years, with large participation by this group.
According to the latest Labour Force Survey (LFS) data, approximately seven informal jobs were
created for every formal job in 2010. The ratio was only 3.7:1 in 2006. For women, the situation
appears to be worse. One reason for this is that it is common for women in rural areas to take
responsibility for domestic household activities. The aforementioned ratio was 6.1:1 in 2006 and
11.5:1 in 2010 for women. During the 2006–10 period, the number of employed individuals in the
formal sector decreased by 3.4 million in absolute terms, while the number of people in the informal
sector increased by 10.1 million. Wage discrimination is also common among ethnic minorities.
Efforts to create decent jobs have been constrained by the prevalence of the informal sector. On a
positive note, a number of national and international initiatives are being put in place to improve
working conditions in Bangladesh. Following the Rana Plaza tragedy of April 2013, workers’ rights
and workplace safety issues have gained prominence in public discourse. Alliances of apparel buyers,
such as the Bangladesh Accord Group created by retailers from the European Union and the Alliance
of North American buyers (widely known as the Accord and Alliance), and the International Labour
Organization have implemented initiatives to improve workplace safety. Labour rights were improved
through the amended Labour Law of 2013 and certain policy instruments. The key policy document
for safeguarding the interests of children is the Child Policy of 2010, which endorsed the right to equal
wage for equal work and ensures the fundamental rights of working children. However, full
implementation of policies has remained a major challenge.
19 The lowest three deciles are considered as a measure to evaluate the condition of the poorest segment of the population. As mentioned earlier, 31.5 percent of Bangladesh’s population lived below the national poverty line in 2010.

27
Country-Level Post-2015 Targets and Indicators
For this multidimensional goal area, three global targets are being examined across the country
studies: achieve full and productive employment for all, ensure equal pay at work, and support
inclusive growth and reduce inequality (see Table 6). Seven indicators were selected to monitor the
targets including labour force participation rate, Gini coefficient, Palma ratio and gross fixed capital
formation (as a percentage of GDP). At the national level, five targets and 11 indicators have been
proposed. The targets for Bangladesh are in the areas of child labour, youth employment, women’s
empowerment, workplace safety and enabling business. Notably, three additional indicators have
been proposed to monitor the target on full and productive employment in Bangladesh.
Challenges remain with respect to the indicators. The first challenge relates to regular and timely data
generation. The data source for many of the indicators under this goal area is the LFS, which is one of
the BBS’s major surveys. It is conducted every three to four years, but there is a need to undertake
this survey and others more frequently. The BBS is undertaking new initiatives to address this felt
need. The timely dissemination of results also deserves attention. The second challenge concerns the
measurement of some indicators, such as time-related underemployment. Third, some indicators may
suffer from lack of benchmark data (e.g., number of new jobs created by sector). Fourth, for some
indicators, the existing surveys may not be adequate (e.g., mean nominal monthly earnings of
employees).
Table 6. Create jobs, sustainable livelihoods and inclusive growth for all: Targets and indicators
Target Indicator
Global
Achieve full and productive employment for all, including women and young people
Labour force participation rate
Time-related underemployment (thousands)
Ensure equal pay for equal work Mean nominal monthly earnings of employees (local currency)
Support inclusive growth and reduce inequality Gini coefficient
Palma ratio
Growth rate of income of the bottom 40%
Gross fixed capital formation (% of GDP)
National
Achieve full and productive employment for all, including women and young people
Proportion of own-account and contributing family workers in total employment
GDP per person engaged (or labour productivity)
% of formal employment as a share of total employment by sex and type
Reduce child labour and eliminate worst forms of child labour
Number of children removed from child labour
Reduce vulnerability of workers and ensure their rights and safety
Incidence of occupational injury among industrial workers (%)
Decrease the number of young people not in education, employment or training by x%
% of skilled youth employed (gender disaggregated)
% of youth employed
Increase new start-ups by x and value addition in new products by y through creating an enabling business environment and boosting entrepreneurship
Number of new jobs created (by sector)
Eliminate discrimination against women in political, economic and public life
Labour force participation rate of women compared to men
Average number of hours per week of unpaid domestic work (by sex)
Proportion of women-owned or managed businesses

28
Ensure Sustainable Energy and Develop
Infrastructure for All
Progress and Priorities
The cross-cutting development agenda on energy and infrastructure issues was not adequately
defined in the MDGs. Rising concerns about sustainable development and the environment, growing
demands for energy and increasing resource scarcity have made energy and infrastructure major
points of discussion in negotiations on the post-2015 agenda. While there were no MDGs on energy
and infrastructure, both are critically important as prerequisites for economic growth, poverty
alleviation and social development. Poverty and energy deficiency go hand in hand. Energy expenses
account for a significant proportion of household incomes in many developing countries. People in
many low-income countries often suffer from lack of energy.
The GoB has committed to providing affordable and reliable electricity to all by 2021. As of 2012,
about 53 percent of Bangladesh’s population had energy coverage. Per capita generation of electricity
was approximately 272 kilowatt-hours that same year, which is low even by South Asian standards.
To fulfil the aforementioned commitment, significantly enhancing supply-side capacity of the power
sector, including primary energy for power production, is required. New transmission lines will also
need to be established. Remote areas currently do not have access to uninterrupted electricity and
often do not have access to any electricity at all. Improved, cost-effective and efficient generation,
transmission and distribution of electricity will be a major challenge for Bangladesh in the coming
decade.
Better access to energy is a necessary condition for rapid urbanisation and industrial growth. Natural
gas is the primary source of energy used by the commercial sector in Bangladesh. Natural gas is also
the main energy source in the industrial sector, but there is significant unmet demand. The use of
compressed natural gas is on the rise as fuel for passenger and freight transport. Gas demand is
estimated to reach 5.6 billion cubic feet by 2025, a figure that current reserves will not be able to
meet. More than US$9 billion of investment will be required for exploration, development and
expansion of the transmission network by 2025. Supplementary sources of energy are imported liquid
fuel and coal. About 3.3 billion tonnes of high-quality coal reserves have been discovered in
Bangladesh, but environmental concerns have until now deferred mining. Currently only one coal
mine using the closed pit method is operational.
The use of renewable energy is negligible in Bangladesh. The GoB has taken several steps to
address the issue. With the Sustainable and Renewable Energy Development Authority Act of 2012,
the government committed to establishing a renewable and clean energy promotion institution. The
idea is to facilitate both public- and private-sector investment in conventional and non-conventional
energy projects to develop indigenous energy resources. There are also plans to scale up existing
renewable energy-based electricity production to achieve the goal of energy-efficient power for all.
Regarding use of ICT, no target-based ICT indicator was used during MDG implementation despite
one MDG target mentioning “making available the benefits of ICT.” Over the last decade, some
progress has been made in terms of introducing the use of ICT in Bangladesh. According to data from
the Bangladesh Telecommunication Regulatory Commission, about 7.5 percent of people had a land
telephone connection in 2012, an increase from 3.8 percent in 2000. The cellular phone penetration
was 64.6 percent in 2012, whereas the corresponding figure was only 0.2 in 2000. The use of the
internet also expanded over the last decade. In 2012, the number of internet users was approximately
20.5 per 100 people, an increase from only 0.1 in 2002 (GED 2014).

29
Country-Level Post-2015 Targets and Indicators
Two proposed global targets for energy and infrastructure focus on ensuring access to improved and
efficient energy sources, including renewable energy, as well as developed infrastructure and ICT
(see Table 7). Eight indicators were selected to monitor progress on these targets. Data generation
for certain indicators will require new modules or surveys (e.g., “% of the population with access to an
all-season road,” “rate of improvement in energy intensity,” “share of the population with access to
modern cooking solutions (%),” etc.).
Table 7. Ensure sustainable energy and develop infrastructure for all: Targets and indicators
Target Indicator
Global
Ensure full access to developed infrastructure and communication technology
Internet users (per 1,000 people)
Average bandwidth speed (megabits/second)
% of the population with access to an all-season road
% of adults with an account at a formal financial institution
Ensure access to energy and improve efficiency and sustainability of energy supply, including renewable energy
# of hours per day households have access to electricity on average
Rate of improvement in energy intensity
Share of the population with access to modern cooking solutions (%)
Share of renewable energy to total energy consumption
National
Ensure access to energy and improve efficiency and sustainability of energy supply, including renewable energy
% of households with access to electricity (rural/urban)
Per capita consumption of electricity
Increase use of energy-efficient transport and infrastructure
% using railway as mode of transport (passenger/freight)
At the country level, two additional targets have been proposed for Bangladesh – “ensure access to
energy and improve efficiency and sustainability of energy supply, including renewable energy” and
“increase use of energy-efficient transport and infrastructure.” Notably, the GoB proposed to the UN a
separate goal for the post-2015 agenda that addresses sustainable production, consumption and use
of resources. The proposal called for energy-efficient use of resources for infrastructure development
and increased use of an energy-efficient transport system. It was suggested that the 3R approach –
reduce, reuse and recycle – be encouraged for sustainable and energy-friendly production in the
industrial sector.
For Bangladesh, more basic indicators are needed. Hence, indicators on electricity coverage for
households in rural and urban areas and per capita consumption of electricity have been suggested
for monitoring progress on energy access. For infrastructure and transport development, the indicator
that has been suggested is the share of passenger and freight transportation using railways a mode of
transport.
The reasoning behind the selection of these global and national targets and indicators is to stay
focused on basic data relating to energy efficiency, electricity access, access to ICT and physical
infrastructure. Such data are essential for measuring the degree of physical preparedness for the
economic and industrial development of a country. The Bangladesh Telecommunication Regulatory
Commission provides data for ICT indicators, while the Bangladesh Power Development Board could
be a potential source for energy-related indicators. The Bangladesh Bank – the country’s central bank
– could provide data for the “% of adults with an account at a formal financial institution” indicator.
However, all these data are used for administrative purposes. Indeed, administrative entities will be
key sources of data for post-2015 alongside survey-based sources. National surveys are a potential

30
source of infrastructure-related data. Some global databases, such as the World Bank’s World
Development Indicators (WDI), also provide data and information for indicators relating to physical
infrastructure. Timeliness, relevance and adequacy of data will be challenges for many of the
indicators.

31
Establish a Sustainable, Healthy and
Resilient Environment for All
Progress and Priorities
Bangladesh’s geographical location on the Indian Ocean and the large size of the Ganges Delta
makes the country highly vulnerable to natural disasters and climate change. It suffers from recurring
setbacks arising from natural disasters such as flooding and millions of people remain susceptible to
related risks. However, in terms of disaster risk management, Bangladesh is a global role model. Over
the years, the GoB has invested over US$10 billion to moderate the impacts of natural shocks. This
investment has been utilised to establish flood management schemes, coastal polders and cyclone
shelters and engage in disaster preparedness activities. The Cyclone Preparedness Programme, a
joint programme of the GoB and the Bangladesh Red Crescent Society, has emerged as a robust
early warning system for the coastal population.
On the other hand, Bangladesh’s record as regards building a green belt on the coast has not been
very good. According to data for 2012 from the Forest Department of the Ministry of Environment and
Forests, about 2.53 million hectares, or 19.4 percent, of land in Bangladesh was covered by trees.
The relevant MDG target is 20 percent to be achieved by the end of 2015. However, the density of
tree cover is only about 10 percent, with the target level being 70 percent and above. Bangladesh
urgently needs to expand tree cover to attain the MDG target. Although globally carbon dioxide (CO2)
emissions are steadily increasing over time, Bangladesh is not a large CO2 emitting country. In 2007,
emissions totalled approximately 0.30 tonnes per capita. They are expected to remain below the 0.38
tonnes per capita threshold in 2015.
Regarding access to safe drinking water and sanitation for all, the world is on track to achieve the
MDG target. However, progress in this area has been uneven across countries. Many parts of the
world have serious problems with water quality because of pollution and surface and groundwater
contamination. Progress on access to safe drinking water for all has proved to be a challenge for
Bangladesh. In 2009, 97.8 percent of the population had access to an improved source of drinking
water if arsenic contamination is not considered, but the figure falls to 86 percent if adjusted for
arsenic contamination. As is known, arsenic contamination and salinity intrusion disproportionately
affect the poor. Approximately 63.5 percent of the population had access to improved sanitation in
2010.
The GoB adopted the National Sustainable Development Strategy for the 2011–21 period, which
identified five strategic priority areas and three cross-cutting issues for Bangladesh’s sustainable
development. The strategic priority areas include sustained economic growth, development of priority
sectors, urban development, social security and protection, and environment, natural resources and
disaster management. The three cross-cutting issues are disaster risk reduction and climate, good
governance and gender. The Sustainable Development Monitoring Council was formed to monitor
and evaluate the progress on the strategy’s implementation. The strategy is in line with the
government’s other planning documents and programmes, most notably the Sixth Five Year Plan (FY
2011-FY 2015) and Perspective Plan of Bangladesh 2010-2021.

32
Country-Level Post-2015 Targets and Indicators
Three global targets were selected for the Bangladesh case study (see Table 8). They focus on
reducing human vulnerability to natural disasters, safeguarding ecosystems by protecting forest areas
and publishing governments’ and corporations’ economic, social and environmental accounts. These
targets have five indicators. For Bangladesh, an additional five indicators have been proposed for the
same three targets.
Table 8. Establish a sustainable, healthy and resilient environment for all: Targets and indicators
Target Indicator
Global
Build resilience and reduce deaths from natural hazards
Disaster deaths per 1,000 inhabitants
Safeguard ecosystems and biodiversity
Net loss in forest area (% of land area)
Trends in coverage of protected areas
Publish and use economic, social and environmental accounts in all governments and companies
Share of large tax unit taxpayers using integrated reporting20
Existence of national and sub-national government publishing according to the System of Environmental-Economic Accounting21
National
Build resilience and reduce deaths from natural hazards
Proportion of disaster-related economic loss (% of GDP)
Percentage of national budget/resources committed to disaster risk reduction and climate change adaptation across sectors
% of reduction in natural and human-induced disaster mortality
Safeguard ecosystems and biodiversity
Proportion of fish stocks within safe biological limits
Publish and use economic, social and environmental accounts in all governments and companies
Proportion of government departments and large companies (capitalisation above US$100 million equivalent) publishing economic, social and environmental accounts
Ensure sustainability in production, consumption and use of resources
Consumption of ozone-depleting chlorofluorocarbons (metric tonnes per capita)
Greenhouse gas emissions (per capita and per US$1 GDP [PPP])
CO2 emissions per capita, per US$1 GDP and total
% change in particulate concentration in urban air
Provide universal access to safe drinking water at home, and in schools, health centres and refugee camps
% of urban population using basic drinking water
% of urban population using basic sanitation services
Reduce the vulnerability and exposure of local communities to disasters
% of area covered by early warning system
% of earthquake-resilient buildings and infrastructure
% of area covered by community-based disaster risk management
% of population below a particular flood line (100-year flood, 10 years)
% of industrial sector with water management
20 Integrated reporting is a process founded on integrated thinking that results in a periodic integrated report by an organisation about value creation over time and related communications regarding aspects of value creation. An integrated report is a concise communication about how an organisation’s strategy, governance, performance and prospects, in the context of its external environment, lead to the creation of value in the short, medium and long term (IIRC 2013). Large taxpayers are very different from other categories of taxpayers and present certain significant risks to effective tax administration. Key characteristics of large businesses include: concentration of revenues, complexity of business and tax dealings, withholding agent or intermediary role, use of professional tax advisors and possession of in-house tax organisation. Businesses may be publicly listed corporations, multinational companies or private groups (OECD 2009). 21 This is primarily a “yes-no” indicator and has binary variables that can only have two possible values.

33
An additional three targets with 11 corresponding indicators have also been proposed. The targets
cover eco-friendly production and consumption, access to safe drinking water and sanitation and
reduction of community vulnerabilities to disasters. Some of the proposed indicators are aligned with
the MDGs. Certain indicators have data adequacy problems that need to be addressed.
In its post-2015 report to the UN, the GoB called for integrating disaster risk reduction and climate
change adaptation into the core components of sustainable development. Increased use of
community-based surveillance mechanisms and increased regional and global cooperation were also
sought for combating natural disasters and managing post-disaster situations. Some environment-
related MDG indicators are not directly relevant to Bangladesh, but the GoB needs to track progress
made by rest of the world given that Bangladesh is one of the countries that are most vulnerable to
natural disasters and climate change. The GoB needs to take into consideration that timely and
reliable data generation for many environment-related indicators requires technical knowledge and is
rather costly. It should negotiate for sufficient technical and financial assistance to adapt to and
address emerging scenarios.

34
Establish Open, Accountable, Inclusive and Effective
Institutions, Rule of Law and a Peaceful and Inclusive Society
Progress and Priorities
A goal area that addressed the accountability and transparency of government entities as well as
establishing the rule of law was absent in the MDGs. Such a goal area, the choice of targets and
indicators, and monitoring by relevant stakeholders (i.e., NSOs, non-governmental organisations and
other actors) are critically important for Bangladesh. Discussions under the post-2015 process have
assessed the importance of functional institutions and their prospects for advancing the post-2015
agenda. Many participants have argued that lack of institutional capacity severely constrained the
achievements of the MDGs. More specifically, the implementation of development policies can be
constrained if institutions lack the capacity to perform their roles. Lack of transparency and ineffective
accountability within institutions and inefficient rule of law in general may undermine the rights of
marginalised segments of a population and limit their access to valuable resources and opportunities.
Moving forward, there is a need to build capacity within institutions and ensure the availability of
adequately trained and equipped government officials. It is generally acknowledged that even a
transparent and accountable government would struggle to carry out its responsibilities without an
effective, efficient bureaucracy.
Country-Level Post-2015 Targets and Indicators
The five global targets selected under this goal area have nine associated indicators (see Table 9).
The targets were selected with preserving the fundamental rights of all citizens in mind. They involve
ensuring citizens’ eligibility to get national identity documents, maintaining the rule of law and access
to justice for all, and improving and enhancing the personal safety of citizens, particularly groups with
special needs.
The GoB proposed to the UN two separate targets – establishing human rights and ensuring good
governance – and over 40 possible indicators under this goal area for the post-2015 agenda. For the
Bangladesh case study, an additional five targets and 11 indicators have been proposed. The targets
focus on increasing civic engagement at all levels, the public’s right to information, transparency and
accountability of public and private institutions, ensuring access to judicial institutions and
strengthening the capacity of law enforcement agencies. Only a few of the associated indicators have
readily available official data. There is a need to improve data availability in order to track progress on
this goal area.

35
Table 9. Establish open, accountable, inclusive and effective institutions, rule of law and a peaceful and inclusive society: Targets and indicators
Target Indicator
Global
Provide free and universal legal identity, such as birth registrations
Percentage of children under 5 who are registered with the civil authority
Proportion of adults with a basic legal identity document
Monitor and end discrimination and inequalities in public service delivery, the rule of law, access to justice and participation in political and economic life on the basis of social status
Average time between filing a case and receiving a verdict
Proportion of seats held by women and minorities in national- or local-level government
% of adults with an account at a formal financial institution, disaggregated by sex
Improve personal safety Prevalence of violence against women, including domestic violence
Violent death per 100,000 people
Reduce bribery and corruption in all forms
Survey data regarding bribes or gifts for service from a government official – “In the past year, how often (if ever) have you had to pay a bribe, give a gift, or do a favour to government officials in order to get a document or receive a service”
Improve transparency in the revenue system
Share of eligible tax payers who submit their taxes
National
Reduce bribery and corruption in all forms
Perception of corruption in political, judicial and law enforcement institutions
Public perception of corruption in public administration
Increase public participation in political processes and civic engagement at all levels
Number of ministry oversight hearings held by parliamentary committees
Number of stakeholder consultation meetings held by ministries/local governments
Percentage of budget allocations directly benefiting the poor and disadvantaged groups such as women, ethnic minorities and the disabled
Number of CSOs that have officially participated and expressed their views in the process of developing and approving the national budget
Guarantee the public’s right to information and access to government data
Number of government entities that regularly place reports on their budgets and expenditure on their websites
Improve transparency and strengthen accountability and integrity of public and private institutions
Percentage of queries attended to by government entities under the Right to Information Act
Ensure justice institutions are accessible, independent, well-resourced and respect due-process rights
Number of prosecutions by the Anti Corruption Commission in one year
Enhance the capacity, professionalism and accountability of the security forces, police and judiciary
Increase in overall Rule of Law Index score

36
Establish a Global Partnership for
Sustainable Development
Progress and Priorities
The experience with MDG 8 (develop a global partnership for development) shows that not including
quantitative targets under a goal area makes progress inherently unclear. Only one indicator
(proportion of bilateral ODA [official development assistance] of OECD/DAC [Organisation for
Economic Co-operation and Development/Development Assistance Committee] donors that is untied,
%) is quantitative. According to data from the Economic Relations Division of the Ministry of Finance,
Bangladesh received 100 percent untied ODA from OECD/DAC countries in 2011. However, the
proportion of aid disbursement to Bangladesh declined from 5.6 percent of Bangladesh’s GDP in
1990–91 to 1.6 percent of GDP in 2010–11. Out of 34 OECD countries, nine provided approximately
US$364 million in ODA to Bangladesh in 2010–11, which was about one-fifth of total ODA received by
the country during that period. Only five OECD countries – Denmark, Luxembourg, Norway, Sweden
and the United Kingdom – have fulfilled their commitments to disburse 0.7 percent or more of their
respective GNI as ODA to developing countries (ERD 2011). Progress is evidently ambiguous.
Global partnership for sustainable development is an overarching goal area that involves both
developing and developed country perspectives. This partnership needs to be inclusive, with
leadership coming from governments. One challenge for LDCs such as Bangladesh relates to sources
of development finance. Against the backdrop of declining aid disbursements, there is a growing
realisation that developing countries must explore what options they have to enhance development
financing, including domestic resource mobilisation. They are expected to strengthen their financial
institutions and should source at least a part of their own development financing in line with their
needs and priorities. Enhancing allocative and implementation efficiency has also been called for. On
the other hand, developing countries could also benefit from exploring the potential of South-South
cooperation and operationalising the scope for such cooperation. Leveraging South-South
cooperation to better use North-South support is an emerging area of interest. Other than financing,
some technical knowledge and capacity-building efforts should be in place to strengthen the
prospects of developing countries. While the expectations for global partnership under the MDGs
remain unmet, there is an opportunity to correct this with the post-2015 agenda. In terms of the
environment, developing and developed countries have the responsibility to tackle problems caused
by development practices through concerted efforts. The GoB will need to consider these
developments and outline strategies accordingly.
Country-level Post-2015 Targets and Indicators
Two global targets and six associated indicators were selected under this goal area (see Table 10).
The targets involve creating an enabling environment for global cooperation and extending financing
to enhance productive capacity in low- and middle-income countries. The indicators are holistic in
nature and in some cases focus not on specific countries but rather a country group. As a LDC,
Bangladesh is considered an aid recipient. For the Bangladesh case study, an additional six targets
and 12 indicators have been proposed. They relate to aid, trade facilitation and combating illicit
financial flows.

37
Table 10. Establish a global partnership for sustainable development: Targets and indicators
Target Indicator
Global
Create an enabling environment for sustainable development
Low-income country debt forgiveness or reduction (% of GDP)
Share of trade in goods and services from low-income countries under duty-free, quota-free market access
Existence of laws for ensuring country-by-country reporting by multinational corporations, disclosure of beneficial ownership and the prevention of money laundering
Increase financing to productive capacity in low- and middle-income countries
Share of aid to the productive sector
Proportion of foreign direct investment to the productive sector
Share of South-South cooperation to the productive sector
National
Promote an open, rule-based, predictable, accountable and non-discriminatory trading system
Average tariffs imposed by developed countries on agricultural products, textiles and clothing from developing countries
Percentage of trade to GDP
Implement reforms to ensure stability and transparency of the international financial system and encourage stable, long-term private foreign investment
Share of non-performing loans in banking system’s total loan portfolio
Foreign direct investment to total investment ratio and foreign direct investment to GDP
Developed countries that have not done so should make concrete efforts towards the target of 0.7% of gross national income as ODA to developing countries and 0.15–0.20% of gross national income as ODA to LDCs; other countries should move towards voluntary targets for complementary financial assistance
% of gross national income to ODA
Enhance global collaboration for mobilisation of resources
Percentage of ODA received by developing countries from OECD/DAC countries
Percentage of ODA received by LDCs from OECD/DAC countries
Reduce illicit financial flows and tax evasion and increase stolen-asset recovery by $x
Illicit financial flows as a share of GDP
Strengthen partnership in addressing challenges to humanity including human and drug trafficking, money laundering, and prevention of and action against extremism and terrorism
Number of human-trafficking cases detected, prevented and prosecuted (disaggregated by sex, age and ethnicity)
Basel Anti-Money Laundering Index
Percentage of intra-regional trade to GDP
Number of signed treaties involving an integrated transport network for intra- and inter-regional cooperation on trade facilitation

38
Ensure Primary Health Services for All
Progress and Priorities
Primary health services is an area in which Bangladesh has made remarkable progress, particularly
with regard to reducing under-five and infant mortality rates. Worldwide, the number of deaths of
children under five years of age declined from 12.4 million in 1990 to 8.1 million in 2009, equivalent to
nearly 12,000 fewer children dying each day. Special efforts in South Asia, sub-Saharan Africa and
Oceania would contribute to the achievement of MDG 4 (reduce child mortality). According to the
Sample Vital Registration System (SVRS) report for 2011, the under-five mortality rate in Bangladesh
fell to 44 per 1,000 live births from 146 per 1,000 live births in 1990–91.22 These statistics indicate that
Bangladesh has contributed significantly to reducing child mortality in the South Asian region.
Achievements in combating HIV/AIDS, malaria and other diseases has also been encouraging, with
deaths caused by HIV/AIDS, malaria and tuberculosis having been reduced significantly worldwide.
Bangladesh is on track to meet MDG 6 (combat HIV/AIDS, malaria and other diseases). Other health-
related targets have either been met by Bangladesh or the country is on track to meet them by the
end of 2015, but one area that requires special attention is antenatal and reproductive health care.
Improved national strategies and increased financial support from development partners have
contributed to faster progress towards meeting health-related MDGs in many countries, including
Bangladesh. In Bangladesh, the Health, Population and Nutrition Sector Development Program
(2011–16) is being implemented by the Ministry of Health and Family Welfare, Directorate General of
Health Services, Directorate General of Family Planning and other entities through 32 operational
plans. About 60 percent of the total programme cost is financed by development partners. The World
Bank and Japan International Cooperation Agency are providing credit and grants, while other
development partners (the United Kingdom’s Department for International Development, Swedish
International Development Cooperation Agency, United States Agency for International Development,
Foreign Affairs, Trade and Development Canada, European Commission, Australian Department of
Foreign Affairs and Trade, KfW, World Health Organization, UN Children’s Fund, UN Population
Fund, German International Cooperation (GIZ), Joint UN Programme on HIV/AIDS, Global Fund to
Fight AIDS, Tuberculosis and Malaria, and Gavi, among others) are providing grants. The GoB’s
plans, strategies and timely efforts have played a major role in achieving the relevant targets.
Country-Level Post-2015 Targets and Indicators
A health-related goal area was not selected to be part of the Post-2015 Data Test. In line with
Bangladesh’s interests, the goal area “ensure primary health services for all” was added to the
Bangladesh case study. The data situation for this goal area is better relative to others. Five targets
and nine indicators have been proposed for the Bangladesh case study (see Table 11). Many of the
indicators are derived from MDG indicators. For a more in-depth assessment, some indicators are
disaggregated by rural, urban, gender and wealth quintile dimensions. Available surveys generate
much of the data required to measure these indicators. They include the BBS’s Bangladesh
Demographic and Health Survey (BDHS), Multiple Indicator Cluster Survey (MICS) and SVRS, as well
as the Bangladesh Maternal Mortality and Health Care Survey of the National Institute of Population
Research and Training (NIPORT). However, harmonisation of data and coordination among data
producers is needed to produce reliable information. Private-public partnership could be encouraged
to address the remaining data gaps. Notably, data privacy, especially in the health sector, has
remained a major concern.
22 To achieve the target, Bangladesh needed to drop the rate by two-thirds to 48 per 1,000 live births.

39
Table 11. Ensure primary health services for all: Targets and indicators
Targets Indicators
National
End/reduce preventable infant and under-
5 deaths
Infant mortality ratio (per 100,000 live births)
(rural/urban by gender and wealth quintile)
Under-5 child mortality rate (per 1,000 live births)
(rural/urban by gender and wealth quintile)
Decrease the maternal mortality ratio to
no more than x per 100,000 live births
Maternal mortality ratio (per 100,000 live births)
(rural/urban by gender and wealth quintile)
Ensure universal sexual and reproductive
health and rights
Percentage of births attended by skilled health
personnel
Ensure universal sexual and reproductive
health and rights
Percentage of use of contraceptive methods
Percentage of unmet need for family planning
Percentage of one-time antenatal care
Total fertility rate
Ensure basic health services for all Doctor, nurse and paramedics-population ratio
(rural/urban)

40
Overview of the National Statistical System in
Bangladesh
Current State of the National Statistical System in the Context of the MDGs
In Bangladesh, data on development progress mainly originate from three national censuses, five
regular surveys, several irregular (ad hoc) surveys and administrative records (BBS 2013). A large
part of the data and information on indicators related to measuring progress towards MDG attainment
is collected through these means. Over time, the quality of data for MDG indicators has improved
significantly. In general, data are available for MDG indicators on poverty (extreme poverty, poverty
gap), hunger (dietary consumption, child nutrition), employment (decent work for all), education
(primary education, literacy rate), gender equality (gender parity, women’s empowerment) and health
(child mortality, maternal health, HIV/AIDS). However, relevant surveys are only conducted
periodically and data availability at disaggregated levels (e.g., age, sex, ethnicity, sub-region, income)
is poor.
With regard to post-2015 data requirements, Bangladesh will need to undertake serious efforts to
address emerging demands. This is particularly true for the goal areas on governance, environmental
sustainability and global partnership. The BBS conducts very few regular surveys and the data
generated by other government entities are often found to be inadequate in terms of procedures,
methodology, timeliness, coverage and quality. Often data are not reliable, representative or
comparable.
Data Producers, Data Users and Funders of Data Collection
As Bangladesh’s NSO, the BBS produces the majority of available data on development issues. It
conducts a number of sample surveys each year either as a regular activity or on an ad hoc basis.
The regular monthly/quarterly/annual surveys are the Agriculture Crop Production Survey, SVRS,
Price and Wage Rate Survey, Local Government Budget Collection Survey and Survey of Current
Industrial Production (BBS 2013). The BBS regularly conducts some important sample surveys at
larger intervals. These surveys include the HIES every five years, the LFS every three years, the
MICS every three years and the Survey of Manufacturing Industries every two or three years. Some
surveys are conducted as needed. The National Child Labour Survey, for instance, was conducted in
2011 after an interval of eight years. The BBS also carries out some ad hoc or standalone sample
surveys, such as the Child and Mother Nutrition Survey, Health and Morbidity Status Survey and
Literacy Assessment Survey.
A number of other government entities collect data on a wide range of topics. Often these data are
generated to serve an entity’s specific data requirements. For example, the Bangladesh Bank
compiles data on macroeconomic indicators in order to conduct monetary policy. The National Board
of Revenue of the Ministry of Finance keeps records of data on revenue collection. The Directorate
General of Health Services and NIPORT regularly generate data on selected health indicators, while
BANBEIS and the Directorate of Primary Education report data on education-related indicators. These
entities publish some of their data, while access to other data requires data users to follow certain
administrative processes, which limit data accessibility. Often data on a single variable may be
generated by more than one entity or through multiple surveys. This often yields results with
discrepancies, which can be misleading in some instances.
Besides government entities, academics and the research community, CSOs and development
partners produce data on development issues in line with their own data requirements. In some

41
cases, government entities may build partnerships with private sector actors or assign them to collect
data or conduct surveys. For the BDHS, a private partner, Mitra Associates, has been given the
responsibility to collect data, while the survey is published by NIPORT.
Many of the aforementioned surveys are conducted using the GoB’s own financial and technical
resources. A number of surveys are either partially or fully supported (either financially or technically
or both) by development partners, including multilateral institutions (e.g., the World Bank, Asian
Development Bank and UN agencies). Government entities often receive technical support from
development partners to undertake certain surveys.23
Various stakeholders are users of development data. They include government entities, policy-
makers, academics, the research community, CSOs, development partners, the private sector,
journalists and students. Government entities and policy-makers use statistical information for shaping
strategies and regular reporting. In Bangladesh, the research community and CSOs make use of
official data for research and advocacy purposes. Notably, the use of statistics by journalists has been
expanding.
Historic Improvements to the National Statistical System
Bangladesh’s national statistical system has gone through several reforms in recent years. Concerted
efforts have been made to make additional data available on more indicators. There have been
various improvements since the inception of the MDGs. In order to produce reports on Bangladesh’s
progress towards MDG attainment, new surveys and initiatives on data production were established
and existing surveys were conducted with more regularity. A number of programmes to improve data-
related capacity were introduced. Improvements in data availability, quality assurance and the
timeliness and accessibility of data have been seen. Efforts have also been made to improve
dissemination of data through the use of ICT. Development partners have supported the GoB to make
data more open and accessible over the last decade. However, in spite of the progress made, there is
an urgent need to strengthen institutions and improve the quality of data in order to meet post-2015
demands.
Among Bangladesh’s data producers, the BBS is the best equipped and most capable. The BBS
collaborates with other data producers, including the Bangladesh Institute of Development Studies,
Bangladesh Bank, National Board of Revenue, Bangladesh Space Research and Remote Sensing
Organization, Department of Agricultural Extension, Export Promotion Bureau of the Ministry of
Commerce, Ministry of Health and Family Welfare, Ministry of Education, Ministry of Agriculture,
Ministry of Finance and NIPORT. Collaboration on data production includes activities such as
methodological design, sample design, design of questionnaires, data collection, data processing,
report writing and data dissemination. However, collaboration with key government entities such as
the Department of Environment, Directorate of Primary Education, Department of Disaster
Management of the Ministry of Disaster Management and Relief, and Forest Department of the
Ministry of Environment and Forests needs to be more regular and further strengthened.
The BBS has taken initiative to sign formal data exchange protocols with certain local, regional and
international organisations and development partners. The BBS also maintains geographic
information systems for producing data and making better use of digital mapping (BBS 2013).
Geographic information systems provide statistical data with a geographic dimension, in turn providing
better services to policy-makers and investors. Procedures are also in place to protect data
confidentiality.
23 For example, the recent Population Census was supported by the European Union, UN Population Fund, United States Agency for International Development and United States Census Bureau. Technical and financial support for the HIES has been provided by the World Bank.

42
Recently, the BBS prepared a National Strategy for the Development of Statistics (NSDS) for
Bangladesh covering the 2013–23 period. The exercise was funded by the World Bank’s Trust Fund.
The strategy identifies a number of time-bound actions.24 Proper implementation of the NSDS will
hopefully lead to better statistical operations and more effective collaboration between data producers
and data users. Unfortunately, several activities that were planned under the strategy have been
lagging behind schedule. Also, the strategy may need to be revisited and revised in view of post-2015
demands.
Besides the BBS, a number of other government entities are undertaking various activities to improve
their respective statistical systems. The Bangladesh Bank recently released time series data on
several macroeconomic indicators. The Ministry of Finance provides long-term annual data on several
other macroeconomic indicators through its regular publications. For other entities, comprehensive
plans for making their statistical systems more efficient are not in place. At the same time, there are
no concrete initiatives on the parts of private data producers.
Initiatives on Data Dissemination
Data dissemination by the BBS is done through publications in hard copy (reports, press releases,
etc.), CD and DVD, and the BBS website (BBS 2013). Printed publications are available at two sales
centres in Dhaka that are open to the public. The most important publications published regularly by
the BBS include the Statistical Yearbook, Statistical Pocketbook, Monthly Statistical Bulletin,
Yearbook of Agricultural Statistics, National Accounts Statistics and Foreign Trade Statistics. The
microdata of a number of BBS-conducted surveys are available in electronic format for sale to the
public, though at very high cost.
An interactive website is one of the most important means of data dissemination. The BBS website
has a storage capacity of three terabytes (BBS 2013), but it is arguably not interactive enough when
compared to global standards. Data and information relating to a wide range of indicators as well as
electronic versions of several reports are disseminated through it. Notably, the website provides
metadata for many but not all indicators. Information on how data are collected and compiled for most
indicators is only provided in printed publications. In some cases, however, the processes are not
adequately clarified and interpretation is difficult.
Among other major data producers, BANBEIS annually publishes the Bangladesh Educational
Statistics and Statistical Pocketbook in hard copy. BANBIES has a moderately developed website,
where it publishes its annual statistics and time series data. In general, the website does not provide
access to metadata. Currently, BANBEIS does not have a comprehensive strategy on data
dissemination.
Other government entities that provide data for MDG indicators also do not have clear data
dissemination strategies. Despite websites not being interactive and user-friendly in most cases, the
frequency of the publication of data and statistics online has been on the rise over the last decade.
However, such published data are often inadequate in view of emerging needs. Also, data are often
published in formats that are not user-friendly, which undermines dissemination. Data are typically
disseminated through publications in hard copy, with electronic versions mainly being in PDF format,
which is not user-friendly. Other than a few exceptions, data are generally not available in Microsoft
Excel, Stata or Statistical Package for the Social Sciences formats. With the enactment of the Right to
Information Act in 2009, people can go to public offices and file information requests, but this has yet
to become common practice.
24 For details, see BBS (2013).

43
Data for Measuring Progress on Post-2015 in
Bangladesh
Data Adequacy and Baseline
Current Data Availability Situation for Monitoring Progress on the MDGs
The data availability situation across MDG indicators is satisfactory in Bangladesh. As the MDGs
approach their target date, there remains a significant lack of either raw data or updated data for
various indicators. Table 12 shows Bangladesh’s current data availability situation across MDG
indicators. Data availability is adequate for MDG 2 (achieve universal primary education), MDG 3
(promote gender equality and empower women), MDG 4 (reduce child mortality) and MDG 5 (improve
maternal health).
Table 12. Data availability across MDG indicators
MDGs Number of indicators for which data are available
Total number of indicators
1. Eradicate extreme poverty and hunger 7 9
2. Achieve universal primary education 3 3
3. Promote gender equality and empower women 3 3
4. Reduce child mortality 3 3
5. Improve maternal health 6 6
6. Combat HIV/AIDS, malaria and other diseases 8 10
7. Ensure environmental sustainability 6 10
8. Develop a global partnership for development 8 16
Total 44 60
Out of the total 60 indicators for the eight MDGs and associated 21 targets (UNSD 2008), data are
available for 44 indicators (73 percent of the total) (see Figure 1). Partially available data, which refers
to data that may not be available at disaggregated levels or updated regularly, are considered to be
available in this context. The availability of data is good – data are available for 80 percent of
indicators – for MDG 1 (eradicate extreme poverty and hunger) and MDG 6 (combat HIV/AIDS,
malaria and other diseases). On the other hand, the data availability situation for MDG 7 (ensure
environmental sustainability) and MDG 8 (develop a global partnership for development) is
unsatisfactory, with data being available for only 60 percent and 50 percent of indicators, respectively.
Inadequate data production for MDG 8 at the national level may be due to the fact that MDG 8 is a
global goal for which data has not been systematically collected at the national level. Data for many of
the indicators associated with these two goals are either not available or not readily available.

44
Figure 1. Data availability (% of total) across MDG indicators
Note: Goal 1 is eradicate extreme poverty and hunger, Goal 2 is achieve universal primary education, Goal 3 is promote gender
equality and empower women, Goal 4 is reduce child mortality, Goal 5 is improve maternal health, Goal 6 is combat HIV/AIDS,
malaria and other diseases, Goal 7 is ensure environmental sustainability and Goal 8 is develop a global partnership for
development.
Data Availability Across Global and Country-Level Post-2015 Indicators
A data-mapping exercise was undertaken to assess the availability of data as regards the post-2015
indicators selected for the Bangladesh case study. Table 13 provides an overview of the data
availability situation in Bangladesh. Among the 45 global indicators examined in all seven country
studies under the Post-2015 Data Test initiative, data for 38 indicators (84.4 percent) were available
for Bangladesh. Additionally, out of 75 country-level indicators that have been proposed, data are
available for a total of 72 indicators (96 percent). In aggregate, data are available for 110 of the 120
selected indicators (91.7 percent).25 Overall, the data availability situation across post-2015 indicators
is very satisfactory in Bangladesh.26 However, it should be noted that data for a significant proportion
of indicators may not be readily available. Indeed, out of the 110 indicators for which data are
considered available, data for 42 indicators will need to be produced from existing information. For
some indicators, data need to be produced from information collected for administrative purposes,
while for others data need to calculated or estimated from existing survey data. Hence, more efforts
will be required to make these data available in a user-friendly format. Moreover, data should be
made available at disaggregated levels for many post-2015 indicators.
25 Partially available data (data that may not be available at disaggregated levels or updated regularly) and data not published officially (but can be generated without any additional survey) are considered to be available here. 26 The data availability situation for all indicators is presented in Annex 7.
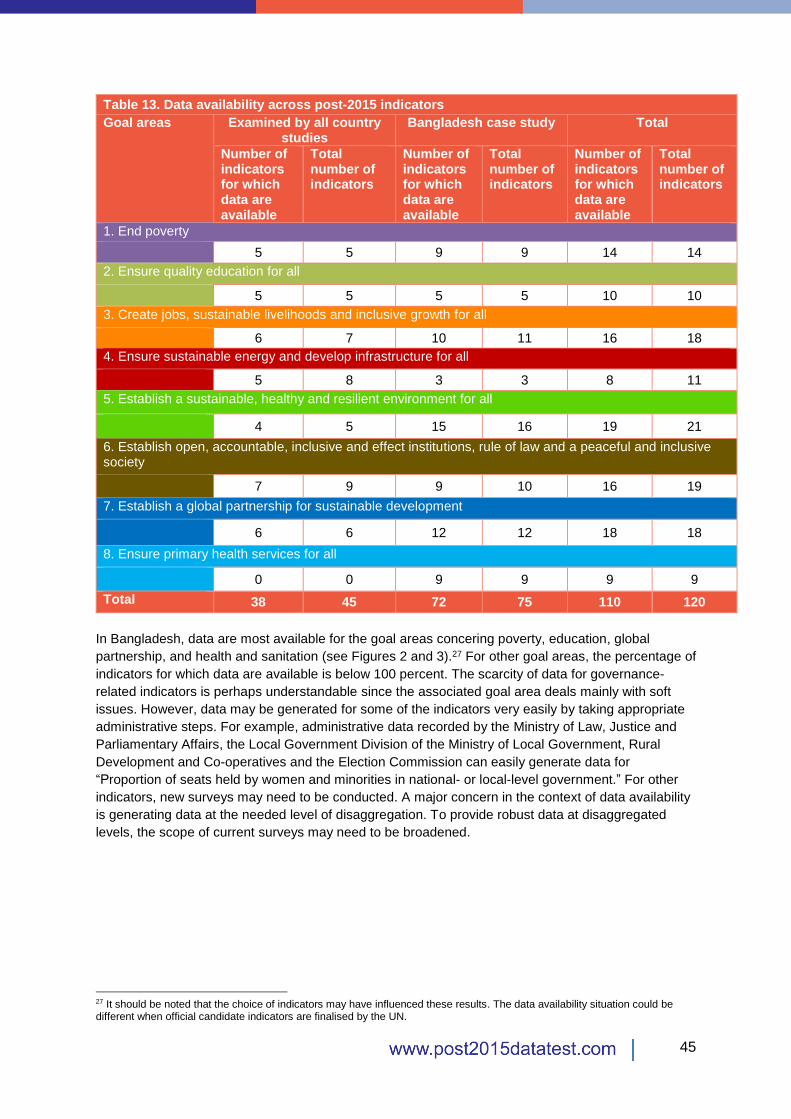
45
Table 13. Data availability across post-2015 indicators
Goal areas Examined by all country studies
Bangladesh case study Total
Number of indicators for which data are available
Total number of indicators
Number of indicators for which data are available
Total number of indicators
Number of indicators for which data are available
Total number of indicators
1. End poverty
5 5 9 9 14 14
2. Ensure quality education for all
5 5 5 5 10 10
3. Create jobs, sustainable livelihoods and inclusive growth for all
6 7 10 11 16 18
4. Ensure sustainable energy and develop infrastructure for all
5 8 3 3 8 11
5. Establish a sustainable, healthy and resilient environment for all
4 5 15 16 19 21
6. Establish open, accountable, inclusive and effect institutions, rule of law and a peaceful and inclusive society
7 9 9 10 16 19
7. Establish a global partnership for sustainable development
6 6 12 12 18 18
8. Ensure primary health services for all
0 0 9 9 9 9
Total 38 45 72 75 110 120
In Bangladesh, data are most available for the goal areas concering poverty, education, global
partnership, and health and sanitation (see Figures 2 and 3).27 For other goal areas, the percentage of
indicators for which data are available is below 100 percent. The scarcity of data for governance-
related indicators is perhaps understandable since the associated goal area deals mainly with soft
issues. However, data may be generated for some of the indicators very easily by taking appropriate
administrative steps. For example, administrative data recorded by the Ministry of Law, Justice and
Parliamentary Affairs, the Local Government Division of the Ministry of Local Government, Rural
Development and Co-operatives and the Election Commission can easily generate data for
“Proportion of seats held by women and minorities in national- or local-level government.” For other
indicators, new surveys may need to be conducted. A major concern in the context of data availability
is generating data at the needed level of disaggregation. To provide robust data at disaggregated
levels, the scope of current surveys may need to be broadened.
27 It should be noted that the choice of indicators may have influenced these results. The data availability situation could be different when official candidate indicators are finalised by the UN.

46
Figure 2. Data availability (% of all indicators) at the global level by goal area
Figure 3. Data availability (% of all indicators) at the national level by goal area
Sources of Data
Data for monitoring progress on development indicators can be obtained from various national and
global sources. Six major national sources of data for a variety of indicators were identified during the
data-mapping exercise for this study. Brief descriptions of these sources are presented in Table 14
below.

47
Table 14. Major national sources of data
Survey Latest issue available
Year started
Year of upcoming issue
Description Publisher and frequency of publication
Household Income and Expenditure Survey (HIES)
2010 (15th round)
1973–74 2015 National survey conducted by the BBS. Household income and consumption data by income group are collected at the district level.
Published by the BBS at regular intervals of five years. There is a plan to conduct the survey every three years.
Labour Force Survey (LFS)
2010 (11th round)
1980 2013 One of the locally funded national surveys of the BBS. The LFS provides information on the labour force and employment situation.
Published by the BBS at regular intervals of three years. An annual publication is currently being planned.
Bangladesh Demographic and Health Survey (BDHS)
2011 (6th round)
1993–94 2014 National survey conducted by Mitra Associates (a private consultancy) in association with NIPORT under the Ministry of Health and Family Welfare as part of a global survey. The 2011 BDHS had 18,000 nationally representative sampling households chosen from the 2011 population census sampling frame. The private sector is involved in data collection and responsible for data mining.
Published by NIPORT at a regular interval of three years.
Multiple Indicator Cluster Survey (MICS)
2012–13 (11th round)
1993 Not declared
Survey conducted by the BBS. The preliminary findings of the 2013 MICS were published recently. The survey receives financial assistance from the UN Children’s Foundation.
Published by the BBS at a regular interval of three years.
Sample Vital Registration System (SVRS)
2013 1980 2014 One of the oldest annual surveys conducted by the BBS. The survey provides estimated updates of population census data.
Published by the BBS at a regular interval of one year.
Annual Primary School Census
2012 (7th round)
2006 2013 An annual publication of the Directorate of Primary Education under the Primary Education Development Programme, the largest education sector development programme. The Ministry of Primary and Mass Education conducts different surveys under the programme throughout the year and compiles information in this publication.
Published by the Ministry of Primary and Mass Education at a regular interval of one year.

48
Figure 4 shows the distribution of data for global indicators and indicators selected for the Bangladesh
case study by national data producer.28 As expected, the BBS is the leading data producer,
generating about 40 percent of all available data for the candidate indicators. NIPORT contributes as
the core national source for health sector data, while the Ministry of Finance is responsible for many
of the global partnership data. These two entities produce 16 percent of available data for global
indicators and 24 percent of available data for national indicators. The combined efforts of the
Bangladesh Bureau of Educational Information and Statistics (BANBEIS) and Directorate of Primary
Education produce data for education sector indicators. The other leading data producers in
Bangladesh are the Ministry of Law, Justice and Parliamentary Affairs, Ministry of Environment and
Forests and Department of Disaster Management of the Ministry of Disaster Management and
Relief.29
Figure 4. Distribution of data for global and national indicators by national data producer
Global indicators National and global indicators
Note: “DPE” refers to Directorate of Primary Education, “MoEF” refers to Ministry of Environment and Forests, “DDM” refers to
Department of Disaster Management, “MoF” refers to Ministry of Finance, “MoLJP” refers to Ministry of Law, Justice and
Parliamentary Affairs, and “Others” include the Anti Corruption Commission, Bangladesh Bank, Bangladesh
Telecommunication Regulatory Commission, Bangladesh Telecommunications Company Limited, Bangladesh Power
Development Board, Information Commission, Institute of Public Health Nutrition, Local Government Division of the Ministry of
Local Government, Rural Development and Co-operatives, Ministry of Commerce, Ministry of Home Affairs, Ministry of Health
and Family Welfare, Ministry of Information, National Identity Wing of the Election Commission, and Transparency International
Bangladesh.
Among international data producers, the World Bank is the lead producer of data that are relevant to
Bangladesh (see Figure 5). The World Bank alone provides about 60 percent of data for the candidate
global indicators for which international data sources are available. As regards national-level
indicators, data for a larger share of indicators were available from the UN and other international
sources.
28 For this analysis, only indicators for which data are currently available have been considered. 29 For details, see Annex 7.

49
Figure 5. Distribution of data for global and national indicators by international data producer
Global indicators National and global indicators
Note: “Others” include Basel Anti-Money Laundering Index, Helen Keller International and World Justice Project Rule of Law
Index.
Potential Data Producers and Sources for Needed Data
This study has also identified some data producers and sources that could generate data for
candidate global and national indicators that are currently not available or not readily available. It
appears that the BBS may need to take significant responsibility for producing needed data for the
indicators of interest. Not many new surveys or additional modules would be required to produce the
data and the BBS could generate such information with minimal additional efforts and recognise the
data as official. The BBS-conducted surveys (e.g., HIES, LFS, SVRS, MICS) and information
managed by relevant government entities could meet the additional data requirements. Table 15
provides a list of data producers and sources that may address existing data gaps in each goal area.

50
Table 15. Data producers and sources that could generate needed data
Goal area Potential data producer or source New survey/additional module
required
1. End poverty
BBS (HIES, Child and Mother Nutrition
Survey), Institute of Public Health Nutrition,
Helen Keller International
Not required
2. Ensure quality education for all
Ministry of Finance Not required
3. Create jobs, sustainable livelihoods and inclusive growth for all
BBS (LFS, HIES, MICS) BBS (LFS)
4. Ensure sustainable energy and develop infrastructure for all
Bangladesh Telecommunications
Company Limited, Bangladesh Power
Development Board, BBS
BBS, Bangladesh Power
Development Board
5. Establish a sustainable, healthy and resilient environment for all
Department of Disaster Management of
the Ministry of Disaster Management and
Relief, National Board of Revenue of the
Ministry of Finance, Ministry of Finance,
Ministry of Information
Department of Fisheries of the
Ministry of Fisheries and Livestock,
Department of Environment of the
Ministry of Environment and
Forests
6. Establish open, accountable, inclusive and effective institutions, rule of law and a peaceful and
inclusive society
Anti Corruption Commission, BBS,
Information Commission, Local
Government Division of the Ministry of
Local Development, Rural Development
and Co-operatives, National Identity Wing
of the Election Commission, Ministry of
Law, Justice and Parliamentary Affairs,
Transparency International Bangladesh,
World Justice Project Rule of Law Index
BBS, Ministry of Law, Justice and
Parliamentary Affairs, Local
Government Division of the
Ministry of Local Development,
Rural Development and Co-
operatives, Election Commission,
Ministry of Home Affairs,
Transparency International
Bangladesh, National Board of
Revenue of the Ministry of Finance
7. Establish a global partnership for sustainable development
Bangladesh Bank, Export Promotion
Bureau of the Ministry of Commerce,
Economic Relations Division of the Ministry
of Finance, Ministry of Road Transport and
Bridges, Ministry of Home Affairs, Ministry
of Law, Justice and Parliamentary Affairs,
OECD, UN Conference on Trade and
Development, World Trade Organization
Not required
8. Ensure primary health services for all
Not needed Not required
In addition to the BBS, different entities under the Ministry of Finance could emerge as important
sources of new data, particularly for indicators concerning the goal area on global partnership.
International data producers could contribute by generating data in the same area. Notably,
governance-related data can be produced from a variety of public and private sources.
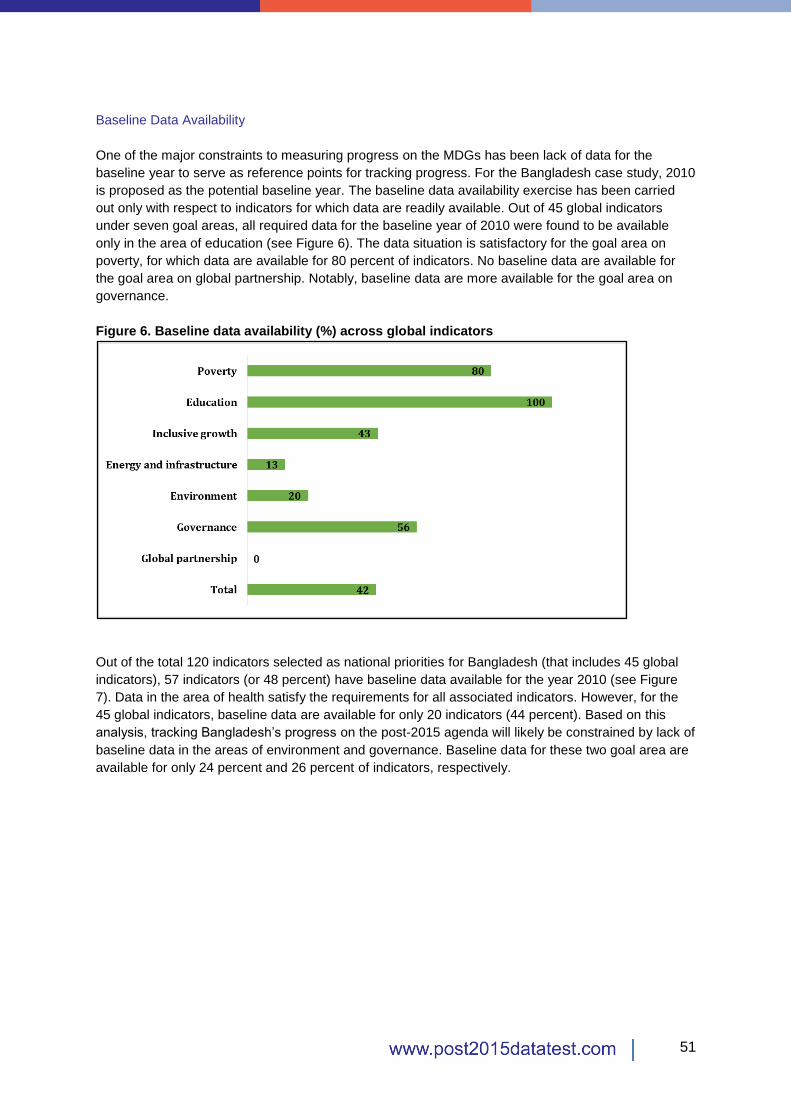
51
Baseline Data Availability
One of the major constraints to measuring progress on the MDGs has been lack of data for the
baseline year to serve as reference points for tracking progress. For the Bangladesh case study, 2010
is proposed as the potential baseline year. The baseline data availability exercise has been carried
out only with respect to indicators for which data are readily available. Out of 45 global indicators
under seven goal areas, all required data for the baseline year of 2010 were found to be available
only in the area of education (see Figure 6). The data situation is satisfactory for the goal area on
poverty, for which data are available for 80 percent of indicators. No baseline data are available for
the goal area on global partnership. Notably, baseline data are more available for the goal area on
governance.
Figure 6. Baseline data availability (%) across global indicators
Out of the total 120 indicators selected as national priorities for Bangladesh (that includes 45 global
indicators), 57 indicators (or 48 percent) have baseline data available for the year 2010 (see Figure
7). Data in the area of health satisfy the requirements for all associated indicators. However, for the
45 global indicators, baseline data are available for only 20 indicators (44 percent). Based on this
analysis, tracking Bangladesh’s progress on the post-2015 agenda will likely be constrained by lack of
baseline data in the areas of environment and governance. Baseline data for these two goal area are
available for only 24 percent and 26 percent of indicators, respectively.

52
Figure 7. Baseline data availability (%) across national indicators
If only the 68 indicators (out of the 120 indicators examined in the Bangladesh case study) for which
data were found to be readily available are considered, baseline data are readily available for 57
indicators (85 percent) (see Figure 8). Indeed, except for the goal area on environment, baseline data
availability is satisfactory.
Figure 8. Baseline data availability (%) across indicators for which data are readily available
Meanwhile, out of the 63 indicators for which baseline data are not readily available, baseline data
can be estimated in the case of 12 indicators (19 percent) from existing information (see Figure 9).
Thus, adding this total with total number of indicators for which data are readily available, baseline
data in Bangladesh will be available for approximately 58 percent of 120 candidate indicators.

53
Figure 9. Indicators for which baseline data are not readily available but which could be
estimated
Data Quality
A data quality assessment framework used by all research teams under the Post-2015 Data Test is
available in Annex 8 (see also Bhattacharya, Higgins and Kindornay 2014). It builds on four global
and regional quality assurance frameworks: the Generic National Quality Assurance Framework
Template, European Statistics Code of Practice, International Monetary Fund’s Data Quality
Assessment Framework and Code of Good Practice in Statistics for Latin America and the Caribbean.
The five principal criteria for examining data quality are (i) relevance, (ii) accuracy and reliability, (iii)
timeliness and punctuality, (iv) accessibility and clarity, and (v) coherence and comparability.
The Bangladesh research team applied the data quality assessment framework to the 45 global
indicators. Table 16 shows scoring for each criterion for the seven goal areas. The assessment was
conducted on a scale from 1 to 5, with 1 indicating that a goal area does not meet any of the criteria
set for the sub-components of quality assessment30 and 5 indicating that the goal area meets all of the
criteria sub-components. Any number between 1 and 5 indicates an intermediate scenario to varying
degrees. Numbers in parentheses denote the total number of sub-components for each criterion on
the basis of which they were scored.
30 The list of sub-components is found in Annex 8.
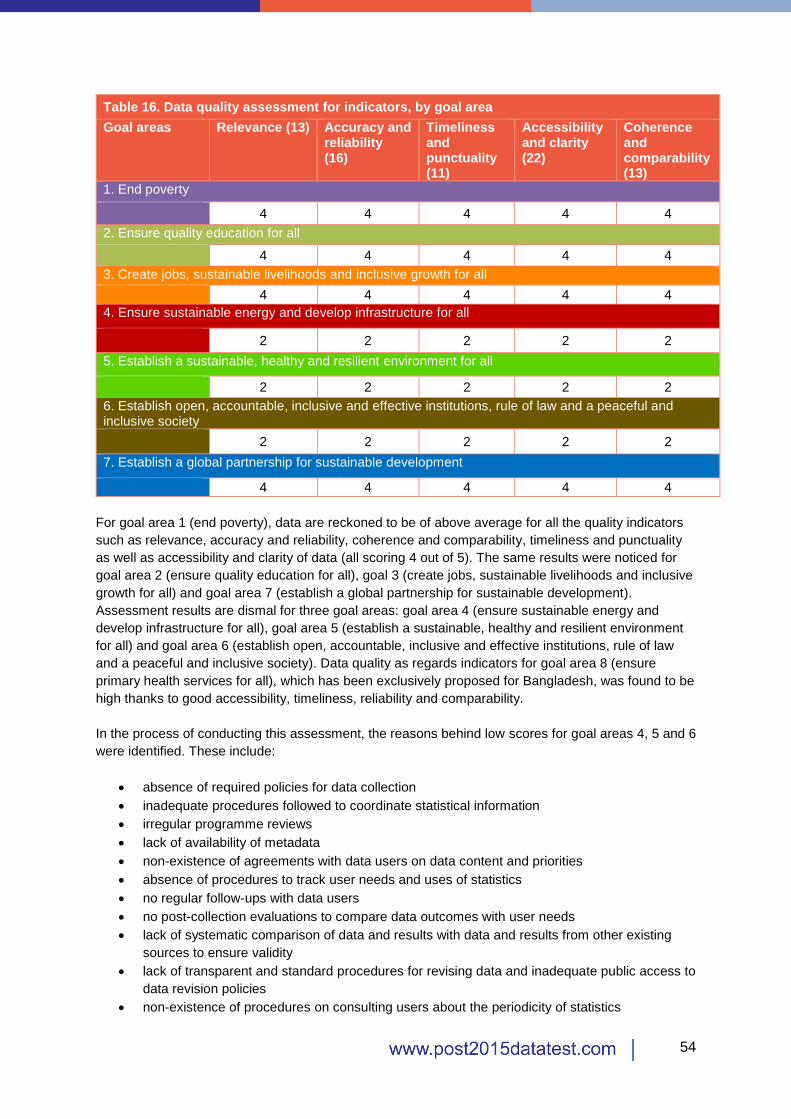
54
Table 16. Data quality assessment for indicators, by goal area
Goal areas Relevance (13) Accuracy and reliability (16)
Timeliness and punctuality (11)
Accessibility and clarity (22)
Coherence and comparability (13)
1. End poverty
4 4 4 4 4
2. Ensure quality education for all
4 4 4 4 4
3. Create jobs, sustainable livelihoods and inclusive growth for all
4 4 4 4 4
4. Ensure sustainable energy and develop infrastructure for all
2 2 2 2 2
5. Establish a sustainable, healthy and resilient environment for all
2 2 2 2 2
6. Establish open, accountable, inclusive and effective institutions, rule of law and a peaceful and inclusive society
2 2 2 2 2
7. Establish a global partnership for sustainable development
4 4 4 4 4
For goal area 1 (end poverty), data are reckoned to be of above average for all the quality indicators
such as relevance, accuracy and reliability, coherence and comparability, timeliness and punctuality
as well as accessibility and clarity of data (all scoring 4 out of 5). The same results were noticed for
goal area 2 (ensure quality education for all), goal 3 (create jobs, sustainable livelihoods and inclusive
growth for all) and goal area 7 (establish a global partnership for sustainable development).
Assessment results are dismal for three goal areas: goal area 4 (ensure sustainable energy and
develop infrastructure for all), goal area 5 (establish a sustainable, healthy and resilient environment
for all) and goal area 6 (establish open, accountable, inclusive and effective institutions, rule of law
and a peaceful and inclusive society). Data quality as regards indicators for goal area 8 (ensure
primary health services for all), which has been exclusively proposed for Bangladesh, was found to be
high thanks to good accessibility, timeliness, reliability and comparability.
In the process of conducting this assessment, the reasons behind low scores for goal areas 4, 5 and 6
were identified. These include:
absence of required policies for data collection
inadequate procedures followed to coordinate statistical information
irregular programme reviews
lack of availability of metadata
non-existence of agreements with data users on data content and priorities
absence of procedures to track user needs and uses of statistics
no regular follow-ups with data users
no post-collection evaluations to compare data outcomes with user needs
lack of systematic comparison of data and results with data and results from other existing
sources to ensure validity
lack of transparent and standard procedures for revising data and inadequate public access to
data revision policies
non-existence of procedures on consulting users about the periodicity of statistics

55
lack of data dissemination strategy and policy, including clear pricing policy governing data
dissemination
lack of easily navigable website that allows users to access data and metadata and facilitates
self-tabulation in a variety of formats
inadequate procedure to address deficits in order to align with international standards,
guidelines or good practices
no clear explanations and reconciliation provided to improve understanding and appreciation
of methodological changes or differences
no explanations provided for deviations from international and national standards
This assessment led to the consideration of a few key issues going forward. In certain areas, such as
making metadata available and making data available online and in other soft formats such as CD
and DVD, improvements can be made with few financial and human resources. Adequate investment
will be needed to strengthen the national statistical system in a sustainable manner over the medium
to long term. This should be done by giving special priority to areas in which data adequacy is a major
concern, such as environment, energy, governance and global partnership. Investment will be
required to make more effective use of ICT to improve the quality (accuracy, reliability, comparability)
of published statistics and increase data efficiency by reducing costs and the time taken to complete
tasks.
Feasibility of Global Minimum Targets
The post-2015 agenda is expected to set more ambitious targets than the MDGs. Seven candidate
“global minimum” targets were selected under the Post-2015 Data Test to be assessed across all
countries. Each country will be expected to meet global minimum standards by 2030, while the
international community must commit to do everything possible to help each country reach threshold
levels. These are:
End extreme income poverty
Ensure all children have access to early childhood and quality primary and secondary
education
Ensure full access to developed infrastructure and communication technology
Provide free and universal legal identity, such as birth registrations
Ensure equal pay for equal work
Publish and use economic, social and environmental accounts in all governments and
companies
Create an enabling environment for sustainable development
To examine the feasibility of these targets, a forecasting exercise was undertaken according to the
Methodology and Implementation Guide for the Post-2015 Data Test (see Bhattacharya, Higgins and
Kindornay 2014). It was assumed that progress on these indicators has been linear over a long period
of time (from 1990–91 to the latest year for which data are available) and there will be no acceleration
of progress. Progress on the aforementioned seven targets, representing the seven goal areas
considered by the Post-2015 Data Test, is measured by fifteen indicators. In the case of Bangladesh,
data for only six indicators are available for four targets. Table 17 presents the summary results of the
exercise. The assessment suggests that two of the examined targets – ensure all children have
access to early childhood and quality primary and secondary education and provide free and universal
legal identity, such as birth registrations – may be considered feasible global minimum targets in
Bangladesh’s context. The attainment of two other targets – end extreme income poverty and ensure
full access to developed infrastructure and communication technology – is likely not feasible.
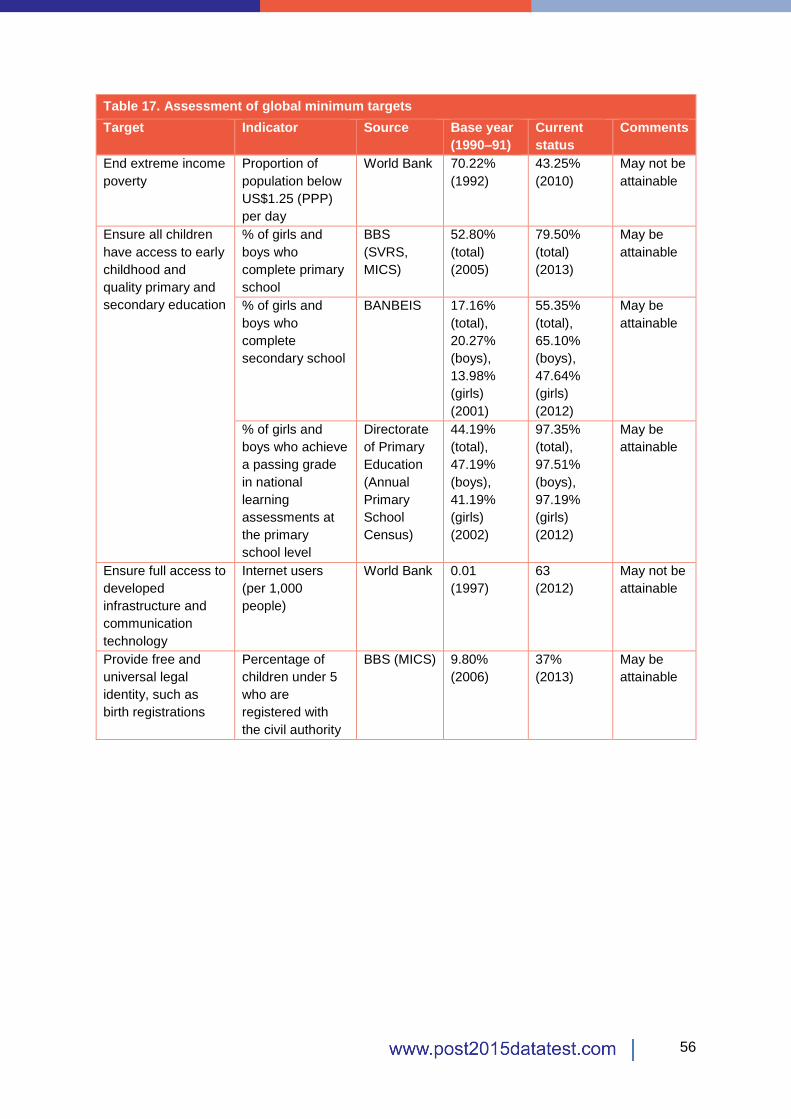
56
Table 17. Assessment of global minimum targets
Target Indicator Source Base year
(1990–91)
Current
status
Comments
End extreme income
poverty
Proportion of
population below
US$1.25 (PPP)
per day
World Bank 70.22%
(1992)
43.25%
(2010)
May not be
attainable
Ensure all children
have access to early
childhood and
quality primary and
secondary education
% of girls and
boys who
complete primary
school
BBS
(SVRS,
MICS)
52.80%
(total)
(2005)
79.50%
(total)
(2013)
May be
attainable
% of girls and
boys who
complete
secondary school
BANBEIS 17.16%
(total),
20.27%
(boys),
13.98%
(girls)
(2001)
55.35%
(total),
65.10%
(boys),
47.64%
(girls)
(2012)
May be
attainable
% of girls and
boys who achieve
a passing grade
in national
learning
assessments at
the primary
school level
Directorate
of Primary
Education
(Annual
Primary
School
Census)
44.19%
(total),
47.19%
(boys),
41.19%
(girls)
(2002)
97.35%
(total),
97.51%
(boys),
97.19%
(girls)
(2012)
May be
attainable
Ensure full access to
developed
infrastructure and
communication
technology
Internet users
(per 1,000
people)
World Bank 0.01
(1997)
63
(2012)
May not be
attainable
Provide free and
universal legal
identity, such as
birth registrations
Percentage of
children under 5
who are
registered with
the civil authority
BBS (MICS) 9.80%
(2006)
37%
(2013)
May be
attainable

57
The candidate targets and indicators for which data are not available are presented in Table 18.
Table 18. List of global minimum targets and indicators for which data are not available
Target Indicator Comments
Ensure equal pay for equal
work
Mean nominal monthly earnings of
employees (local currency)
Data not readily
available
Ensure full access to
developed infrastructure and
communication technology
% of the population with access to an all-
season road
Data not available
% of adults with an account at a formal
financial institution
Data not readily
available
# of hours per day households have
access to electricity on average
Data not available
Share of the population with access to
modern cooking solutions (%)
Data not available
Provide free and universal
legal identity, such as birth
registrations
Proportion of adults with a basic legal
identity document
Data not available
Publish and use economic,
social and environmental
accounts in all governments
and companies
Share of large tax unit taxpayers using
integrated reporting
Data not available
Existence of national and sub-national
government publishing according to the
System of Environmental-Economic
Accounting
Data not available
Create an enabling
environment for sustainable
development
Existence of laws for ensuring country-by-
country reporting by multinational
corporations, disclosure of beneficial
ownership and preventing money
laundering
Data not available
58
Political Economy of the Data Revolution
Understanding Drivers of Data Gaps and Improvements
Political Barriers
The entities involved in generating data and statistics in Bangladesh face various political and
administrative barriers that reduce their reliability, efficiency and effectiveness. As is the case in many
other LDCs, government entities in Bangladesh are generally constrained by budget, volatility in
budgetary allocations and lack of autonomy. These factors leave them vulnerable in the face of
pressure from political and other interest groups. Generally, areas of concern include inadequate
documentation of methods, weak infrastructure, inadequate human resources, problems related to
data dissemination including the duplication of efforts, inadequate metadata and poor data
accessibility, management problems, limited training capacity, poor ICT infrastructure and inadequate
coordination. The effectiveness of NSOs in particular is constrained by outdated and inadequate
legislation, lack of a strong legal mandate (which often curbs independence), lack of awareness of the
importance of statistics among policy-makers, lack of cooperation between the producers and users of
data, negligence in following modern and scientific methods in data collection, and the non-adoption
of international guidelines related to classification, definitions and statistical standards, which results
in the production of data that are not comparable to those of other countries.
In addition, the absence of dedicated statistical offices under different government ministries, project-
based surveys rather than regular user needs–based surveys and a lack of open access to data are
obstacles to the data revolution in Bangladesh. Even the most accurate data are of only limited use if
they are not available to governments, policy-makers, researchers, CSOs and others in a usable
format. In Bangladesh, it has been observed that the BBS and other government entities have been
hesitant to publish their data. They either lack the capacity to publish and manage data according to
international best practices or do not understand the needs of data users and dissemination methods.
Maintaining confidentiality and avoiding the misuse of data are two other commonly cited reasons in
this context. Such predicaments are critical because more open data are required to inform and/or
improve policies and hold governments and development partners accountable.
Changes to Current Data Collection Practices
As mentioned, the BBS is the key entity vested with the responsibility of collecting major statistical
data in Bangladesh. It collects data following the Statistical Act of 2013 and generally follows
adequate statistical procedures during data collection processes. It conducts large-scale surveys such
as the HIES every five years, the LFS and MICS every three years and the Population Census every
10 years. Data are not updated during interim periods. In view of this, the General Economics Division
of the Planning Commission recently put forward a proposal to the BBS to shorten the intervals
between survey periods and/or use proxy estimation to enable the updating of data on a continuing
basis.
Besides major surveys conducted by the BBS, a large part of survey data are collected by
government entities in the process of complying with project requirements. Certain entities have their
own statistical departments that collect data following their own methodologies and with their own
resources. For example, in the case of the Annual Primary School Census of the Directorate of
Primary Education, the data collection process follows adequate statistical procedures, using
structured questionnaires and applying the Education Management Information System code of the
Information Management Division of the Directorate of Primary Education. Data collectors (mainly
headmasters of every school) are trained and well-educated on the data that they are collecting. This

59
is not the case for many other data producers. Moreover, there is a lack of coordination among data
collectors – they generally do not follow an integrated methodology for data collection. This constrains
horizontal (among entities in a similar area), vertical (inter-temporal) and cross-country comparability.
To address these issues and develop an integrated strategy, the Partnership in Statistics for
Development in the 21st Century (widely known as PARIS21) developed the concept of the NSDS in
2004. In line with this, the High-Level Panel proposed the data revolution to promote open
accessibility of data and ensure increased support for statistical systems. In this context, a number of
concerns persist in Bangladesh: promoting statistical literacy, strengthening relations with the media,
ensuring strong and sustained political support and keeping the commitment of the national statistical
system to meet international standards and follow results-based monitoring principles (BBS 2013). As
noted above, Bangladesh recently prepared its NSDS, keeping focus on the needs of users of official
statistics, promoting more effective information dissemination and strengthening statistical services to
meet the needs of a rapidly developing nation. In effect, the aim is to ensure that the national
statistical system provides comprehensive and coherent statistical figures while making efficient and
effective use of public resources.
In order to avoid duplication of data and ensure the optimal use of public resources, various strategic
actions to be implemented by 2023 were proposed under the NSDS. It is expected that these
strategies will set standards related to openness and accessibility, confidentiality, sound methods of
data collection, assured quality, integrity, impartiality and objectivity, and meeting user needs (BBS
2013). The key strategic actions include:
Developing a common code of practice for all data producers in line with the Fundamental
Principles of Official Statistics.
Establishing statistical cells in 18 government ministries/agencies during the implementation
period of the NSDS. This process should gradually be replicated in other ministries/agencies
that are currently out of the scope of the NSDS but significant in terms of data production.
Statisticians will be posted/placed at existing planning and statistical wings/branches/cells.
Providing necessary guidance and support to other entities during their data collection periods
in terms of concepts, definitions and methodologies according to the Statistical Act of 2013.
Enhancing the application of technology during data collection.
If these strategic actions are fully implemented, they will bring about significant changes in data
collection practices. The implementation of the NSDS remains a major challenge due to the lack of
adequately qualified and skilled human resources. Indeed, a number of proposed actions have
already missed their respective deadlines. Moreover, potential data producers that are expected to be
involved in measuring Bangladesh’s progress on the post-2015 agenda have not been included in the
strategic plan. It is thus important that the NSDS is revised according to the emerging demands for an
inclusive data revolution following the finalisation of the post-2015 agenda.
Validation of Unofficial Data
The private sector and CSOs have been getting increasingly involved in data generation. Their
unofficial data could serve to inform on the progress made on national and global fronts. The
advancement of technology, developments in marketing and the growth of social media in
Bangladesh offer opportunities to increase the use of private data in national and global contexts. Still,
whether or not data generated by the private sector can be integrated with national data is something
that needs to be addressed.
Progress on governance-related targets, which are often abstract or intangible in nature, could be
measured using available national and international private sector data. In Bangladesh, many private

60
data producers produce statistics using their own statistical methodologies. In most cases,
irrespective of academia or industry, rigorous methodologies are not followed. The sample sizes of
surveys are generally small, which reduces representativeness, and the quality of data is often
compromised. Hence, there is a need to develop public-private partnership to address data gaps. A
good example of such partnership that could serve as a reference point is the public-private
partnership that produces the BDHS.31 Data from the BDHS are frequently used by policy-makers and
researchers to monitor health indicators.
A coherent approach to the validation of unofficial data is currently required. In connection with this,
stakeholders in Bangladesh have recognised the need for better coordination between government
and non-government actors in ensuring the soundness of data collection methodologies and reliability
of statistics. The Statistical Act of 2013 is the guideline for national data producers and the private
sector with respect to data validation. But neither the BBS nor private data producers have taken the
required initial steps in the validation procedure, which has restricted the use of private sector data.
The BBS needs to play a more proactive role in this respect by working closely with private data
producers.
Resources
Data producers need to ensure that the resources determining their capacity are used effectively.
Capacity is often constrained by financial and human resources. In recent years, thanks to the GoB’s
own resource allocation and support from development partners, the BBS has been receiving more
financial resources to conduct surveys and build needed capacity. In general, public resources are
limited in Bangladesh and consequently the selection and prioritisation of which data are to be
generated is an issue. The Medium-Term Budgetary Framework and Annual Development Program
have been the leading financial resource channels for achieving the MDGs (BBS 2013). Data
producers are currently facing considerable challenges in the production of demand-driven data and
implementation of statistical programmes due to the shortage of skilled human resources, not to
mention the inadequate allocation of financial resources.
Improvement in the quality of statistics will depend significantly on the enhancement of the skills,
competency, effectiveness and productivity of data producers’ workforces. All data producers – the
BBS in particular – will face a number of challenges with regard to monitoring the post-2015 agenda.
A major challenge is the recruitment and retention of skilled, experienced workers. In Bangladesh, the
number of workers with good quantitative skills remains inadequate, which is likely to be the case for
the foreseeable future in the absence of dedicated efforts to upgrade skills. It will thus be important to
ensure effective use of the available pool of skilled statisticians and that there is a system in place to
incentivise human resources, skills upgradation and regular training. In this respect, the NSDS
recommended the following actions to ensure the best use of available resources:
Ensure accurate and timely data collection and increase the application of technology.
Enumerators (two in each union32) can be provided with tablet computers, which could be used
for surveys and censuses and would make data collection more cost-effective.
Form a voluntary working group at the union level that includes students from schools who can
maintain coordination with the BBS regarding statistical information and services.
Provide better training and coordinate the planning of field work to ensure the effective use of
human resources.
Replace face-to-face interviews with electronic methods (e.g., employing the internet to conduct
enterprise-based surveys).
31 As mentioned, Mitra Associates is a leading private consultancy in Bangladesh that has been conducting the BDHS in association with NIPORT under the Ministry of Health and Family Welfare since the 1990s. 32 A union is the smallest rural administrative local government unit in Bangladesh.

61
These recommendations are important for raising the capacity of statistical offices at the local level.
However, a target-oriented action plan needs to be established to implement them. Targeted efforts
should be undertaken to recruit qualified and capable workers to meet growing demands for data.
Currently, there is no comprehensive strategy to address data producers’ challenges relating to
human resources management. A comprehensive human resource policy framework should be
established to ensure the availability of qualified workers with adequate opportunities for professional
training, improved salaries and timely promotion.
Role of Technology
A modern statistical system requires strong ICT infrastructure. The state of such infrastructure can
significantly impact data quality. Unfortunately, the ICT infrastructure available to the BBS and other
data producers in Bangladesh is not up to the expected level due to resource constraints and the
shortage of technical knowledge. Although the BBS’s head office is equipped with modern technology
including computers, statistical software and geographic information systems, field offices – both
regional and upazilla statistical offices – are lagging far behind. This problem was pointed out
repeatedly during the consultation process for the NSDS. On a positive note, as mentioned, the BBS
recently signed formal data exchange protocols with local, regional and international organisations,
maintains geographic information systems and promotes use of modern technology through its use of
digital mapping (BBS 2013). However, significant investment is required to improve data production,
data processing and the publishing of outputs. With well-directed efforts, tangible improvements are
possible at all stages of the statistical process – from the management of data collection in the field to
data capture, storage, processing, analysis, dissemination, documentation and archiving. Efforts
should include developing strong ICT infrastructure at national and regional levels. Key strategic
actions have been identified under the current strategy of enhancing the GoB’s data generation
capacity. The actions concern software, infrastructure and human resource development:
Facilitating the efficiency of the GoB by establishing a National Data Resource Centre.
Promoting interaction among government entities, districts and upazillas through the
development of secure and strong ICT infrastructure.
Developing Automated Data Capturing Templates for all surveys and censuses in user-friendly
formats to collect data in a timely and cost-effective manner.
Acquiring high-performance servers for the BBS’s head office and upazilla, district and division
offices to improve data processing and storage.
Building an automated data management system.
Establishing a cloud computing system (the integration of many servers) to support work on
many computers at the same time using the same software – Microsoft Excel, Stata, Statistical
Package for the Social Sciences, etc.
Gradually developing paperless mechanisms.
It is indeed important to implement these actions on an urgent basis. However, much will depend on
the institutional capacity of the implementing entities.

62
Data Availability–Transparency–Accountability Nexus
Funders of Data Collection
Besides the GoB, a number of development partners (e.g., the Asian Development Bank, United
Kingdom’s Department for International Development, European Union, Japan International
Cooperation Agency, UN Population Fund, UN Children’s Fund and World Bank) have been providing
financial assistance to Bangladesh to conduct key surveys and censuses in the country. Funders
routinely allocate funds for micro survey field work and impact evaluations. However, instead of
paying salaries, they are keen to finance per diems, computers and field work for specific surveys.
Data producers in LDCs such as Bangladesh are often kept busy chasing donor-funded per diems via
workshop attendance, training, survey field work and project proposal development, which can
enhance workers’ take-home pay. As a result, the development of institutions and statistical systems
remains weak. There is evidently a lack of incentives to improve national statistical capacity or
prioritise national data building blocks, leaving vital data uncollected for years (Glassman 2014).
The size, scope and frequency of data collection activities are affected by trade-offs due to the
differential needs of governments and funders of data collection. This leads to three choices: (i) small
sample, technically sophisticated, possibly multi-sector surveys or either large sample surveys or
administrative data sets that provide regional or district-level statistics, (ii) infrequent surveys designed
to facilitate sophisticated research or surveys with relatively fewer key indicators conducted with
higher frequency, and (iii) surveys designed for comparisons with other countries or surveys designed
for comparison across time within a single country (Sandefur and Glassman 2014).
In many cases, international funders are bound by their mandates to work exclusively with national
governments as their clients, which shapes their demands. In connection with this, there may be
spillover impacts that are relevant for Bangladesh. Sometimes funders prefer statistics based on
standardised methodologies and questionnaire formats because of their concern with international
comparability (Sandefur and Glassman 2014). More often than not, this concern is at odds with
comparison of statistics over time within a single country. The key implication of funders’ concern with
international comparability is that they are relatively less concerned with sub-national comparisons
within a country, which is reflected in the choice of indicators in surveys such as the BDHS and MICS.
Moreover, funders have an interest in particular statistical products given their higher analytical
capacity and technical expertise. Their human resources allow them to track and analyse a wide
range of quantitative indicators and sub-components. Thus, they generally demand detailed data from
surveys and prefer questionnaires that are lengthy and comprehensive rather than short and quick.
This demand presents a direct budgetary trade-off between depth in topic coverage and breadth of
sample coverage (Sandefur and Glassman 2014). Extended surveys with smaller samples that track a
wide range of indicators at the national level tend to be favoured over large sample surveys that might
provide disaggregated data at the regional or district levels. Surveys on household income and
expenditure, health, employment and other key indicators are typically undertaken every several
years, often with considerable lags between data collection and the publication of statistics.
Funders will need to support and interact with national statistical systems differently if the quality of
needed data is to be significantly improved. They should put more emphasis on prioritising core
statistical products and supporting NSOs in ways that empower them institutionally and enable them
to recruit and retain qualified workers. Such recommendations do not indicate that special surveys
and evaluations should be abandoned, but rather aim to ensure that core statistical products are not
forgotten in the statistical process.
63
Availability and Accessibility of Officially Produced Data
As mentioned, overall data availability across candidate post-2015 indicators is very satisfactory in
Bangladesh. Core data producers such as the BBS, BANBEIS and administrative bodies like the
Directorate of Primary Education publish reports on an annual basis. Thus, the availability of data on
household income and expenditure, education and health indicators is satisfactory. To analyse other
concerns of developmental importance, adequate data for a significant proportion of indicators are not
readily available in a user-friendly format. Moreover, data should be made available at disaggregated
levels for many indicators. Notably, data on governance are the most lacking. The BBS’s lack of
capacity to collect adequate governance-related data is an enduring problem. At the same time, it
should be recognised that the generation of such data is not easy in the context of Bangladesh.
Furthermore, a large proportion of officially produced data in the country is not comparable with
international data and statistics. The BBS needs to assume the core responsibility for producing
official national statistics that will be needed to monitor progress on the post-2015 agenda. As the
country’s main data producer, the BBS needs to also take responsibility for coordinating with entities
such as BANBEIS, the Bangladesh Bank, the Export Promotion Bureau of the Ministry of Commerce,
NIPORT and others to produce high-quality, comparable data.
Data need to be accessible and usable by all stakeholders to monitor post-2015 progress. The full
range of metadata – concepts, definitions, classifications, methodologies, data sources, accuracy and
so on – need to be properly documented and made accessible. In some cases, the data accessibility
situation in Bangladesh leaves much to be desired. Academics, researchers and students often find it
difficult to access data due to different administrative bottlenecks and encounter difficulties when
contacting the responsible authorities to access data. Government entities generally do not have
appropriate data dissemination policies. Thus, stakeholders cannot get a clear idea about the
availability of certain datasets. In addition, there is no coherent strategy for releasing data, metadata
and microdata, with electronic dissemination of data being very poor. The BBS aside, most national
data producers do not have navigable websites that allow users to access data and metadata and
facilitate self-tabulation in a variety of user-friendly formats. Notably, no periodic consultations take
place between the producers and users of data to ensure whether dissemination formats satisfy user
needs.
It should be recognised that a number of initiatives have been recently put in place to improve data on
a number of dimensions. These include:
The Statistical Act of 2013.
The NSDS for Bangladesh for the 2013–23 period.
ICT Training and Research Centres with labs are being established in all upazillas.
Geographic information systems are being used more frequently.
The proposal to establish statistical cells in 18 ministries in two phases (see BBS 2013). The
major shortcoming of this proposal is that the Ministry of Home Affairs and Ministry of Law,
Justice and Parliamentary Affairs, which are potential sources for governance-related data,
were not included among these 18 ministries.
Research and development wings are being established within government entities to follow up
on and evaluate the various statistical processes and sub-processes.
A data quality assurance framework was to be developed by 2014 following the Generic
National Quality Assurance Framework Template and the national statistical system is to be
assessed against this framework every three years.
A common code of practice to be followed by all data producers is to be developed and legally
enforced.
The National Population Register is expected to be implemented in 2016.

64
A database on the poor segments of the population and social safety net coverage is to be
established by 2017.
The coverage of the BBS’s offices at the district and upazilla levels is to be increased.
If fully implemented, these initiatives are expected to be useful, but more efforts will be required to
meet emerging needs. The BBS is planning to provide on-site microdata access to interested
researchers, which is a positive step. Taking into consideration development partners’
recommendations, Annual Primary School Census data will be regularly updated on the Directorate of
Primary Education website to improve data accessibility. There is a need to capitalise on these
initiatives and continue such efforts with an aim to cater to stakeholders’ expectations for the data
revolution.
Expectations of Different Stakeholders for the Data Revolution
Stakeholder groups have their own understandings, expectations, agendas and roles as regards the
data revolution. Stakeholders cited common expectations during the Bangladesh inception and
validation workshops and KIIs.
Data Producers
Data producers’ common expectations revolve around four issues. First, many useful data can be
collected from a single survey if the design of the survey is appropriate and the survey is
comprehensive. Second, given that private sector entities collect diverse data that are not
disseminated, there is a need to develop public-private partnership to improve private data
dissemination. Third, the use of modern technology (such as mobile phones, personal digital
assistants, etc.) among trained surveyors should be promoted. And fourth, maintaining confidentiality
of certain types of data, such as those on HIV/AIDS, is important.
Policy-Makers
Policy-makers mentioned a number of needed actions to improve data availability. First, the selection
of post-2015 indicators should be prudent so that relevant numbers are not very large and progress
can be easily tracked. Second, institutional capacity needs to be significantly increased for measuring
the new indicators. Third, funders – the GoB and development partners – should ensure the flow of
necessary finance to generate needed data. Fourth, the BBS should lead the process of the data
revolution in Bangladesh, while other stakeholders should cooperate and help with coordination. Fifth,
the time lags of major surveys such as the HIES and LFS should be reduced. Alternatively, initiatives
to generate proxy data and produce reliable intermediate estimates could be undertaken.
Development Partners
Development partners have four common expectations. First, data must enable users to discern
whether the poor and marginalised segments of the population are receiving essential services. This
means that data will need to be disaggregated by gender, geography, income, disabilities and other
categories to ensure that no one is left behind. Second, stronger monitoring and evaluation at all
levels and in all processes of statistical development – from planning to implementation – are needed.
This will help guide decision making, update priorities and ensure accountability. Such measures will
require substantial investment in capacity building. Third, a regularly updated registry of commitments
to ensure accountability and monitor delivery gaps is an idea that could be considered. Fourth, open
access to data should be ensured through the use of modern technology including websites and
geographic information systems.
65
Academics and the Research Community
Academics and the research community have different expectations for the data revolution. First, only
ensuring the availability of data is not enough – data need to be accessible, affordable and usable.
Second, data on associated variables in surveys should also be made available because to the ability
to explain trends in progress is key. Third, it is important to learn from the better performers and
promote best practices in the areas of data production, literacy, dissemination and openness. Fourth,
immediate steps are required to address the scarcity of data as regards soft issues such as
governance. Finally, data need to be delivered to users in a timely manner.

66
Conclusion
The Bangladesh country study presents an overall assessment of the existing statistical capacity of
Bangladesh in view of the emerging demands in the context of the post-2015 sustainable
development agendas. The study examines the data adequacy for measuring post-2015 progress,
and identifies key opportunities and challenges at the country level to improve availability, access,
timeliness and quality of data. Feasibility of selected set of candidate post-2015 targets have also
been examined and assessed.
The Bangladesh case study’s key findings are:
Bangladesh has seen gradual improvements in data production, dissemination and use with
regard to development issues over the last 10 years.
The global ambition towards a data revolution has begun to gain ground in Bangladesh.
Relevant stakeholders are becoming increasingly aware of emerging data demands.
Although data availability has improved in Bangladesh, data are currently not readily available
for a number of candidate indicators. For instance, needed statistics that are not currently
reported in Bangladesh can be estimated or calculated for 42 indicators (out of 120 candidate
indicators examined in this study) from existing administrative information and available
surveys. Data for several important indicators are unavailable at the level of disaggregation
needed.
The dearth of data will likely make it difficult to establish a baseline for measuring progress on
the post-2015 agenda in Bangladesh. Without baseline data it will be difficult for Bangladesh to
establish measurable post-2015 targets.
Available data in Bangladesh are of variable quality. They often suffer from a lack of accuracy
and reliability, timeliness and punctuality, accessibility and clarity, and coherence and
comparability. There is a need to improve overall data quality. This is particularly true for a
number of goal areas, including energy and infrastructure, environmental sustainability and
disaster resilience, governance, and global partnership for sustainable development.
Issues relating to the accessibility and affordability of data need to be urgently addressed. In
connection to this, the dissemination of disaggregated and unit-level data should be promoted
at a minimum cost. Promoting data dissemination digitally and in user-friendly formats (e.g.,
spreadsheets) and establishing interactive websites for data should be a priority.
Global minimum standards for a number of key areas, such as ending extreme poverty by
2030, will be difficult to attain in Bangladesh unless a host of measures are put in place. These
measures will require significant resource allocation.
Although certain efforts have sought to reform the statistical system in Bangladesh, they are
inadequate to meet the growing demands for more and better data. For example, Bangladesh
is currently implementing a National Strategy for the Development of Statistics for the 2013–23
period. Progress on data improvement activities has not been satisfactory because a number of
actions planned as part of the strategy have not been implemented within the stipulated
timeframe.

67
Expectations for the data revolution vary from stakeholder to stakeholder in Bangladesh.
Coordination and cooperation among stakeholders will need to be significantly improved to
align expectations. The demands for more frequent, timely, disaggregated, quality data from
policy-makers and non-governmental actors need to be recognised by data producers.
The potential roles of the private sector and modern technology in the data revolution in
Bangladesh have yet to be adequately appreciated. A big push is required for the advantages
of information and communication technologies to be recognised and leveraged.
Beyond these key findings, the study highlights data challenges for Bangladesh. These include:
weak infrastructure;
lack of human resources;
outdated and inadequate legislation;
insufficient financial resources;
inadequate documentation (e.g., metadata, survey methodology);
duplication of sources;
poor access to data producers;
poor coordination among data users, producers and other stakeholders;
inadequate commitment to quality data production from development partners;
lack of awareness about importance of statistics among policy designers and decision makers;
absence of data dissemination policy;
storage of data not being digitized;
lack of coherent approach towards validation of unofficial data; and
absence of transparency and quality control efforts.
Addressing this long list of challenges will not be easy for a country such as Bangladesh and these
challenges cannot be solved in a short span of time. There is a need to urgently design an agenda for
action to address these challenges. Such an agenda should be informed by key considerations about
data production, data availability and access, and capacity and coordination.
Data Production
There is a need to standardise and bring coherence to relevant concepts and definitions of variables
through consultations among major stakeholders. New surveys will be needed to generate data on
various important indicators. This is particularly true for indicators related to governance and
institutional strengthening. There is a need to consolidate existing surveys and data collection
procedures. In many cases, surveys should be conducted more frequently, which may require
increasing financial, technical, logistical resources and improving human resources. As demands for
disaggregated data (e.g., spatial, gender, age-group, ethnicity) grow, data producers should take the
necessary steps to address emerging needs by including disaggregated data on their agendas.
Concerted efforts need to be taken to enhance the quality of data generated through the use of
modern technology. While they are concerned with data related to measuring progress on the post-
2015 agenda, policy-makers are also interested in understanding the key factors that influence the
attainment of better results, so it will be necessary to generate data that not only monitor post-2015
development outcomes but also the variables that impact them.
Data Availability and Access
Data should be made available in a timely manner to facilitate real-time decision making. Raising
administrative efficacy and increasing the use of technology can contribute towards this. Ensuring
transparency in data production and access for data users should be a core dimension of the data

68
revolution in Bangladesh. In connection to this, the development of a data dissemination plan and
updated legislation are required.
Capacity and Coordination
Adequate funding for strengthening institutional capacity and undertaking new activities needs to be
ensured. Together with the Government of Bangladesh, development partners need to address this
issue upfront in their planning. Coordination among data producers and data users should be
strengthened to harness existing capacities in the private sector. Institutional capacity needs to be
enhanced, keeping medium-term needs associated with the post-2015 agenda in the purview. Above
all, the data revolution in the context of the post-2015 agenda requires a new set of institutional
arrangements. In September 2015, the Ministry of Foreign Affairs will represent the Government of
Bangladesh at the United Nations summit where the post-2015 agenda will be finalised. The General
Economics Division of the Planning Commission is expected to play a key role in planning and
coordinating the subsequent implementation process. The Bangladesh Bureau of Statistics will play a
central role in generating data to track development progress. Local Consultative Groups may
coordinate development partners’ initiatives, while the Ministry of Finance, including its Economic
Relations Division, ought to coordinate financing needs. Civil society organisations and other
stakeholder groups will be both generators and users of key data. Analysts, experts and researchers
will use relevant data to measure and assess progress. A comprehensive plan on data that articulates
concrete tasks for specific institutions and stakeholders will need to be designed. Only such a plan will
enable a data revolution to occur in Bangladesh.

69
References Banerjee, Sudeshna Ghosh, Mikul Bhatia, Gabriela
Elizondo Azuela, Ivan Jaques, Ashok Sarkar, Elisa
Portale, Irina Bushueva, Nicolina Angelou, and Javier
GustavoInon. 2013. Global Tracking Framework. Vol.
3. Sustainable Energy for All. Washington, DC: World
Bank.
BBS (Bangladesh Bureau of Statistics). 2007. Report of
the Household Income and Expenditure Survey
2005. Dhaka: BBS.
———. 2010. Multiple Indicator Custer Survey 2009.
Dhaka: BBS.
———. 2011. Report of the Household Income and
Expenditure Survey 2010. Dhaka: BBS.
———. 2013. Final Documents of NSDS. Dhaka: BBS.
———. 2015. Report on Sample Vital Registration
System. Dhaka: BBS.
Bhattacharya, Debapriya, Kate Higgins, and Shannon
Kindornay. 2014. Methodology and Implementation
Guide. Post-2015 Data Test. Dhaka and Ottawa:
Centre for Policy Dialogue, The North-South Institute,
and Southern Voice on Post-MDG International
Development Goals.
Bhattacharya, Debapriya, Towfiqul Islam Khan, Umme
Salma, and Gazi Joki Uddin. 2013. Attaining the
MDGs: How Successful Are the LDCs? Dhaka:
Centre for Policy Dialogue.
BIP (Biodiversity Indicators Partnership). 2014. “Coverage
of Protected Areas.” Accessed July 10, 2014.
http://www.bipindicators.net/pacoverage.
Carin, Barry, and Nicole Bates-Eamer. 2012. Post-2015
Goals, Targets and Indicators. Conference Report.
Waterloo: The Centre for International Governance
Innovation.
Demirguc-Kunt, Asli, and Leora Klapper. 2012. “Measuring
Financial Inclusion: The Global Findex Database.”
Policy Research Working Paper 6025. Washington,
DC: World Bank.
DPE (Directorate of Primary Education). 2011. Annual
Primary School Census. Dhaka: DPE, Ministry of
Primary and Mass Education.
Environment Canada. 2013. “Definitions and Glossary.”
Accessed August 12, 2014. http://www.ec.gc.ca/ges-
ghg/default.asp?lang=En&n=B710AE51-1.
ERD (Economic Relations Division). 2011. “Flow of
External Resources into Bangladesh.” Dhaka:
Economic Relations Division, Ministry of Finance.
FAO (Food and Agriculture Organization of the United
Nations). 2012. “FRA 2015: Terms and Definitions.”
Forest Resources Assessment Working Paper 180,
FAO, Rome. GED (General Economics Division). 2014. Millennium
Development Goals: Bangladesh Progress Report
2013. Dhaka: GED, Bangladesh Planning
Commission.
Glassman, Amanda. 2014. “Donors and a Data
Revolution.” Global Health Policy Blog, Center for
Global Development Blog, February 11.
http://www.cgdev.org/blog/donors-and-data-
revolution.
HLP (High-Level Panel of Eminent Persons on the Post-
2015 Development Agenda). 2013. A New Global
Partnership: Eradicate Poverty and Transform
Economies through Sustainable Development. New
York: United Nations.
Ho, Esther Sui-chu. 2013. Student Learning Assessment.
Asia-Pacific Education System Review Series No. 5.
Paris: United Nations Educational, Scientific and
Cultural Organization.
ICAR (International Centre for Asset Recovery). 2014.
“The Basel AML Index Country Risk Ranking”.
Accessed July 10, 2014.
http://index.baselgovernance.org/index/Index.html
IEA (International Energy Agency). 2014. “Glossary: R.”
Accessed July 10, 2014.
http://www.iea.org/aboutus/glossary/r.
ILO (International Labour Organization). 2014.
"Definitions." Accessed July 10, 2014.
http://laborsta.ilo.org/definition_E.html.
IIRC (International Integrated Reporting Council). 2013.
The International <IR> Framework. London: IIRC.
OECD (Organisation for Economic Co-operation and
Development). 2009. Forum on Tax Administration:
Compliance Management of Large Business Task
Group. Guidance Note. Paris: OECD.
———. 2011. “Energy Intensity.” In OECD Factbook 2011-
2012: Economic, Environmental and Social Statistics.
Paris: OECD.
OWG (Open Working Group on Sustainable Development
Goals). 2014. Open Working Group Proposal for
Sustainable Development Goals. New York: United
Nations.
Perucci, Francesca. 2011. “The UN Development Agenda
Post 2015.” Presentation prepared for the 2011
International Conference on MDGs Statistics, Manila,
October.
Sandefur, Justin, and Amanda Glassman. 2014. The
Political Economy of Bad Data: Evidence from
African Survey & Administrative Statistics. Working
Paper 373, Center for Global Development,
Washington, DC.
UN (United Nations). 1993. Declaration on the Elimination
of Violence against Women. A/RES/48/104. New
York: UN.
UNCT (United Nations Country Team). 2013. On the Post-
2015 Development Agenda for Bangladesh. Dhaka:
United Nations in Bangladesh.
UNDESA (United Nations, Department of Economic and
Social Affairs). 2014. “World Contraceptive Use
2014”. Accessed July 10, 2014.
http://www.un.org/en/development/desa/population/p
ublications/dataset/contraception/wcu2014/Metadata/
WCU2014_CONTRACEPTIVE_PREVALENCE_met
adata.pdf
UNDG (United Nations Development Group). 2013. The
Global Conversation Begins: Emerging Views for A
New Development Agenda. New York: UNDG.
UNDP (United Nations Development Programme). 2010.
Human Development Report 2010. New York: Palgrave
Macmillan.
UNESCO (United Nations Educational, Scientific and
Cultural Organization). 2012. International Standard
Classification of Education: ISCED 2011. Montreal:
UNESCO Institute for Statistics.
70
UNEVOC (International Centre for Technical and
Vocational Education and Training). 2012. "What is
TVET?" Accessed July 10, 2014.
http://www.unevoc.unesco.org/go.php?q=What+is+TV
ET.
UNICEF (United Nations Children’s Fund). 2014.
"Statistics by Area: Child Nutrition." Accessed July 10,
2014. http://www.childinfo.org/malnutrition.html.
UNISDR (United Nations Office for Disaster Risk
Reduction). 2007. "Terminology." Accessed August
12, 2014. http://www.unisdr.org/we/inform/terminology.
UNODC (United Nations Office on Drugs and Crime).
2004. United Nations Convention Against
Transnational Organized Crime and the Protocols Thereto.
Vienna: UNODC.
———. 2014. Global Study on Homicide 2013. New York:
United Nations.
UN-OHRLLS (UN Office of the High Representative for the
Least Developed Countries, Landlocked Developing
Countries and Small Island Developing States). 2014.
“About LDCs.” Accessed July 24, 2014.
http://unohrlls.org/about-ldcs.
UNSD (United Nations Statistics Division). 2008.
Millennium Development Goals Indicators. New York:
United Nations Department of Economic and Social
Affairs.
UNStats (United Nations Statistics Division). 2014. System
of Environmental-Economic Accounting (SEEA)—
Central Framework. New York: United Nations.
UNTT (UN System Task Team on the Post-2015 UN
Development Agenda). 2012. Realizing the Future
We Want for All: Report to the Secretary-General.
New York: UNTT.
———. 2013. Statistics and Indicators for the Post-2015
Development Agenda. New York: UNTT.
WHO (World Health Organisation). and UNICEF (United
Nations Children’s Fund). 2014. Progress on Drinking
Water and Sanitation. Geneva: WHO and UNICEF.
World Bank. 2005. Connecting East Asia: A New
Framework for Infrastructure. Washington, DC: Asian
Development Bank, World Bank, and Japan Bank for
International Cooperation.
———. 2011. One Goal, Two Paths: Achieving Universal
Access to Modern Energy in East Asia and the Pacific.
Washington, DC: World Bank.
———. 2014a. “Global Poverty Indicators.” Accessed July
21, 2015.
http://povertydata.worldbank.org/poverty/home/
———. 2014b. “Poverty Headcount Ratio at $1.25 a Day
(PPP) (% of Population).” Accessed July 29, 2014.
http://data.worldbank.org/indicator/SI.POV.DDAY.
———. 2014c. “Poverty Headcount Ratio at $2 a Day
(PPP) (% of Population).” Accessed July 29, 2014.
http://data.worldbank.org/indicator/SI.POV.2DAY.
———. 2014d. "Gross Fixed Capital Formation (% of
GDP)." Accessed July 10, 2014.
http://data.worldbank.org/indicator/NE.GDI.FTOT.ZS.
———. 2014e. “Debt Forgiveness or Reduction (Current
US$).” Accessed July 10, 2014.
http://data.worldbank.org/indicator/DT.DFR.DPPG.CD.
World Justice Project. 2014. “WJP Rule of Law Index
2014: Canada.” Accessed August 5, 2014.
http://data.worldjusticeproject.org/#/index/CAN.

71
Annex 1. Research Team
The Bangladesh case study was conducted by a dedicated research team from CPD, an independent
civil society think tank in Bangladesh. CPD is closely involved in shaping the post-2015 agenda as the
Secretariat of the Southern Voice network, which involves 48 think tanks from Africa, Asia and Latin
America. CPD is thus very much embedded in the global South’s efforts to make its voice heard in the
post-2015 process. The four-member CPD research team for the Bangladesh case study is led by
Professor Mustafizur Rahman, Executive Director, CPD. The three other members are Towfiqul Islam
Khan, Research Fellow, CPD, Md. Zafar Sadique, Senior Research Associate, CPD, and Mostafa
Amir Sabbih, Research Associate, CPD.
72
Annex 2. Inception Workshop Participants
Bangladesh Bureau of Statistics
Mr Abul Kalam Azad
Head
National Accounting Wing
Dr Dipankar Roy
Deputy Director
National Accounting Wing
Mr Md Arif Hossain
Statistics Officer
Deputy Director
National Accounting Wing
Engineer Jatan Kumar Shaha
System Analyst
Computer Wing
Mr Md Kabir Uddin Ahmed
Deputy Director
Industry & Labour Wing
Begum Ayshea Akhter Mili
Statistics Officer
Census Wing
Bangladesh Bank
Mr Mohammad Saiful Islam
Assistant Director, Statistics Department
Mr Ataur Rahman
Assistant Director, Research Division
Ministry of Finance
Mr Md Matiur Rahman
Assistant Chief
Planning Commission
Mr Monirul Islam
Senior Assistant Chief
General Economics Division
Ms Nazia Afrin Chowdhury
Senior Assistant Chief
General Economics Division
Mr. Nepoleon Dewan
Assistant Chief
General Economics Division
Economic Relations Division, Ministry of
Finance
Mr Ruhul Amin
Deputy Secretary
FABA-1
Dr Md Reazul Bashar Siddique
Deputy Secretary
Aid Effectiveness Unit
Mr Abdul Latif
Deputy Secretary
Budget
Implementation Monitoring and Evaluation
Division, Ministry of Planning
Mr Sheikh Mohammad Abdur Rahman
Deputy Director
Ministry of Primary and Mass Education
Mr Md Osman Goni
Programmer
Directorate of Primary Education
Mr Ismail Hossain
Statistical Officer, M & E Division
Directorate of Primary Education
WTO Cell
Mr Md Awlad Hossain
Assistant Director
WTO Cell
Ministry of Commerce, Government of
Bangladesh
Bangladesh Bureau of Educational
Information and Statistics
Mr Md Khan Jahan Ali
Statistical Officer
Directorate General of Health Services
Dr Ashish Kumar Saha
Assistant Director, Management Information
System
Mr Shekh Nazimuddin Linkon
IT Consultant, Management Information
System
73
Bangladesh Telecommunication
Regulatory Commission
Ms Sabina Islam
Deputy Director
System and Services Division
Bangladesh Energy Regulatory
Commission
Mr Harunur Rashid
Deputy Director
Department of Environment
Mr Sadiqul Islam
Analyst (IT Section)
Department of Environment
Ministry of Environment and Forests
Bangladesh Export Processing Zones
Authority
Mr A S M Anwar Parvez
Deputy Manager
Export Promotion Bureau,
Ministry of Commerce
Mr Abdul Haque
Director
Transparency International Bangladesh
Mr Waheed ul Alam
Senior Programme Manager
Bangladesh Institute of International and
Strategic Studies
Dr Hosna Jahan Shewly
Research Fellow
Bangladesh Enterprise Institute
Ambassador M Humayun Kabir
Vice President
Institute of Microfinance
Professor Nazrul Islam
Director (Research)
Bangladesh Institute of Development
Studies
Ms Tahreen Tahrima Chowdhury
Research Associate
Mr Md Atiqur Rahman
Research Associate
Institute of Governance Studies, BRAC
University
Ms Nabila Zaman
Research Assistant
Policy Research Institute of Bangladesh
Ms Mehrin Karim
Senior Research Associate
Dhaka Chamber of Commerce and Industry
Mr Feroz Mahmud
Chief Operations Officer
Center for Environmental and Geographic
Information Services
Mr Md Mostafizur Rahman
Specialist, Database and IT Division
Campaign for Popular Education
Mr K M Enamul Hoque
Deputy Director
Palli Karma-Sahayak Foundation
Mr Md Hasan Khaled
General Manager
Institute of Statistical Research and
Training, University of Dhaka
Ms Jahida Gulshan
Assistant Porfessor
Mr Rashedul Haque
Lecturer
BRAC University
Dr Ainun Nishat
Vice Chancellor
Dr Manzoor Ahmed
Senior Advisor
BRAC University - Institute of Education and
Development (BU-IED)
Vice Chairperson, CAMPE
United International University
Dr A K Enamul Haque
Professor, School of Business
United International University and
Director and Member, Economic Research
Group
74
BRAC
Dr Mahabub Hossain
Advisor to the Interim Executive Director,
BRAC and
Former Head, Social Sciences Division
International Rice Research Institute (IRRI),
Philippines
Ms Barnali Chakraborty
Senior Research Fellow
Food Security & Nutrition Research Unit
Research and Evaluation Division, BRAC
Dr Nepal Chandra Dey
Research Fellow, Environment Unit
Coordinator,
Research and Evaluation Division BRAC
Dr Mohammad Abdul Malek
Postdoctoral Researcher at Center for
Development Research (ZEF), Bonn
Senior Research Fellow
Research and Evaluation Division (RED),
BRAC
Mr Andrew Jenkins
Donor Liaison Officer
Impact Assessment Unit
Research and Evaluation Division, BRAC
Mr Anwar Hossain
Senior Field Operations Officer
Research and Evaluation Division, BRAC
Ms Fahmida Akter
Staff Researcher
Research and Evaluation Division, BRAC
BRAC Centre
Ms Nawra Mehrin
Research Trainee
Education Research Unit
Research and Evaluation Division, BRAC
Mr Showkat Gani
Senior Research Fellow
Health & Population Research Unit
Research and Evaluation Division, BRAC
Mr Tridib Roy
Research Associate
Health & Population Research Unit
Research and Evaluation Division, BRAC
ActionAid Bangladesh
Mr Md Rezwan Siddique
Deputy Manager
UN Children’s Fund
Ms Alexandra Illmer
Monitoring and Evaluation Specialist
Mr Mashiur Rahan Khan
Knowledge Management Officer
United Nations World Food Programme
Ms Nusha Choudhury
Head of Vulnerability Analysis and Mapping
Water Aid
Mr Mujtaba Mahbub Morshed
Program Officer
Others
Ms Riti Ibrahim
Former Secretary
Statistics Division, Government of Bangladesh
Mr S N Mitra
Executive Director
Mitra and Associates
Mr Shahidul Islam
Research Director
Mitra and Associates
Mr Zobdul Hoque
Former Deputy Director General
Bangladesh Bureau of Statistics

75
Annex 3. Key Documents and Resources Consulted for Selecting
Targets and Indicators
Organisation/Author Source/Web link
High-Level Panel HLP (High-Level Panel of Eminent Persons on the Post-2015 Development Agenda). 2013. A New Global Partnership: Eradicate
Poverty and Transform Economies through Sustainable Development. New York: United Nations.
Open Working Group OWG (Open Working Group on Sustainable Development Goals). 2013. “Informal Meeting on Measuring Progress.” December 17.
New York: United Nations Department of Economic and Social Affairs.
http://unstats.un.org/unsd/Dissemination/workshops/OWG_2013/docs/OWG%20informal%20meeting%2017%20Dec%202013%20-
%20Report%20(final).pdf.
Sustainable
Development
Solutions Network
SDSN (Sustainable Development Solutions Network). 2014. An Action Agenda for Sustainable Development: Report for the UN
Secretary-General. Paris and New York: SDSN.
UN https://www.worldwewant2015.org.
IAEG-MDG (United Nations Inter-Agency and Expert Group on MDG Indicators). 2013. Lessons Learned from MDG Monitoring
from a Statistical Perspective. New York: United Nations.
UN (United Nations). 2013. Special Event 25 September: Outcome Document. New York: UN.
http://www.un.org/millenniumgoals/pdf/Outcome%20documentMDG.pdf.
UNSG (United Nations Secretary-General). 2013. A Life of Dignity for All: Accelerating Progress towards the Millennium
Development Goals and Advancing the United Nations Development Agenda beyond 2015. A/68/202. New York: United Nations.
UN System Technical Support Team. Various issues briefs available at
http://sustainabledevelopment.un.org/index.php?menu=1549 (see “UN System inputs” tab).
PARIS21 PARIS21 (Partnership in Statistics for Development in the 21st Century). 2009. Paris21 at Ten: Improvements in Statistical
Capacity Since 1999. Paris: PARIS21.
PARIS21 (Partnership in Statistics for Development in the 21st Century). 2013. Towards a Post-2015 Framework That Counts:
Aligning Global Monitoring Demand with National Statistical Capacity Development. Paris: PARIS21.

76
Organisation/Author Source/Web link
PARIS21 (Partnership in Statistics for Development in the 21st Century). 2014. “PARIS21, CGD, and APHRC Debate Innovations
and Technology.” PARIS21 News, April 4. http://www.paris21.org/news/PARIS21-CGD-APHRC-Debate.
OECD OECD (Organisation for Economic Co-operation and Development). 2013. “Strengthening National Statistical Systems to Monitor
Global Goals.” OECD and Post-2015 Reflections, Element 5, Paper 1. Paris: OECD.
Post2015.org http://post2015.org/tag/data-revolution.
General Economics
Division of the
Planning Commission
GED (General Economics Division). 2014. Millennium Development Goals: Bangladesh Progress Report 2013. Dhaka: GED,
Bangladesh Planning Commission.
Fukuda-Parr Fukuda-Parr, Sakiko. 2013. Global Development Goal Setting as a Policy Tool for Global Governance: Intended and Unintended
Consequences. Working Paper 108, International Policy Centre for Inclusive Growth, Brasilia.
Langford Langford, Malcolm. 2012. “The Art of the Impossible: Measurement Choices and the Post-2015 Development Agenda.” Background
paper prepared for “Governance and human rights: Criteria and measurement proposals for a post-2015 development agenda,”
Office of the High Commissioner for Human Rights/UN Development Programme Expert Consultation, New York, November.
Glennie Glennie, Jonathan. 2013. “A Development Data Revolution Needs to Go Beyond the Geeks and Bean-Counters.” Poverty Matters
Blog, Guardian, October 3. http://www.theguardian.com/global-development/poverty-matters/2013/oct/03/data-revolution-
development-policy.
Kharas Kharas, Homi. 2013. “A Data Revolution for the Post-2015 Agenda?” Future Development Blog, World Bank, October 1.
http://blogs.worldbank.org/futuredevelopment/data-revolution-post-2015-agenda.

77
Annex 4. Candidate Targets, Indicators and Definitions
Annex Table 4.1. End poverty: Targets and indicators
Target Indicator Definition/Note
Global
End extreme income poverty
Proportion of population below US$1.25 (PPP) per day
Refers to the percentage of the population living on less than US$1.25 per day at 2005 prices (World Bank 2014b).
Reduce poverty Proportion of population below US$2 (PPP) per day
Refers to the percentage of the population living on less than US$2 per day at 2005 prices (World Bank 2014c).
Proportion of population living below national poverty line
The cost of basic needs method is the standard method for estimating the incidence of poverty in Bangladesh. It is a process for counting the poor according to the consumption expenditure threshold, which is expressed as a percentage. The poverty headcount ratio provides an estimate of the percentage of people living below the poverty line as a share of the total population. The upper poverty line is considered to be the national poverty line in Bangladesh. The upper poverty line is estimated by adding together the food and non-food poverty lines (BBS, different years).
Share of employed persons living below the nationally-defined poverty line
The working poor or the number of employed persons living in households with incomes below the nationally-defined poverty line are based on real disposable income and refer to a nationally-defined real absolute poverty line, whenever possible. Data are presented in terms of the yearly annual average. Here, the income concept refers to household disposable income. If a relative poverty line is used, data are expressed as the number of employed persons living in households with incomes below the nationally-defined relative poverty line. The poverty line is defined as the threshold below which individuals in the population are considered poor and above which they are considered non-poor. The threshold is generally defined as the per-capita monetary requirements an individual needs to afford the purchase of a basic bundle of goods and services (ILO 2014).
Reduce the proportion of people who suffer from hunger
Prevalence of child stunting in boys and girls under 5, %
Stunting: Proportion of under-fives falling below minus 2 standard deviations (moderate and severe) and minus 3 standard deviations (severe) from the median height-for-age of the reference population (UNICEF 2014).
National
End extreme income poverty
Proportion of population below national extreme poverty line
Refers to the proportion of the population under the lower poverty line. The lower poverty line refers to the extremely poor households whose total expenditure on food and non-food items combined is equal to or less than the food poverty line (BBS, different years)

78
Annex Table 4.1. End poverty: Targets and indicators
Target Indicator Definition/Note
Reduce poverty Reduce severity index (squared poverty gap ratio)
The squared poverty gap measures the severity of poverty. Here, the squared poverty gap ratio is estimated by the Foster, Greer and Thorbecke method using both the lower and upper poverty lines (BBS, different years).
Percentage of population living in poverty according to the multidimensional poverty index
The multidimensional poverty index complements monetary measures of poverty by considering overlapping deprivations suffered by people at the same time. The index identifies deprivations across the same three dimensions as the UN Development Programme’s Human Development Index – life expectancy, education and per capita income – and indicates the number of people who are multidimensionally poor (suffering deprivations in 33 percent of weighted indicators) and the number of deprivations with which poor households typically contend with (UNDP 2010)
Reduce the proportion of people who suffer from hunger
Proportion of children under 5 years of age with low weight-for-height (wasting)
Refers to the percentage of children under five years of age who are wasted. Weight-for-height describes current nutritional status. A child who is below minus two standard deviations from the reference median for weight-for-height is considered to be too thin for his/her height, or wasted, a condition reflecting acute or recent nutritional deficit (NIPORT, different years).
Cover x% of poor and vulnerable people with social protection measures
Percentage of poor and vulnerable people under social protection measures
Refers to the percentage of households receiving benefits from at least one type of social safety net programme during the last 12 months (BBS, different years).
End hunger and protect the right of all to have access to sufficient, safe, affordable and nutritious food
Proportion of people (by sex and age) consuming less than 2,122 kilocalories per day
Refers to the proportion of population of both sexes in absolute poverty measured by the direct calorie intake method. This method measures poverty incidences by taking into account the minimum level of food energy to maintain normal health as the threshold to measure poverty. For Bangladesh, the minimum calorie threshold is 2,122 kilocalories per capita per day, which is known as the food poverty line. The percentage of people failing to acquire this level are known as absolute food poor (BBS 2007).
Proportion of people (by sex and age) consuming less than 1,805 kilocalories per day
Refers to the percentage of people failing to acquire 1,805 kilocalories per day known as hardcore food poor (BBS 2007).
Per capita production of cereal Refers to the per capita production of cereals (rice, wheat and others).
Improve nutritional status of pregnant women, lactating mothers and their newborns
Coverage of iron-folic acid supplements for pregnant women (%)
Refers to the percentage of pregnant women under coverage of iron-folic acid supplements to prevent anemia.

79
Annex Table 4.2. Ensure quality education for all: Targets and indicators
Target Indicator Definition/Note
Global
Ensure all children have access to early childhood and quality primary and secondary education
% of girls and boys receiving at least one year in pre-primary programmes
Refers to the proportion of children (girls and boys) who have at least one year of pre-primary programmes.
% of girls and boys who complete primary school
Refers to proportion of girls and boys who complete primary school.
% of girls and boys who complete secondary school
Refers to proportion of girls and boys who complete secondary school.
% of girls and boys who achieve a passing grade in national learning assessments at the primary school level
Assessment of learning outcomes: Evaluation of an individual’s achievement of learning objectives using a variety of assessment methods (written, oral and practical tests/examinations, projects and portfolios) during or at the end of an education programme (UNESCO 2012). National (or sub-national) assessment: Large-scale assessment surveys designed to describe the achievement of students in a curriculum area and provide an estimate of the achievement level in the education system as a whole at a particular age or grade level. This normally involves administration of tests either to a sample or population of students (Ho 2013).
Increase the number of adults with skills, including technical and vocational skills
Proportion of individuals enrolled in a Technical and Vocational Education and Training (TVET) institution
Technical and Vocational Education and Training is concerned with the acquisition of knowledge and skills for the world of work. Various terms have been used to describe elements of the field that are now conceived as comprising Technical and Vocational Education and Training. These include: Apprenticeship Training, Vocational Education, Technical Education, Technical-Vocational Education, Occupational Education, Vocational Education and Training, Professional and Vocational Education, Career and Technical Education, Workforce Education, Workplace Education, etc. Several of these terms are commonly used in specific geographic areas (UNEVOC 2012).
National
Ensure all children have access to early childhood and quality primary and secondary education
Dropout rate at secondary level, % Refers to the percentage of students who drop out at the secondary level (grades 6 to 10).
Teacher-student ratio by level of education
Refers to the ratio of teacher and students at primary, secondary and tertiary levels. It accounts for personnel in the classroom dedicated to teaching students at each level.
Increase the number of adults with skills, including technical and vocational skills
Percentage of education budget for Technical and Vocational Education and Training
Refers to the percentage of the education budget allocated for Technical and Vocational Education and Training from the national budget.

80
Annex Table 4.2. Ensure quality education for all: Targets and indicators
Target Indicator Definition/Note
Promote quality research (for knowledge creation/innovation)
Proportion of budget allocated to research and innovation
Refers to the proportion of the budget allocated to research and innovation from the national budget.
Number of research findings/innovations patented
Includes the number of research findings/innovations covered by patent rights.
Annex Table 4.3. Create jobs, sustainable livelihoods, and inclusive growth for all: Targets and indicators
Target Indicator Definition/Note
Global
Achieve full and productive employment for all, including women and young people
Labour force participation rate The labour force participation rate is the labour force as a percentage of the working-age population (ILO 2014). This definition is consistent with that used by the BBS,
Time-related underemployment (thousands)
Persons in time-related underemployment comprise all persons in employment who satisfy the following three criteria during the reference period: (i) are willing to work additional hours, (ii) are available to work additional hours (i.e., are ready, within a specified subsequent period, to work additional hours, given opportunities for additional work) and (iii) worked less than a threshold relating to working time (i.e., persons whose hours actually worked in all jobs during the reference period were below a threshold to be chosen according to national circumstances). For details, refer to the resolution concerning the measurement of underemployment and inadequate employment situations (ILO 2014).
Ensure equal pay for equal work
Mean nominal monthly earnings of employees (local currency)
Data on earnings are presented, whenever possible, in nominal terms and on the basis of the mean of monthly earnings of all employees. The earnings of employees relate to the gross remuneration in cash and in kind paid to employees, as a rule at regular intervals, for time worked or work done together with remuneration for time not worked, such as annual vacation, other type of paid leave or holidays. Earnings exclude employers' contributions in respect of their employees paid to social security and pension schemes and also the benefits received by employees under these schemes. Earnings also exclude severance and termination pay. Statistics of earnings relate to the gross remuneration of employees (i.e., the total before any deductions are made by the employer). Data are disaggregated by economic activity according to the latest version of the International Standard Industrial Classification of All Economic Activities available for that year. Economic activity refers to the main activity of the establishment in which a person worked during the reference period and does not depend on the specific duties or functions of the person's job, but on the characteristics of the economic unit in which this person works.
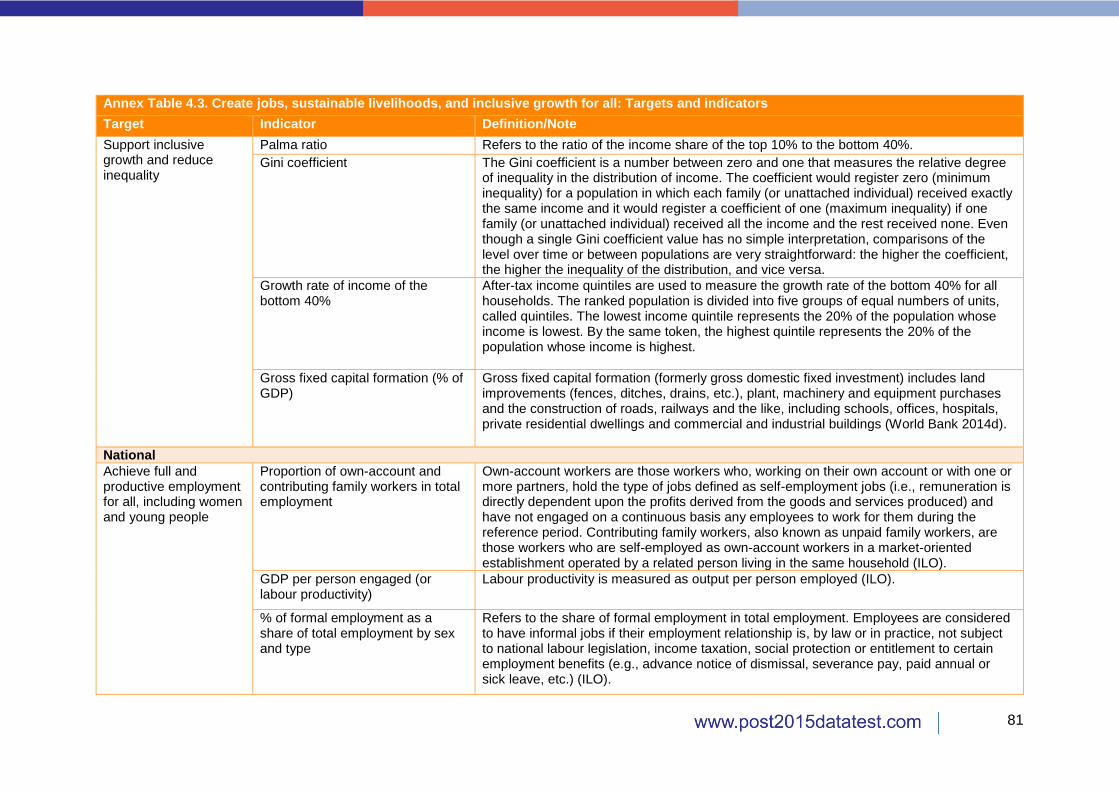
81
Annex Table 4.3. Create jobs, sustainable livelihoods, and inclusive growth for all: Targets and indicators
Target Indicator Definition/Note
Support inclusive growth and reduce inequality
Palma ratio Refers to the ratio of the income share of the top 10% to the bottom 40%.
Gini coefficient The Gini coefficient is a number between zero and one that measures the relative degree of inequality in the distribution of income. The coefficient would register zero (minimum inequality) for a population in which each family (or unattached individual) received exactly the same income and it would register a coefficient of one (maximum inequality) if one family (or unattached individual) received all the income and the rest received none. Even though a single Gini coefficient value has no simple interpretation, comparisons of the level over time or between populations are very straightforward: the higher the coefficient, the higher the inequality of the distribution, and vice versa.
Growth rate of income of the bottom 40%
After-tax income quintiles are used to measure the growth rate of the bottom 40% for all households. The ranked population is divided into five groups of equal numbers of units, called quintiles. The lowest income quintile represents the 20% of the population whose income is lowest. By the same token, the highest quintile represents the 20% of the population whose income is highest.
Gross fixed capital formation (% of GDP)
Gross fixed capital formation (formerly gross domestic fixed investment) includes land improvements (fences, ditches, drains, etc.), plant, machinery and equipment purchases and the construction of roads, railways and the like, including schools, offices, hospitals, private residential dwellings and commercial and industrial buildings (World Bank 2014d).
National
Achieve full and productive employment for all, including women and young people
Proportion of own-account and contributing family workers in total employment
Own-account workers are those workers who, working on their own account or with one or more partners, hold the type of jobs defined as self-employment jobs (i.e., remuneration is directly dependent upon the profits derived from the goods and services produced) and have not engaged on a continuous basis any employees to work for them during the reference period. Contributing family workers, also known as unpaid family workers, are those workers who are self-employed as own-account workers in a market-oriented establishment operated by a related person living in the same household (ILO).
GDP per person engaged (or labour productivity)
Labour productivity is measured as output per person employed (ILO).
% of formal employment as a share of total employment by sex and type
Refers to the share of formal employment in total employment. Employees are considered to have informal jobs if their employment relationship is, by law or in practice, not subject to national labour legislation, income taxation, social protection or entitlement to certain employment benefits (e.g., advance notice of dismissal, severance pay, paid annual or sick leave, etc.) (ILO).

82
Annex Table 4.3. Create jobs, sustainable livelihoods, and inclusive growth for all: Targets and indicators
Target Indicator Definition/Note
Reduce child labour and eliminate worst forms of child labour
Number of children removed from child labour
Refers to the number of children removed from child labour. Child labour is measured as the number of children aged 6–14 years who are not in school but rather engaging in paid and unpaid work (BBS 2010).
Reduce vulnerability of workers and ensure their rights and safety
Incidence of occupational injury among industrial workers (%)
Refers to work-related injuries or incidence of injury rates among industrial workers.
Decrease the number of young people not in education, employment or training by x%
% of skilled youth employed Refers to the percentage of economically active, employed young people (aged 15–29 years) by level of education (BBS).
% of youth employed Refers to the percentage of young people (aged 15–29 years) who are employed (BBS, different years).
Increase new start-ups by x and value addition in new products by y through creating an enabling business environment and boosting entrepreneurship
Number of new jobs created (by sector)
Refers to the sector-wise creation of new jobs.
Eliminate discrimination against women in political, economic and public life
Labour force participation rate of women compared to men
Refers to labour force participation rate by sex.
Average number of hours per week of unpaid domestic work (by sex)
Refers to the average number of hours spent by males and females per week on unpaid household work.
Proportion of women-owned or managed businesses
Refers to the percentage of businesses owned or managed by women.

83
Annex Table 4.4. Ensure sustainable energy and develop infrastructure for all: Targets and indicators
Target Indicator Definition/Note
Global
Ensure full access to developed infrastructure and communication technology
Internet users (per 1,000 people) This indicator measures the number of people that use the internet for every 1,000 people.
Average bandwidth speed (megabits/second)
Measurement of the ability of an electronic communications device or system (such as a computer network) to send and receive information, measured in megabits per second (mbit/s).
% of the population with access to an all-season road
“With access” means that the distance from a village or household to an all-season road is no more than 2 kilometres; otherwise, a walk of no more than 20 minutes or so is required to reach an all-season road. An “all-season road” is a road that is motorable by the prevailing means of rural transport (often a pick-up or a truck that does not have four-wheel drive) all year round. Predictable interruptions of short duration during inclement weather (e.g., heavy rainfall) are permitted, particularly on low-volume roads (World Bank 2005).
% of adults with an account at a formal financial institution
Denotes the percentage of the population with an account (self or together with someone else) at a bank, credit union, other financial institution (e.g., cooperative, microfinance institution) or post office (if applicable) (modified slightly from World Bank Global Index Glossary).
Ensure access to energy and improve efficiency and sustainability of energy supply, including renewable energy
# of hours per day households have access to electricity on average
This indicator measures the number of hours for which electricity is available in a household within a given day.
Rate of improvement in energy intensity
Energy required per unit (currency) of GDP, measured in primary energy terms and GDP. Primary energy refers to energy sources as found in their natural state (as opposed to derived or secondary energy, which is the result of the transformation of primary or secondary sources) (OECD 2011).
Share of the population with access to modern cooking solutions (%)
Access to modern cooking solutions is defined as relying primarily on non-solid fuels for cooking. Non-solid fuels include: (i) liquid fuels (e.g., kerosene, ethanol and other biofuels), (ii) gaseous fuels (e.g., natural gas, liquefied petroleum gas and biogas) and (iii) electricity. Solid fuels include: (i) traditional biomass (e.g., wood, charcoal, agricultural residues and dung), (ii) processed biomass (e.g., pellets and briquettes) and (iii) other solid fuels (e.g., coal and lignite) (World Bank 2011; Banerjee et al. 2013).
Share of renewable energy to total energy consumption
Energy that is derived from natural processes (e.g., sunlight and wind) that are replenished at a higher rate than they are consumed. Solar, wind, geothermal, hydro and biomass are common sources of renewable energy (IEA 2014).

84
Annex Table 4.4. Ensure sustainable energy and develop infrastructure for all: Targets and indicators
Target Indicator Definition/Note
National
Ensure access to energy and improve efficiency and sustainability of energy supply, including renewable energy
% of households with access to electricity (rural/urban)
Refers to the percentage of households that have access to electricity by region.
Per capita consumption of electricity
Refers to electricity consumption by kilowatt-hours per capita. Electricity consumption measures the production of power plants and combined heat and power plants less transmission, distribution and transformation losses and own use by heat and power plants (IEA 2014).
Increase use of energy-efficient transport and infrastructure
% using railway as mode of transport (passenger/freight)
Refers to the percentage of passengers and freights using railways as a mode of transport.
Annex Table 4.5. Establish a sustainable, healthy and resilient environment for all: Targets and indicators
Target Indicator Definition/Note
Global
Build resilience and reduce deaths from natural hazards
Disaster deaths per 1,000 inhabitants
Hazard: A dangerous phenomenon, substance, human activity or condition that may cause loss of life, injury or other health impacts, property damage, loss of livelihoods and services, social and economic disruption, or environmental damage. Includes: Avalanche, Cold Wave, Cyclone, Drought, Earthquake, Epidemic and Pandemic, Flood, Heat Wave, Insect Infestation, Landslide, NBC – Nuclear, Biological, Chemical, Storm Surge, Tornado, Tsunami, Volcano, Wildfire (UNISDR 2007). Disaster: A serious disruption of the functioning of a community or a society involving widespread human, material, economic or environmental losses and impacts, which exceeds the ability of the affected community or society to cope using its own resources (UNISDR 2007).
Safeguard ecosystems and biodiversity
Net loss in forest area (% of land area)
Forest: Land spanning more than 0.5 hectares with trees higher than 5 metres and a canopy cover of more than 10 percent, or trees able to reach these thresholds in situ. It does not include land that is predominantly under agricultural or urban land use (FAO 2012).
Trends in coverage of protected areas
The indicator measures the policy response to biodiversity loss. An increase in protected area coverage indicates increased efforts by governments and civil society to protect land and sea areas with a view to achieve the long-term conservation of biodiversity with associated ecosystem services and cultural values (BIP 2014). Note: The data provided show how protected areas are managed based on International Union for the Conservation of Nature categories and includes marine areas.

85
Annex Table 4.5. Establish a sustainable, healthy and resilient environment for all: Targets and indicators
Target Indicator Definition/Note
Publish and use economic, social and environmental accounts in all governments and companies
Share of large tax unit taxpayers using integrated reporting
Integrated reporting is a process founded on integrated thinking that results in a periodic integrated report by an organisation about value creation over time and related communications regarding aspects of value creation. An integrated report is a concise communication about how an organisation’s strategy, governance, performance and prospects, in the context of its external environment, lead to the creation of value in the short, medium and long term (IIRC 2013). Large taxpayers are very different from other categories of taxpayers and present certain significant risks to effective tax administration. Major characteristics of large taxpayers include: concentration of revenues, complexity of the business and tax dealing, withholding agent or intermediary role, use of professional tax advisors and possession of in-house tax organisation. Businesses may be publicly listed corporations, multinational companies or private groups (OECD 2009).
Existence of national and sub-national government publishing according to the System of Environmental-Economic Accounting
The System of Environmental-Economic Accounting contains the internationally agreed standard concepts, definitions, classifications, accounting rules and tables for producing internationally comparable statistics on the environment and its relationship with the economy. The system follows a similar accounting structure as the System of National Accounts and uses concepts, definitions and classifications consistent with it in order to facilitate the integration of environmental and economic statistics (UNStats 2014).
National
Build resilience and reduce deaths from natural hazards
Proportion of disaster-related economic loss (% of GDP)
Refers to the amount of economic and infrastructure losses incurred as a direct result of the natural disaster as a percentage of GDP.
Percentage of national budget/resources committed to disaster risk reduction and climate change adaptation across sectors
Refers to the percentage of resources committed to disaster risk reduction and climate change adaptation from the national budget across different sectors.
% of reduction in natural and human-induced disaster mortality
Refers to the percentage reduction of deaths caused by natural and human-induced disasters.
Safeguard ecosystems and biodiversity
Proportion of fish stocks within safe biological limits
Refers to the percentage of fish stocks or species that are exploited within the level of maximum sustainable biological productivity (FAO).
Publish and use economic, social and environmental accounts in all governments and companies
Proportion of government departments and large companies (capitalisation above US$100 million equivalent) publishing economic, social and environmental accounts
Refers to the percentage of government departments and private companies having capitalisation above US$100 million equivalent that publish according to the System of Environmental-Economic Accounting.

86
Annex Table 4.5. Establish a sustainable, healthy and resilient environment for all: Targets and indicators
Target Indicator Definition/Note
Ensure sustainability in production, consumption and use of resources
Consumption of ozone-depleting chlorofluorocarbons (metric tonnes per capita)
Refers to the consumption of chlorofluorocarbons (carbon, chlorine and fluorine) that deplete the Earth’s ozone layer in metric tonnes per capita.
Greenhouse gas emissions (per capita and per US$1 GDP [PPP])
Greenhouse gases are those gaseous constituents of the atmosphere, both natural and anthropogenic, that absorb and emit radiation at specific wavelengths within the spectrum of infrared radiation emitted by the Earth’s surface, the atmosphere and clouds. This property causes the greenhouse effect. Water vapour (H2O), carbon dioxide (CO2), nitrous oxide (N2O), methane (CH4) and ozone (O3) are the primary greenhouse gases in the Earth’s atmosphere (Environment Canada 2013). Note: It should be noted that greenhouse gas emission intensity measures greenhouse gas emissions per unit of GDP.
CO2 emissions per capita, per US$1 GDP and total
Refers to per capita CO2 emissions, per US$1 GDP and total.
% change in particulate concentration in urban air
Particulate matter is the sum of all solid and liquid particles suspended in urban air, many of which are hazardous. This complex mixture includes both organic and inorganic particles, such as dust, pollen, soot, smoke and liquid droplets.
Provide universal access to safe drinking water at home, and in schools, health centres and refugee camps
% of urban population using basic drinking water
Refers to the percentage of the population who use any of the following types of water supply for drinking: piped water into dwelling, plot or yard, public tap/standpipe, borehole/tube well, protected dug well, protected spring, rainwater collection and bottled water (WHO and UNICEF 2014). This is a modified MDG indicator.
% of urban population using basic sanitation services
Refers to the percentage of the urban population with at least adequate access to excreta disposal facilities that can effectively prevent human, animal and insect contact with excreta (WHO and UNICEF 2014). This is a modified MDG indicator.
Reduce the vulnerability and exposure of local communities to disasters
% of area covered by early warning system
Refers to the percentage of area that are covered by early warning systems for natural disasters.
% of earthquake-resilient buildings and infrastructure
Refers to buildings and infrastructure that are designed to withstand earthquakes.
% of area covered by community-based disaster risk management
Refers to the percentage of area that is covered by disaster risk management using community-based approaches.
% of the population below a particular flood line (100-year flood, 10 years)
Refers to the percentage of the population who live below a “100-year flood in every 10 years” flood line. The “100-year flood” is an estimate of the long-term average recurrence interval, which does not mean that there really are 100 years between each major flood of greater or equal magnitude.
% of industrial sector with water management
Refers to the percentage of industries that have a water management mechanism.

87
Annex Table 4.6. Establish open, accountable, inclusive and effective institutions, rule of law and a peaceful and inclusive society: Targets and indicators
Target Indicator Definition/Note
Global
Provide free and universal legal identity, such as birth registrations
Percentage of children under 5 who are registered with the civil authority
Refers to the number of children under five years of age who registered with the civil authority as a percentage of the total population of children under five.
Proportion of adults with a basic legal identity document
Refers to the number of adults (individuals over 18 years of age) with a basic legal identity document as a percentage of the total adult population.
Monitor and end discrimination and inequalities in public service delivery, the rule of law, access to justice and participation in political and economic life on the basis of social status
Average time between filing a case and receiving a verdict
Refers to the average number of days that elapse between the time of filing a case and receiving a verdict.
Proportion of seats held by women and minorities in national or local-level government
In Bangladesh’s context, the indicator refers to the proportion of seats held by women and minorities in the national parliament.
% of adults with an account at a formal financial institution, disaggregated by sex
Denotes the percentage of the population with an account (self or together with someone else) at a bank, credit union, other financial institution (e.g., cooperative, microfinance institution) or post office (if applicable) including individuals who have a debit card (Demirguc-Kunt and Klapper 2012). Note: This is the same indicator as used under the goal area on energy and infrastructure, disaggregated by sex.
Improve personal safety
Prevalence of violence against women, including domestic violence
Violence against women is “any act of gender-based violence that results in, or is likely to result in, physical, sexual or mental harm or suffering to women, including threats of such acts, coercion or arbitrary deprivation of liberty, whether occurring in public or in private life” (UN 1993). Data would likely come from the BBS’s Violence Against Women Survey.
Violent death per 100,000 people Classification of violent death includes killings in war or conflicts, non-conflict deaths and self-inflicted deaths (suicides), while non-conflict deaths include intentional homicide, killings in self-defence, killings in legal interventions and non-intentional homicide (UNODC 2014).
Reduce bribery and corruption in all forms
Survey data regarding bribes or gifts for service from a government official – “In the past year, how often (if ever) have you had to pay a bribe, give a gift, or do a favour to government officials in order to get a document or receive a service”
Refers to the proportion of people who have paid a bribe in the past year at time of being surveyed.
Improve transparency in the revenue system
Share of eligible taxpayers who submit their taxes
Refers to the proportion of eligible taxpayers who submit their taxes for a given tax year as a percentage of eligible taxpayers.

88
Annex Table 4.6. Establish open, accountable, inclusive and effective institutions, rule of law and a peaceful and inclusive society: Targets and indicators
Target Indicator Definition/Note
National
Reduce bribery and corruption in all forms
Perception of corruption in political, judicial and law enforcement institutions
Transparency International’s Corruption Perceptions Index is one option but would not serve as an official source. Additional work would be needed to develop an official measure of corruption in Bangladesh.
Public perception of corruption in public administration
Transparency International’s Corruption Perceptions Index is one option but would not serve as an official source. Additional work would be needed to develop an official measure of corruption in Bangladesh.
Increase public participation in political processes and civic engagement at all levels
Number of ministry oversight hearings held by parliamentary committees
Refers to the number of oversight hearings for ministries or executive agencies held by parliamentary committees.
Number of stakeholder consultation meetings held by ministries/local governments
Refers to the number of stakeholder consultation meetings held by ministries/local governments. Stakeholders include national and local government representatives, research institutions, non-governmental organisations and the private sector.
Percentage of budget allocations directly benefiting the poor and disadvantaged groups such as women, ethnic minorities and the disabled
Refers to percentage of total government budget allocations which directly benefits the poor and disadvantaged groups such as women, ethnic minorities and the disabled
Number of CSOs that have officially participated and expressed their views in the process of developing and approving the national budget
Refers to the participation of CSOs in the process of both the development and approval of the national budget.
Guarantee the public’s right to information and access to government data
Number of government entities that regularly place reports on their budgets and expenditure on their websites
Refers to the number of government entities that publish their budget allocation and expenditure reports on a regular basis.
Improve transparency and strengthen accountability and integrity of public and private institutions
Percentage of queries attended to by government entities under the Right to Information Act
Refers to the percentage of information queries addressed by government entities under the Right to Information Act of 2009.
Ensure justice institutions are accessible, independent, well-resourced and respect due-process rights
Number of prosecutions by the Anti Corruption Commission in one year
Refers to the number of prosecutions against the number of convictions by the Anti Corruption Commission in one year.

89
Annex Table 4.6. Establish open, accountable, inclusive and effective institutions, rule of law and a peaceful and inclusive society: Targets and indicators
Target Indicator Definition/Note
Enhance the capacity, professionalism and accountability of the security forces, police and judiciary
Increase in overall Rule of Law Index score
The World Justice Project Rule of Law Index (2014) offers a detailed, multidimensional view of the extent to which countries adhere to the rule of law in practice and is the most comprehensive index of its kind. The index measures the rule of law using 47 indicators organised around eight themes: constraints on government powers, absence of corruption, open government, fundamental rights, order and security, regulatory enforcement, civil justice and criminal justice (World Justice Project 2014).
Annex Table 4.7. Establish a global partnership for sustainable development: Targets and indicators
Target Indicator Definition/Note
Global
Create an enabling environment for sustainable development
Low-income country debt forgiveness or reduction (% of GDP)
Debt forgiveness or reduction shows the change in debt stock due to debt forgiveness. It is derived by subtracting debt forgiven and debt stock reduction from debt buyback (World Bank 2014e).
Share of trade in goods and services from low-income countries under duty-free, quota-free market access
This indicator tracks the proportion of goods and services from low-income countries that enter developed countries under preferential market access.
Existence of laws for ensuring country-by-country reporting by multinational corporations, disclosure of beneficial ownership and the prevention of money laundering
Meant to provide an indication of countries’ efforts to address tax evasion and prevent money laundering.
Increase financing to productive capacity in low- and middle-income countries
Share of aid to the productive sector Aid is defined as ODA and other official flows. Productive sector defined as infrastructure, agriculture and manufacturing.
Proportion of foreign direct investment to the productive sector
Productive sector is defined as infrastructure, agriculture and manufacturing.
Share of South-South cooperation to the productive sector
Productive sector is defined as infrastructure, agriculture and manufacturing.
National
Promote an open, rule-based, predictable, accountable and non-discriminatory trading system
Average tariffs imposed by developed countries on agricultural products, textiles and clothing from developing countries
Refers to the average tariff rates that are imposed on agricultural products, textiles and clothing of developing countries by developed countries.
Percentage of trade to GDP Refers to the share of trade to GDP.

90
Annex Table 4.7. Establish a global partnership for sustainable development: Targets and indicators
Target Indicator Definition/Note
Implement reforms to ensure stability and transparency of the international financial system and encourage stable, long-term private foreign investment
Share of non-performing loans in banking system’s total loan portfolio
Refers to value of nonperforming loans divided by the total value of the loan portfolio (including non-performing loans before the deduction of specific loan-loss provisions). The loan amount recorded as non-performing should be the gross value of the loan as recorded on the balance sheet, not just the amount that is overdue (IMF).
Foreign direct investment to total investment ratio and foreign direct investment to GDP
Foreign direct investment refers to the net inflow of investment to acquire a lasting management interest (10 percent or more of voting stock) in an enterprise operating in an economy other than that of the investor. It is the sum of equity capital, reinvestment of earnings, other long-term capital and short-term capital as shown in the balance of payments (IMF).
Developed countries that have not done so should make concrete efforts towards the target of 0.7% of gross national income as ODA to developing countries and 0.15–0.20% of gross national income as ODA to LDCs; other countries should move towards voluntary targets for complementary financial assistance
% of gross national income to ODA Net ODA consists of disbursements of loans made on concessional terms (net of repayments of principal) and grants by official agencies of DAC members, by multilateral institutions and by non-DAC countries to promote economic development and welfare in countries and territories on the DAC list of ODA recipients. It includes loans with a grant element of at least 25 percent (calculated at a rate of discount of 10 percent) (OECD-DAC).
Enhance global collaboration for mobilisation of resources
Percentage of ODA received by developing countries from OECD/DAC countries
Refers to the percentage of ODA received by developing countries from OECD/DAC countries.
Percentage of ODA received by LDCs from OECD/DAC countries
Refers to the percentage of ODA received by LDCs from OECD/DAC countries. LDCs as defined by the UN-OHRLLS (2014).
Reduce illicit financial flows and tax evasion and increase stolen-asset recovery by $x
Illicit financial flows as a share of GDP Illicit financial flows are illegal movements of money or capital from one country to another. Global Financial Integrity classifies such movements as illicit flows when the money or capital are illegally earned, transferred and/or utilised.
Strengthen partnership in addressing challenges to humanity
Number of human-trafficking cases detected, prevented and prosecuted
UNODC (2004) defines trafficking in persons as the recruitment, transportation, transfer, harbouring or receipt of persons, by means of the threat or use of force or other forms of coercion, abduction, fraud, deception, the abuse of power or a position of vulnerability,

91
Annex Table 4.7. Establish a global partnership for sustainable development: Targets and indicators
Target Indicator Definition/Note
including human and drug trafficking, money laundering, and prevention of and action against extremism and terrorism
(disaggregated by sex, age and ethnicity)
or the giving or receiving of payments or benefits to achieve the consent of a person having control over another person, for the purpose of exploitation. At minimum, exploitation includes the exploitation of the prostitution of others or other forms of sexual exploitation, forced labour or services, slavery or practices similar to slavery, servitude and the removal of organs.
Basel Anti-Money Laundering Index The Basel Anti-Money Laundering Index assesses a country’s overall risk of money laundering/terrorist financing, but does not measure the actual existence of money laundering activity in a country. The overall risk score for a country indicates the risk level, meaning the vulnerability of a given country regarding money laundering and terrorist financing based on its adherence to anti-money laundering/counter-terrorism financing standards and other risk categories (ICAR 2014).
Percentage of intra-regional trade to GDP
Intra-regional trade refers to trade that focuses on economic exchange primarily between countries of the same region or economic zone.
Number of signed treaties involving an integrated transport network for intra- and inter-regional cooperation on trade facilitation
Refers to the number of treaties signed between governments to create an integrated transport network for intra- and inter-regional cooperation on trade facilitation. Trade facilitation can be defined as the simplification and harmonisation of international trade procedures including import and export procedures.
Annex Table 4.8. Ensure primary health services for all: Targets and indicators
Target Indicator Definition/Note
National
End/reduce preventable infant and under-5 deaths
Infant mortality rate (per 1,000 live births) (rural/urban by gender and wealth quintile)
Refers to the number of infants dying before reaching one year of age per 1,000 live births in a given year (UNICEF, WHO, World Bank, UN Population Division).
Under-5 child mortality rate (per 1,000 live births) (rural/urban by gender and wealth quintile)
Refers to the probability (expressed as a rate per 1,000 live births) of a child born in a specified year dying before reaching the age of five if subject to current age-specific mortality rates (UNICEF, WHO, World Bank, UN Population Division).
Decrease the maternal mortality ratio to no more than x per 100,000
Maternal mortality ratio (per 100,000 live births) (rural/urban by gender and wealth quintile)
Refers to the number of women who die from pregnancy-related causes while pregnant or within 42 days of pregnancy termination per 100,000 live births (WHO, UNICEF, UN Population Fund, World Bank and UN Population Division)
Ensure universal sexual and reproductive health and rights
Percentage of births attended by skilled health personnel
Refers to the percentage of deliveries attended by health personnel trained in providing lifesaving obstetric care, including giving the necessary supervision, care and advice to women during pregnancy, labour and the post-partum period, conducting deliveries on their own and caring for newborns. Traditional birth attendants, even if they receive a short training course, are not included (UNICEF).

92
Annex Table 4.8. Ensure primary health services for all: Targets and indicators
Target Indicator Definition/Note
Percentage of use of contraceptive methods
Refers to the percentage of women who are currently using, or whose sexual partner is currently using, at least one method of contraception, regardless of the method used. It is usually reported for married or in-union women aged 15–49 years (UNDESA 2014).
Percentage of unmet need for family planning
Refers to the percentage of women who are fecund and sexually active but are not using any method of contraception and report not wanting any more children. This is a subcategory of total unmet need for family planning, which also includes unmet need for spacing births. The concept of unmet need points to the gap between women’s reproductive intentions and their contraceptive behaviour (UNDESA).
Percentage of one-time antenatal care Refers to the percentage of women aged 15–49 years with a live birth in a given time period that received antenatal care provided by skilled health personnel (doctors, nurses or midwives) at least once during pregnancy, as a percentage of women age 15–49 years with a live birth in a given time period (WHO and UNICEF).
Total fertility rate Total fertility rate represents the number of children who would be born to a woman if she were to live to the end of her childbearing years and bear children in accordance with current age-specific fertility rates (UN).
Ensure basic health services for all
Doctor, nurse and paramedics-population ratio (rural/urban)
Refers to the total number of doctors, nurses and paramedics assigned for by region.

93
Annex 5. Key Resources Consulted for
Testing Data Adequecy at Country Level
Organisation Source/Web link
BBS Household Income and Expenditure Survey, different years
Labor Force Survey, different years
Multiple Indicator Cluster Survey, different years
Sample Vital Registration System, different years
Violence Against Women Survey, 2011
http://www.bbs.gov.bd
NIPORT Bangladesh Demographic and Health Survey, different years
http://www.niport.gov.bd
BANBEIS Bangladesh Educational Statistics, different years
http://banbeis.gov.bd
Directorate of Primary
Education, Ministry of
Primary and Mass
Education
Annual Primary School Census, different years
http://www.dpe.gov.bd
Department of
Environment, Ministry of
Environment and Forests
http://www.doe.gov.bd
Department of Disaster
Management, Ministry of
Disaster Management and
Relief
http://www.ddm.gov.bd
World Bank World Development Indicators, different years
http://databank.worldbank.org/data/reports.aspx?source=world-
development-indicators
UN http://unstats.un.org

94
Annex 6. Validation Workshop Participants
UN Development Programme
Mr Palash Das
Assistant Country Director,
Poverty Reduction
Bangladesh Bureau of Statistics
Mr Zobdul Hoque
Former Deputy Director General
Mr Md Shahabuddin Sarker
Deputy Director
National Accounting Wing
Directorate General of Health Services
Dr Ashish Kumar Saha
Assistant Director, MIS
World Bank
Mr Faizuddin Ahmed
Consultant
Statistics and Informatics Division, Ministry of Planning
Ms Riti Ibrahim
Former Secretary
Centre for Policy Dialogue
Professor Mustafizur Rahman
Executive Director
Dr Debapriya Bhattacharya
Distinguished Fellow
Dr Fahmida Khatun
Research Director
Dr Khondaker Golam Moazzem
Additional Research Director
Mr Towfiqul Islam Khan
Research Fellow
Mr Md Zafar Sadique
Senior Research Associate
Mr Mostafa Amir Sabbih
Research Associate

95
Annex 7. List of Goals, Targets and Indicators for the Bangladesh Case
Study
Annex Table 7.1. End poverty: Targets and indicators
Target Indicator Available Source Potential Source
Global
End extreme income poverty
Proportion of population below US$1.25 (PPP) per day BBS (HIES), World Bank (WDI)
Reduce poverty Proportion of population below US$2 (PPP) per day BBS (HIES), World Bank (WDI)
Proportion of population living below national poverty line BBS (HIES), World Bank (WDI)
Share of employed persons living below the nationally-defined poverty line
BBS (HIES)
Reduce the proportion of people who suffer from hunger
Prevalence of child stunting in boys and girls under 5, % NIPORT (BDHS), BBS (Child and Mother Nutrition Survey)
National
End extreme income poverty
Proportion of population below national extreme poverty line
BBS (HIES)
Reduce poverty Reduce severity index (squared poverty gap ratio) BBS (HIES), World Bank (WDI)
Percentage of population living in poverty according to the multidimensional poverty index
UN Development Programme
Reduce the proportion of people who suffer from hunger
Proportion of children under 5 years of age with low weight-for-height (wasting)
NIPORT (BDHS), BBS (Child and Mother Nutrition Survey)
Cover x% of poor and vulnerable people with social protection measures
Percentage of poor and vulnerable people under social protection measures
BBS

96
Annex Table 7.1. End poverty: Targets and indicators
Target Indicator Available Source Potential Source
End hunger and protect the right of all to have access to sufficient, safe, affordable and nutritious food
Proportion of people (by sex and age) consuming less than 2,122 kilocalories per day
BBS (HIES)
Proportion of people (by sex and age) consuming less than 1,805 kilocalories per day
BBS (HIES)
Per capita production of cereal BBS (HIES)
Improve nutritional status of pregnant women, lactating mothers and their newborns
Coverage of iron-folic acid supplements for pregnant women (%)
Institute of Public Health Nutrition, Helen Keller International, BBS (Child and Mother Nutrition Survey)
Annex Table 7.2. Ensure quality education for all: Targets and indicators
Target Indicator Available Source Potential Source
Global
Ensure all children have access to early childhood and quality primary and secondary education
% of girls and boys receiving at least one year in pre-primary programmes
Directorate of Primary Education (Annual Primary School Census), BBS (MICS)
% of girls and boys who complete primary school Directorate of Primary Education (Annual Primary School Census), BBS (MICS, SVRS)
% of girls and boys who complete secondary school BANBEIS
% of girls and boys who achieve a passing grade in national learning assessments at the primary school level
Directorate of Primary Education (Annual Primary School Census)
Increase the number of adults with skills, including technical and vocational skills
Proportion of individuals enrolled in a Technical and Vocational Education and Training (TVET) institution
BANBEIS
National
Ensure all children have access to early childhood
Dropout rate at secondary level, % BBS (MICS)
Teacher-student ratio by level of education BANBEIS, World Bank (WDI)

97
Annex Table 7.2. Ensure quality education for all: Targets and indicators
Target Indicator Available Source Potential Source
and quality primary and secondary education
Increase the number of adults with skills, including technical and vocational skills
Percentage of education budget for Technical and Vocational Education and Training
Ministry of Finance
Promote quality research (for knowledge creation/innovation)
Proportion of budget allocated to research and innovation Ministry of Finance
Number of research findings/innovations patented World Bank (WDI)
Annex Table 7.3. Create jobs, sustainable livelihoods, and inclusive growth for all: Targets and indicators
Target Indicator Available Source Potential Source
Global
Achieve full and
productive employment
for all, including women
and young people
Labour force participation rate BBS (LFS)
Time-related underemployment (thousands)
BBS
Ensure equal pay for
equal work
Mean nominal monthly earnings of employees (local
currency)
BBS
Support inclusive growth
and reduce inequality
Palma ratio BBS (HIES)
Gini coefficient BBS (HIES)
Growth rate of income of the bottom 40% BBS (HIES)

98
Annex Table 7.3. Create jobs, sustainable livelihoods, and inclusive growth for all: Targets and indicators
Target Indicator Available Source Potential Source
Gross fixed capital formation (% of GDP) BBS (National Accounts
Statistics), World Bank (WDI)
National
Achieve full and
productive employment
for all, including women
and young people
Proportion of own-account and contributing family workers
in total employment
International Labour
Organization Statistics
GDP per person engaged (or labour productivity) World Bank (WDI), BBS
% of formal employment as a share of total employment
by sex and type
BBS (LFS)
Reduce child labour and
eliminate worst forms of
child labour
Number of children removed from child labour BBS (MICS)
Reduce vulnerability of
workers and ensure their
rights and safety
Incidence of occupational injury among industrial workers
(%)
International Labour
Organization Statistics
Decrease the number of
young people not in
education, employment
or training by x%
% of skilled youth employed BBS (LFS)
% of youth employed BBS (LFS)
Increase new start-ups by
x and value addition in
new products by y
through creating an
enabling business
environment and
boosting
entrepreneurship
Number of new jobs created (by sector) BBS

99
Annex Table 7.3. Create jobs, sustainable livelihoods, and inclusive growth for all: Targets and indicators
Target Indicator Available Source Potential Source
Eliminate discrimination
against women in
political, economic and
public life
Labour force participation rate of women compared to men BBS (LFS)
Average number of hours per week of unpaid domestic
work (by sex)
BBS (Time Use Survey)
Proportion of women-owned or managed businesses BBS
Annex Table 7.4. Ensure sustainable energy and develop infrastructure for all: Targets and indicators
Target Indicator Available Source Potential Source
Global
Ensure full access to
developed infrastructure
and communication
technology
Internet users (per 1,000 people) World Bank (WDI), Bangladesh
Telecommunication Regulatory
Commission
Average bandwidth speed (megabits/second) Bangladesh
Telecommunications Company
Limited
% of the population with access to an all-season road BBS
% of adults with an account at a formal financial
institution
World Bank (Global Findex) BBS, Bangladesh Bank,
Microcredit Regulatory
Authority
Ensure access to energy
and improve efficiency and
sustainability of energy
supply, including
renewable energy
# of hours per day households have access to electricity
on average
BBS, Bangladesh Power
Development Board
Rate of improvement in energy intensity Bangladesh Power
Development Board
Share of the population with access to modern cooking
solutions (%)
Bangladesh Power
Development Board
Share of renewable energy to total energy consumption Bangladesh Power
Development Board
National
% of households with access to electricity (rural/urban) World Bank (WDI)

100
Annex Table 7.4. Ensure sustainable energy and develop infrastructure for all: Targets and indicators
Target Indicator Available Source Potential Source
Ensure access to energy
and improve efficiency and
sustainability of energy
supply, including
renewable energy
Per capita consumption of electricity BBS (HIES)
Increase use of energy-
efficient transport and
infrastructure
% using railway as mode of transport (passenger/freight) BBS (Statistical Yearbook)
Annex Table 7.5. Establish a sustainable, healthy and resilient environment for all: Targets and indicators
Target Indicator Available Source Potential Source
Global
Build resilience and
reduce deaths from
natural hazards
Disaster deaths per 1,000 inhabitants Department of Disaster
Management, Ministry of
Disaster Management and
Relief
Safeguard ecosystems
and biodiversity
Net loss in forest area (% of land area) World Bank (WDI)
Trends in coverage of protected areas Ministry of Environment and
Forests
Publish and use
economic, social and
environmental accounts
in all governments and
companies
Share of large tax unit taxpayers using integrated reporting National Board of Revenue,
Ministry of Finance
Existence of national and sub-national government
publishing according to the System of Environmental-
Economic Accounting
Department of Environment,
Ministry of Environment and
Forests
National
Build resilience and
reduce deaths from
natural hazards
Proportion of disaster-related economic loss (% of GDP) Department of Disaster
Management, Ministry of
Disaster Management and
Relief
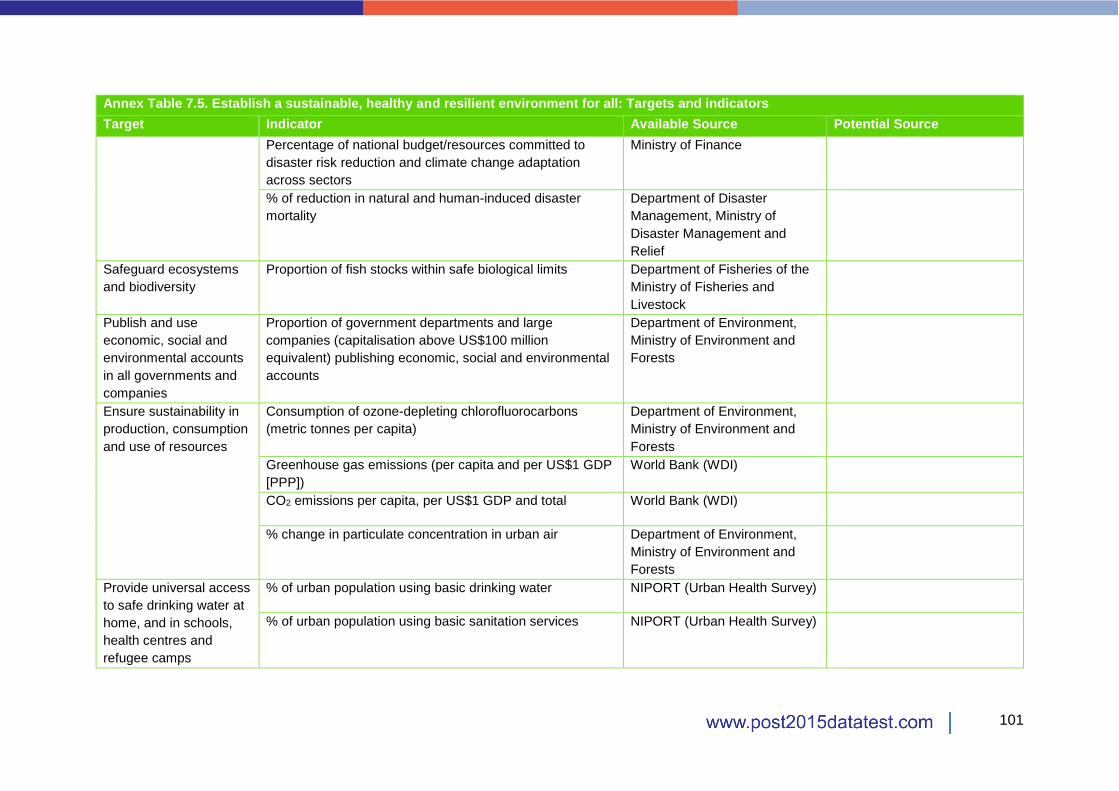
101
Annex Table 7.5. Establish a sustainable, healthy and resilient environment for all: Targets and indicators
Target Indicator Available Source Potential Source
Percentage of national budget/resources committed to
disaster risk reduction and climate change adaptation
across sectors
Ministry of Finance
% of reduction in natural and human-induced disaster
mortality
Department of Disaster
Management, Ministry of
Disaster Management and
Relief
Safeguard ecosystems
and biodiversity
Proportion of fish stocks within safe biological limits Department of Fisheries of the
Ministry of Fisheries and
Livestock
Publish and use
economic, social and
environmental accounts
in all governments and
companies
Proportion of government departments and large
companies (capitalisation above US$100 million
equivalent) publishing economic, social and environmental
accounts
Department of Environment,
Ministry of Environment and
Forests
Ensure sustainability in
production, consumption
and use of resources
Consumption of ozone-depleting chlorofluorocarbons
(metric tonnes per capita)
Department of Environment,
Ministry of Environment and
Forests
Greenhouse gas emissions (per capita and per US$1 GDP
[PPP])
World Bank (WDI)
CO2 emissions per capita, per US$1 GDP and total World Bank (WDI)
% change in particulate concentration in urban air Department of Environment,
Ministry of Environment and
Forests
Provide universal access
to safe drinking water at
home, and in schools,
health centres and
refugee camps
% of urban population using basic drinking water NIPORT (Urban Health Survey)
% of urban population using basic sanitation services NIPORT (Urban Health Survey)

102
Annex Table 7.5. Establish a sustainable, healthy and resilient environment for all: Targets and indicators
Target Indicator Available Source Potential Source
Reduce the vulnerability
and exposure of local
communities to disasters
% of area covered by early warning system Department of Disaster
Management, Ministry of
Disaster Management and
Relief
% of earthquake-resilient buildings and infrastructure Department of Disaster
Management, Ministry of
Disaster Management and
Relief
% of area covered by community-based disaster risk
management
Department of Disaster
Management, Ministry of
Disaster Management and
Relief
% of the population below a particular flood line (100-year
flood, 10 years)
BBS
% of industrial sector with water management Ministry of Information
Annex Table 7.6. Establish open, accountable, inclusive and effective institutions, rule of law and a peaceful and inclusive society: Targets and
indicators
Target Indicator Available Source Potential Source
Global
Provide free and universal
legal identity, such as birth
registrations
Percentage of children under 5 who are registered
with the civil authority
BBS (MICS)
Proportion of adults with a basic legal identity
document
Election Commission (National
Identity Registration Wing),
BBS
Monitor and end
discrimination and
inequalities in public service
delivery, the rule of law,
access to justice and
Average time between filing a case and receiving a
verdict
Ministry of Law, Justice and
Parliamentary Affairs
Proportion of seats held by women and minorities in
national or local-level government
UN Statistics Division Ministry of Law, Justice and
Parliamentary Affairs, Local
Government Division of the

103
Annex Table 7.6. Establish open, accountable, inclusive and effective institutions, rule of law and a peaceful and inclusive society: Targets and
indicators
Target Indicator Available Source Potential Source
participation in political and
economic life on the basis
of social status
Ministry of Local Development,
Rural Development and Co-
operatives, Election
Commission
% of adults with an account at a formal financial
institution, disaggregated by sex
BBS,
World Bank (Global Findex)
Improve personal safety Prevalence of violence against women, including
domestic violence
BBS (Violence Against Women
Survey),
NIPORT (BDHS)
Violent death per 100,000 people UN Office on Drugs and Crime
(Homicide Statistics),
Ministry of Home Affairs, BBS
Reduce bribery and
corruption in all forms
Survey data regarding bribes or gifts for service from a
government official – “In the past year, how often (if
ever) have you had to pay a bribe, give a gift, or do a
favour to government officials in order to get a
document or receive a service”
Transparency International
Bangladesh, BBS
Improve transparency in the
revenue system
Share of eligible taxpayers who submit their taxes Transparency International
Bangladesh, BBS, Anti
Corruption Commission
National
Reduce bribery and
corruption in all forms
Perception of corruption in political, judicial and law
enforcement institutions
Transparency International
Bangladesh, BBS, Anti
Corruption Commission
Public perception of corruption in public administration Transparency International
Bangladesh, BBS, Anti
Corruption Commission

104
Annex Table 7.6. Establish open, accountable, inclusive and effective institutions, rule of law and a peaceful and inclusive society: Targets and
indicators
Target Indicator Available Source Potential Source
Increase public participation
in political processes and
civic engagement at all
levels
Number of ministry oversight hearings held by
parliamentary committees
Ministry of Law, Justice and
Parliamentary Affairs
Number of stakeholder consultation meetings held by
ministries/local governments
Ministry of Law, Justice and
Parliamentary Affairs, Local
Government Division of the
Ministry of Local Development,
Rural Development and Co-
operatives
Percentage of budget allocations directly benefiting
the poor and disadvantaged groups such as women,
ethnic minorities and the disabled
Ministry of Finance
Number of CSOs that have officially participated and
expressed their views in the process of developing
and approving the national budget
Ministry of Finance
Guarantee the public’s right
to information and access
to government data
Number of government entities that regularly place
reports on their budgets and expenditure on their
websites
Local Government Division of
the Ministry of Local
Development, Rural
Development and Co-
operatives, Information
Commission
Improve transparency and
strengthen accountability
and integrity of public and
private institutions
Percentage of queries attended to by government
entities under the Right to Information Act
Information Commission
Ensure justice institutions
are accessible,
independent, well-
resourced and respect due-
process rights
Number of prosecutions by the Anti Corruption
Commission in one year
Anti Corruption Commission
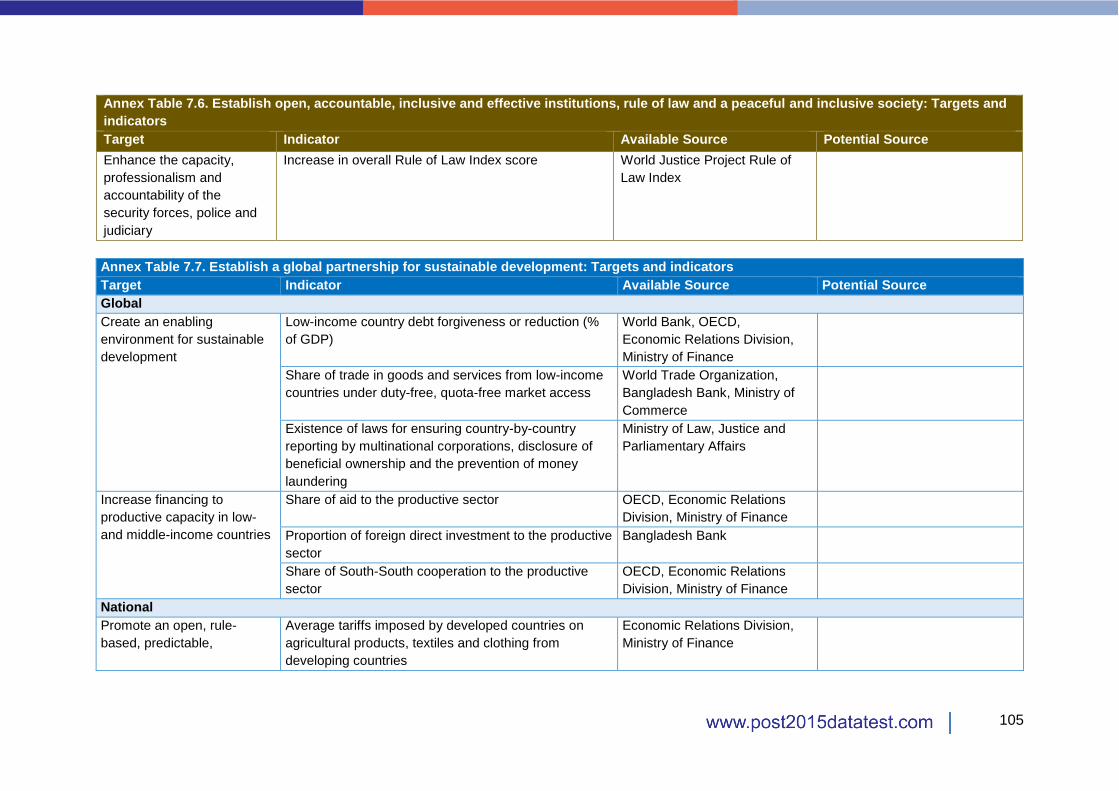
105
Annex Table 7.6. Establish open, accountable, inclusive and effective institutions, rule of law and a peaceful and inclusive society: Targets and
indicators
Target Indicator Available Source Potential Source
Enhance the capacity,
professionalism and
accountability of the
security forces, police and
judiciary
Increase in overall Rule of Law Index score World Justice Project Rule of
Law Index
Annex Table 7.7. Establish a global partnership for sustainable development: Targets and indicators
Target Indicator Available Source Potential Source
Global
Create an enabling
environment for sustainable
development
Low-income country debt forgiveness or reduction (%
of GDP)
World Bank, OECD,
Economic Relations Division,
Ministry of Finance
Share of trade in goods and services from low-income
countries under duty-free, quota-free market access
World Trade Organization,
Bangladesh Bank, Ministry of
Commerce
Existence of laws for ensuring country-by-country
reporting by multinational corporations, disclosure of
beneficial ownership and the prevention of money
laundering
Ministry of Law, Justice and
Parliamentary Affairs
Increase financing to
productive capacity in low-
and middle-income countries
Share of aid to the productive sector OECD, Economic Relations
Division, Ministry of Finance
Proportion of foreign direct investment to the productive
sector
Bangladesh Bank
Share of South-South cooperation to the productive
sector
OECD, Economic Relations
Division, Ministry of Finance
National
Promote an open, rule-
based, predictable,
Average tariffs imposed by developed countries on
agricultural products, textiles and clothing from
developing countries
Economic Relations Division,
Ministry of Finance
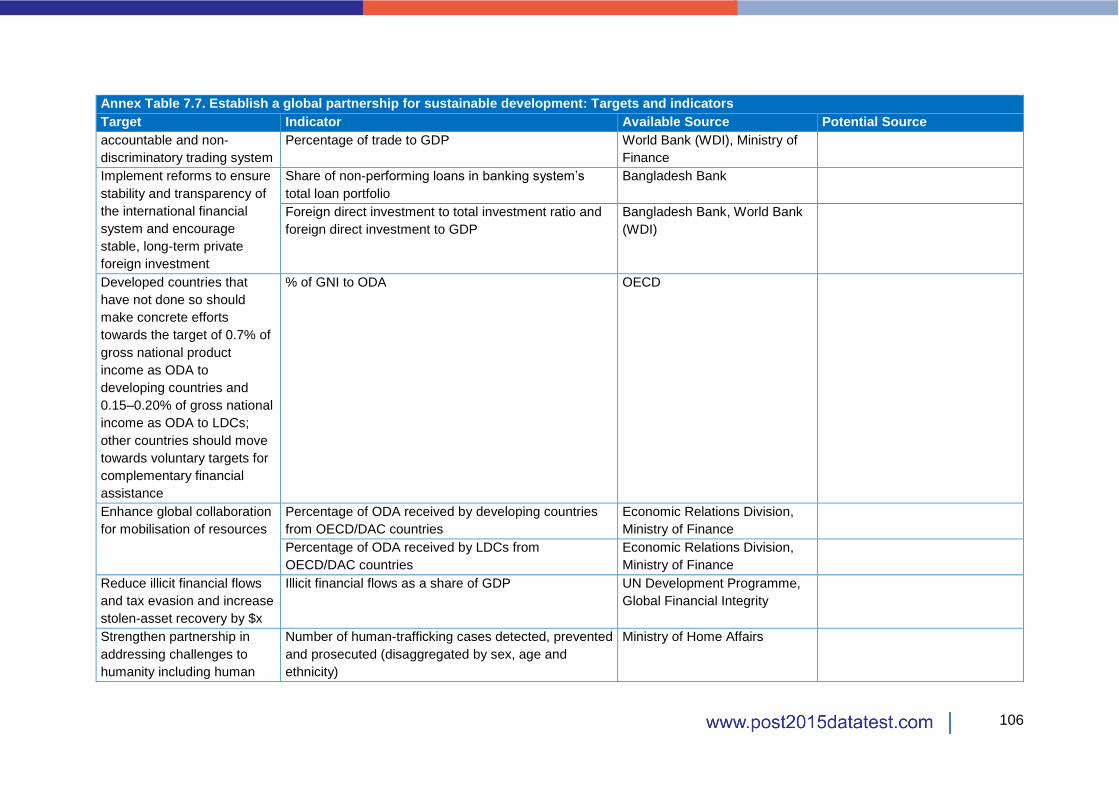
106
Annex Table 7.7. Establish a global partnership for sustainable development: Targets and indicators
Target Indicator Available Source Potential Source
accountable and non-
discriminatory trading system
Percentage of trade to GDP World Bank (WDI), Ministry of
Finance
Implement reforms to ensure
stability and transparency of
the international financial
system and encourage
stable, long-term private
foreign investment
Share of non-performing loans in banking system’s
total loan portfolio
Bangladesh Bank
Foreign direct investment to total investment ratio and
foreign direct investment to GDP
Bangladesh Bank, World Bank
(WDI)
Developed countries that
have not done so should
make concrete efforts
towards the target of 0.7% of
gross national product
income as ODA to
developing countries and
0.15–0.20% of gross national
income as ODA to LDCs;
other countries should move
towards voluntary targets for
complementary financial
assistance
% of GNI to ODA OECD
Enhance global collaboration
for mobilisation of resources
Percentage of ODA received by developing countries
from OECD/DAC countries
Economic Relations Division,
Ministry of Finance
Percentage of ODA received by LDCs from
OECD/DAC countries
Economic Relations Division,
Ministry of Finance
Reduce illicit financial flows
and tax evasion and increase
stolen-asset recovery by $x
Illicit financial flows as a share of GDP UN Development Programme,
Global Financial Integrity
Strengthen partnership in
addressing challenges to
humanity including human
Number of human-trafficking cases detected, prevented
and prosecuted (disaggregated by sex, age and
ethnicity)
Ministry of Home Affairs

107
Annex Table 7.7. Establish a global partnership for sustainable development: Targets and indicators
Target Indicator Available Source Potential Source
and drug trafficking, money
laundering, and prevention of
and action against extremism
and terrorism
Basel Anti-Money Laundering Index Basel Anti-Money Laundering
Index
Percentage of intra-regional trade to GDP World Trade Organization, UN
Conference on Trade and
Development, National Board of
Revenue of the Ministry of
Finance, Ministry of Commerce
Number of signed treaties involving an integrated
transport network for intra- and inter-regional
cooperation on trade facilitation
World Trade Organization,
Ministry of Road Transport and
Bridges
Annex Table 7.8. Ensure primary health services for all: Targets and indicators
Target Indicator Available Source Potential Source
National
End/reduce preventable
infant and under-5 deaths
Infant mortality rate (per 1,000 live births) NIPORT (BDHS), BBS (MICS)
Under-5 child mortality rate (per 1,000 live births) NIPORT (BDHS), BBS (MICS)
Decrease the maternal
mortality ratio to no more
than x per 100,000
Maternal mortality ratio (per 100,000 live births) NIPORT (Bangladesh Maternal
Mortality and Health Care
Survey), BBS (SVRS)
Ensure universal sexual and
reproductive health and
rights
Percentage of births attended by skilled health
personnel
NIPORT (BDHS),
Percentage of use of contraceptive methods NIPORT (BDHS), BBS (SVRS)
Percentage of unmet need for family planning NIPORT (BDHS), BBS (SVRS)
Percentage of one-time antenatal care NIPORT (BDHS)
Total fertility rate BBS (SVRS)
Ensure basic health services
for all
Doctor, nurse and paramedics-population ratio
(rural/urban)
World Bank (WDI), Ministry of
Health and Family Welfare
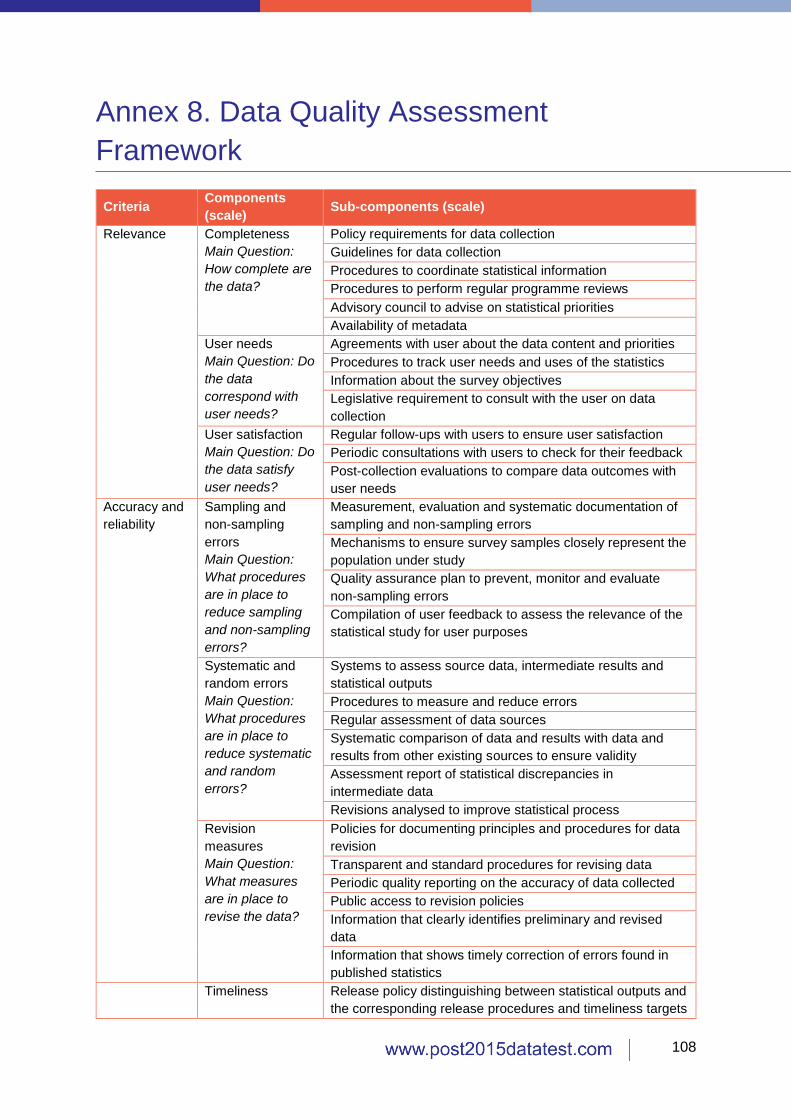
108
Annex 8. Data Quality Assessment
Framework
Criteria Components
(scale) Sub-components (scale)
Relevance Completeness
Main Question:
How complete are
the data?
Policy requirements for data collection
Guidelines for data collection
Procedures to coordinate statistical information
Procedures to perform regular programme reviews
Advisory council to advise on statistical priorities
Availability of metadata
User needs
Main Question: Do
the data
correspond with
user needs?
Agreements with user about the data content and priorities
Procedures to track user needs and uses of the statistics
Information about the survey objectives
Legislative requirement to consult with the user on data
collection
User satisfaction
Main Question: Do
the data satisfy
user needs?
Regular follow-ups with users to ensure user satisfaction
Periodic consultations with users to check for their feedback
Post-collection evaluations to compare data outcomes with
user needs
Accuracy and
reliability
Sampling and
non-sampling
errors
Main Question:
What procedures
are in place to
reduce sampling
and non-sampling
errors?
Measurement, evaluation and systematic documentation of
sampling and non-sampling errors
Mechanisms to ensure survey samples closely represent the
population under study
Quality assurance plan to prevent, monitor and evaluate
non-sampling errors
Compilation of user feedback to assess the relevance of the
statistical study for user purposes
Systematic and
random errors
Main Question:
What procedures
are in place to
reduce systematic
and random
errors?
Systems to assess source data, intermediate results and
statistical outputs
Procedures to measure and reduce errors
Regular assessment of data sources
Systematic comparison of data and results with data and
results from other existing sources to ensure validity
Assessment report of statistical discrepancies in
intermediate data
Revisions analysed to improve statistical process
Revision
measures
Main Question:
What measures
are in place to
revise the data?
Policies for documenting principles and procedures for data
revision
Transparent and standard procedures for revising data
Periodic quality reporting on the accuracy of data collected
Public access to revision policies
Information that clearly identifies preliminary and revised
data
Information that shows timely correction of errors found in
published statistics
Timeliness Release policy distinguishing between statistical outputs and
the corresponding release procedures and timeliness targets

109
Criteria Components
(scale) Sub-components (scale)
Timeliness
and
punctuality
Main Question:
How quickly are
the data released
for dissemination
or further
processing?
Compliance with timeliness targets like the International
Monetary Fund data dissemination standards
Official calendar to announce advance release dates of
major statistics
Attainable schedule for the production process
Maximum time allowed to elapse between the end of the
reference period and the availability of the data
Procedures to ensure timely and effective flow of data from
providers
Procedures to consult with users about the periodicity of the
statistics
Punctuality
Main Question:
Whether the data
are delivered
according to the
official due date?
Action or contingency plans to address delays in data
release date
Procedures to regularly monitor the punctuality of every
release as per the release calendar
Notifications provided for any divergences from the
advanced release time and publication of new release dates
Formal explanations provided in the event of a delay
Accessibility
and clarity
Accessibility
Main Question:
How easily are the
data accessible?
Data dissemination strategy and policy, including clear
pricing policy for governing the dissemination
Policy or guideline to ensure that the data are made
available to all users (including any restrictions that may
apply)
Strategies to release data, metadata and microdata
Availability of publication catalogues for users
Application of information and communication technology to
disseminate data (in addition to hard copy publications)
Navigable website that allows users to access data and
metadata and facilitates self-tabulation in a variety of formats
Periodic consultation with users to ensure dissemination
formats satisfy user needs
Procedures to request data that are not readily available to
the public
Clarity
Main Question:
How clearly are
the data presented
to all users?
Guidelines describing the appropriate content and preferred
formats and style of the agency's outputs
Presentation of statistics that facilitate proper interpretation
and meaningful comparisons
Regular production of up-to-date methodological documents
and quality reports
Staff training and development programmes for writing about
statistics
User support or information services for handling questions
related to the data
Procedure to annotate differences between international
standards, guidelines or good practices
Statistics presented in a clear and understandable manner
Explanatory texts accompany the data
Meaningful comparisons included in the publication

110
Criteria Components
(scale) Sub-components (scale)
Metadata and
microdata
Main Question:
How accessible
and readable are
the metadata and
microdata?
Policies to provide documentation on concepts, scope,
classifications, data sources, basis of recording, compilation
methods, etc. with the release of statistical results
Procedures to ensure metadata are documented according
to standardised metadata systems
Procedures to ensure metadata are updated regularly
Availability of microdata
Rules and protocols for accessing microdata
Coherence
and
comparability
Consistency
Main Question:
How consistent
are the data
internally or cross-
sectorally?
Policy promoting cooperation and exchange of knowledge
between individual statistical programmes/domains
Specific guidelines for individual statistical
programmes/domains to ensure outputs obtained from
complementary sources are properly combined
Process-specific procedures to ensure outputs are internally
coherent
Information provided to users on the effects of changes in
methodologies on final estimates
Comparability
Main Question:
How comparably
are the data over
time?
Extent to which statistics derived from different sources or
different periodicities are comparable
Clear explanation and reconciliation provided for any
methodological changes or differences
Analysis of the major related statistics before designing a
new individual statistical programme/domain
Comparison provided with other statistical sources that
contain the same or similar information (including
identification of divergences with explanations)
Standardisation
Main Question:
Are the data
produced using
common
standards with
respect to scope,
definitions,
classifications and
units?
Common standards for concepts, definitions, units and
classifications to promote coherence, consistency and
comparability of the statistics
Periodic assessment of compliance with international and
national standards for statistical production
Explanation provided for any deviations from international
and national standards to users
Reference made to common repository of concepts,
definitions and classifications when designing a new
individual statistical programme/domain
Quality reporting includes assessment of internal
consistency and comparability over time

111
Published on 23 September 2015
Centre for Policy Dialogue (CPD)
House – 6/2, Block – F, Kazi Nazrul Islam Road Lalmatia Housing Estate Dhaka 1207, Bangladesh
Telephone: (+88 02) 8124770, 9141734, 9141703 Fax: (+88 02) 8130951 Web: http://cpd.org.bd/
E-mail: [email protected]
The Norman Paterson School of International Affairs 5306 River Building
1125 Colonel By Drive Ottawa, Ontario K1S 5B6 Canada
Telephone: 613-520-6655 Fax: 613-520-2889
E-mail: [email protected] Web: https://carleton.ca/npsia/
Southern Voice on Post-MDG International Development Goals
House – 6/2, Block – F, Kazi Nazrul Islam Road Lalmatia Housing Estate Dhaka 1207, Bangladesh
Telephone: (+88 02) 8124770, 9141734, 9141703 Fax: (+88 02) 8130951
Web: http://southernvoice-postmdg.org E-mail: [email protected]