measuring flow through a bulb turbine at rock island dam ...aqflow.com/reports/waterpowerxii.pdf ·...
TRANSCRIPT
Measuring Flow Through A Bulb Turbine At Rock Island Dam Using An Acoustic Scintillation Flow Meter
David D. Lemon and Ward Cartier, ASL Environmental Sciences Inc., Sidney, B.C. and Brett Bickford, Public Utility District No. 1 of Chelan Co., Wenatchee, WA
ABSTRACT Recent optimization work at Rock Island Powerhouse Two on the Columbia River by Public Utility District No. 1 of Chelan Co., has afforded the opportunity to utilize the Acoustic Scintillation Flow Meter (ASFM) system to perform discharge measurements in a run-of-the-river horizontal-shaft bulb turbine. The intakes to these turbines present particular problems in making absolute measurements of the turbine flow. The ASFM was chosen for the absolute flow measurements at Unit U6 because of its ability to measure flow using unobtrusive acoustic paths oriented directly across the intake. The absolute flow was measured at two heads, over a series of discharges covering the full operating range of the turbine. Sufficient transducers were available for the instrument to install ten acoustic paths in one bay and twenty in the other. The additional density in one bay allowed a determination of the effect of the trash rack support structures on the vertical variations in the flow field. The contribution of this variability to the uncertainty in the absolute flow measurement, along with the uncertainty in the measurement of the flows in the boundary zones at the top and bottom of the measurement section, are discussed. Introduction Public Utility District No. 1 of Chelan Co. has undertaken a plant optimization program for its Rocky Reach and Rock Island Hydro-projects on the Columbia River in Washington State. As part of that program, a series of index tests combined with absolute flow measurements at selected units were required, one of which was Unit U6 at Powerhouse Two Rock Island Dam (shown in Figure 1). The intakes to these turbines present particular problems in making absolute measurements of the turbine flow. The Acoustic Scintillation Flow Meter (ASFM) was chosen for the absolute flow measurements at Unit U6 because of its ability to measure flow using acoustic paths oriented directly across the intake with minimal obstructions being placed in the flow. Since there are only two bays per intake at Powerhouse Two, sufficient transducers were available for the instrument during the tests to install ten acoustic paths in one bay and twenty in the other. The additional sampling density in one bay allowed a

determination of the effect of the trash rack support structures on the vertical variations in the flow field. Frames installed in the head gate slots were used to mount the instrument’s acoustic transducers. The absolute flow through Unit U6 was measured at two heads, over a series of discharges covering the full on-cam, operating range of the turbine. Plant Configuration Rock Island Dam is located at river mile 453.4 on the Columbia River in Washington State. The primary purpose of the project is hydroelectric power generation. Powerhouse One generator nameplate capacities are: 3 @ 20.7 MW, 1 @ 15 MW, 6 @ 22.5 for a total of 212 MW. Powerhouse Two nameplate capacities are 8 @ 54 MW for a total of 432 MW. The project nameplate total capacity is 622.5 MW. Total peak capacity is 660 MW with a total hydraulic capacity of 220,000 cfs.
Figure 1: Aerial view of spillway and Powerhouse Two at Rock Island Dam.
Powerhouse Two is equipped with eight horizontal-shaft bulb turbines manufactured by Neyrpic, each rated at 72,000 horsepower. Each intake has two bays, 15.1 metres high by 6.1 metres wide at the location of the head gate, which is 5.5 metres downstream of the trash-rack at its midpoint elevation. The intake converges from 20 metres vertically, at the entrance, to 15.1 metres at the head gate. One metre downstream of the head gate, the intake again converges sharply both horizontally and vertically as it approaches the nose of the bulb turbine.
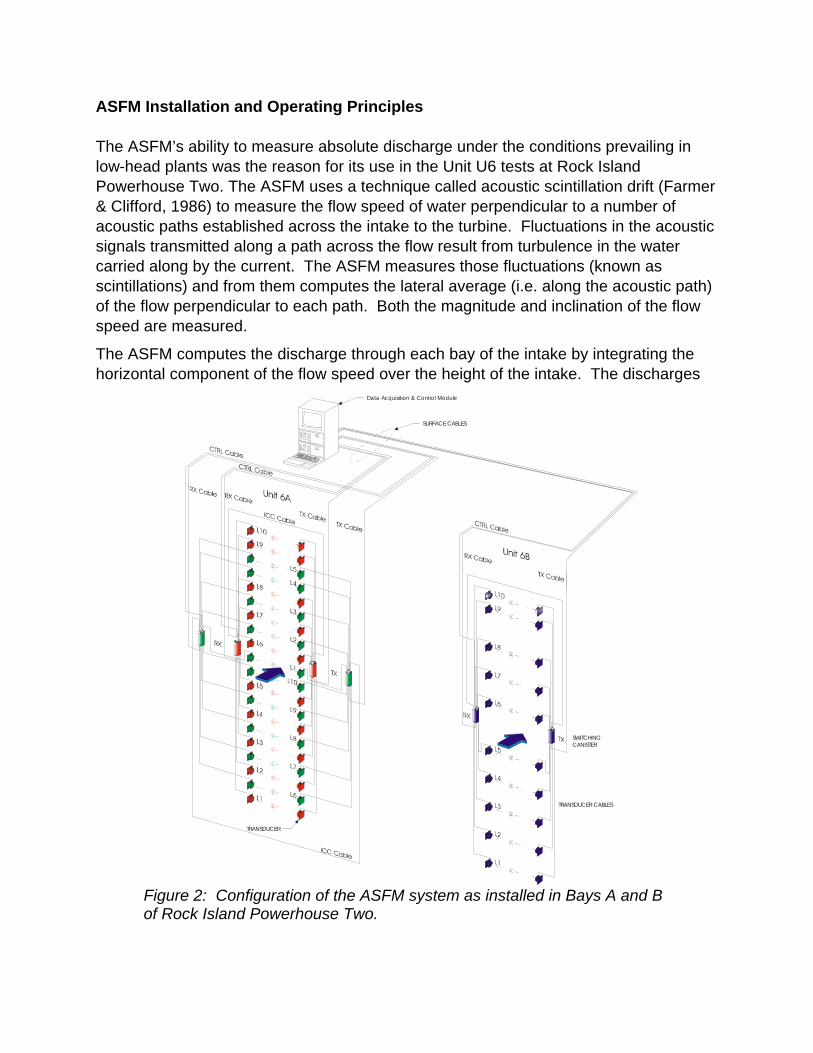
ASFM Installation and Operating Principles The ASFM’s ability to measure absolute discharge under the conditions prevailing in low-head plants was the reason for its use in the Unit U6 tests at Rock Island Powerhouse Two. The ASFM uses a technique called acoustic scintillation drift (Farmer & Clifford, 1986) to measure the flow speed of water perpendicular to a number of acoustic paths established across the intake to the turbine. Fluctuations in the acoustic signals transmitted along a path across the flow result from turbulence in the water carried along by the current. The ASFM measures those fluctuations (known as scintillations) and from them computes the lateral average (i.e. along the acoustic path) of the flow perpendicular to each path. Both the magnitude and inclination of the flow speed are measured.
The ASFM computes the discharge through each bay of the intake by integrating the horizontal component of the flow speed over the height of the intake. The discharges
Figure 2: Configuration of the ASFM system as installed in Bays A and B of Rock Island Powerhouse Two.
Data Acquisition & Control Module
SWITCHINGCANISTER
TRANSDUCER CABLES
SURFACE CABLES
TRANSDUCER

from each bay are then summed for the total discharge. Since 1992, the ASFM has been used in several hydro-electric plants and in some instances compared with other discharge measurement methods such as current meters (Lemon, 1995; Lemon, Caron, Cartier & Proulx, 1998; Lemon et al, 1998).
The ASFM was utilized for absolute flow measurement during testing in August 2000 in the head gate slots of Unit U6, Powerhouse Two. Unit U6 has two intake bays, one of which was equipped with 10 acoustic paths and the other with 20 as shown in Figure 2 above. The transducers were installed on two support frames, one for each bay. The transducer support frames were designed by Klohn-Crippen Ltd. and constructed by Chelan County PUD. Figure 3 shows the location of the measurement plane in the intake and its relationship to the four horizontal trashrack support beams in the entrance to the intake, and the definition of the quantities measured.
Figure 3: Location of the measurement plane in the intake, and definition of associated parameters.
Data Collection Successful operation of the ASFM requires that the transducer mountings be free of vibration within the frequency range of the acoustic fluctuations caused by the turbulence, otherwise significant contamination of the data will occur. The possibility of structural vibration was a major concern for the bulb units prior to the installation of the
v (z) θ (z)
REF 49.452 ft ( 15.073 meters)
z
H
REF 0.0 ft (meters)
F l o w
0 1 2 3 4 5 Scale (m)
0 5 10 15
Scale (ft)

ASFM. Consequently, Chelan PUD conducted a vibration analysis of the of the headgate slot rails to identify the existing vibration environment, which Klohn-Crippen and Chelan used to include vibration isolators in the design and construction of the frames. The frames performed exceptionally well, and vibration was not a factor.
Two sets of measurements were made, consisting of a higher head test at 42 feet head, followed by a lower head test at 38 feet. Cam curve verification was done by performing index tests with Winter-Kennedy taps independently of the ASFM tests. Index Test Measurements Hydroturbine efficiency tests (index tests) described here followed the general procedures and requirements of ASME PTC 18-1992 Hydraulic Turbines. Reference is also made to IEC Publication 41-1991 International Code for the Field Acceptance Tests of Hydroturbines for some aspects of the test program.
The test program for each unit was conducted in two parts. The first tests were to perform index (relative) efficiency tests, conducted for the purpose of determining the optimum blade-gate relationship for unit operation and for identifying the peak efficiency points on all units. The absolute efficiency tests were then conducted at specified points along the efficiency/power curve as determined from the index tests.
Data was collected to allow the generator losses and intake losses to be assessed separately, so that the gross unit efficiency (combined generator/turbine from headwater to tailwater), net unit efficiency (combined generator/turbine from turbine inlet to tailwater), and turbine efficiency (turbine only from turbine inlet to tailwater) could be determined.
The turbine output power was measured using the indirect method, in which the generator serves as a dynamometer, using the electrical output and the generator efficiency curve to arrive at the shaft horsepower delivered by the turbine. Standard tables were used to determine local gravitational acceleration for the plant location, and water weight density from temperature and gravitational acceleration. The gross head was determined from measurement of the headwater elevation at the unit and the tailwater elevation at the draft tube exit. The net head was determined from measurement of water surface elevation in the intake bay (inlet head) and of the tailwater elevation at the draft tube exit, taking into account the velocity heads at these two sections. Relative flow rate was determined from the pressure differential on the Winter-Kennedy taps. Absolute Velocity and Discharge Measurements: ASFM The flow rate for the absolute efficiency tests was measured using an Acoustic Scintillation Flow Meter (ASFM) mounted on fixed frames installed in a gate slot at each
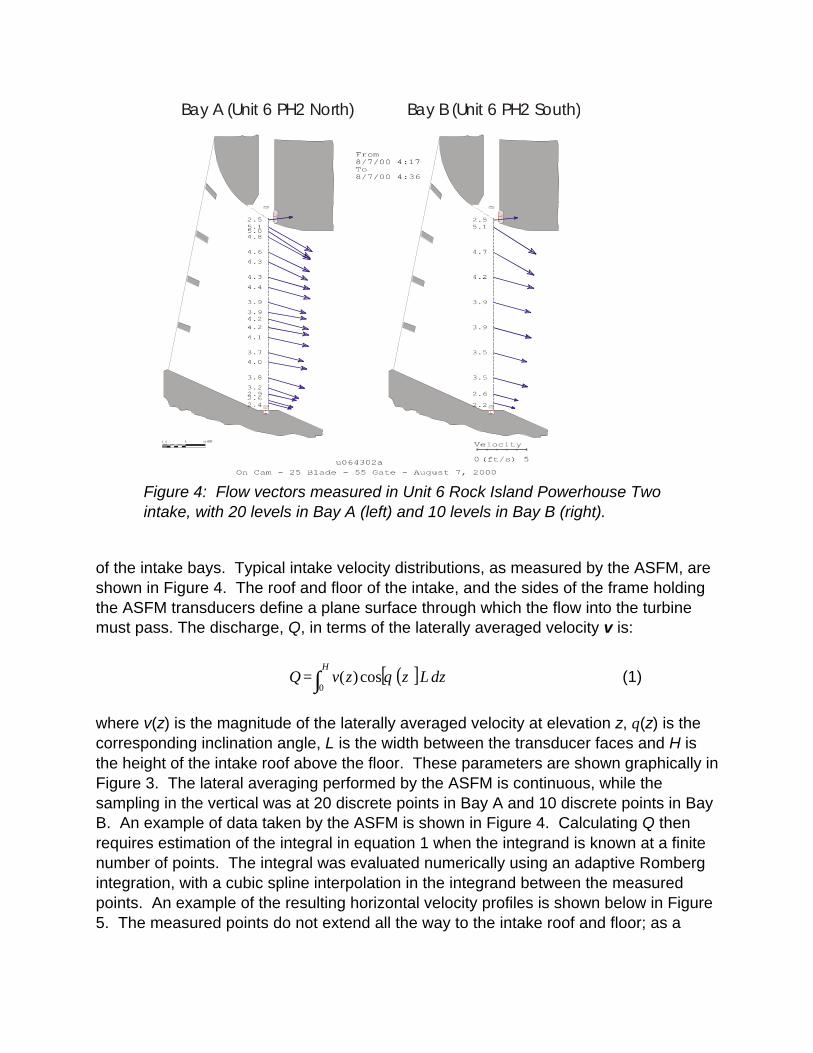
Figure 4: Flow vectors measured in Unit 6 Rock Island Powerhouse Two intake, with 20 levels in Bay A (left) and 10 levels in Bay B (right).
of the intake bays. Typical intake velocity distributions, as measured by the ASFM, are shown in Figure 4. The roof and floor of the intake, and the sides of the frame holding the ASFM transducers define a plane surface through which the flow into the turbine must pass. The discharge, Q, in terms of the laterally averaged velocity v is:
( )[ ] dzLzzvQH
∫=0
cos)( θ (1)
where v(z) is the magnitude of the laterally averaged velocity at elevation z, θ(z) is the corresponding inclination angle, L is the width between the transducer faces and H is the height of the intake roof above the floor. These parameters are shown graphically in Figure 3. The lateral averaging performed by the ASFM is continuous, while the sampling in the vertical was at 20 discrete points in Bay A and 10 discrete points in Bay B. An example of data taken by the ASFM is shown in Figure 4. Calculating Q then requires estimation of the integral in equation 1 when the integrand is known at a finite number of points. The integral was evaluated numerically using an adaptive Romberg integration, with a cubic spline interpolation in the integrand between the measured points. An example of the resulting horizontal velocity profiles is shown below in Figure 5. The measured points do not extend all the way to the intake roof and floor; as a
10 FEET
Bay A (Unit 6 PH2 North) Bay B (Unit 6 PH2 South)
1 0 5

Figure 5: Resulting horizontal velocity profiles for data taken at Unit 6 Rock Island Powerhouse two. The integral was evaluated numerically using an adaptive Romberg integration, with a cubic spline interpolation between the measured points.
result, complete evaluation of the integral requires an evaluation of the flow in the zones next to those boundaries. The boundary flow at the floor is affected by the presence of the support frame’s lower cross-bar, a rectangular pipe 0.39 m wide and 0.19m high, centred 0.23 m above the intake floor and intersecting the measurement plane. The lowest ASFM measurement level was 0.542 m above the intake floor, so the effect of the cross-pipe had to be taken into consideration in evaluating the flow in the lower boundary.
A numerical simulation of the flow around the lower cross-pipe of the Rock Island Unit U6 test frame was performed, using the computational fluid dynamics code CFX TASCflow. The simulation was done because it has been shown that the Reynolds number of the flow around a pipe in a similar intake is between 250,000 and 900,000 and thus is sufficiently high that physical scale models (typically1/25) do not properly represent the boundary layer thicknesses above and below the pipe. Subsequently, results of numerical simulations have shown much better agreement with measured data in the region above the cross-pipe and hence numerical simulations were used in determining the form of the lower boundary layer approximation. Computations done using different inlet velocities, showed that the form of the profile of the horizontal velocity between the floor and the top of the zone influenced by the cross-pipe, is

Figure 6: Determination of the profile to be used in the lower boundary in the region of the rectangular cross member.
invariant over the range of velocities normally found in hydroelectric intakes. A simplified profile of the form,
n
ozz
1
, (2)
having the same discharge when integrated between the floor and the top of the boundary zone was therefore used. Figure 6 shows the determination of the form which resulted in n = 1.5 for equation (2). Note the gap in the CFD data in Figure 6 represents zero flow where the horizontal pipe is located.
In Figures 3 and 4 it can be seen that the main measurement plane, plane A, is slightly upstream of the downstream edge of the gate slot, forming a gap. The surface of integration cannot be closed without the addition of a secondary plane, plane B, perpendicular to the main measurement plane, extending from the upper most measurement point to the back wall of the gate slot. This defines an area through which water can travel to the turbine without passing through the primary measurement plane. Integration of the Normal component of the flow through plane B is required in order to compute the discharge accurately. Since the ASFM measures both components of the laterally-averaged velocity, the magnitude of the flow can be estimated from the measurement of the vertical component at the highest measured level (level ten in bay B and level twenty in bay A). At Rock Island Powerhouse Two U6, this level was
-0.2 0 0.2 0.4 0.6 0.8 1 1.2 1.4 0
0.1
0.2
0.3
0.4
0.5
Horizontal Velocity (m/s)
Ele
vatio
n (m
)
Solid Blue Line = CFD Data
Dashed Red Line = Area Fit Data
Green Dot = Last Measured Point

directly in front of, and at the same elevation, as the upper seal point in the head gate slots. This made it relatively simple to estimate the discharge through the upper region of plane B by using a cubic spline fit to the horizontal components of the velocity over the height of plane A up to the upper most measurement level (Figure 5). This profile ends at the highest level and is essentially an open boundary at the top.
The discharge through plane B, in the upper region of the intake, was estimated by using the vertical component of the velocity, Vv, and assuming that there was little time for the boundary layer to form so that the velocity was approximately constant along plane B.
The contribution to the discharge from the flow descending the gate slot was therefore computed as,
QB = L⋅vz⋅sin(θz)⋅wB, (3)
where L is the width of the intake (distance between transducer faces since they are flush mounted with the intake walls), vz⋅sin(θz)⋅is the vertical component of the velocity, vz, at the highest level (i.e. z at level 10 or 20) and wB is the width of plane B. The total discharge through the bay is therefore the sum of the integral over plane A, with boundary layers as described above, and QB. The total discharge through Unit U6 was then computed, for flow conditions using the boundary layer forms described above, by summing the discharges through the two bays. Horizontal Velocity Profile Sampling Error Results Figure 5 shows the horizontal velocity profile plots for the 42 ft head runs in Unit U6 at Rock Island for both Bays A and B. It can be seen that the effects of the horizontal cross members for the trashracks have a significant effect on the flow profile. This effect is seen more clearly in Bay A with a vertical sampling of 20 levels compared to Bay B with vertical sampling reduced to only 10 levels.
However, a direct comparison of the discharge computed from Bay A with all 20 levels and with half the levels removed reveals that the error is minimal. This indicates that the extent of the integration error encountered when a non-uniform velocity profile was no greater than ±0.3% over the height of the measurement plane when taken over many discharges.
Therefore, even when the vertical profile is non-uniform, vertical sampling of only 10 levels is adequate in an intake of this type and dimension and increased vertical sampling does not decrease the integration error significantly.

Figure 7: Graph of Gross Efficiency vs. MW for ASFM and current meters.
Figure 8: Graph of Net Head Efficiency vs. MW for ASFM and Model.
Rock Island Unit U6
Comparison of 2000 ASFM Results with 1983 Current Meter Based Results
60.0
65.0
70.0
75.0
80.0
85.0
90.0
95.0
0 10 20 30 40 50 60 70 Generator Output (MW)
ASFM - 38 ft ASFM - 42 ft Current Meters - 38 ft Current Meters - 42 ft
Rock Island Unit U6
Comparison of 2000 ASFM Results with Model Test Results
60.0
65.0
70.0
75.0
80.0
85.0
90.0
95.0
100.0
0 10 20 30 40 50 60 70 Turbine Output (MW)
ASFM - 38 ft ASFM - 42 ft Model - 38 ft Model - 42 ft
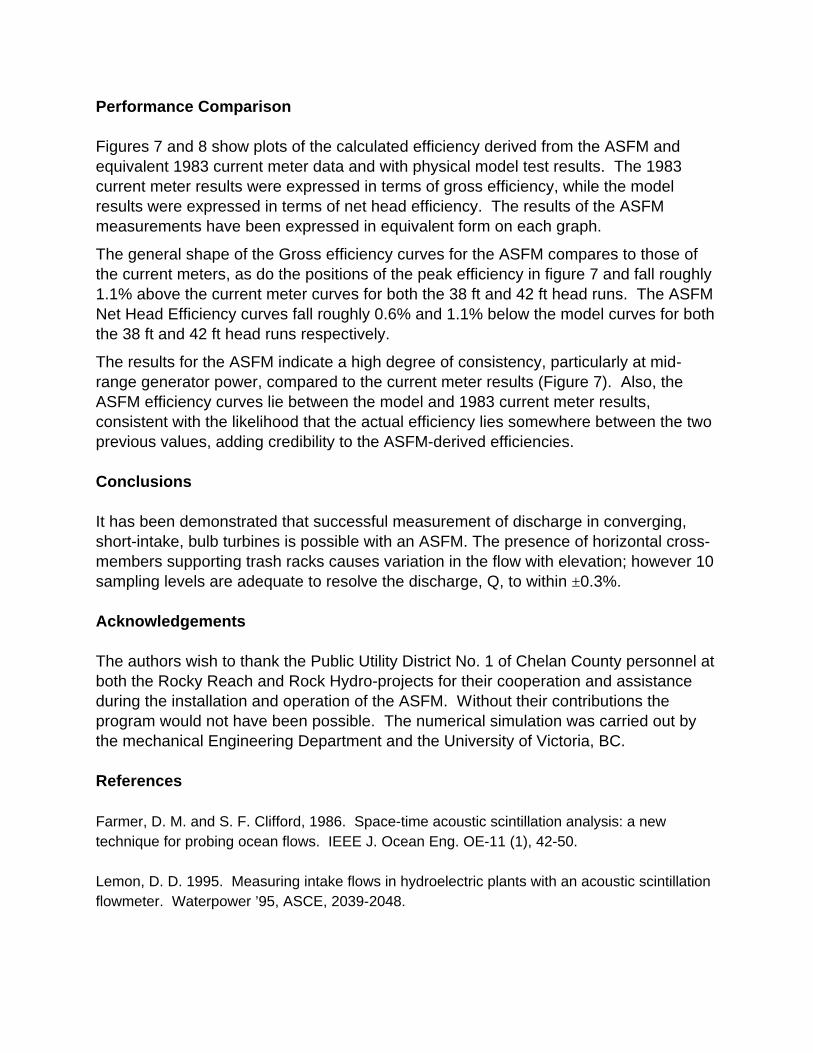
Performance Comparison Figures 7 and 8 show plots of the calculated efficiency derived from the ASFM and equivalent 1983 current meter data and with physical model test results. The 1983 current meter results were expressed in terms of gross efficiency, while the model results were expressed in terms of net head efficiency. The results of the ASFM measurements have been expressed in equivalent form on each graph.
The general shape of the Gross efficiency curves for the ASFM compares to those of the current meters, as do the positions of the peak efficiency in figure 7 and fall roughly 1.1% above the current meter curves for both the 38 ft and 42 ft head runs. The ASFM Net Head Efficiency curves fall roughly 0.6% and 1.1% below the model curves for both the 38 ft and 42 ft head runs respectively.
The results for the ASFM indicate a high degree of consistency, particularly at mid-range generator power, compared to the current meter results (Figure 7). Also, the ASFM efficiency curves lie between the model and 1983 current meter results, consistent with the likelihood that the actual efficiency lies somewhere between the two previous values, adding credibility to the ASFM-derived efficiencies. Conclusions It has been demonstrated that successful measurement of discharge in converging, short-intake, bulb turbines is possible with an ASFM. The presence of horizontal cross-members supporting trash racks causes variation in the flow with elevation; however 10 sampling levels are adequate to resolve the discharge, Q, to within ±0.3%. Acknowledgements The authors wish to thank the Public Utility District No. 1 of Chelan County personnel at both the Rocky Reach and Rock Hydro-projects for their cooperation and assistance during the installation and operation of the ASFM. Without their contributions the program would not have been possible. The numerical simulation was carried out by the mechanical Engineering Department and the University of Victoria, BC. References Farmer, D. M. and S. F. Clifford, 1986. Space-time acoustic scintillation analysis: a new technique for probing ocean flows. IEEE J. Ocean Eng. OE-11 (1), 42-50. Lemon, D. D. 1995. Measuring intake flows in hydroelectric plants with an acoustic scintillation flowmeter. Waterpower ’95, ASCE, 2039-2048.

Lemon, D. D., N. Caron, W. W. Cartier and G. Proulx, 1998. Comparison of turbine discharge measured by current meters and Acoustic Scintillation Flow Meter at Laforge-2 power plant. Proc. IGHEM, Reno 1998, 39-52. Lemon, D. D., C. W. Almquist, W. W. Cartier, P. A. March and T. A. Brice, 1998. Comparison of turbine discharge measured by current meters and Acoustic Scintillation Flow Meter at Fort Patrick Henry power plant. Proc. HydroVision ’98, Reno, 1998. Authors David Lemon, M.Sc., is the President of ASL Environmental Sciences Inc., with responsibility for the company’s Consulting Services Division as well as internal Research and Development. Ward Cartier, M.A.Sc. is an Engineering Physicist with ASL Environmental Sciences, working with instrumentation development and applications in the field. He has been responsible for ASFM measurements in hydroelectric plants since 1997. Brett Bickford, P.E ,is a Senior Civil Engineer and Project Manager with the Public Utility District No. 1 of Chelan Co.