measuring engagement in video game-based environments: investigation of the user engagement scale
TRANSCRIPT
Computers in Human Behavior 32 (2014) 123–132
Contents lists available at ScienceDirect
Computers in Human Behavior
journal homepage: www.elsevier .com/locate /comphumbeh
Measuring engagement in video game-based environments:Investigation of the User Engagement Scale
0747-5632/$ - see front matter � 2013 Elsevier Ltd. All rights reserved.http://dx.doi.org/10.1016/j.chb.2013.12.001
⇑ Corresponding author. Address: NC State University, Box 7801, Raleigh, NC27695-7801, USA. Tel.: +1 919 515 1753.
E-mail addresses: [email protected] (E.N. Wiebe), [email protected] (A.Lamb), [email protected] (M. Hardy), [email protected] (D. Sharek).
Eric N. Wiebe a,⇑, Allison Lamb a, Megan Hardy a, David Sharek b
a NC State University, Raleigh, NC, USAb Playgraph, Inc., USA
a r t i c l e i n f o
Article history:Available online 27 December 2013
Keywords:EngagementPsychometric measurementFlowVideo game
a b s t r a c t
This research investigated the use of the User Engagement Scale (UES) as a psychometric tool to measureengagement during video game-play. Exploratory factor analysis revealed four factors (Focused Atten-tion, Perceived Usability, Aesthetics, and Satisfaction) as compared to the six found in the original devel-opment of the UES. In the context of video game-play, a revised UES (UESz) demonstrated betterpsychometric properties than the original UES defined by six subscales, including enhanced reliability.Further validity analysis included comparisons with the Flow State Scale (FSS), showing the complemen-tary nature of the two scales and what constructs both scales might be measuring in a video game con-text. Criterion validity analysis demonstrated that UESz was more predictive of game performance thanthe FSS. Findings related to both the UESz and FSS were discussed relative to an overarching framework ofhedonic and utilitarian qualities of game-play.
� 2013 Elsevier Ltd. All rights reserved.
1. Introduction
While cognitive theories and constructs continue to dominatemuch of the research in human–computer interaction, affectivedimensions of the user experience have increasingly gained theattention of researchers (cf., Picard, 2010). In particular, the inter-section of affective and cognitive dimensions are being studied askey underlying constructs to help explain the rapid rise of popular-ity of video games and their efficacy for generating extended task-oriented behaviour (Przybylski, Rigby, & Ryan, 2010). For manyresearchers, gaming is of particular interest because of its potentialuse as a guiding design heuristic in learning-based environments(e.g., Mayo, 2009; Whitton, 2011).
This increased interest in the intersection of affective and cog-nitive psychological dimensions of user experience with videogames has carried over to other computational environments. Atthis nexus, engagement has been recognized as a key factor inunderstanding general user behaviour and overall efficacy of goalor task-oriented behaviour within computer-based environments;including work-oriented information retrieval tasks, social net-working tools (e.g., Facebook™), games, traditional educationalenvironments, and hybrid environments such as game-basedlearning (Boyle, Connolly, & Hainey, 2011; Faiola, Newlon, Pfaff,
& Smyslova, 2012; O’Brien and Toms, 2008). Evaluation andresearch on these types of computer-based environments have in-cluded measures of engagement, yet it is recognized that bettertools are needed to help define and measure this construct (cf.,Attfield, Kazai, Lalmas, & Piwowarski, 2011).
The goal of this study is to extend and refine existing work indefining user engagement as it relates to computer and game-based environments. This study focuses on extending the ongoingwork being conducted by the team of O’Brien and Toms (2008,2010, 2012) on developing a self-report instrument of user engage-ment. Their work is extended by investigating the use of their UserEngagement Scale (UES) in the context of game-based environ-ments. Additionally, this study continues the work on validatingand refining the instrument and its underlying constructs.
1.1. Theoretical framework
In the past couple of decades, two related frameworks ofengagement have been developed in the contexts of school (aca-demic) settings and in human–computer interaction. School-basedengagement is the broader of the two, encompassing an individu-als’ engagement with academic activities in school but influencedby factors both within and outside of school. Work by Appleton,Christenson, Kim, and Reschly (2006), Fredricks, Blumenfeld, andParis (2004) have developed a sophisticated, multifaceted view ofengagement that can be conceptualized at many different levels.Their complementary work demonstrates that family, community,culture and educational context are all important antecedent
124 E.N. Wiebe et al. / Computers in Human Behavior 32 (2014) 123–132
factors mediating engagement. Fredricks et al. (2004) describesfactors related to engagement that are measurable at different con-textual levels: school, classroom, and individual levels. A comple-mentary approach by Appleton et al. (2006) identifies facets ofengagement related to academic (time on task), behavioural (class-room participation), cognitive (strategizing), and psychological(belonging) settings. Both researchers note that engagement canhappen in the context of group-social interaction and at the indi-vidual level. From this research comes an understanding thatengagement can be effectively studied and measured at theindividual level as individuals conduct cognitively demandingtask-oriented activities. Performance is frequently considered asan outcome measure in cognitive tasks and is mediated by affec-tive dimensions. Thus, engagement becomes an important factorto measure if performance is to be understood, because it helps ex-plain the critical mediating role that affective dimensions play incognitive tasks.
Of particular interest to this current study, Appleton, Fredricksand other allied researchers helped define where engagement re-sides with regards to a broad spectrum of cognitive and affectivedimensions or states such as motivation and self-efficacy (cf.,Sharek, 2012). They note that self-determination theory (Ryan &Deci, 2000) helps explain how intrinsic motivation—driven by fac-tors such as the need for competence—is an important precursorfor engagement (Boyle et al., 2011; Przybylski et al., 2010). How-ever, while engagement is certainly related to motivation, it canbe considered a separate construct (Appleton et al., 2006;Przybylski et al., 2010). One can conceive engagement as a seriesof (state-like) temporal interactions during task while motivationis a more (state or trait-like) global personal orientation towardsthe learning/task (Bempechat & Shernoff, 2012). The interactionbetween the two can form a feedback loop where the experiencewith the task can shape the more state-like elements of self-effi-cacy and motivation which in turn influences the user’s desire tore-engage with a task (Sharek, 2012).
A second line of research has developed around understandingengagement in individual, task-oriented endeavors using com-puter-based tools (e.g., O’Brien and Toms, 2008). This work hasdeveloped a conceptual model of engagement in the context ofhuman–computer interaction, primarily around tasks related toinformation search and retrieval, but also encompassing activitiessuch as online shopping and video games (O’Brien and Toms,2010). O’Brien and Toms have developed a model of engagementthat is both a process and a product of interaction. It represents acyclical experience of engagement and reflection on this interac-tive experience that helps shapes decisions about future engage-ment (O’Brien and Toms, 2010). While O’Brien and Toms (2008)provide a comprehensive review of the different theoreticalsources of their identified facets of engagement, the work ofHassenzahl, Diefenbach, and Göritz (2010) can be used to providea very succinct lens by organizing these experiences and motiva-tions for engagement into two categories, or qualities, of the userexperience. First, there are pragmatic qualities related to the use-fulness and usability of the system. Second, there are the hedonicqualities of motivation, stimulation, and challenge for the user.The pragmatic qualities of utility/usefulness and usability have along, established history in research in human–computer interac-tion (cf., Shneiderman, 1998) and form the backbone of well-estab-lished frameworks such as the Technology Acceptance Model(Bourgonjon, Valcke, Soetaert, & Schellens, 2010; Venkatesh & Bala,2008). Positive responses by the user to both the usability and use-fulness of a computer-based system for a task are seen as keyprerequisites for user engagement (O’Brien and Toms, 2010).
Hassenzahl et al.’s (2010) hedonic qualities sit at the centre ofwhat has become the areas of engagement that engender the mostinterest among researchers looking at video games and game-
based learning environments. It is the hedonic qualities of gamesthat are seen as the key elements that explain the perception ofhigh engagement by users (Malone & Lepper, 1987; Przybylskiet al., 2010). One facet of this quality is the perceived aestheticsof the computer-based environment (Skelly, Fries, Linnett, Nass,& Reeves, 1994; Vorderer, Klimmt, & Ritterfeld, 2004). Aestheticsworks at many different levels to both motivate initial interactionwith a system, enjoyment while using it, and (perhaps) theperceived overall usability of the system. The notion of ‘‘play’’encompasses many of the other facets of the hedonic quality of hu-man–computer interaction, especially as they relate to game-basedenvironments (Rieber, 1996; Stephenson, 1967). While play is of-ten thought of as a physical activity, it can also represent interac-tion with virtual spaces. Also relevant is that while play can betask-oriented, these tasks can just as (or more) easily be drivenby hedonic rather than pragmatic qualities of the experience.Though play in both physical and virtual spaces is typically thoughtof as an activity or behaviour, what is most relevant to engagementis perhaps the user’s perceived experience while at play and theirresponse to this experience.
Flow Theory (Csikszentmihalyi, 1990) is used by O’Brien andToms (2008, 2010), along with numerous other researchers (e.g.,Boyle et al., 2011; Sherry, 2004), to describe what an individualexperiences during play and, thus, is a central theoretical framefor understanding user experience in game-based settings and asa means for explaining user engagement in such environments.Flow can be thought of as a deep immersive experience that resultsfrom an individual engaging in a task that has an appropriate bal-ance of challenge relative to a user’s skill level (Csikszentmihalyi,1990; Faiola et al., 2012; Sherry, 2004). Flow and game play areoften linked in contexts where the user finds a familiar formalstructure (of the game) but novel content created by the systemdesign and user choice within the system (Sherry, 2004). The con-nection here can be found within the larger framework of motiva-tion and engagement where the user will leverage their familiarityand past experiences of the formal structure to determine whetherthe challenge being presented to them is both achievable anddesirable. From this flow experience is a positive affective re-sponse—enjoyment and satisfaction—that leads an individual toboth reflect positively on the experience and, typically, want tore-engage with it again (Sharek, 2012). Despite the connectionsthat many have found between Flow Theory, as conceived byCsikszentmihalyi (1990), and game-based environments, research-ers have noted that the connections between the two are oftendeceptively simple on the surface and decidedly complex in directapplication in research (cf., Weibel, Wissmath, Habegger, Steiner, &Groner, 2008). Indeed, while flow and enjoyment reported in gameplay may be highly correlated, they might be considered separateconstructs to be measured and characterised individually (Boyleet al., 2011; Weibel et al., 2008).
1.2. Measurement
This emerging framework for understanding engagement leadsto the use of multiple measurement paradigms and approaches tomeasuring data arising from users in task-oriented contexts. Giventhat the larger framework of engagement encompasses bothbehaviours in physical and virtual spaces and the resulting psycho-logical states, it is appropriate that researchers have employed var-ied and often multiple measurement approaches. On thebehavioural side, direct observational measures have been usedto characterise overt behaviour in educational and other settings(Admiraal, Huizenga, Akkerman, & Dam, 2011). In the context ofcomputer-based activities, in addition to direct observation ofactivity, trace/log data from interaction from the system is alsoemployed (Lehmann, Lalmas, Yom-Tov, & Dupret, 2012). To
E.N. Wiebe et al. / Computers in Human Behavior 32 (2014) 123–132 125
characterise the psychological state of users, physiological mea-surement has become increasingly popular due to the rapidtechnological enhancement of measurement and analysis toolsalong with theoretical models to guide interpretation (Hardy,Wiebe, Grafsgaard, Boyer, & Lester, 2013; Mandryk, Inkpen, & Cal-vert, 2006).
However, self-report measures (usually post hoc) continue to bethe most popular measure for characterizing the psychologicalstate of user engagement. Previously cited works on the develop-ment of a framework of user engagement note the importance ofusing multiple measures of engagement to capture behaviouraland psychological aspects of engagement, but also to capture thediffering facets of psychological engagement (Appleton et al.,2006; Boyle et al., 2011). Self-report measures continue to repre-sent a robust, easy to implement approach to collecting valid, reli-able data for research and evaluation of user experiences in videogame-based environments. Despite the general interest in engage-ment, there is a paucity of well-validated self-report instrumentsfor measuring this construct. Appleton et al. (2006) developedthe Student Engagement Instrument—closely related to both histheoretical frame and that of Fredricks et al. (2004)—however, thiswas developed for use in the context of schools and school-basedactivities. There have been other instruments developed especiallyfor game-based environments, often employing flow and otherengagement-related constructs, but they have not been widelyused or validated (e.g., Brockmyer et al., 2009; Fu, Su, & Yu,2009). More widely used in game-based research has been aninstrument developed around Csikszentmihalyi’s (1990) originalconception of flow for use in the context of physical activity, theFlow State Scale (Jackson & Marsh, 1996; Marsh & Jackson,1999). Interestingly, while this scale was developed and validatedfor measurement of sports-related physical activity, it has beenused to measure a broad conceptual definition of flow in com-puter-based activities, including video games (e.g., Kato & Suzuki,2003; Liao, 2006; Ma & Williams, 2011). The appeal of using theFlow State Scale in contexts such as game-based environmentsmay come both from the broad assessment of the flow experience(the scale has nine separate subscales) and the general wording ofthe scale items (i.e., not specifically tied to sports activities)(Jackson & Marsh, 1996)
Perhaps most promising in this area of self-report of game-based engagement has been the development and refinement ofthe User Engagement Scale by O’Brien and Toms (2008, 2010,2012). As previously noted, O’Brien and Toms used work in educa-tional multimedia as a starting point to define a number of bothpragmatic and hedonic dimensions that influence user engage-ment. In addition to the construct of flow, they also wanted to cap-ture the hedonic aspects of aesthetics, fun/pleasure, and noveltyalong with pragmatic aspects of usability and a more reflectivesense of whether the user would like to re-engage with this expe-rience again in the future. From these constructs, they developedand validated a self-report instrument with six subscales repre-senting six unique constructs (O’Brien and Toms, 2010):
� AE – Aestheticso Visual appearance
� EN- Endurabilityo Holistic response to experience – reflective-forward: would
I use it again and recommend to others?� FI - Felt Involvement
o Interesting and fun experience?� FA - Focused Attention
o Based on Flow Theory (focused concentration, absorption,temporal dissociation)
� NO – Noveltyo Interest and curiosity evoked by the software system
� PU - Perceived Usabilityo Both affective (frustration) and cognitive (effortful) aspects
of use of the system
As part of their original validation work, they interviewed usersabout their experiences in four different contexts, video games, on-line learning, Internet web searching, and shopping. They thenconducted both an exploratory and confirmatory factor analysiswith the instrument in the context of an online shopping environ-ment (O’Brien and Toms, 2010). Other researchers have since usedthe instrument in the context of interactive information retrieval(Arguello, Wu, Kelly, & Edwards, 2012), online multiplayer gamesand avatar creation (Turkay, 2012), and social networking (i.e.,Facebook) (Banhawi, Ali, & Judi, 2012).
More recently, O’Brien and Toms have revisited their instru-ment in light of research done by others with the instrument,and their own further investigations with it in the context of infor-mation retrieval (O’Brien and Toms, 2012). One of the most inter-esting findings reported in this study is the question of whetherEndurability (EN), Novelty (NO), and Felt Involvement (FI) existas three separate, or just one single factor. While the original val-idation in the context of online shopping confirmed these six fac-tors, a further study on online search (O’Brien, 2010) as well as asocial networking study (Banhawi et al., 2012) revealed factorloadings that had these three merged as one. As O’Brien (2010)notes, the context of the task can have strong influences on one’smotivations and thus how they perceive their engagement. Justas important, they note, this is still a relatively new scale in needof further research in multiple contexts. O’Brien and Toms (2012)further work with online information retrieval has confirmed thestability of the Aesthetics (AE), Focused Attention (FA), and Per-ceived Usability (PU) scales, but has continued to document therelative fluidity of items from the other three subscales, based onthe context of the task.
Published work on the UES points to the promise of the scale foruse in investigating engagement in computer-based environments,including game-based ones. Flow Theory, which has been used bymany researchers as a lens to examine the experience of game-playis explicitly measured via the subscale of Focused Attention, alongwith other relevant hedonic and pragmatic dimensions of experi-ence. This approach contrasts to the development of the Flow StateScale, which focused exclusively on the measurement of the con-struct of flow. However, the UES has not been specifically validatedin the context of game-play. In addition, prior work has pointed toquestions as to exactly how many unique constructs are beingmeasured when used in other computer-based contexts. This cur-rent work will specifically address the question of, in the context ofgame-play, how many distinct factors emerge through an explor-atory factor analysis. In addition, ability of the different UES factorsto predict game play performance will be explored and comparedto the Flow State Scale.
2. Results
2.1. Participants
A total of 572 participants were recruited via Mechanical Turk(Amazon.com., 2010). Prior research has indicated that MechanicalTurk is a reliable source of subject participants (Behrend, Sharek,Meade, & Wiebe, 2011). Data for 159 participants was eliminateddue to incomplete data, nonvariance of response, failure to meetminimum playtime or indication that they were unable to com-plete the game portion of the study. The remaining 413 partici-pants ranged in age from 18 to 66 (M = 29, SD = 9.75). Theeducation level reached by participants ranged from high school
126 E.N. Wiebe et al. / Computers in Human Behavior 32 (2014) 123–132
degree (8%), college degree (31%) to graduate degree (36%) with theremaining reporting some college or graduate schooling (24%). Asubset of the participants (N = 186) completed both the UES andFlow State Scale (FSS). This subset had nearly identical demo-graphic characteristics to the sample as a whole.
2.2. Stimuli and measures
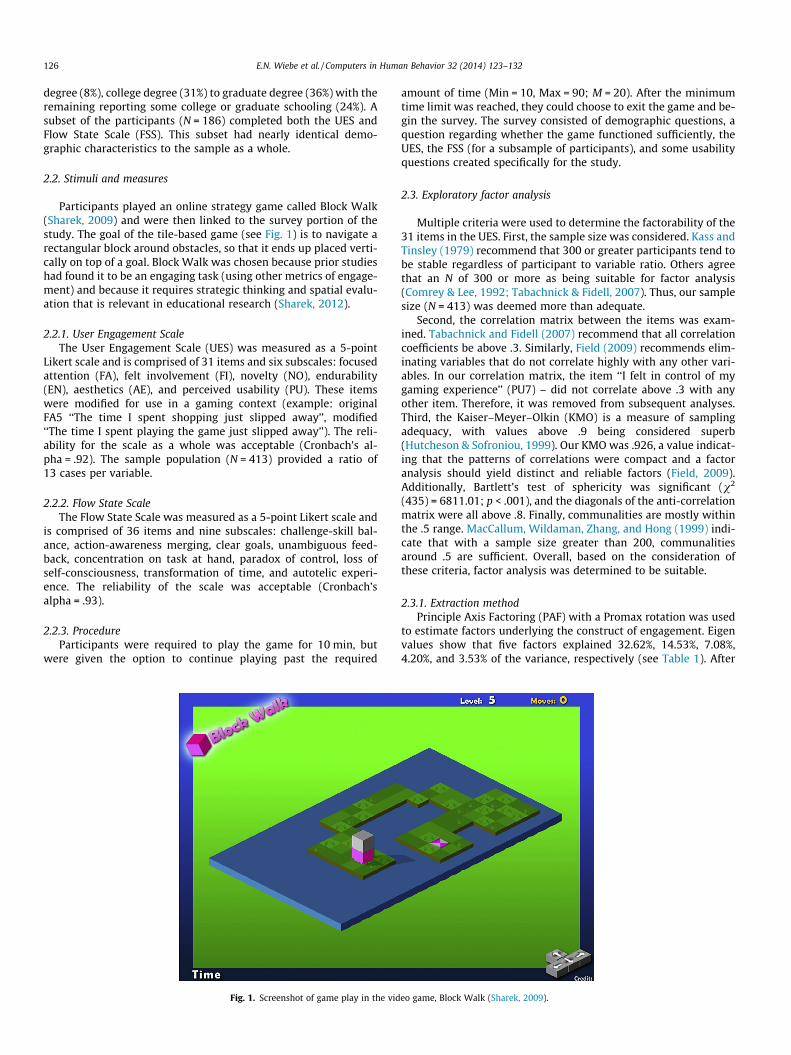
Participants played an online strategy game called Block Walk(Sharek, 2009) and were then linked to the survey portion of thestudy. The goal of the tile-based game (see Fig. 1) is to navigate arectangular block around obstacles, so that it ends up placed verti-cally on top of a goal. Block Walk was chosen because prior studieshad found it to be an engaging task (using other metrics of engage-ment) and because it requires strategic thinking and spatial evalu-ation that is relevant in educational research (Sharek, 2012).
2.2.1. User Engagement ScaleThe User Engagement Scale (UES) was measured as a 5-point
Likert scale and is comprised of 31 items and six subscales: focusedattention (FA), felt involvement (FI), novelty (NO), endurability(EN), aesthetics (AE), and perceived usability (PU). These itemswere modified for use in a gaming context (example: originalFA5 ‘‘The time I spent shopping just slipped away’’, modified‘‘The time I spent playing the game just slipped away’’). The reli-ability for the scale as a whole was acceptable (Cronbach’s al-pha = .92). The sample population (N = 413) provided a ratio of13 cases per variable.
2.2.2. Flow State ScaleThe Flow State Scale was measured as a 5-point Likert scale and
is comprised of 36 items and nine subscales: challenge-skill bal-ance, action-awareness merging, clear goals, unambiguous feed-back, concentration on task at hand, paradox of control, loss ofself-consciousness, transformation of time, and autotelic experi-ence. The reliability of the scale was acceptable (Cronbach’salpha = .93).
2.2.3. ProcedureParticipants were required to play the game for 10 min, but
were given the option to continue playing past the required
Fig. 1. Screenshot of game play in the vid
amount of time (Min = 10, Max = 90; M = 20). After the minimumtime limit was reached, they could choose to exit the game and be-gin the survey. The survey consisted of demographic questions, aquestion regarding whether the game functioned sufficiently, theUES, the FSS (for a subsample of participants), and some usabilityquestions created specifically for the study.
2.3. Exploratory factor analysis
Multiple criteria were used to determine the factorability of the31 items in the UES. First, the sample size was considered. Kass andTinsley (1979) recommend that 300 or greater participants tend tobe stable regardless of participant to variable ratio. Others agreethat an N of 300 or more as being suitable for factor analysis(Comrey & Lee, 1992; Tabachnick & Fidell, 2007). Thus, our samplesize (N = 413) was deemed more than adequate.
Second, the correlation matrix between the items was exam-ined. Tabachnick and Fidell (2007) recommend that all correlationcoefficients be above .3. Similarly, Field (2009) recommends elim-inating variables that do not correlate highly with any other vari-ables. In our correlation matrix, the item ‘‘I felt in control of mygaming experience’’ (PU7) – did not correlate above .3 with anyother item. Therefore, it was removed from subsequent analyses.Third, the Kaiser–Meyer–Olkin (KMO) is a measure of samplingadequacy, with values above .9 being considered superb(Hutcheson & Sofroniou, 1999). Our KMO was .926, a value indicat-ing that the patterns of correlations were compact and a factoranalysis should yield distinct and reliable factors (Field, 2009).Additionally, Bartlett’s test of sphericity was significant (v2
(435) = 6811.01; p < .001), and the diagonals of the anti-correlationmatrix were all above .8. Finally, communalities are mostly withinthe .5 range. MacCallum, Wildaman, Zhang, and Hong (1999) indi-cate that with a sample size greater than 200, communalitiesaround .5 are sufficient. Overall, based on the consideration ofthese criteria, factor analysis was determined to be suitable.
2.3.1. Extraction methodPrinciple Axis Factoring (PAF) with a Promax rotation was used
to estimate factors underlying the construct of engagement. Eigenvalues show that five factors explained 32.62%, 14.53%, 7.08%,4.20%, and 3.53% of the variance, respectively (see Table 1). After
eo game, Block Walk (Sharek, 2009).
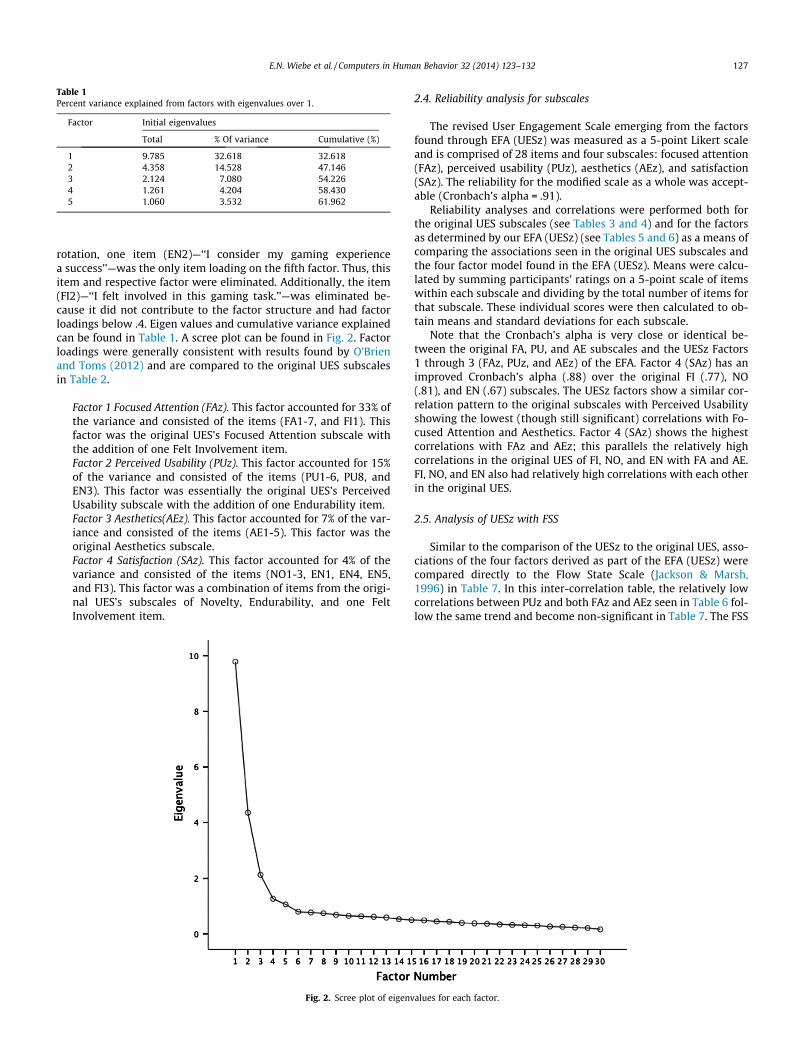
Table 1Percent variance explained from factors with eigenvalues over 1.
Factor Initial eigenvalues
Total % Of variance Cumulative (%)
1 9.785 32.618 32.6182 4.358 14.528 47.1463 2.124 7.080 54.2264 1.261 4.204 58.4305 1.060 3.532 61.962
E.N. Wiebe et al. / Computers in Human Behavior 32 (2014) 123–132 127
rotation, one item (EN2)—‘‘I consider my gaming experiencea success’’—was the only item loading on the fifth factor. Thus, thisitem and respective factor were eliminated. Additionally, the item(FI2)—‘‘I felt involved in this gaming task.’’—was eliminated be-cause it did not contribute to the factor structure and had factorloadings below .4. Eigen values and cumulative variance explainedcan be found in Table 1. A scree plot can be found in Fig. 2. Factorloadings were generally consistent with results found by O’Brienand Toms (2012) and are compared to the original UES subscalesin Table 2.
Factor 1 Focused Attention (FAz). This factor accounted for 33% ofthe variance and consisted of the items (FA1-7, and FI1). Thisfactor was the original UES’s Focused Attention subscale withthe addition of one Felt Involvement item.Factor 2 Perceived Usability (PUz). This factor accounted for 15%of the variance and consisted of the items (PU1-6, PU8, andEN3). This factor was essentially the original UES’s PerceivedUsability subscale with the addition of one Endurability item.Factor 3 Aesthetics(AEz). This factor accounted for 7% of the var-iance and consisted of the items (AE1-5). This factor was theoriginal Aesthetics subscale.Factor 4 Satisfaction (SAz). This factor accounted for 4% of thevariance and consisted of the items (NO1-3, EN1, EN4, EN5,and FI3). This factor was a combination of items from the origi-nal UES’s subscales of Novelty, Endurability, and one FeltInvolvement item.
Fig. 2. Scree plot of eigenv
2.4. Reliability analysis for subscales
The revised User Engagement Scale emerging from the factorsfound through EFA (UESz) was measured as a 5-point Likert scaleand is comprised of 28 items and four subscales: focused attention(FAz), perceived usability (PUz), aesthetics (AEz), and satisfaction(SAz). The reliability for the modified scale as a whole was accept-able (Cronbach’s alpha = .91).
Reliability analyses and correlations were performed both forthe original UES subscales (see Tables 3 and 4) and for the factorsas determined by our EFA (UESz) (see Tables 5 and 6) as a means ofcomparing the associations seen in the original UES subscales andthe four factor model found in the EFA (UESz). Means were calcu-lated by summing participants’ ratings on a 5-point scale of itemswithin each subscale and dividing by the total number of items forthat subscale. These individual scores were then calculated to ob-tain means and standard deviations for each subscale.
Note that the Cronbach’s alpha is very close or identical be-tween the original FA, PU, and AE subscales and the UESz Factors1 through 3 (FAz, PUz, and AEz) of the EFA. Factor 4 (SAz) has animproved Cronbach’s alpha (.88) over the original FI (.77), NO(.81), and EN (.67) subscales. The UESz factors show a similar cor-relation pattern to the original subscales with Perceived Usabilityshowing the lowest (though still significant) correlations with Fo-cused Attention and Aesthetics. Factor 4 (SAz) shows the highestcorrelations with FAz and AEz; this parallels the relatively highcorrelations in the original UES of FI, NO, and EN with FA and AE.FI, NO, and EN also had relatively high correlations with each otherin the original UES.
2.5. Analysis of UESz with FSS
Similar to the comparison of the UESz to the original UES, asso-ciations of the four factors derived as part of the EFA (UESz) werecompared directly to the Flow State Scale (Jackson & Marsh,1996) in Table 7. In this inter-correlation table, the relatively lowcorrelations between PUz and both FAz and AEz seen in Table 6 fol-low the same trend and become non-significant in Table 7. The FSS
alues for each factor.
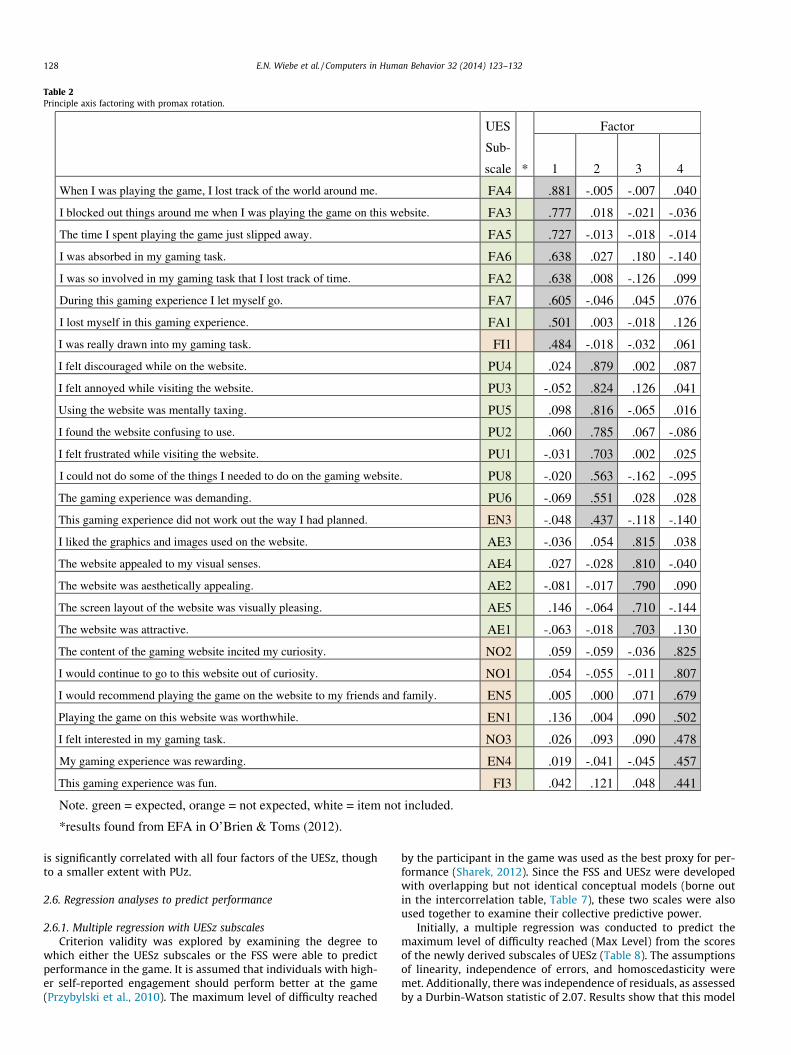
Table 2Principle axis factoring with promax rotation.
UES
Sub-
scale *
Factor
1 2 3 4
When I was playing the game, I lost track of the world around me. FA4 .881 -.005 -.007 .040
I blocked out things around me when I was playing the game on this website. FA3 .777 .018 -.021 -.036
The time I spent playing the game just slipped away. FA5 .727 -.013 -.018 -.014
I was absorbed in my gaming task. FA6 .638 .027 .180 -.140
I was so involved in my gaming task that I lost track of time. FA2 .638 .008 -.126 .099
During this gaming experience I let myself go. FA7 .605 -.046 .045 .076
I lost myself in this gaming experience. FA1 .501 .003 -.018 .126
I was really drawn into my gaming task. FI1 .484 -.018 -.032 .061
I felt discouraged while on the website. PU4 .024 .879 .002 .087
I felt annoyed while visiting the website. PU3 -.052 .824 .126 .041
Using the website was mentally taxing. PU5 .098 .816 -.065 .016
I found the website confusing to use. PU2 .060 .785 .067 -.086
I felt frustrated while visiting the website. PU1 -.031 .703 .002 .025
I could not do some of the things I needed to do on the gaming website. PU8 -.020 .563 -.162 -.095
The gaming experience was demanding. PU6 -.069 .551 .028 .028
This gaming experience did not work out the way I had planned. EN3 -.048 .437 -.118 -.140
I liked the graphics and images used on the website. AE3 -.036 .054 .815 .038
The website appealed to my visual senses. AE4 .027 -.028 .810 -.040
The website was aesthetically appealing. AE2 -.081 -.017 .790 .090
The screen layout of the website was visually pleasing. AE5 .146 -.064 .710 -.144
The website was attractive. AE1 -.063 -.018 .703 .130
The content of the gaming website incited my curiosity. NO2 .059 -.059 -.036 .825
I would continue to go to this website out of curiosity. NO1 .054 -.055 -.011 .807
I would recommend playing the game on the website to my friends and family. EN5 .005 .000 .071 .679
Playing the game on this website was worthwhile. EN1 .136 .004 .090 .502
I felt interested in my gaming task. NO3 .026 .093 .090 .478
My gaming experience was rewarding. EN4 .019 -.041 -.045 .457
This gaming experience was fun. FI3 .042 .121 .048 .441
Note. green = expected, orange = not expected, white = item not included.
*results found from EFA in O’Brien & Toms (2012).
128 E.N. Wiebe et al. / Computers in Human Behavior 32 (2014) 123–132
is significantly correlated with all four factors of the UESz, thoughto a smaller extent with PUz.
2.6. Regression analyses to predict performance
2.6.1. Multiple regression with UESz subscalesCriterion validity was explored by examining the degree to
which either the UESz subscales or the FSS were able to predictperformance in the game. It is assumed that individuals with high-er self-reported engagement should perform better at the game(Przybylski et al., 2010). The maximum level of difficulty reached
by the participant in the game was used as the best proxy for per-formance (Sharek, 2012). Since the FSS and UESz were developedwith overlapping but not identical conceptual models (borne outin the intercorrelation table, Table 7), these two scales were alsoused together to examine their collective predictive power.
Initially, a multiple regression was conducted to predict themaximum level of difficulty reached (Max Level) from the scoresof the newly derived subscales of UESz (Table 8). The assumptionsof linearity, independence of errors, and homoscedasticity weremet. Additionally, there was independence of residuals, as assessedby a Durbin-Watson statistic of 2.07. Results show that this model
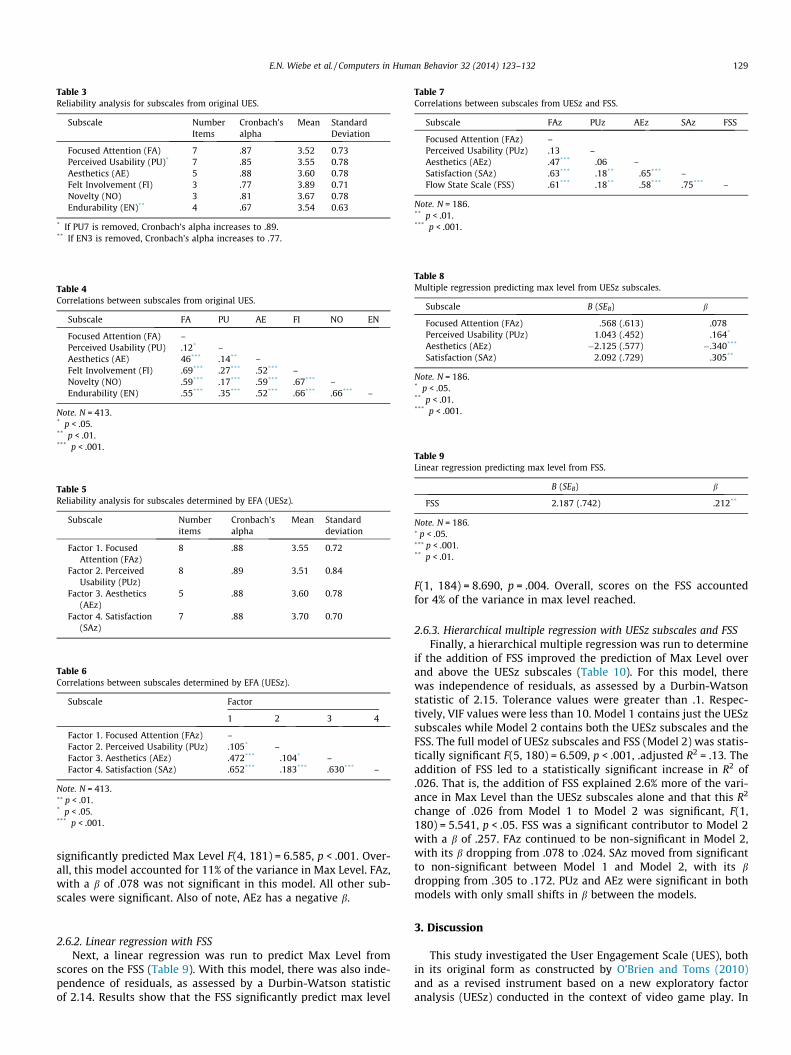
Table 3Reliability analysis for subscales from original UES.
Subscale NumberItems
Cronbach’salpha
Mean StandardDeviation
Focused Attention (FA) 7 .87 3.52 0.73Perceived Usability (PU)* 7 .85 3.55 0.78Aesthetics (AE) 5 .88 3.60 0.78Felt Involvement (FI) 3 .77 3.89 0.71Novelty (NO) 3 .81 3.67 0.78Endurability (EN)** 4 .67 3.54 0.63
* If PU7 is removed, Cronbach’s alpha increases to .89.** If EN3 is removed, Cronbach’s alpha increases to .77.
Table 4Correlations between subscales from original UES.
Subscale FA PU AE FI NO EN
Focused Attention (FA) –Perceived Usability (PU) .12* –Aesthetics (AE) 46*** .14** –Felt Involvement (FI) .69*** .27*** .52*** –Novelty (NO) .59*** .17*** .59*** .67*** –Endurability (EN) .55*** .35*** .52*** .66*** .66*** –
Note. N = 413.* p < .05.** p < .01.*** p < .001.
Table 5Reliability analysis for subscales determined by EFA (UESz).
Subscale Numberitems
Cronbach’salpha
Mean Standarddeviation
Factor 1. FocusedAttention (FAz)
8 .88 3.55 0.72
Factor 2. PerceivedUsability (PUz)
8 .89 3.51 0.84
Factor 3. Aesthetics(AEz)
5 .88 3.60 0.78
Factor 4. Satisfaction(SAz)
7 .88 3.70 0.70
Table 6Correlations between subscales determined by EFA (UESz).
Subscale Factor
1 2 3 4
Factor 1. Focused Attention (FAz) –Factor 2. Perceived Usability (PUz) .105* –Factor 3. Aesthetics (AEz) .472*** .104* –Factor 4. Satisfaction (SAz) .652*** .183*** .630*** –
Note. N = 413.�� p < .01.* p < .05.*** p < .001.
Table 7Correlations between subscales from UESz and FSS.
Subscale FAz PUz AEz SAz FSS
Focused Attention (FAz) –Perceived Usability (PUz) .13 –Aesthetics (AEz) .47*** .06 –Satisfaction (SAz) .63*** .18** .65*** –Flow State Scale (FSS) .61*** .18** .58*** .75*** –
Note. N = 186.** p < .01.*** p < .001.
Table 8Multiple regression predicting max level from UESz subscales.
Subscale B (SEB) b
Focused Attention (FAz) .568 (.613) .078Perceived Usability (PUz) 1.043 (.452) .164*
Aesthetics (AEz) �2.125 (.577) �.340***
Satisfaction (SAz) 2.092 (.729) .305**
Note. N = 186.* p < .05.** p < .01.*** p < .001.
Table 9Linear regression predicting max level from FSS.
B (SEB) b
FSS 2.187 (.742) .212**
Note. N = 186.� p < .05.��� p < .001.** p < .01.
E.N. Wiebe et al. / Computers in Human Behavior 32 (2014) 123–132 129
significantly predicted Max Level F(4, 181) = 6.585, p < .001. Over-all, this model accounted for 11% of the variance in Max Level. FAz,with a b of .078 was not significant in this model. All other sub-scales were significant. Also of note, AEz has a negative b.
2.6.2. Linear regression with FSSNext, a linear regression was run to predict Max Level from
scores on the FSS (Table 9). With this model, there was also inde-pendence of residuals, as assessed by a Durbin-Watson statisticof 2.14. Results show that the FSS significantly predict max level
F(1, 184) = 8.690, p = .004. Overall, scores on the FSS accountedfor 4% of the variance in max level reached.
2.6.3. Hierarchical multiple regression with UESz subscales and FSSFinally, a hierarchical multiple regression was run to determine
if the addition of FSS improved the prediction of Max Level overand above the UESz subscales (Table 10). For this model, therewas independence of residuals, as assessed by a Durbin-Watsonstatistic of 2.15. Tolerance values were greater than .1. Respec-tively, VIF values were less than 10. Model 1 contains just the UESzsubscales while Model 2 contains both the UESz subscales and theFSS. The full model of UESz subscales and FSS (Model 2) was statis-tically significant F(5, 180) = 6.509, p < .001, .adjusted R2 = .13. Theaddition of FSS led to a statistically significant increase in R2 of.026. That is, the addition of FSS explained 2.6% more of the vari-ance in Max Level than the UESz subscales alone and that this R2
change of .026 from Model 1 to Model 2 was significant, F(1,180) = 5.541, p < .05. FSS was a significant contributor to Model 2with a b of .257. FAz continued to be non-significant in Model 2,with its b dropping from .078 to .024. SAz moved from significantto non-significant between Model 1 and Model 2, with its bdropping from .305 to .172. PUz and AEz were significant in bothmodels with only small shifts in b between the models.
3. Discussion
This study investigated the User Engagement Scale (UES), bothin its original form as constructed by O’Brien and Toms (2010)and as a revised instrument based on a new exploratory factoranalysis (UESz) conducted in the context of video game play. In
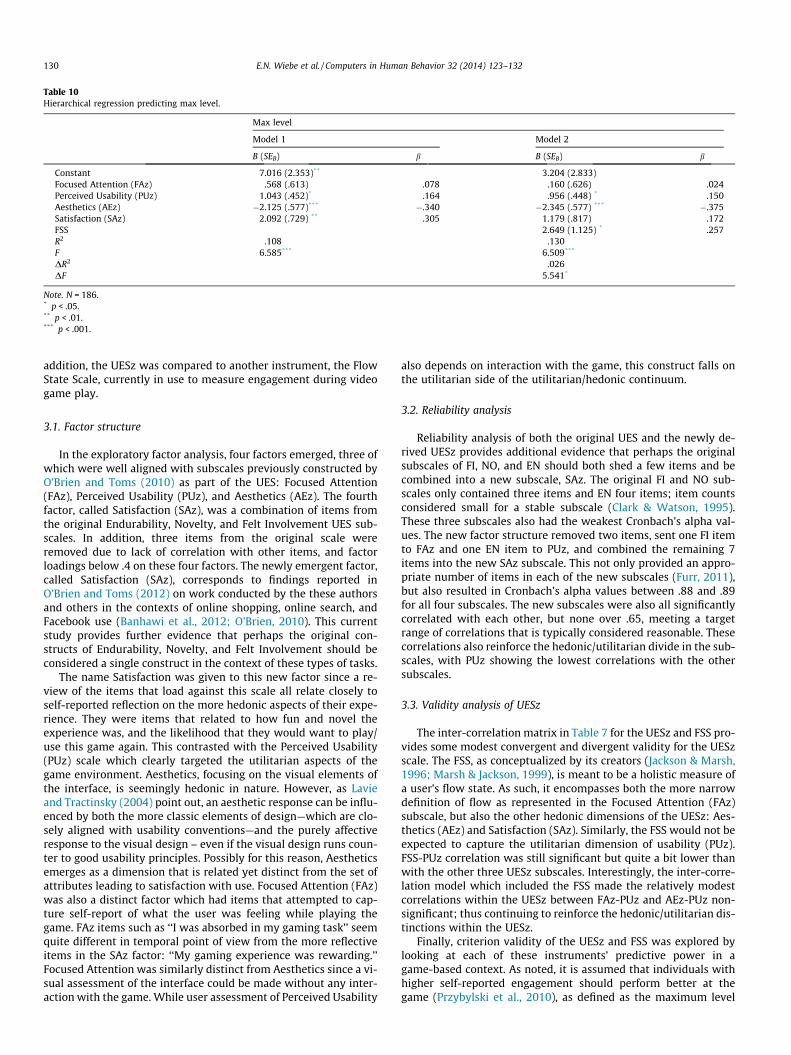
Table 10Hierarchical regression predicting max level.
Max level
Model 1 Model 2
B (SEB) b B (SEB) b
Constant 7.016 (2.353)** 3.204 (2.833)Focused Attention (FAz) .568 (.613) .078 .160 (.626) .024Perceived Usability (PUz) 1.043 (.452)* .164 .956 (.448) * .150Aesthetics (AEz) �2.125 (.577)*** �.340 �2.345 (.577) *** �.375Satisfaction (SAz) 2.092 (.729) ** .305 1.179 (.817) .172FSS 2.649 (1.125) * .257R2 .108 .130F 6.585*** 6.509***
DR2 .026DF 5.541*
Note. N = 186.* p < .05.** p < .01.*** p < .001.
130 E.N. Wiebe et al. / Computers in Human Behavior 32 (2014) 123–132
addition, the UESz was compared to another instrument, the FlowState Scale, currently in use to measure engagement during videogame play.
3.1. Factor structure
In the exploratory factor analysis, four factors emerged, three ofwhich were well aligned with subscales previously constructed byO’Brien and Toms (2010) as part of the UES: Focused Attention(FAz), Perceived Usability (PUz), and Aesthetics (AEz). The fourthfactor, called Satisfaction (SAz), was a combination of items fromthe original Endurability, Novelty, and Felt Involvement UES sub-scales. In addition, three items from the original scale wereremoved due to lack of correlation with other items, and factorloadings below .4 on these four factors. The newly emergent factor,called Satisfaction (SAz), corresponds to findings reported inO’Brien and Toms (2012) on work conducted by the these authorsand others in the contexts of online shopping, online search, andFacebook use (Banhawi et al., 2012; O’Brien, 2010). This currentstudy provides further evidence that perhaps the original con-structs of Endurability, Novelty, and Felt Involvement should beconsidered a single construct in the context of these types of tasks.
The name Satisfaction was given to this new factor since a re-view of the items that load against this scale all relate closely toself-reported reflection on the more hedonic aspects of their expe-rience. They were items that related to how fun and novel theexperience was, and the likelihood that they would want to play/use this game again. This contrasted with the Perceived Usability(PUz) scale which clearly targeted the utilitarian aspects of thegame environment. Aesthetics, focusing on the visual elements ofthe interface, is seemingly hedonic in nature. However, as Lavieand Tractinsky (2004) point out, an aesthetic response can be influ-enced by both the more classic elements of design—which are clo-sely aligned with usability conventions—and the purely affectiveresponse to the visual design – even if the visual design runs coun-ter to good usability principles. Possibly for this reason, Aestheticsemerges as a dimension that is related yet distinct from the set ofattributes leading to satisfaction with use. Focused Attention (FAz)was also a distinct factor which had items that attempted to cap-ture self-report of what the user was feeling while playing thegame. FAz items such as ‘‘I was absorbed in my gaming task’’ seemquite different in temporal point of view from the more reflectiveitems in the SAz factor: ‘‘My gaming experience was rewarding.’’Focused Attention was similarly distinct from Aesthetics since a vi-sual assessment of the interface could be made without any inter-action with the game. While user assessment of Perceived Usability
also depends on interaction with the game, this construct falls onthe utilitarian side of the utilitarian/hedonic continuum.
3.2. Reliability analysis
Reliability analysis of both the original UES and the newly de-rived UESz provides additional evidence that perhaps the originalsubscales of FI, NO, and EN should both shed a few items and becombined into a new subscale, SAz. The original FI and NO sub-scales only contained three items and EN four items; item countsconsidered small for a stable subscale (Clark & Watson, 1995).These three subscales also had the weakest Cronbach’s alpha val-ues. The new factor structure removed two items, sent one FI itemto FAz and one EN item to PUz, and combined the remaining 7items into the new SAz subscale. This not only provided an appro-priate number of items in each of the new subscales (Furr, 2011),but also resulted in Cronbach’s alpha values between .88 and .89for all four subscales. The new subscales were also all significantlycorrelated with each other, but none over .65, meeting a targetrange of correlations that is typically considered reasonable. Thesecorrelations also reinforce the hedonic/utilitarian divide in the sub-scales, with PUz showing the lowest correlations with the othersubscales.
3.3. Validity analysis of UESz
The inter-correlation matrix in Table 7 for the UESz and FSS pro-vides some modest convergent and divergent validity for the UESzscale. The FSS, as conceptualized by its creators (Jackson & Marsh,1996; Marsh & Jackson, 1999), is meant to be a holistic measure ofa user’s flow state. As such, it encompasses both the more narrowdefinition of flow as represented in the Focused Attention (FAz)subscale, but also the other hedonic dimensions of the UESz: Aes-thetics (AEz) and Satisfaction (SAz). Similarly, the FSS would not beexpected to capture the utilitarian dimension of usability (PUz).FSS-PUz correlation was still significant but quite a bit lower thanwith the other three UESz subscales. Interestingly, the inter-corre-lation model which included the FSS made the relatively modestcorrelations within the UESz between FAz-PUz and AEz-PUz non-significant; thus continuing to reinforce the hedonic/utilitarian dis-tinctions within the UESz.
Finally, criterion validity of the UESz and FSS was explored bylooking at each of these instruments’ predictive power in agame-based context. As noted, it is assumed that individuals withhigher self-reported engagement should perform better at thegame (Przybylski et al., 2010), as defined as the maximum level
E.N. Wiebe et al. / Computers in Human Behavior 32 (2014) 123–132 131
of difficulty reached by the players. It was assumed that both totalamount of time played and the efficiency that players were able tomove through levels would be key factors in the maximum gamelevel reached. The regression analysis found that when all of theUESz subscales and the FSS were used together in a model and ana-lysed holistically, they were significant predictors of Max Level. Inaddition, the UESz subscales predicted more variance (11%) thanthe FSS (4%). Coming out of these two regressions were a pair ofunexpected findings. First, while the regression models were sig-nificant, they accounted for a somewhat disappointingly lowamount of variance. Clearly, there are many other factors otherthan engagement that was determining this performance metric.One possibility is that Max Level is a less than ideal measure of per-formance. Also surprising was that FAz was not significant in theUESz-only regression model. It could very well be that while play-ers were able to adequately report on their state of flow, entering aflow state was not necessary to perform well on this game. Finally,it was interesting to note that AEz had a negative Beta in theregression models. It could be that high ratings of aesthetics wereactually a distraction in effective game-play. This interpretationwould be supported by multimedia research related to extraneouscognitive load (cf., Mayer, 2003), and would also support a modelof aesthetic response more based around non-utilitariandimensions.
The hierarchical regression model in Table 10 provided furthersupport for the interpretation of the relationship of the UESz sub-scales to each other, and to the FSS based on the inter-correlationmatrices (Tables 6 and 7). Adding the FSS to the regression modeloffers a modest but significant improvement of the predictivepower of the model (now at 13% of variance explained). Perhapsmore important is that in this combined model, the FSS plus thePUz and AEz subscales are the significant contributors to the mod-el. FAz, which was not significant in the original regression, is stillnot significant here in the combined model. In addition SAz, whichwas significant in the UESz-only model, is no longer significant inthe combined model. The adjusted Beta drops by two-thirds forFAz, and almost in half for SAz between the two models. This rein-forces the notion that the FSS is capturing elements of the FAz andSAz subscales, but provides a dimension unique from PUz and AEzwhen it comes to predicting performance in this game. It is worthnoting that while the more narrowly defined construct of flow inthe FAz subscale was not significant in this model, the morebroadly defined FSS was. It leads to the conclusion that its contri-bution in this model is more important with regards to this notionof satisfaction with game play.
4. Conclusions
This study has contributed to a further understanding of themeasurement of engagement in video game-based environ-ments. Most importantly, it contributes the refinement of theoriginal UES instrument (O’Brien and Toms, 2010) and suggestsa modified version that is better optimized for use in videogame research. Finally, it provides further scholarship on theconstructs of engagement as they relate to video game-play, inparticular the theoretical conception of flow and how it is expe-rienced in such a context. In particular, when placed withinHassenzahl et al.’s (2010) framework of hedonic and utilitarianqualities, flow, satisfaction, usability, and aesthetics all provideunique contributions to the self-report of engagement during vi-deo game-play, with the former two considered hedonic and thelatter two utilitarian. In addition, using this definition of thesefour constructs, the FSS (Jackson & Marsh, 1996) is measuringnot just a more narrow interpretation of flow, but a broader he-donic quality that also includes satisfaction. While different
names can be attached to these constructs, the important find-ing is that unique qualities related to engagement are foundalong all four dimensions. On the other hand, in the contextof video game-play, less support was found for attempting tomeasure along the six dimensions contained in the originalUES. It is important to note that other studies measuring thepsychometric characteristics of the UES have also suggestedfewer dimensions.
While the validity analysis provided evidence of the generalstrength of the modified UES (UESz)—both in it’s own rightand relative to the FSS—there were a number of questionsraised as to what the FAz scale was or was not measuringand whether one should be expecting individuals to retrospec-tively report entering a state of flow in video games such asthe one used in this study. Clearly more work needs to be doneconcerning what is appropriate criterion measures for flow, inparticular, and engagement in video game-play more generally.Certainly more research is also needed in validating the UESzin more contexts; both video game play and other computer-based environments where the measurement of engagement isof interest to the research community. This work will help builda richer conceptualization of both flow and engagement moregenerally, frame these constructs relative to related constructssuch as immersion (cf., Jennett et al., 2008), and add to a frame-work for evaluating the utility of other measurement techniquesin video game-play research. Finally, another important line ofwork would be to use the measurement of engagement withthe UESz as a means of exploring individual differences. Thisstudy did not collect deep enough data on the participants toeffectively study such questions, but future work can pair theUESz with deep demographic profiles to explore how interfacecharacteristics of video games interact with individual differ-ences to create differing levels of engagement.
Acknowledgements
The authors would like to acknowledge that Jennifer Londonprovided help on the initial data collection and analysis of this re-search project. This material is based upon work partially sup-ported by the National Science Foundation under Grant No.DRL-1007962.
References
Admiraal, W., Huizenga, J., Akkerman, S., & Dam, G. T. (2011). The concept of flow incollaborative game-based learning. Computers in Human Behavior, 27(3),1185–1194. http://dx.doi.org/10.1016/j.chb.2010.12.013.
Amazon.com. (2010). Mechanical Turk. <http://www.mturk.com/> (retrieved21.07.011).
Appleton, J. J., Christenson, S. L., Kim, D., & Reschly, A. L. (2006). Measuring cognitiveand psychological engagement: Validation of the student engagementinstrument. Journal of School Psychology, 44(5), 427–445.
Arguello, J., Wu, W.-C., Kelly, D., & Edwards, A. (2012). Task complexity, verticaldisplay and user interaction in aggregated search. In Paper presented at theproceedings of the 35th international ACM SIGIR conference on research anddevelopment in information retrieval, Portland, Oregon, USA.
Attfield, S., Kazai, G., Lalmas, M., & Piwowarski, B. (2011). Towards a science of userengagement (Position paper). In Paper presented at the WSDM workshop on usermodelling for web applications, Hong Kong, China.
Banhawi, F., Ali, N. M., & Judi, H. M. (2012). User engagement attributes and levels infacebook. Journal of Theoretical and Applied Information Technology, 41(1), 11–19.
Behrend, T. S., Sharek, D. S., Meade, A. W., & Wiebe, E. N. (2011). The viability ofcrowdsourcing for survey research. Behavior Research Methods. http://dx.doi.org/10.3758/s13428-011-0081-0.
Bempechat, J., & Shernoff, D. (2012). Parental influences on achievement motivationand student engagement. In S. L. Christenson, A. L. Reschly, & C. Wylie (Eds.),Handbook of research on student engagement (pp. 315–342). US: Springer.
Bourgonjon, J., Valcke, M., Soetaert, R., & Schellens, T. (2010). Students’ perceptionsabout the use of video games in the classroom. Computers and Education, 54(4),1145–1156. http://dx.doi.org/10.1016/j.compedu.2009.10.022.
132 E.N. Wiebe et al. / Computers in Human Behavior 32 (2014) 123–132
Boyle, E., Connolly, T. M., & Hainey, T. (2011). The role of psychology inunderstanding the impact of computer games. Entertainment Computing, 2(2),69–74. http://dx.doi.org/10.1016/j.entcom.2010.12.002.
Brockmyer, J. H., Fox, C. M., Curtiss, K. A., McBroom, E., Burkhart, K. M., & Pidruzny, J.N. (2009). The development of the game engagement questionnaire: A measureof engagement in video game-playing. Journal of Experimental Social Psychology,45(4), 624–634. http://dx.doi.org/10.1016/j.jesp.2009.02.016.
Clark, L. A., & Watson, D. (1995). Constructing validity: Basic issues in objectivescale development. Psychological Assessment, 7(3), 309–319.
Comrey, A. L., & Lee, H. B. (1992). A first course in factor analysis (2nd ed.). Hilldsale,N.J.: Erlbaum.
Csikszentmihalyi, M. (1990). Flow: The psychology of optimal experience. New York,NY: Harper-Row.
Faiola, A., Newlon, C., Pfaff, M., & Smyslova, O. (2012). Correlating the effects of flowand telepresence in virtual worlds: Enhancing our understanding of userbehavior in game-based learning. Computers in Human Behavior, 29(3),1113–1121. http://dx.doi.org/10.1016/j.chb.2012.10.003.
Field, A. P. (2009). Discovering statistics using SPSS (3rd ed.). Los Angeles: Sage.Fredricks, J. A., Blumenfeld, P. C., & Paris, A. H. (2004). School engagement: Potential
of the concept, state of the evidence. Review of Educational Research, 74(1),59–109.
Fu, F.-L., Su, R.-C., & Yu, S.-C. (2009). EGameFlow: A scale to measure learners’enjoyment of e-learning games. Computers and Education, 52, 101–112. http://dx.doi.org/10.1016/j.compedu.2008.07.004.
Furr, M. R. (2011). Scale construction and psychometrics for social and personalitypsychology. London, UK: Sage.
Hardy, M., Wiebe, E. N., Grafsgaard, J. F., Boyer, K. E., Lester, J. C. (2013).Physiological responses to events during training: Use of skin conductance todesign adaptive learning systems. In Proceedings of the human factors andergonomic society 57th annual meeting.
Hassenzahl, M., Diefenbach, S., & Göritz, A. (2010). Needs, affect, and interactiveproducts – Facets of user experience. Interacting With Computers, 22(5),353–362.
Hutcheson, G. D., & Sofroniou, N. (1999). The multivariate social scientist. London:Sage.
Jackson, S. A., & Marsh, H. W. (1996). Development and validation of a scale tomeasure optimal experience: The flow state scale. Journal of Sport and ExercisePsychology, 18, 17–35.
Jennett, C., Cox, A. L., Cairns, P., Dhoparee, S., Epps, A., Tijs, T., et al. (2008).Measuring and defining the experience of immersion in games. InternationalJournal of Human–Computer Studies, 66(9), 641–661.
Kass, R. A., & Tinsley, H. E. A. (1979). Factor analysis. Journal of Leisure Research, 11,120–138.
Kato, Y., & Suzuki, K. (2003). An approach for redesigning learning environmentswith Flow Theory. In D. Lassner & C. McNaught (Eds.), Proceedings of worldconference on educational multimedia, hypermedia and telecommunications (pp.281–288).
Lavie, T., & Tractinsky, N. (2004). Assessing dimensions of perceived visualaesthetics of web sites. International Journal of Human–Computer Studies,60(3), 269–298.
Lehmann, J., Lalmas, M., Yom-Tov, E., & Dupret, G. (2012). Models of userengagement. In Paper presented at the proceedings of the 20th internationalconference on user modeling, adaptation, and personalization, Montreal, Canada.
Liao, L. Ä. (2006). A flow theory perspective on learner motivation and behavior indistance education. Distance Education, 27(1), 45–62. http://dx.doi.org/10.1080/01587910600653215.
Ma, Y., & Williams, D. (2011). Designing an Electronic Educational Game toFacilitate Immersion and Flow. In Paper presented at the AERA Annual Meeting,New Orleans, LA.
MacCallum, R. C., Wildaman, K. F., Zhang, S., & Hong, S. (1999). Sample size in factoranalysis. Psychological Methods, 4(1), 84–89. http://dx.doi.org/10.1037/1082-989X.4.1.84.
Malone, T. W., & Lepper, M. R. (1987). Making learning fun: A taxonomy of intrinsicmotivations for learning. In R. E. Snow & M. J. Farr (Eds.). Aptitude learning andinstruction (Vol. 3, pp. 223–253). Mahwah, NJ: Erlbaum.
Mandryk, R. L., Inkpen, K. M., & Calvert, T. W. (2006). Using psychophysiologicaltechniques to measure user experience with entertainment technologies.Behaviour and Information Technology, 25(2), 141–158. http://dx.doi.org/10.1080/01449290500331156.
Marsh, H. W., & Jackson, S. A. (1999). Flow experience in sport: Construct validationof multidimensional, hierarchical state and trait responses. Structural EquationModeling – A Multidisciplinary Journal, 6(4), 343–371. http://dx.doi.org/10.1080/10705519909540140.
Mayer, R. E. (2003). Elements of a science of e-learning. Journal of EducationalComputing Research, 29(3), 297–313.
Mayo, M. J. (2009). Video games: A route to large-scale STEM education? Science,323(5910), 79–82.
O’Brien, H. L. (2010). The influence of hedonic and utilitarian motivations on userengagement: The case of online shopping experiences. Interacting withComputers, 22(5), 344–352. http://dx.doi.org/10.1016/j.intcom.2010.04.001.
O’Brien, H. L., & Toms, E. G. (2008). What is user engagement? A conceptualframework for defining user engagement with technology. Journal of theAmerican Society for Information Science and Technology, 59(6), 938–955. http://dx.doi.org/10.1002/asi.20801.
O’Brien, H. L., & Toms, E. G. (2010). The development and evaluation of a survey tomeasure user engagement. Journal of the American Society for Information Scienceand Technology, 61(1), 50–69. http://dx.doi.org/10.1002/asi.21229.
O’Brien, H. L., & Toms, E. G. (2012). Examining the generalizability of the UserEngagement Scale (UES) in exploratory search. Information Processing andManagement, 49(5), 1092–1107. http://dx.doi.org/10.1016/j.ipm.2012.08.005.
Picard, R. W. (2010). Affective computing: From laughter to IEEE. IEEE Transactionson Affective Computing, 1(1), 11–17. http://dx.doi.org/10.1109/t-affc.2010.10.
Przybylski, A. K., Rigby, C. S., & Ryan, R. M. (2010). A motivational model of videogame engagement. Review of General Psychology, 14(2), 154–166. http://dx.doi.org/10.1037/a0019440.
Rieber, L. P. (1996). Seriously considering play: Designing interactive learningenvironments based on the blending of microworlds, simulations, and games.Educational Technology Research and Development, 44(2), 43–58.
Ryan, R. M., & Deci, E. L. (2000). Self-determination theory and the facilitation ofintrinsic motivation, social development, and well-being. American Psychologist,55(1), 68–78.
Sharek, D. (2009). Block Walk (Version 1.0), Raleigh, NC.Sharek, D. (2012). Investigating real-time predictors of engagement: Implications
for adaptive video games and online training. (Ph.D.), North Carolina StateUniversity, Raleigh, NC.
Sherry, J. L. (2004). Flow and media enjoyment. Communication Theory, 14(4),328–347. http://dx.doi.org/10.1111/j.1468-2885.2004.tb00318.x.
Shneiderman, B. (1998). Designing the user interface: Strategies for effective human–computer interaction (3rd ed.). Reading, MA: Addison-Wesley.
Skelly, T., Fries, K., Linnett, B., Nass, C., & Reeves, B. (1994). Seductive interfaces:Satisfying a mass audience. In Paper presented at the Conference Companion onHuman Factors in Computing Systems, Boston, Massachusetts, USA.
Stephenson, W. (1967). The play theory of mass communication. Chicago: Universityof Chicago Press, pp. 45–65.
Tabachnick, B. G., & Fidell, L. S. (2007). Using multivariate statistics (5th ed.). Boston:Pearson.
Turkay, S. (2012). User experiences with avatar customization in second life andlord of the rings online. In Paper presented at the fourth annual teachers collegeeducational technology conference, New York, NY.
Venkatesh, V., & Bala, H. (2008). Technology acceptance model 3 and a researchagenda on interventions. Decision Sciences, 39(2), 273–315.
Vorderer, P., Klimmt, C., & Ritterfeld, U. (2004). Enjoyment: At the heart of mediaentertainment. Communication Theory, 14(4), 388–408. http://dx.doi.org/10.1111/j.1468-2885.2004.tb00321.x.
Weibel, D., Wissmath, B., Habegger, S., Steiner, Y., & Groner, R. (2008). Playing onlinegames against computer- vs. human-controlled opponents: Effects on presence,flow, and enjoyment. Computers in Human Behavior, 24(5), 2274–2291. http://dx.doi.org/10.1016/j.chb.2007.11.002.
Whitton, N. (2011). Game engagement theory and adult learning. Simulation andGaming, 42(5), 596–609. http://dx.doi.org/10.1177/1046878110378587.