measuring diversity on a low-altitude uav in a ground-to...
TRANSCRIPT
Measuring Diversity on a Low-Altitude UAV in aGround-to-Air Wireless 802.11 Mesh Network
H. T. Kung, Chit-Kwan Lin, Tsung-Han Lin, Stephen J. Tarsa, Dario VlahHarvard UniversityCambridge, MA
Abstract—We consider the problem of mitigating a highlyvarying wireless channel between a transmitting ground nodeand receivers on a small, low-altitude unmanned aerial vehicle(UAV) in a 802.11 wireless mesh network. One approach is to usemultiple transmitter and receiver nodes that exploit the channel’sspatial/temporal diversity and that cooperate to improve overallpacket reception. We present a series of measurement resultsfrom a real-world testbed that characterize the resulting wirelesschannel. We show that the correlation between receiver nodeson the airplane is poor at small time scales so receiver diversitycan be exploited. Our measurements suggest that using severalreceiver nodes simultaneously can boost packet delivery ratessubstantially. Lastly, we show that similar results apply totransmitter selection diversity as well.
I. INTRODUCTION
Small, low-altitude unmanned aerial vehicles (UAVs) havereached a development point where they are useful in manyreal-world applications, both military and civilian, such assurveillance, reconnaissance, photography, communications,environmental and traffic monitoring, etc. At the same time,researchers are investigating new UAV-related problems suchas autonomous control, swarming, mesh networking, airbornecomputing, etc. These topics have a common need for an everincreasing amount of wireless communications and network-ing, making this an important support area in UAV research. Inparticular, commercial-off-the-shelf technologies such as IEEE802.11 wireless LAN have made it practical to build low-costaerial wireless mesh networks [1], [2], [3].
However, a key challenge to deployment is achieving goodlink qualities. Rapid changes in signal strength due to UAVbanking maneuvers and outages dictated by environmentalshadowing or flight paths translate into a highly varying andlossy wireless channel between ground transmitters and UAVreceivers. This is of particular concern to fixed-wing aircraft,which are attractive due to their efficiency and relatively highmobility but have physical flight path induced complications.
While one could use better or more powerful radios, similarissues of high link loss and variation could still arise atlarger distances. Since it is well-known that node position andorientation can greatly impact wireless link quality [4], [5],we consider an alternative approach where multiple receivernodes on-board a UAV cooperate to boost packet deliveryrates from a ground transmitter by exploiting the spatial andtemporal diversity of the wireless channel. This scheme alsoeasily extends to multiple ground transmitters by means of
Rx 1 Rx 2
Rx 3
Rx 4 in cockpit
Rx 1, 2
Rx 3
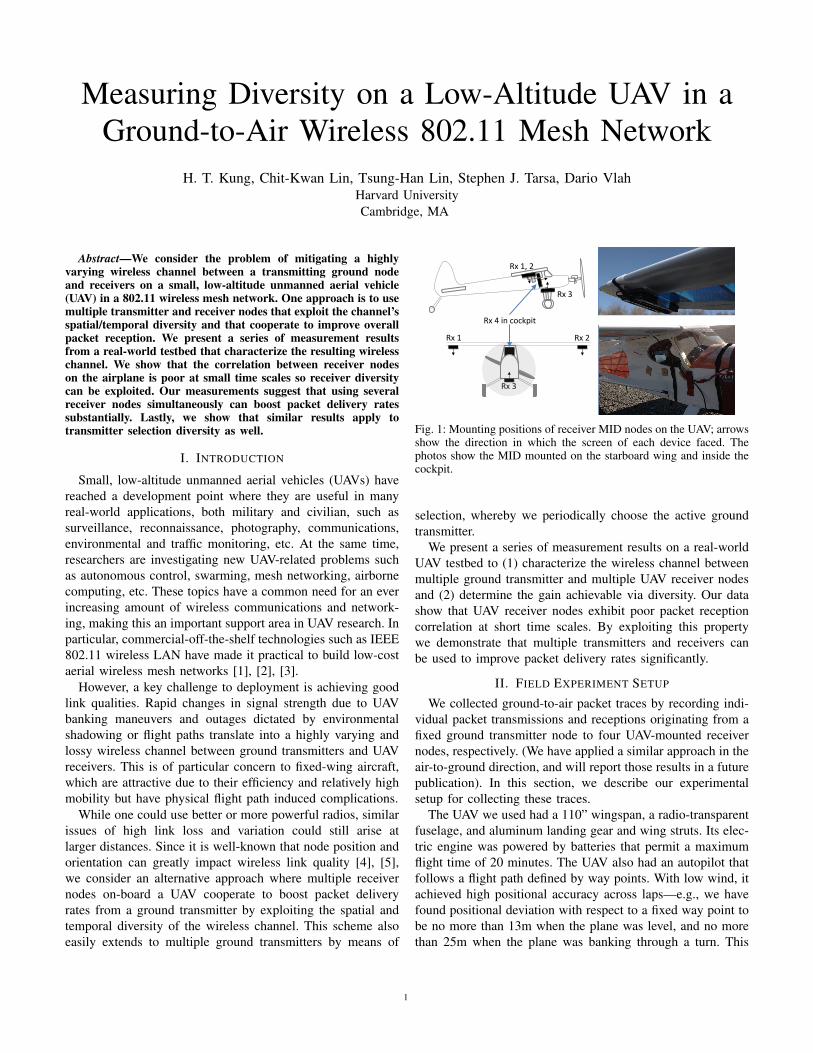
Fig. 1: Mounting positions of receiver MID nodes on the UAV; arrowsshow the direction in which the screen of each device faced. Thephotos show the MID mounted on the starboard wing and inside thecockpit.
selection, whereby we periodically choose the active groundtransmitter.
We present a series of measurement results on a real-worldUAV testbed to (1) characterize the wireless channel betweenmultiple ground transmitter and multiple UAV receiver nodesand (2) determine the gain achievable via diversity. Our datashow that UAV receiver nodes exhibit poor packet receptioncorrelation at short time scales. By exploiting this propertywe demonstrate that multiple transmitters and receivers canbe used to improve packet delivery rates significantly.
II. FIELD EXPERIMENT SETUP
We collected ground-to-air packet traces by recording indi-vidual packet transmissions and receptions originating from afixed ground transmitter node to four UAV-mounted receivernodes, respectively. (We have applied a similar approach in theair-to-ground direction, and will report those results in a futurepublication). In this section, we describe our experimentalsetup for collecting these traces.
The UAV we used had a 110” wingspan, a radio-transparentfuselage, and aluminum landing gear and wing struts. Its elec-tric engine was powered by batteries that permit a maximumflight time of 20 minutes. The UAV also had an autopilot thatfollows a flight path defined by way points. With low wind, itachieved high positional accuracy across laps—e.g., we havefound positional deviation with respect to a fixed way point tobe no more than 13m when the plane was level, and no morethan 25m when the plane was banking through a turn. This
1
permitted repeatable data collection over multiple laps withina flight and over multiple flights. During a flight, we loggedaltitude, airspeed, GPS latitude/longitude, and GPS time every250ms.
At an altitude of 75m, our UAV followed a cyclical,dumbbell-shaped flight path that passed beyond the radio rangeat the extremes (Figures 2a–2d). Each lap ran clockwise and,at an airspeed of 20m/s, lasted ∼90s. Cruising time for eachflight was ∼15 minutes, meaning the UAV covered ten lapsper flight. We collected packet traces over four flights in total.These flights were conducted at a property surrounded bywoods and farmland, free of 802.11 radio traffic.
Our wireless mesh network nodes were Mobile InternetDevices (MIDs) that feature an 800MHz x86-compatible IntelAtom processor, a Marvell SD8686 802.11b/g internal SDIOradio, an internal omnidirectional antenna and Ubuntu Linux8.04. The antenna orientation was determined by the directionat which the MID screen faces. One transmitter MID wasplaced amid tall grass and brush, elevated 20cm from theground, with its screen facing skyward. Its location is shownas a square in Figures 2 and 4. Four receiver MID nodes (Rx1to Rx4) were mounted on the UAV as shown in Figure 1.Rx1 and Rx2 were mounted with screens facing the ground,one on the underside of each wing tip. Rx3, with its screenfacing skyward, was mounted between the landing gear andRx4, with its screen facing the bow, was mounted insidethe cockpit. The direction of mounting is significant sincemeasurements we took in an anechoic chamber show that theMID’s antenna pattern is asymmetric (Figure 3). Thus, ourmounting configuration provides diversity in antenna patternsand offers different shadowing profiles from the landing gear,engine and batteries.
We placed all the 802.11 nodes in ad-hoc mode using the 1Mbps modulation. To collect traces, our transmitter broadcast1420-byte UDP packets, with unique sequence numbers, at 80pkt/s. The receiver nodes on the UAV ran a client that loggedthe sequence number and timestamp of each received packet.
¡
III. EXPERIMENT RESULTS
In this section we present experiment results and discusstheir significance. We begin with a look at basic single-receiverproperties of the collected data. Next, we examine the gainof receive diversity, due to multiple receivers, and discuss itssources. Lastly, we present measurements of transmit diversity,due to multiple transmitters.
A. Baseline Single-receiver Performance
To gain a qualitative understanding of reception behavior inour particular flight pattern we analyzed our collected tracesas follows. For each receiver, we first divided its packettraces into 20-packet windows, forming a windowed tracefor each flight, and then calculated the packet loss rate overeach window. This window size captures the loss rate over areasonably short distance: 20 packets correspond to 250ms of
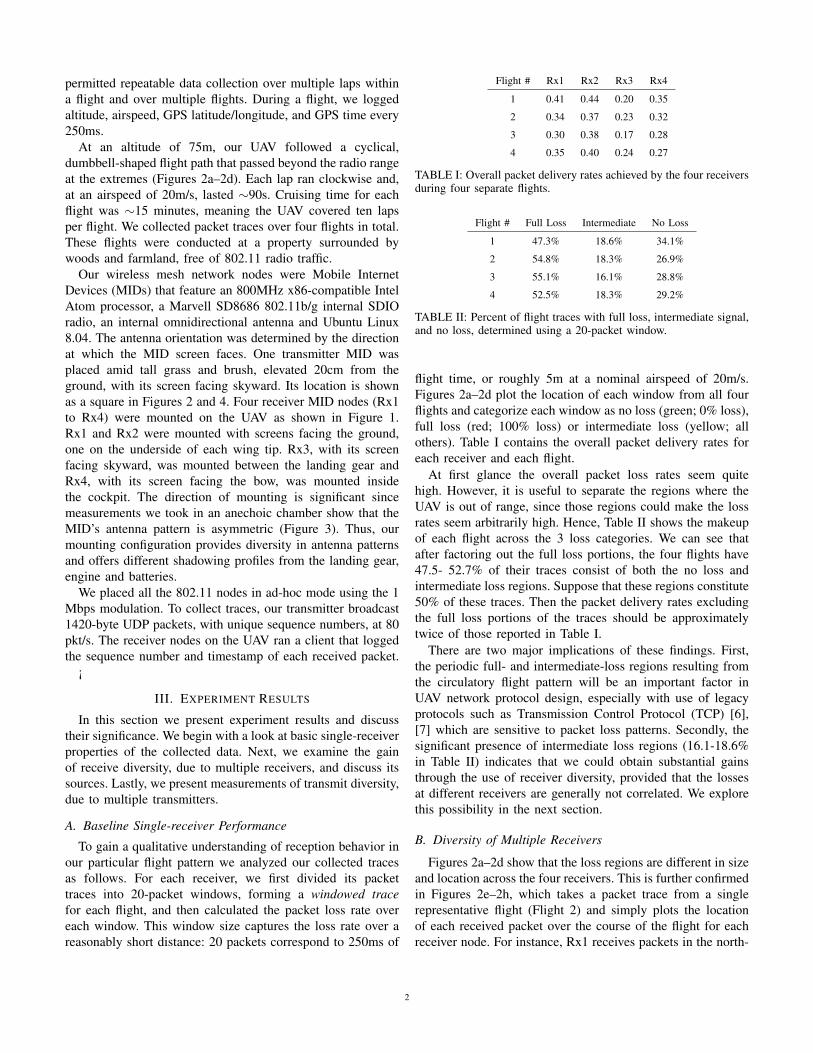
Flight # Rx1 Rx2 Rx3 Rx4
1 0.41 0.44 0.20 0.35
2 0.34 0.37 0.23 0.32
3 0.30 0.38 0.17 0.28
4 0.35 0.40 0.24 0.27
TABLE I: Overall packet delivery rates achieved by the four receiversduring four separate flights.
Flight # Full Loss Intermediate No Loss
1 47.3% 18.6% 34.1%
2 54.8% 18.3% 26.9%
3 55.1% 16.1% 28.8%
4 52.5% 18.3% 29.2%
TABLE II: Percent of flight traces with full loss, intermediate signal,and no loss, determined using a 20-packet window.
flight time, or roughly 5m at a nominal airspeed of 20m/s.Figures 2a–2d plot the location of each window from all fourflights and categorize each window as no loss (green; 0% loss),full loss (red; 100% loss) or intermediate loss (yellow; allothers). Table I contains the overall packet delivery rates foreach receiver and each flight.
At first glance the overall packet loss rates seem quitehigh. However, it is useful to separate the regions where theUAV is out of range, since those regions could make the lossrates seem arbitrarily high. Hence, Table II shows the makeupof each flight across the 3 loss categories. We can see thatafter factoring out the full loss portions, the four flights have47.5- 52.7% of their traces consist of both the no loss andintermediate loss regions. Suppose that these regions constitute50% of these traces. Then the packet delivery rates excludingthe full loss portions of the traces should be approximatelytwice of those reported in Table I.
There are two major implications of these findings. First,the periodic full- and intermediate-loss regions resulting fromthe circulatory flight pattern will be an important factor inUAV network protocol design, especially with use of legacyprotocols such as Transmission Control Protocol (TCP) [6],[7] which are sensitive to packet loss patterns. Secondly, thesignificant presence of intermediate loss regions (16.1-18.6%in Table II) indicates that we could obtain substantial gainsthrough the use of receiver diversity, provided that the lossesat different receivers are generally not correlated. We explorethis possibility in the next section.
B. Diversity of Multiple Receivers
Figures 2a–2d show that the loss regions are different in sizeand location across the four receivers. This is further confirmedin Figures 2e–2h, which takes a packet trace from a singlerepresentative flight (Flight 2) and simply plots the locationof each received packet over the course of the flight for eachreceiver node. For instance, Rx1 receives packets in the north-
2

(a) Rx1 (b) Rx2 (c) Rx3 (d) Rx4
(e) Rx1 (f) Rx2 (g) Rx3 (h) Rx4
Fig. 2: Packet loss and reception over the flight path. The top of the page is the northerly direction and the square indicates the location ofthe ground transmitter node. (a)–(d): Packet loss rates over all four flights, per receiver. Each point denotes a 20 packet window over whichthe loss rate is calculated; green is no loss, red is full, and yellow is intermediate. Note the autopilot system gives a stable trajectory overmultiple laps and flights (points falling outside the dumbbell-shaped path are from human piloting during take-off and landing). (e)–(h):Location of each packet reception event, per receiver, during a single flight (Flight 2).
-‐90
-‐80
-‐70
-‐60
0 10 20
30 40
50 60 70
80
90
100
110 120
130 140
150 160 170
180 190 200
210 220
230 240
250
260
270
280
290 300 310
320 330
340 350
-‐90
-‐80
-‐70
-‐60
-‐50 10
20 30 40
50 60 70 80
90
100
110
120 130
140 150
160 170 180
190 200 210
220 230
240 250
260
270
280
290
300 310 320
330 340
350 360
0o Posi0on
+90o Posi0on
COMPA
L
0o Posi0on
+90o Posi0on
COMPAL
Fig. 3: RSSI in dB where the MID receiver is rotated about oneaxis, as measured in an anechoic chamber. The transmitter (notshown) is positioned at the +90◦ orientation. Lower: the 0◦–180◦
measurements indicate the relative signal strength the wing-mountedreceivers would experience when passing directly over a groundtransmitter; the 180◦–360◦ measurements for the undercarriage-mounted MID; and the 90◦–270◦ measurements for the cockpit-mounted MID. Upper: rotations around the long axis of the deviceoccur during UAV banking for the wing and bottom MID, and UAVchanging direction for the cockpit MID.
west quadrant (i.e., on approach towards the ground node), butRx2 does not until it is almost flying over the ground node.
The above behaviors led us to examine the reception cor-relation amongst pairs of receiver nodes over the course of
Fig. 4: Reception event correlation coefficient (ρ) between a repre-sentative pair of receivers over Flight 2. The color of each point isthe value of the correlation coefficient over a 20 packet window. Thetop of the figure is the northerly direction and the square indicatesthe location of the ground transmitter node.
a flight (Flight 2). To do so, we first synchronize the packettraces of two receiver nodes, generate the windowed traces foreach as before, and then calculate the correlation coefficient
ρ =E [(X − µX) (Y − µY )]
σXσY(1)
of the packet reception pattern in pairs of windows X and Ycorresponding to the same location along the flight path forthe two receivers. Note that the correlation coefficient is notdefined for any window pair in which at least one window haseither no loss or full loss; we ignore such window pairs as aresult. We performed this operation for all pairs of receivers.
Figure 4 plots the results for each receiver pair assuming
3

0
0.5
1
1.5
2
2.5
3
-1 -0.8 -0.6 -0.4 -0.2 0 0.2 0.4 0.6 0.8 1
Norm
aliz
ed F
requency
Correlation Coefficient (ρ)
Rx1, Rx2Rx1, Rx3Rx1, Rx4Rx2, Rx3Rx2, Rx4Rx3, Rx4
Fig. 5: Normalized histogram of the correlation coefficient (ρ) cal-culated over 20-packet windows for each receiver pair during Flight2.
20-packet windows. The color of each data point indicatesthe ρ value for that location. Receivers mounted externally(Rx1, Rx2, and Rx3) were well-correlated when the UAVpassed close to the ground node, but were poorly correlatedfurther away. This is also demonstrated in Figure 5, whichis a normalized histogram of the ρ values from Flight 2 foreach receiver pair. While all pairs have significant mass inρ = [−0.2, 0.2], indicating a general lack of correlation overmost of the flight path, only externally-mounted node pairsshow an additional large peak at ρ = 1.0, a region of highcorrelation where the UAV passes near the ground node. Incontrast, pairs (Rx1, Rx4) and (Rx2, Rx4), which correspondto the wing/cockpit node pairs, lack this peak entirely andare actually the most uncorrelated nodes since they have theoverall largest peaks at ρ = 0.1. This disparity is due to Rx4being mounted in the cockpit and having an antenna orien-tation significantly different from that of the wing-mountednodes (see Figure 3). Taken together, these results indicatethat receivers are uncorrelated over large portions of the flightpath and suggest that employing multiple receiver nodes tocooperatively boost receiver diversity can help improve packetdelivery rates on-board the UAV.
To determine the gain due to receiver diversity, we combinethe packet receptions at the four receivers into a combinedtrace, where a packet is marked as received if it was receivedby at least one individual receiver. Table III shows the diversityperformance in terms of the overall delivery rates of combinedtraces for each flight, alongside the best single receiver’sdelivery rate. We can see that diversity brings about anadditional gain of roughly 25%.
C. Diversity at Various Time Scales
We next discuss the availability of diversity gain at varioustime scales in our experiments. First, on large time scales of,say, one flight lap, the reception traces are clearly correlated,resulting from all receiver nodes experiencing nearly identical
Flight 1 Flight 2 Flight 3 Flight 4
Best singlereceiver
Rx2 Rx2 Rx2 Rx2
Best singledelivery rate
0.44 0.37 0.38 0.40
Combineddelivery rate
0.55 0.49 0.46 0.51
Percentimprovement
25% 32% 21% 28%
TABLE III: Combined packet delivery rates achieved by the fourreceivers during four separate flights, and the resulting receiverdiversity gains.
path loss—as the mobile node moves far enough out ofrange of the transmitter, the loss of signal strength due todistance cannot be overcome by small differences between thereceivers. Thus, receiver diversity might not help much heresince all receivers undergo the same outage. Similarly, whenthe receivers are in close proximity of the transmitter, the lossrate is low enough that diversity cannot significantly improveit.
It is more interesting to examine diversity behavior atmedium time scales, e.g., 1/8 of a lap. At this scale, thedistance may not change enough to cause a major shift in pathloss, and thus other effects become more pronounced. Namely,links may be shadowed diversely by various obstructions, suchas the airplane as it banks, or even external objects like trees.
Lastly, on small time scales, where path loss does notchange significantly due to either changing distance or shad-owing, links may still undergo independent rapid variationsdue to fast fading. Fast fading occurs when multipath signalscombine with a varying phase difference, e.g., due to Dopplereffect or varying path lengths. The salient question is whetherfast fading is present in our experiment environment, and ifso, to what extent it occurs independently at each receiver.
We evaluate diversity at different time scales in two ways.First, we compute the correlation of all receiver pairs overincreasing time spans. Secondly, we compare the diversitygain in our traces to that of synthetic traces generated using aBernoulli process.
1) Correlation vs. time scale: We compute the correlationbetween two receiver traces as follows. For a window size ofw packets, we draw 1000 pairs of w-packet trace segmentsstarting at randomly chosen points in the traces, and computethe average correlation coefficient, but not counting segmentswhere all or none packets were lost. We repeat the computationfor window sizes ranging from 1 to 10000 packets, or 135seconds. Figure 6 shows the resulting correlations.
Two features stand out in the plot. First, there is a cleardifference between the correlation of different receiver pairs.The pair with most correlation, Rx1 and Rx2, are the tworeceivers mounted on the underside of the wings, corroboratingthe finding from Section III-B. At the same time, the pairwith least correlation are Rx3 and Rx4, which differ not only
4

Fig. 6: Correlation behavior at different time scales. Shown arecorrelation plots for 6 possible receiver pairs.
in mounting orientation but also in the nature of line-of-sightobstruction; Rx3 is mounted on the UAV’s bottom while Rx4is inside the cockpit area.
The second main feature of the plot is the apparent sharpincrease in correlation at window sizes of up to about 60s. Thistime scale is large enough that it covers both in- and out-of-range regions of the flight path, where all receivers startto experience the same large-scale path-loss effects. Belowthis window size, however, correlation decreases, indicatinga lack of dependence due to fading. Finally, as windowsize decreases further, the correlation increases again due toincreasing fraction of windows with all or no packet losses,skewing the average correlation coefficient.
2) Comparison with Bernoulli traces: We now look forfurther evidence of independent packet loss behavior at shorttime scales. In particular, we compare the collected tracesto synthetic Bernoulli traces constructed as follows. Let usdivide a collected trace into N segments of length w packets.For each segment i, we compute its packet delivery rate,pi. For each i, we construct a synthetic packet loss segmentby performing w Bernoulli trials with parameter pi. Finally,we concatenate the N segments, repeat the process for allreceivers’ traces, and merge the traces into a combined traceas described at end of Section III-B.
The diversity performance of synthetic traces should corre-spond closely to that of a system where receivers experienceonly the independent Gaussian noise. In Figure 7 we presentthe diversity performance of synthetic traces for a range ofwindow sizes w, and compare to performance of the systemin our experiment. We can see that, indeed, the performancesmatch very closely at short time scales, and begin to divergeat window sizes similar to those of increasing correlation inFigure 6. This seems to indicate that fading has little effectin our environment, and that packet loss behavior is largelyindependent at short time scales.
0.4
0.5
0.6
0.7
0.8
0.9
0 20 40 60 80 100 120 140
Del
iver
y ra
te
Window size (seconds)
Synthetic diversity
Fig. 7: Diversity performance in terms of delivery rate of a set ofsynthetic traces created using a Bernoulli process based on data fromFlight 2. In contrast, the diversity performance of real traces from thesame flight is 0.49, as Table III indicates.
D. Multiple-Transmitter Diversity Using Selection
In addition to the single-transmitter flights discussed in theprevious sections, we conducted one flight with 3 groundtransmitters which took turns broadcasting one full-size UDPpacket at a time. We controlled the timing of these trans-missions precisely using a wired control network. Thus, weobtained the channel qualities for 12 links (3 transmitters × 4receivers) but at 1/3 the resolution, as the transmissions wereinterleaved.
Let us assume that transmitters obtain channel qualityfeedback every w packets, so that every w packets our systemcan select the best transmitting node. Thus, we can calculatethe transmitter selection diversity gain by dividing the tracesinto size-w windows, and construct a combined trace by takingthe best performing ones. Additionally, for each window,we can calculate the performance either to a single receiveror multiple receivers using receiver diversity, thus obtainingperformance under several combinations of transmitter andreceiver diversity. We present the resulting delivery rates inTable IV, calculated for w = 27, or roughly 1 second; wediscuss the choice of this value below. We can see that transmitdiversity gives us another significant increase in delivery rate,independent of whether receive diversity is used.
Unlike receiver diversity, transmitter selection diversity re-quires periodic channel quality feedback. A good choice forthe feedback rate would introduce minimal overhead while stillproviding up-to-date channel quality information. To checkthe effect of this parameter in our experiment scenario, werecomputed transmit diversity gain from Table IV using arange of values for w; the results appear in Table V. We cansee that most of the gain is already available at rates around1s.
5

Transmission pattern Delivery rate Percent improvement
#1 Tx2 to Rx2 0.41
#2 all to Rx2 0.46 12% over #1
#3 Tx2 to all 0.51 24% over #1
#4 all to all 0.57 12% over #3, 24% over #1
TABLE IV: Packet delivery rates achieved by 1) single transmitterto single receiver, 2) 3 transmitters to single receiver, 3) singletransmitter to 4 receivers, and 4) 3 transmitters to 4 receivers. Insingle transmitter or receiver cases, we used the best performing node.
Selectionwindow(packets)
1 10 27 50 100 500 1000
Delivery rate 0.57 0.57 0.57 0.56 0.56 0.54 0.53
TABLE V: Packet delivery rates for increasing selection feedbackintervals, in the 3-to-4 transmission scenario. The 27-packet intervalcorresponds to 1s.
IV. CONCLUSIONS
In this paper we presented results of an experimental studyof ground-to-air UAV links. We found that the links areintermediate in their qualities for a significant amount of time,owing to the UAV moving in and out of range frequently;this might be a property specific to fixed-wing craft, but isimportant nonetheless as those make up the most efficient classof fliers. As a result, network layer protocols will need to beadapted to cope with this situation, or to work on top of linklayer mechanisms which use, e.g., coding or retransmissionsto mask the loss [7].
At small time scales of up to 1000 packets, or about 10seconds, we found that the packet losses seem to be almostuncorrelated, giving diversity performance very similar to thatof synthetic traces generated using Bernoulli trials. This seemsto indicate that the effect of fast fading is not significant inour environment in any direction, in the sense that it does notresult in either better or worse diversity performance than thatof memoryless losses.
The diversity gain we observed with four receiver nodesconsisted of an average 25% increase in delivery rate, and anadditional 12% with three transmitter nodes using selectiondiversity. On one side, a question arises whether this is suffi-cient to warrant the addition of extra receivers on a UAV; in theevent that the multiple receivers are already present in the UAVapplication, using them for diversity reception would providea clear and inexpensive benefit. Finally, on the transmit side,using multiple transmitters introduces protocol complicationsrelated to feedback, synchronization, packet retransmissions,etc. However, as has been shown in previous work [8], many ofthese issues can be addressed using network coding techniqueswhich reduce the need for frequent feedback.
ACKNOWLEDGEMENTS
This material is based on research sponsored by Air ForceResearch Laboratory under agreement numbers FA8750-09-
2-0180 and FA8750-10-2-0180. The U.S. Government is au-thorized to reproduce and distribute reprints for Governmentalpurposes notwithstanding any copyright notation thereon. Theviews and conclusions contained herein are those of theauthors and should not be interpreted as necessarily repre-senting the official policies or endorsements, either expressedor implied, of Air Force Research Laboratory or the U.S.Government.
REFERENCES
[1] T. Brown, B. Argrow, C. Dixon, and S. Doshi, “Ad Hoc UAV GroundNetwork (AUGNet),” in AIAA 3rd “Unmanned Unlimited” TechnicalConference, 2004.
[2] A. Ryan, X. Xiao, S. Rathinam, J. Tisdale, M. Zennaro, D. Caveney,R. Sengupta, and J. K. Hedrick, “A modular software infrastructurefor distributed control of collaborating uavs,” in Proc. AIAA Conf. onGuidance, Navigation and Control, 2006.
[3] D. Hague, H. T. Kung, and B. W. Suter, “Field experimentation of cots-based uav networking,” in MILCOM, 2006.
[4] D. Aguayo, J. Bicket, S. Biswas, G. Judd, and R. Morris, “Link-levelmeasurements from an 802.11b mesh network,” in SIGCOMM, 2004.
[5] J. Bicket, D. Aguayo, S. Biswas, and R. Morris, “Architecture andevaluation of an unplanned 802.11b mesh network,” in MobiCom, 2005.
[6] J. Postel, “Transmission control protocol,” RFC 793, Sep. 1981.[7] H. T. Kung, C.-K. Lin, T.-H. Lin, S. J. Tarsa, and D. Vlah, “A location-
dependent runs-and-gaps model for predicting TCP performance over aUAV wireless channel,” in MILCOM 2010 (to appear), San Jose, CA,USA, 2010.
[8] ——, “Flowcode: Multi-site data exchange over wireless ad-hoc networksusing network coding,” in MILCOM, 2009.
6