measuring development sco 3.1 demonstrate an understanding of various measures of quality of life
TRANSCRIPT
Measuring Development
SCO 3.1 Demonstrate an understanding of various measures of Quality of Life
How do we measure development?
One country vs. another country
One country over time (how it has progressed, or regressed)
Development can look at how advances a country is in a variety of aspects, including:
economically
socially
culturally
Technologically

Human and Economic Development
The two most important factors used when measuring development are human development and economic development
Economic development is a measure of a country's wealth and how it is generated (for example agriculture is considered less economically advanced then banking)
Human development measures the access the population has to wealth, jobs, education, nutrition, health, leisure and safety - as well as political and cultural freedom. Material elements, such as wealth and nutrition, are described as the standard of living. Health and leisure are often referred to as quality of life.
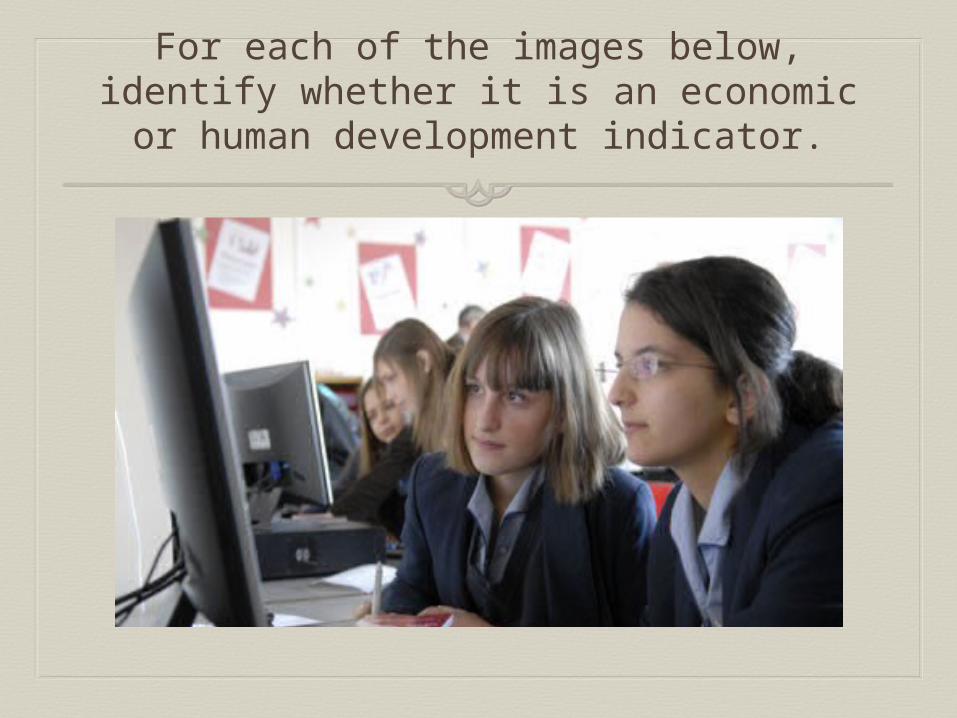
For each of the images below, identify whether it is an economic or human
development indicator.


Development Indicators
There is no single way to calculate the level of development because of the variety of economies, cultures and peoples. Geographers use a series of development indicators to compare the development of one region against another. For example:
Health. Do the population have access to medical care? What level of healthcare is available - basic or advanced? Is it free?
Industry. What type of industry dominates? LEDCs focus on primary industries, such as farming, fishing and mining. MEDCs focus on secondary industries, such as manufacturing. The most advanced countries tend to focus more on tertiary or service industries, such as banking and information technology.
Education. Do the population have access to education? Is it free? What level of education is available (ie primary, secondary or further/higher education)?
The North South Divide
Most Economically Developed Countries (MEDCs) are countries which have a high standard of living and a large GDP.
Least Economically Developed Countries (LEDCs) are countries with a low standard of living and a much lower GDP.

The map shows the locations of LEDCs and MEDCs. Most of the southern hemisphere is
less developed, while countries in the northern hemisphere are more developed.

Economic Development Indicators
Gross Domestic Product (GDP) is the total value of goods and services produced by a country in a year.
Gross National Product (GNP) measures the total economic output of a country, including earnings from foreign investments.
GNP per capita is a country's GNP divided by its population. (Per capita means per person.)
Economic growth measures the annual increase in GDP, GNP, GDP per capita, or GNP per capita.
Inequality of wealth is the gap in income between a country's richest and poorest people. It can be measured in many ways, (eg the proportion of a country's wealth owned by the richest 10 per cent of the population, compared with the proportion owned by the remaining 90 per cent).

Economic Development Indicators Part II
Inflation measures how much the prices of goods, services and wages increase each year. High inflation (above a few percent) can be a bad thing, and suggests a government lacks control over the economy.
Unemployment is the number of people who cannot find work.
Economic structure shows the division of a country's economy between primary, secondary and tertiary industries.
Demographics study population growth and structure. It compares birth rates to death rates, life expectancy and urban and rural ratios. Many LEDCs have a younger, faster-growing population than MEDCs, with more people living in the countryside than in towns. The birth rate in the UK is 11 per 1,000, whereas in Kenya it is 40.

Cairo – an example of an LEDC
New York – an example of an
MEDC
Human Development Indicators
Development often takes place in an uneven way. A country may have a very high GDP - derived, for example, from the exploitation of rich oil reserves - while segments of the population live in poverty and lack access to basic education, health and decent housing.
Hence the importance of human development indicators, measuring the non-economic aspects of a country's development.
Human Development Indicators
Life expectancy - the average age to which a person lives, eg this is 79 in the UK and 48 in Kenya.
Infant mortality rate - counts the number of babies, per 1000 live births, who die under the age of one. This is 5 in the UK and 61 in Kenya.
Poverty - indices count the percentage of people living below the poverty level, or on very small incomes (eg under £1 per day).
Access to basic services - the availability of services necessary for a healthy life, such as clean water and sanitation.
Access to healthcare - takes into account statistics such as how many doctors there are for every patient.
Risk of disease - calculates the percentage of people with diseases such as AIDS, malaria and tuberculosis.

Human Development Indicators (Part II)
Access to education - measures how many people attend primary school, secondary school and higher education.
Literacy rate - is the percentage of adults who can read and write. This is 99 per cent in the UK, 85 per cent in Kenya and 60 per cent in India.
Access to technology - includes statistics such as the percentage of people with access to phones, mobile phones, television and the internet.
Male/female equality - compares statistics such as the literacy rates and employment between the sexes.
Government spending priorities - compares health and education expenditure with military expenditure and paying off debts.

A school in GuineaA classroom in the
UK

Geographers compare the statistics for different countries to see if there is a relationship or correlation between the data for different countries. A correlation helps to show what factors contribute to development.
The example on the next slide compares GDP per capita to adult literacy rate in a scatter graph. The plotting for each country does not show much on its own, but together they show a pattern.
Statistics and Correlations


Development Indices
A development index measures a country's performance according to specific development indicators. Some countries may appear to be developed according to some indices, but not according to others.
Country Development Indicators
Vietnam and Pakistan
Both countries have a similar per capita GDP. However, life expectancy and literacy are considerably higher in Vietnam than they are in Pakistan.
Saudi Arabia and Croatia
Saudi Arabia has a per capita GDP comparable to that of Croatia. However, in Saudi Arabia there is greater inequality between men and women when considering access to education and political power. So, although they are equal on an economic development index - Saudi Arabia is less developed on a human development index.

Problems with Indices
Development indices can be misleading and need to be used with care. For example:
Many indices are averages for the whole population of a country. This means that indices do not always reveal substantial inequalities between different segments of society. For example, a portion of the population of a highly developed country could be living below the poverty line.
In some countries, the data used in indices could be out of date or hard to collect. Some countries do not wish to have certain index data collected - for example, many countries do not publish statistics about the number of immigrants and migrants.
Human Development Index
To balance inaccuracies, indices tend to be an amalgamation of many different indicators.
The United Nations Human Development Index (HDI) is a weighted mix of indices that show life expectancy, knowledge (adult literacy and education) and standard of living (GDP per capita).
As Vietnam has a higher literacy rate and life expectancy than Pakistan, it has much higher HDI value even though it has a similar per capita GDP.
HDI is measured between 0 and 1. The USA has an HDI of 0.994 whereas Kenya has an HDI of 0.474.

View of Karachi, Pakistan
View of Ho Chi Minh City, Vietnam
Test your knowledge…
Take the online quiz…
http://www.bbc.co.uk/apps/ifl/schools/gcsebitesize/geography/quizengine?quiz=development_contrasts&templateStyle=geography

Heavily adapted from…
http://www.bbc.co.uk/schools/gcsebitesize/geography/development/contrasts_development_rev1.shtml