measuring cultural dynamics through the eurovision song ... · david garcía and dorian anase:t...
TRANSCRIPT
David García and Dorian Tanase:
Measuring Cultural Dynamics Through the Eurovision Song Contest
Measuring Cultural DynamicsThrough the Eurovision Song Contest
David García and Dorian Tanase
Chair of Systems Design, ETH Zurich, Weinbergstrasse 56/588092 Zurich, Switzerland
[email protected], [email protected]
January 14, 2013
Abstract
Measuring culture and its dynamics through surveys has important limitations, but the
emerging �eld of computational social science allows us to overcome them by analyzing
large-scale datasets. In this article, we study cultural dynamics through the votes in the
Eurovision song contest, which are decided by a crowd-based scheme in which viewers vote
through mobile phone messages. Taking into account asymmetries and imperfect perception
of culture, we measure cultural relations among European countries in terms of cultural
a�nity. We propose the Friend-or-Foe coe�cient, a metric to measure voting biases among
participants of a Eurovision contest. To validate how this metric represent cultural a�nity,
we designed a model of a random, biased Eurovision contest. Simulations of this model show
how our metrics can detect negative a�nities and serve as an estimator for positive a�nities.
We apply this estimator to the historical set of Eurovision contests from 1975 to 2012, �nding
patterns of asymmetry and clustering in the resulting networks. Furthermore, we de�ne a
measure of vote polarization that, when applied to empirical data, shows a sharp increase
within countries of the EU during 2010 and 2011. As a result, we measure how the recent
political decisions of EU states in�uence the way their citizens relate to the culture of other
EU members, leading to stronger cultural biases in the way they vote in the Eurovision song
contest.
Keywords: Cultural dynamics; international networks; social simulation
1 Introduction
How do cultures evolve? How do they in�uence each other? These questions are not only centralto human sciences, like anthropology or ethnology, but play a major role in politics, economics,and international relations. Among the scienti�c tools to study human cultures, agent-basedmodeling provides quantitative insights to culture and opinion dynamics [5]. The original worksof Axelrod [2, 3] motivate how computational modeling can be used to understand the evolutionof human cultures. These agent-based models, while being essential simpli�cations of a more
1/27

David García and Dorian Tanase:
Measuring Cultural Dynamics Through the Eurovision Song Contest
complicated phenomenon, allow us to draw the conditions for the emergence of macroscopicsocial behavior [4, 5], such as polarization [14] or clustering [30], as well as to predict futuresocial phenomena [36, 39]. Furthermore, modeling and simulation can open new questions thatdrive future research, allowing �in an ideal case� a deeper understanding of human societiesthrough multidisciplinary research [15].
As well as sociological theories need to be empirically testable, computational models of socialbehavior need to be formulated over assumptions that can be veri�ed against empirical data.When such behavior is objectively measurable, e.g. economic decisions [6] or voting [8, 26],datasets can be produced in a way such that we can directly measure the state of a human. On theother hand, when a model includes subjective elements, such as emotions or beliefs, measuringthe internal states and dynamics of a human becomes a cumbersome task. As an example,Axelrod's model introduces the internal state of an agent as a vector of cultural dimensions,or opinions, which change according to certain rules [2]. To validate this kind of dynamics, weneed to be able to measure the subjective internal state of a human, and how it changes wheninteracting with others. While survey data can shed light on opinions and culture [23], there is asubconscious component of cultural behavior that cannot be encoded in words [42]. Nevertheless,this component can be indirectly measured, for example through physiological responses [18, 25],or through online traces such as expression biases [17], and behavioral patterns in computermediated interaction [16].
Quantitative models need to be validated on the dynamics of individual states, but are oftenaimed to reproduce macroscopically observable collective behavior. When addressing cultures orsocieties as a whole, issues of data availability become critical. It can be expensive to query largeamounts of individuals, limiting the application of subjective reports and surveys. In addition,approaching these questions through experimental studies su�ers additional problems. For ex-ample, experiments cannot reproduce natural exposure in the context of culture and popularity[31], limiting the representativeness of any experimental study. The emerging �eld of compu-tational social science [20, 28] aims at overcoming these limitations, studying human behaviorthrough the statistical analysis of large-scale datasets. Such datasets, when available, o�er theopportunity to validate the macroscopic behavior explained by computational models of socialinteraction. Following the example of Axelrod's model, its validation requires to measure howwhole cultures change in time, as well as the distances between di�erent cultures.
In this article, we aim at providing a way to measure the relations between cultures throughtheir voting patterns in a set of song contests, in particular looking for biases in the way theyevaluate each other. This way, we are measuring the dynamics of culture i) at a large-scale levelusually unreachable for independent research, and ii) measuring subjective biases that are notexplicitly expressed by the studied individuals. It is of special relevance to measure these kindof relations in a timely manner, in order to address possible changes in the relation between
2/27

David García and Dorian Tanase:
Measuring Cultural Dynamics Through the Eurovision Song Contest
pairs of countries. The political decisions of a country, the results of sport events, or the currentstate of the economy might impact the evolution of the public opinion of one society towardsanother. For the case of Europe, the policies of the European Union regarding the debt crisismight have an impact on the �state of the union�, or how countries within the EU perceive eachother. Studying data with a time component, we measure how these events play a role in themanifestation of cultural relations, with the aim of providing a macroscope tha measures thestate of the union of Europe at large.
2 The Eurovision Song Contest
In this article, we present our study of the relations between European countries through theset of results of the Eurovision Song Contest, an annual competition held among the countrymembers of the European Broadcasting Union. Every year, each participating country chooses arepresentative artist to compete by performing a song, which is included in a live event broad-casted simultaneously in the whole Europe. After the performance of each participant, votingcountries gather televotes and jury votes [34], creating a local ranking of songs from other contes-tants. Afterwards, each voting country publicly announces which other countries receive pointsfrom 1 to 8, 10, and 12, according to their local rankings. The winner of the contest is thecountry with the song that accumulated the highest amount of points. Extensive and detaileddescriptions about the contest, its rules, and its history can be found elsewhere [19, 40].
While the contest rules and participating countries have changed over the years, this contesto�ers a timely source of cultural evaluations across most European countries. Eurovision has beensubject of substantial research, up to the point of the usage of the term �eurovisiopsephology�
[19], de�ned as the study of the results of the votes casted in the Eurovision song contest.Initial research focused on the possible existence of voting clusters or alliances [40, 41], generallydue to geographical locations, diaspora e�ects, language, and religious similarities [38]. Furtherstudies combined network analysis with simulations of maximally random contests, revealing howEurovision results have high clustering [12], which results in voting blocks [19, 34], and higherchances to win for countries depending on their position in the voting network [9, 37].
Since 2004, all the countries participating in the contest choose their votes according to televoting,a method that uses phone calls and mobile phone messages of viewers to decide how a countryvotes. Since 2009, these televotes were combined with some expert judges, turning Eurovisionin an experimental ground to compare popular and expert choices. Recent studies show thestatistical changes due to televoting [34], while older works measure how expert judges chosetheir votes according to song quality rather than cultural biases [22]. Either way, the results ofthis contest highlight the stable cultural relations between countries [38], where voting trades orgame theoretical decisions do not seem to play a role [21].
3/27

David García and Dorian Tanase:
Measuring Cultural Dynamics Through the Eurovision Song Contest
2.1 Controversies and applications
Recently, Google set up a Eurovision predictor based on search queries, leading to the correctprediction in 2009 and 20101 . This was discontinued in 2011, after a contested prediction resultbetween Lena, the previous German winner who was competing again, and the Irish partici-pants called Jedward2. The outcome of this prediction failed, as both countries were defeatedby Azerbaijan by more than 100 points. In addition, seems that users were exploiting the searchengine to try to push their country higher in the prediction3 as if searching for your representa-tive would increase its chance to win. This reaction to a prediction mechanism shows how socialsystems, as complex adaptive systems, can change their behavior due research results, leadingto the invalidation of prediction tools or even to self-ful�lling predictions.
Our approach does not aim to predict contest outcomes or to reveal voting alliances, but to useEurovision as a social macroscope for the relations across European countries. Initial results showhow Eurovision outcomes can predict international trade [11, 27], which motivates the measuringof the cohesion of European countries and the EU through Eurovision [34]. Popular cultureand mass media criticize the contest organization, claiming that some countries are treated asEuropean only in Eurovision4, as a limitation for a �Europeaniziation process�[24]. In addition,the contest rules and results are periodically claimed to be unfair, biased5 , or even farcical6,portraying the contest as a European popularity survey rather than an artistic competition.In this article, we precisely aim to measure these biases as relevant quantities, focusing on thepolitical, social, and cultural component of the contest rather than on its artistic one.
2.2 Exploring Eurovision data
We gathered the whole historical set of Eurovision results from Wikipedia7, which contains apage for each edition of the contest, and from the o�cial website of the contest8.
For each year, we count with a matrix with the values pv,c, where each entry corresponds tothe amount of points given by a country cv to the competing song of another country cc. Asexplained before, pv,c is contained in the set {0, 1, 2, 3, 4, 5, 6, 7, 8, 10, 12}, and chosen according
1calmyourbeans.wordpress.com/2012/05/22/no-google-eurovision-predictor-this-year/2wiwibloggs.com/2011/05/07/google-prediction-jedwards-lead-grows-denmark-and-estonia-climbing-update-2/
10942/3thedailyedge.thejournal.ie/google-trends-predict-eurovision-near-miss-for-jedward-130899-May2011/4 �I'm sick of being European just on Eurosong� https://www.youtube.com/watch?v=IK8fVHNk0oM5http://news.bbc.co.uk/2/hi/uk_news/wales/south_east/3719157.stm6http://news.bbc.co.uk/2/hi/entertainment/6654719.stm7For an example of a contest result page, see: http://en.wikipedia.org/wiki/Eurovision_Song_Contest_
20128http://www.eurovision.tv/page/history/year
4/27

David García and Dorian Tanase:
Measuring Cultural Dynamics Through the Eurovision Song Contest
to the ranking of televotes and jury votes. Our dataset comprises the whole set of results ofEurovision editions from 1957 to 2012, including 11775 voting relations between 51 countrymembers of the European Broadcasting Union.
The straightforward approach to understand this data is to look into the voting network formedevery year [12], where nodes are participating countries. A directed edge cv → cc connects twonodes if cv assigned that year a nonzero amount of points to cc. Edge weights are assigned to bethe amount of points given by the vote, pv,c. The left panel of Figure 1 shows this network forthe edition of 2008, with edge darkness according to weight, and node darkness proportional tothe �nal score sc =
∑cvpv,c of each country cc in the contest. The topological properties of these
networks have been widely explored, �nding symmetrical relations, triadic clustering, and highlyconnected blocks that map to geographically close, and culturally related countries [19, 37, 40].
Turkey
Andorra
Estonia
Russia
Poland
Bosnia and HerzegovinaSlovenia
Iceland
Croatia
Finland
Germany
Hungary
Ireland
Georgia
Montenegro
Cyprus
Azerbaijan
Greece
Czech Republic
LithuaniaMalta
Serbia
Sweden
Armenia
Netherlands
Macedonia
Romania
Albania
Norway
Belarus
United Kingdom
LatviaBulgaria
Switzerland
San Marino
Israel
Denmark
Spain
Moldova
Portugal
Belgium
France
Ukraine
38
25
27
5
4
41 1
39
28
1032
24
31
18
20
9
36
7
15
42
2
26
19
8
3
35
34
29
21
30
11
22
37
16
6
40
17
33
23
13
12
14
Figure 1: Left: network of votes for the 2008 edition of Eurovision. Nodes are participatingcountries, with color darkness proportional to the �nal score of the country. Directed edgesrepresent the votes given by one country to another, with darker color according to the amountof points given by the vote. Right: simulation results with the same size as the 2008 contest,visualized in the same manner as the left side.
Visual inspection of this network, as shown in the left panel of Figure 1, reveals a signi�cantheterogeneity in node darkness. This corresponds to the large deviation of �nal scores usuallypresent in this contest. Initial editions of the contest had multiple draws, so the voting schemewas changed to the current one in 1975, in order to encourage the selection of a single winner. Theresulting heterogeneity is relevant to test the existence of winner-takes-all e�ects as in culturalmarkets [35], and product reviews [29]. To do so, we calculated the relative score s′c = sc
T , where
5/27

David García and Dorian Tanase:
Measuring Cultural Dynamics Through the Eurovision Song Contest
T =∑
ccsc is the total amount of points given in an edition of the contest, which depends on the
amount of countries participating in a given year. This way we can aggregate all participant scoressince 1975, as shown in the histogram of Figure 2. Similarly to the cultural markets mentionedabove, the distribution of s′ shows a large variance, and positive skewness. On the other hand,the log-log histogram shown in the inset of Figure 2 allows us to notice that there are no scalingrelations, probably due to the �nite size of the contest. We can say that the contest has a largevariance of �nal scores, yet these do not allow arbitrarily large values, as opposed to previousexperience in popularity analysis. We will use these �nal scores to compare individual votes with�nal results, as explained below.
0.00 0.05 0.10 0.15 0.20 0.25 0.30 0.35
020
4060
8010
012
014
0
10-4 10-3 10-2 10-1 10010-1
100
101
102
s'
frequency frequency
s'
Figure 2: Relative score s′ distribution for contest results from 1975 to 2012. Inset: log-log versionof the distribution. We use this empirical distribution as input for our simulations.
3 Measuring cultural relations through Eurovision
3.1 Perception of culture
Most agent-based models of culture dynamics include agent interactions based on their internalstates, usually depending on the distance between the values of their cultural features. Whilevalid to reproduce the emergence of opinion groups and cultures [32], there is still ample room
6/27

David García and Dorian Tanase:
Measuring Cultural Dynamics Through the Eurovision Song Contest
to validate and empirically test the existence of this kind of dynamics. The existence of culturaldimensions was �rst introduced by Hofstede [23], in a study of surveys across di�erent countries.These dimensions were detected by means of dimensionality reduction on the survey responses,and have been applied in numerous studies about culture [13], including a study on Eurovision[21]. On the other hand, measuring culture through surveys has clear limitations [1], in particularin the interpretation of the meaning of the results of dimensionality reduction.
Apart from dimensional structures, a key component in models of culture dynamics is the set ofrules that determine which agents interact and how. While these rules can represent spontaneousevents of in�uence between cultures, in other scenarios work as a mechanism in which agentsperceive the state of others. In a realistic setup, the perception of cultural di�erences mightbe constrained by imperfect communication, and path dependencies like historical events orstereotypes. Such phenomena can shape the way culture is perceived across a society, leading tonew structures to take into account in future models. For example, with the minimal assumptionthat humans can only perceive a set of dimensions from another culture, the perceived distancebetween cultures could have asymmetric properties. In the schema of Figure 3, we sketch twocultures with binary feature vectors of �ve dimensions. If the left one can only perceive the three�rst features of the other, its perceived Hamming distance would be 1, as they just di�er inthe third feature. At the same time, if the right one can only perceive the last three featuresof the left one, the perceived distance would be 3, leading to asymmetric perception of culturaldi�erences.
Another possibility is that each society might have a reference point, i.e. an expected or �accept-able� maximum cultural distance towards another. This would lead to the existence of negativecultural relations, which would be a plausible explanation for multiple international con�ictspresent in History. This possibility is commonly ignored when taking into account cultural dis-tances in discrete spaces, and might very well be a property of realistic cultural dynamics.
Given possible asymmetries and signed values, we will de�ne cultural a�nity of a society towardsanother as �the di�erences perceived by the members of a society in relation to the culture of an-
other society, evaluated as a comparison with a reference point�. Cultural a�nity takes maximumvalues for very close cultures, and negative values towards very di�erent cultures. By analyzingEurovison results, we want to explore the two properties that di�erentiate cultural distance fromcultural a�nity, i.e. i) the presence of asymmetry in the perceived di�erences between cultures,and ii) the existence of negative and positive cultural evaluations among European cultures.
3.2 The Friend-or-Foe coe�cient
To measure cultural a�nity, we need to de�ne a way to estimate it from the raw Eurovisionscores of our dataset. For this, we de�ne the Friend-or-Foe (FoF) coe�cient of country cv towards
7/27

David García and Dorian Tanase:
Measuring Cultural Dynamics Through the Eurovision Song Contest
}}
31
Figure 3: Schema with a possible scenario of feature-based cultures under imperfect perception.Each culture is composed of a set of agents with the same values of the cultural vector, shownover them. Their asymmetric relation is a result of partial perception of the cultural features ofthe other.
country cc, as estimated from a particular edition of the contest:
Fof(cv, cc) =pv,c12− sc − pv,c
12(N − 2)(1)
where pv,c are the points assigned to cc by cv, sc is the �nal score of cc, and N is the total amountof countries voting in the studied edition of Eurovision. The �rst term of the right hand sideof Equation 1 represents a normalized value of the score given by cv to cc, ranging from 0 forno points given, to 1 when 12 points were assigned to cc. The second term corrects for the �nalscore of cc in the whole contest, calculating the total amount of points given by other countriesdi�erent than cv. The maximum value of this score is 12(N − 2), as one country cannot voteitself and we have already subtracted cv from the calculation.
We designed the Friend-or-Foe coe�cient to measure the overvoting or undervoting bias froma country to another, correcting for �song quality� as estimated by the �nal contest result [21].This way, we aim at removing the e�ects of the artistic component of the contest, highlightingthe political or cultural biases that are commonly claimed to exist in Eurovision. If a countrycv assigns 12 points to cc, while all the others assign 0, then FoF (cv, cc) = 1, which would bethe maximum value of an overvoting bias. If cv assigns 0 points to cc but all the other countries
8/27

David García and Dorian Tanase:
Measuring Cultural Dynamics Through the Eurovision Song Contest
assign 12, then FoF (cv, cc) = −1, representing the maximally negative Friend-or-Foe coe�cientgiven the contest rules.
After this de�nition, we need to assess if the FoF is a valid measure to estimate the real culturala�nity of one coutry towards another, as described above. In the following, we perform a casestudy of the values of the FoF for di�erent years between pairs of countries with known culturalsimilarities, as well as countries with explicit con�icts. We continue by de�ning and simulating amodel for Eurovision contests, including heterogeneous song quality, and an underlying networkof cultural a�nities. By numerical analysis of such model we want to measure the quality of thisapproximation, as the contest rules might distort and limit the quality of the FoF as an estimatorfor cultural a�nity.
3.3 Dyadic relations over time
For any pair of countries c1 and c2 we can calculate the FoF coe�cients between them in eachcontest in which they participated together. The values of FoF (c1, c2) and FoF (c2, c1) mightdepend on e�ects that in�uence Eurovision votes, such as language and geographical proximity. InFigure 4 we present the FoFs for some years between pairs of countries with known similarities andcon�icts. In the following, we make a case study on how we can use the FoF as an approximationfor measuring the relations between European cultures, unifying the already known biases inprevious literature.
• Cultural proximity. The standard example for the expression of cultural similarity inEurovision is Cyprus and Greece [12, 19, 34]. Figure 4A shows the FoF between thesetwo countries from 2002 until 2012. Both values are positive in each edition of the contest,never dropping below 0.3. This way, the FoF is consistent with previous research [38], wherecultural proximity and language are major components in the voting trends of Eurovision.Note that, while we have a value of FoF (Cyprus,Greece) for every year, some values ofFoF (Greece, Cyprus) are missing. This is due to the fact that, since 2002, Greece hasalways competed in the �nal, but Cyprus did not qualify for the �nal round every year.
• Asymmetric e�ects. One of the relations we want to explore is the possible asymmetyof cultural a�nities between the inhabitants of two countries. The FoF pair of Turkey andArmenia, shown in Figure 4D is a clear example of an asymmetric relation between coun-tries. FoF (Turkey,Armenia) keeps a signi�cantly positive value, representing Armeniandiaspora living in Turkey. This same e�ect of 'patriotic voting' was suggested for Turkish mi-grants across Europe [38], and our FoF coe�cient re�ects it in this case. On the other hand,FoF (Armenia, Turkey) is signi�cantly low and mostly below 0. This negative relation is apossible expression of negative relations due to historical con�icts between both countries.
9/27

David García and Dorian Tanase:
Measuring Cultural Dynamics Through the Eurovision Song Contest
Another example of asymmetric relations is the Greece and Germany pair, shown in Figure4C. While FoF (Germany,Greece) is signi�cantly positive, the FoF (Greece,Germany)
is signi�cantly negative. A plausible explanation might be the economic and political rela-tions between both countries in the last years, but this asymmetry seems to stretch to pasttimes before the creation of the Euro. As an alternative, another possible explanation isthe existence of perceived cultural asymmetry, in a way such that German inhabitants feela closer to Greek culture, or a diaspora e�ect caused by Greek immigrants in Germany.
• Negative relations. The second type of cultural relation we want to explore is the pos-sibility of negative relations between pairs of countries. Couples of countries with explicitterritorial con�icts show this way symmetric negative FoFs, as shown in Figure 4B and 4F.Turkey and Cyprus have diplomatic con�icts regarding the status of Northern Cyprus9, andArmenia and Azerbaijan are still o�cially in war since the Nagorno-Karabakh con�ict10.This negativity is evident in their FoF coe�cients, as these countries consistently avoidvoting each other. But political con�icts might not be the only reason for negative FoFs,as illustrated in the example of Greece and Norway on Figure 4E. We do not have anyplausible assumption for this negative pair rather than the mere cultural distance betweenone of the northmost and one of the southmost European countries. This way, the FoFcoe�cient would be a valid estimator for possible negative cultural relations, in the casethat two countries consider each other too far in terms of cultural distance.
3.4 A model for biased Eurovision contests
The above case study shows that the Friend-or-Foe coe�cient consistently represents previous�ndings and types of symmetric, asymmetric, as well as positive and negative cultural relations.Yet this qualitative study does not allow us to determine the actual relation between the FoF andany underlying, quanti�able, cultural a�nity. In the following, we propose a model to simulateEurovision contests under heterogeneous song quality and the in�uence of cultural a�nity. Ouraim is to study the relation between the FoF as manifested through contest simulations, given anetwork of a�nities between countries.
Our model receives as an input a network in which nodes represent countries, connected by edgeswith weights that represent cultural a�nities, i.e. a measure that takes high positive values forculturally similar countries, and negative values for highly dissimilar cultures. Thus, an edge ev,cconnecting the node of country cv to the node of country cc has a weight wv,c that measures thecultural a�nity of cv towards cc. This network is composed of two subnetworks, with participant
9http://en.wikipedia.org/wiki/Cyprus_dispute10http://en.wikipedia.org/wiki/Nagorno-Karabakh_War
10/27

David García and Dorian Tanase:
Measuring Cultural Dynamics Through the Eurovision Song Contest
2002 2004 2006 2008 2010 2012
−0.5
0.0
0.5
1.0
year
FoF FoF(Cyprus, Greece)
FoF(Greece, Cyprus)
A
2000 2002 2004 2006 2008 2010 2012
−0.5
0.0
0.5
1.0
year
FoF
FoF(Cyprus, Turkey)FoF(Turkey, Cyprus)
B
2002 2004 2006 2008 2010 2012
−0.5
0.0
0.5
1.0
year
FoF
FoF(Germany, Greece)FoF(Greece, Germany)
C
2006 2007 2008 2009 2010
−0.5
0.0
0.5
1.0
year
FoF
FoF(Armenia, Turkey)FoF(Turkey, Armenia)
D
2002 2004 2006 2008 2010 2012
−0.5
0.0
0.5
1.0
year
FoF
FoF(Norway, Greece)FoF(Greece, Norway)
E
2008 2009 2010 2011
−0.5
0.0
0.5
1.0
year
FoF
FoF(Armenia, Azerbaijan)FoF(Azerbaijan, Armenia)
F
Figure 4: Time evolution of Friend or Foe coe�cients between selected pairs of countries. Theexample of Greece and Cyprus show a symmetric positive relation, possibly due to culturalsimilarity. On the other hand, the example of Greece and Norway shows a symmetric negativerelation, possibly due to cultural di�erences. The case of Greece and Germany shows an asym-metric relation, where Germany shows signi�cantly larger FoF towards Greece than vice versa.The right column shos possible political conditions of the FoF, where country pairs with re-gional con�icts have symmetric negative FoF (Cyprus-Turkey, Armenia-Azerbaijan), or diasporae�ects create asymmetries like the Turkey-Armenia pair. The horizontal dashed lines representthe baselines calculated in Section 3.5.
and only voting countries. The subnetwork between participants is fully connected, directed,weighted network, and the only voting countries are connected to all the participant ones byunidirectional weighted links.
At the beginning of a simulation, we assign a quality value q to each participant, sampleduniformly at random from the distribution of rescaled scores s′c shown in Figure 2. This value isan approximation of the artistic quality of a song [21], which is supposed to determine the �nal
11/27
David García and Dorian Tanase:
Measuring Cultural Dynamics Through the Eurovision Song Contest
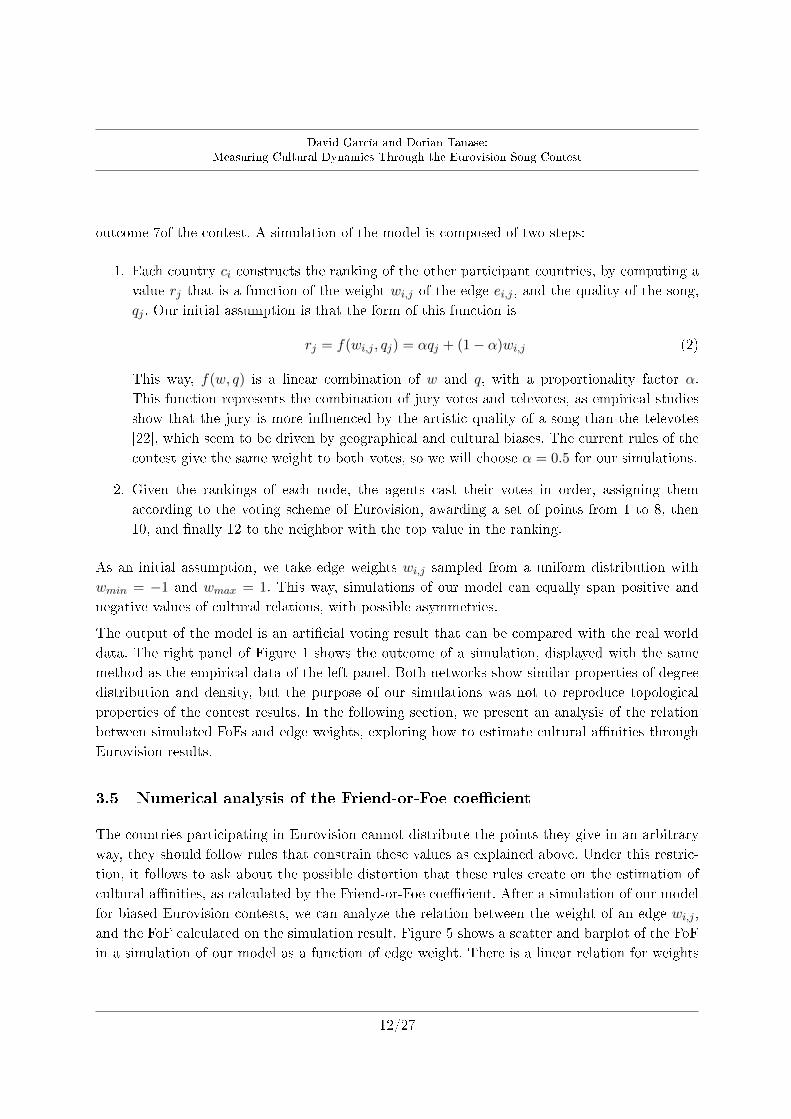
outcome 7of the contest. A simulation of the model is composed of two steps:
1. Each country ci constructs the ranking of the other participant countries, by computing avalue rj that is a function of the weight wi,j of the edge ei,j , and the quality of the song,qj . Our initial assumption is that the form of this function is
rj = f(wi,j , qj) = αqj + (1− α)wi,j (2)
This way, f(w, q) is a linear combination of w and q, with a proportionality factor α.This function represents the combination of jury votes and televotes, as empirical studiesshow that the jury is more in�uenced by the artistic quality of a song than the televotes[22], which seem to be driven by geographical and cultural biases. The current rules of thecontest give the same weight to both votes, so we will choose α = 0.5 for our simulations.
2. Given the rankings of each node, the agents cast their votes in order, assigning themaccording to the voting scheme of Eurovision, awarding a set of points from 1 to 8, then10, and �nally 12 to the neighbor with the top value in the ranking.
As an initial assumption, we take edge weights wi,j sampled from a uniform distribution withwmin = −1 and wmax = 1. This way, simulations of our model can equally span positive andnegative values of cultural relations, with possible asymmetries.
The output of the model is an arti�cial voting result that can be compared with the real worlddata. The right panel of Figure 1 shows the outcome of a simulation, displayed with the samemethod as the empirical data of the left panel. Both networks show similar properties of degreedistribution and density, but the purpose of our simulations was not to reproduce topologicalproperties of the contest results. In the following section, we present an analysis of the relationbetween simulated FoFs and edge weights, exploring how to estimate cultural a�nities throughEurovision results.
3.5 Numerical analysis of the Friend-or-Foe coe�cient
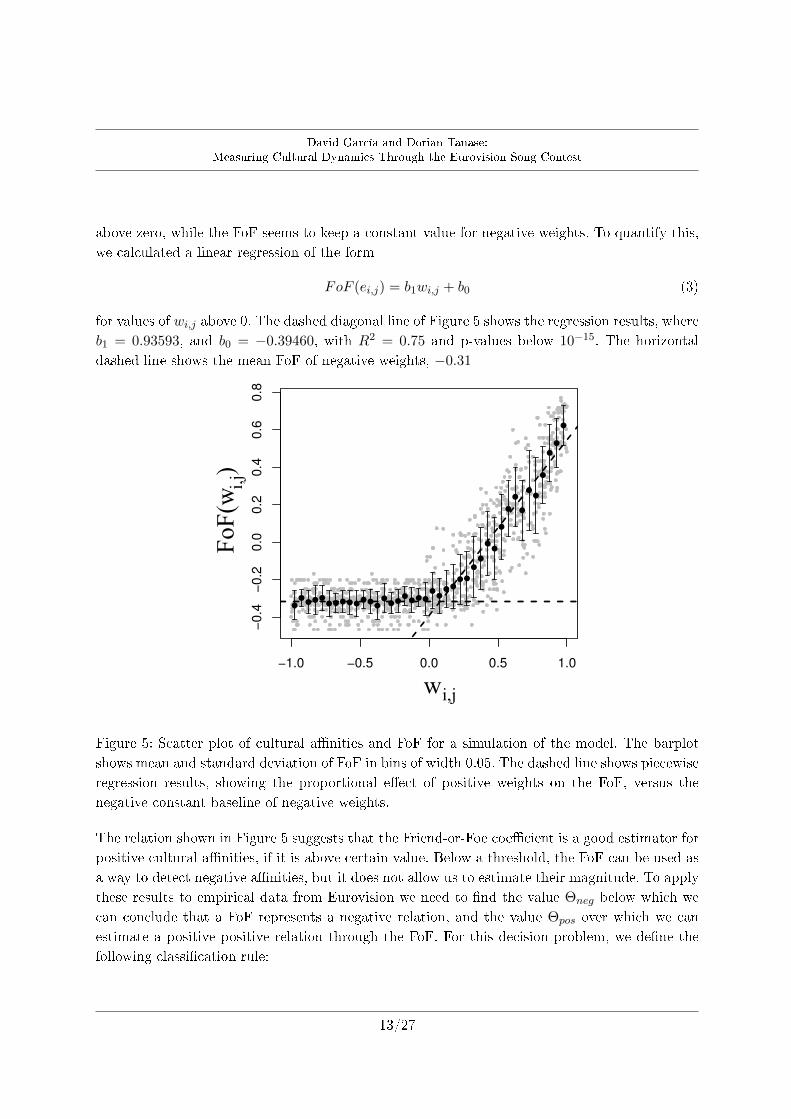
The countries participating in Eurovision cannot distribute the points they give in an arbitraryway, they should follow rules that constrain these values as explained above. Under this restric-tion, it follows to ask about the possible distortion that these rules create on the estimation ofcultural a�nities, as calculated by the Friend-or-Foe coe�cient. After a simulation of our modelfor biased Eurovision contests, we can analyze the relation between the weight of an edge wi,j ,and the FoF calculated on the simulation result. Figure 5 shows a scatter and barplot of the FoFin a simulation of our model as a function of edge weight. There is a linear relation for weights
12/27
David García and Dorian Tanase:
Measuring Cultural Dynamics Through the Eurovision Song Contest
above zero, while the FoF seems to keep a constant value for negative weights. To quantify this,we calculated a linear regression of the form
FoF (ei,j) = b1wi,j + b0 (3)
for values of wi,j above 0. The dashed diagonal line of Figure 5 shows the regression results, whereb1 = 0.93593, and b0 = −0.39460, with R2 = 0.75 and p-values below 10−15. The horizontaldashed line shows the mean FoF of negative weights, −0.31
−1.0 −0.5 0.0 0.5 1.0
−0.4
−0.2
0.0
0.2
0.4
0.6
0.8
wi,j
FoF
(w ) i,j
Figure 5: Scatter plot of cultural a�nities and FoF for a simulation of the model. The barplotshows mean and standard deviation of FoF in bins of width 0.05. The dashed line shows piecewiseregression results, showing the proportional e�ect of positive weights on the FoF, versus thenegative constant baseline of negative weights.
The relation shown in Figure 5 suggests that the Friend-or-Foe coe�cient is a good estimator forpositive cultural a�nities, if it is above certain value. Below a threshold, the FoF can be used asa way to detect negative a�nities, but it does not allow us to estimate their magnitude. To applythese results to empirical data from Eurovision we need to �nd the value Θneg below which wecan conclude that a FoF represents a negative relation, and the value Θpos over which we canestimate a positive positive relation through the FoF. For this decision problem, we de�ne thefollowing classi�cation rule:
13/27

David García and Dorian Tanase:
Measuring Cultural Dynamics Through the Eurovision Song Contest
if FoF (ei,j) > Θpos then wi,j > 0
else if FoF (ei,j) < Θneg then wi,j < 0
else wi,j = 0 (4)
Each possible set of values for Θpos and Θneg de�nes two discriminants that map the FoF coef-�cients to the sign of the a�nity between pairs of countries wi,j . Given this prediction, we canclassify each pair given its FoF, having certain amounts of correctly and incorrectly classi�edrelations. This way, for a given value of Θpos, we compute the values of precision and recall [33]over our simulation as
Precision =tp
tp+ fpRecall =
tp
tp+ fn(5)
where tp and fp are the amounts of true and false positives, i.e. pairs with FoF (ei,j) > Θpos
that had wi,j > 0 for tp, and wi,j < 0 for fp. The amount of false negatives fn is the count ofpairs with FoF (ei,j) < Θpos that had wi,j > 0. In an equivalent manner, we compute precisionand recall for Θneg, inverting the rules of Equation 5. To independently assess the quality of thediscriminant given a value for each threshold, we compute the F1 scores combining precision andrecall in a unidimensional metric [33]
Fpos = 2 · Precisionpos ·RecallposPrecisionpos +Recallpos
Fneg = 2 · Precisionneg ·RecallnegPrecisionneg +Recallneg
(6)
Figure 5 shows the value of Fpos and Fneg as a function of the value of the thresholds Θpos andΘneg. Both classi�cation rules have maximum F1 values for Θpos = −0.2 and Θneg = −0.24.These F1 are above 0.8, and Θpos > Θneg, providing us with a valid and consistent method todetermine the sign of a cultural relation given its FoF in a contest. The dashed horizontal lines ofFigure 4 are placed at −0.2 and −0.24, to guide us in deciding negative a�nities between couplesof countries. Using the inverse form of Equation 3, we can formulate the following method toestimate the a�nity of one country for another from the FoF in a given contest:
if FoF (ei,j) > Θpos then wi,j =FoF (ei,j)− b1
b0else if FoF (ei,j) < Θneg then wi,j < 0
else wi,j = 0 (7)
where the values of b0, b1, Θpos, and Θneg have been estimated from computer simulations asexplained above.
14/27

David García and Dorian Tanase:
Measuring Cultural Dynamics Through the Eurovision Song Contest
−1.0 −0.5 0.0 0.5 1.0
0.0
0.2
0.4
0.6
0.8
1.0
θ
F(θ)
Fpos(θpos)Fneg(θneg)
Figure 6: F values for negative and positive weight classi�cations as a function of the chosenthreshold. Vertical lines indicate the maximum points for both, at Θpos = −0.2 and Θneg = −0.24
4 Analysis of Cultural A�nity in Eurovision
4.1 The network of a�nity among European countries
The analysis of simulated biased contests allowed us to de�ne the estimator of Equation 7, whichlets us detect negative a�nities between countries, and estimate values of positive a�nities. Inthis section, we will apply this rule to the FoF coe�cients across several contests, analyzing theproperties of the network of cultural a�nity between European countries.
For each pair of countries cc and cv, we have the FoF coe�cients in the contests where theyappeared FoF t(ec,v), where t denotes a year where both countries participated. We apply Equa-tion 7 to convert this time series of FoFs into a time series of a�nity estimations wtc,v. First,we summarize the history of cultural a�nities of cc towards cv with two metrics, the averagepositive a�nity
Pc,v =1
T
∑t
Θ[wtc,v] · wtc,v (8)
15/27

David García and Dorian Tanase:
Measuring Cultural Dynamics Through the Eurovision Song Contest
and the ratio of negative a�nities
Nc,v =1
T
∑t
(1−Θ[wtc,v]) (9)
where T is the length of the studied time period, and Θ[w] is the Heaviside step function, withvalue 1 if w > 0 and 0 otherwise. These two metrics allow us to aggregate the historical relationsbetween European countries, as estimated from the Eurovision results in a certain time period.Each metric de�nes a network between countries, one with average positive a�nities as weights,and another one with frequencies of negative a�nites as weights. We show these two networksfor the period 2007-2012 in Figure 7, with edge width and darkness according to edge weight(Pc,v and Nc,v respectively), and node darkness according to node strength, i.e. the sum of theweights of incident edges.
The left panel of Figure 7 shows the network of positive relations displayed with the weightedARF algorithm of the Cuttle�sh Network Workbench 11, which highlights node clusters. Thiscon�rms previously found voting coalitions [12, 19, 34], including a Balkan cluster of former Yu-goslavian republics, a Scandinavian cluster, and the pairs Cyprus-Greece and Moldova-Romania.In addition, Turkey has a signi�cantly high strength, which con�rms previous conjectures of thee�ect of Turkish diaspora [38]. Among all the countries studied in this period, the strongestone is Belgium, which to our knowledge was never found to play a special role in this contest.Its possible mediator role in the European Union, combined with immigration from all acrossEurope might be the reason that drives Belgium to this privileged position.
The right panel of Figure 7 shows the network with negative a�nity ratios as edge weights, withnode darkness proportional to strength calculated as the sum of weights of incident edges. Usingthe same layout algorithm as for its positive counterpart, there is no clear community structurein this negative network. A possible explanation for this lack of clustering is the balanced natureof signed networks [10], which naturally avoids negative triangles. The strongest nodes in thisnetwork are Greece, Azerbaijan, Turkey, and Armenia, all involved in a series of territorial andpolitical con�icts with each other. While we quantitatively test for the reasons for the structure ofthese networks, the FoF coe�cient allows us to quantify the cultural a�nities between Europeancountries.
4.2 Time evolution of cultural a�nities
While the networks of Figure 7 show the time aggregates of cultural relations among Europeancountries, we want to measure how these networks evolve in time. To do so, we compute the time
11www.cuttlefish.sourceforge.net
16/27

David García and Dorian Tanase:
Measuring Cultural Dynamics Through the Eurovision Song Contest
Spain
Netherlands
Andorra
Cyprus
Norway
Latvia
Czech Republic
San Marino
Turkey
Bosnia and Herzegovina
United Kingdom
Ukraine
Hungary
Bulgaria
Armenia
Denmark
Lithuania
Ireland
Portugal
Germany
Georgia
Moldova
Serbia
Malta
Estonia
Slovakia
Austria
Montenegro
Italy
Slovenia
Poland
France
Macedonia
Belarus
Sweden
Russia
Switzerland
Croatia
Romania
Finland
Albania
Iceland
Azerbaijan
GreeceIsrael
Belgium
Romania
Andorra
Austria
Azerbaijan
Denmark
Macedonia
Israel
Italy
San Marino
Albania
Malta
Turkey
United Kingdom
Finland
Latvia
Slovenia
Armenia
Czech Republic
Georgia
Moldova
Montenegro
Estonia
Poland
Serbia
Belgium
Norway
Hungary
Lithuania
Bulgaria
Switzerland
Slovakia
Russia
GreeceIreland
France
Bosnia and Herzegovina
Ukraine
Portugal
Germany
Iceland
Cyprus
Sweden
Spain
Croatia
Belarus
Netherlands
Figure 7: Left: network of positive FoF averaged between the years 2007 to 2012. Edge color,weight, and width are proportional to the average FoF from one country to another. Nodedarkness corresponds to the total sum of incoming edge weights. Right: Network of counts ofnegative FoF for the same time period as in the left. Edge width, weight, and color is proportionalto the amount of negative instances of FoF from one country to another, and node darkness isproportional to the sum of incoming edge weights.
series of network asymmetry, de�ned as
asymmetry(t) =1
E
∑c,v
|wtc,v − wtv,c| (10)
where E is the total amount of edges, i.e. pairs of voter-competing countries in the network. Therationale behind this metric is to estimate how strong are the typical asymmetries illustrated inSection 3.3, by computing the average distance between reciprocal pairs of estimated a�nities.
In addition, we also calculate the time series of network polarization as
polarization(t) =
√1
E
∑c,v
(wtc,v − 〈wt〉)2 (11)
which is essentially the standard deviation of estimated a�nities across all the edges in thenetwork. This polarization metric takes higher values when cultural and political biases arestrong, in comparison to the artistic component of the contest. If all countries agreed on the best
17/27

David García and Dorian Tanase:
Measuring Cultural Dynamics Through the Eurovision Song Contest
songs in the same manner, the polarization would have a value close to zero, as the resultingFoFs would lead to moderate values of w as calculated in Equation 7.
1980 1990 2000 2010
0.20
0.25
0.30
0.35
year
asym
met
ry,p
olar
izat
ion
asymmetrypolarization
Figure 8: Time series of asymmetry and polarization in the Eurovision editions since 1975.Asymmetry shows a negative trend in the last two decades, but keeping always above 0.2.
As mentioned in Section 2.1, the organization of the Eurovision song contest has been accusedof having an increasing level of unfairness and lack of artistic content. If that is the case, votingclusters should decrease asymmetry, and political and popularity e�ects should create a hetero-geneity in the votes that increases polarization. To test those hypotheses, we created the timeseries of asymmetry and polarization for each contest edition, shown in Figure 8. These werecalculated on the a�nity estimations over the each year from 1975 to 2012. From 1990, there isa negative trend in asymmetry that leads to more symmetrical contest outcomes towards 2012,while polarization does not seem to follow this pattern. This decreasing asymmetry indicatesthat countries tend to vote each other as the other one voted them before. This increasing reci-procity can be built up along many interactions, where the already known cultural clusters formand strengthen, due to voting dependencies as well as the changes on the political landscapeof Europe. On average, the overall asymmetry of the contest has a value of 0.27, giving us aquantization of the cultural reciprocity between the countries of Europe.
Figure 8 also shows a lack of a signi�cant trend in polarization, meaning that, at this high levelof aggregation, we cannot detect any pattern of political in�uence in the contest outcome. Thisdoes not rule out the possibility of increasing polarization for groups of countries, or aroundindividual participants, which we discuss in the following section.
18/27

David García and Dorian Tanase:
Measuring Cultural Dynamics Through the Eurovision Song Contest
5 Measuring International Relations in the EU
One of the main motivations for studying Eurovision data is its representativeness of the wholeEurope, giving the possibility to study the relations among countries. It is particularly relevantto study if the events of the �nancial crisis across members of the European Union can be tracedthrough our statistical measures, looking for a macroscope of the state of the union in the EU.In this section, we focus on two subsets of countries of the EU: the 12 founding members of theEurozone, and the EU-15, which is the set of members of the European Union since 1995. Foreach subset we compute the value
PG(t) =1
|G|∑
(c,v)∈G
Θ[wtc,v] · wtc,v (12)
which is the average positive a�nities between the studied countries G.
Figure 9 shows the time series of P for the countries in the Eurozone, in the EU-15, and in thewhole European Broadcasting Union. In 2010 and 2011, P shows a signi�cantly higher value forthe Eurozone and EU-15 countries than in previous years, where it was not easily distinguishedfrom the rest of the contest. To explore this comparison between a subset of countries and thewhole Europe, we computed the Z-score of P as zG(t) = PG(t)−P (t)
σpos(t), where P (t) is the mean and
σpos(t) is the standard deviation of positive weights for all Europe in year t. Figure 10 shows thetime evolution of z(t), for both the Eurozone and the EU-15. We can appreciate the �uctuationabove zero in 2001 and 2011, as well as a �uctuation below zero in 2007.
1998 2000 2002 2004 2006 2008 2010 2012
0.40
0.50
0.60
year
P
EurozoneEU−15All
Figure 9: Time series of P from 1998 to 2012, for countries in the Eurozone, in EU-15, and allcountries.
These Z-scores keep below 0.3, showing an anecdotal �uctuation rather than a consistent result.Nevertheless, they indicate the presence of a pattern that could be measured with topological
19/27

David García and Dorian Tanase:
Measuring Cultural Dynamics Through the Eurovision Song Contest
1998 2000 2002 2004 2006 2008 2010 2012
−0.3
−0.1
0.1
0.3
year
Z−sc
ore
P
EurozoneEU−15
Figure 10: Time series of the Z-score of P per year since 1998, comparing the distribution of Pin the whole contest versus the value of P for countries in the Eurozone and in EU-15.
metrics that also include negative weights, such as the asymmetry and polarization of Equa-tion 10 and Equation 11 respectively. Focusing on the EU-15, we calculated asymmetry(t) andpolarization(t) for the subnetwork formed by the 15 countries of EU-15, which are shown from1998 to 2012 in Figure 11. These two metrics show a strong �uctuation in 2010 and 2011, the�rst two years of the debt and austerity measures across the studied countries. The increasein asymmetry re�ects the lower cohesion among countries in the EU-15, which voted outsidetheir usual geographical clusters. This e�ect is also present when analyzing the Eurozone, clearlyin�uencing countries related to the common currency. The increase in polarization shows thattheir votes where less homogeneous and their biases led to strong FoFs, re�ecting an in�uenceexogenous to the artistic component of the contest.
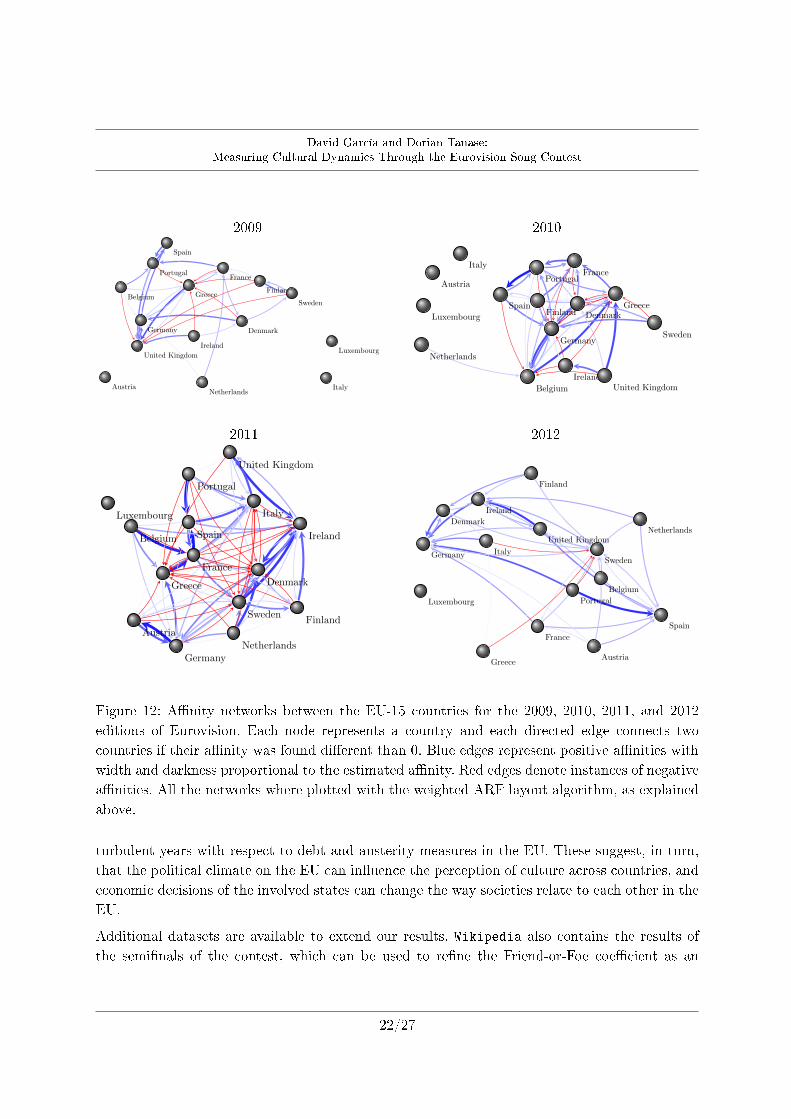
Figure 12 shows the EU-15 subnetworks for the contest editions between 2009 and 2012. Blueedges represent positive a�nities with a width and darkness proportional to the estimated a�nityof a country towards the other. Red edges represent negative a�nities of a constant width as wecannot estimate their magnitude. These visualizations allow us to conjecture about the originof the changes in asymmetry and polarization after the crisis started, in particular in 2011. Thedensity of the network is much higher in 2011, with a large amount of negative a�nities, butalso with stronger positive ones. The ARF layout algorithm highlights a network division whichincludes countries in debt on one side (Spain, Portugal, Italy, Greece), and countries not yet incrises on the other (Netherlands, Germany, Sweden, Finland), with the exception of Ireland inthis second cluster, and the UK as a bridge between both.
While we cannot precisely quantify the dependence of the debt crisis and the metrics of asymme-try and polarization, our observations indicate a signi�cant change in 2010 and 2011, coinciding
20/27

David García and Dorian Tanase:
Measuring Cultural Dynamics Through the Eurovision Song Contest
1998 2000 2002 2004 2006 2008 2010 2012
0.20
0.25
0.30
0.35
0.40
year
asym
met
ry,p
olar
izat
ion
asymmetrypolarization
Figure 11: Time series of asymmetry and polarization among the countries in EU-15, between1998 and 2012. A strong peak is present in 2010 and 2011, coming back to normal values in 2012.
with the loans and austerity measures in Portugal, Ireland, Italy, Greece, and Spain. In addition,these two metrics where quite stable since 1998, the year when televoting was introduced inEurovision, only having such change in 2010 and 2011.
6 Conclusions
We have studied the cultural relations among European countries through the behavioral biasespresent in the Eurovision song contest. To do so, we gather a dataset of the historical contestoutcomes, which aggregate the votes of large amounts of viewers who simultaneously vote bysending mobile phone messages. Our approach is centered around the statistical analysis thislarge-scale dataset, producing metrics that compose a macroscope of the cultural cohesion inEurope at large.
The �rst metric de�ned here is the Friend-or-Foe coe�cient, a metric that reveals asymmetricpositive and negative relations between European countries. We validated how this metric esti-mates underlying cultural a�nities against a model of biased Eurovision contests. This allowedus to �nd a statistical rule to detect negative a�nities, and a way to estimate the value of positivea�nities given the outcome of a contest. Applying such rule, we could extract the networks ofpositive and negative relations across countries, which reveal known clusters and dyadic rela-tions. Over this network data, we designed metrics of asymmetry and polarization, which detectchanges in the voting patterns among participating countries. Applying these metrics to thevotes between countries in the EU-15, we �nd a signi�cant change in 2010 and 2011, the most
21/27
David García and Dorian Tanase:
Measuring Cultural Dynamics Through the Eurovision Song Contest
2009 2010
Luxembourg
Finland
Austria
Sweden
Netherlands
Denmark
United Kingdom
Greece
Portugal
Italy
Ireland
Spain
France
Belgium
Germany
Austria
Italy
Spain
Sweden
Ireland
Denmark
Germany
Portugal
Finland
Netherlands
United Kingdom
Greece
France
Luxembourg
Belgium
2011 2012
Netherlands
Austria
Spain
FinlandSweden
Belgium
France
Ireland
Italy
United Kingdom
Germany
Denmark
Portugal
Luxembourg
Greece
France
Denmark
Luxembourg
Finland
Spain
Germany
Belgium
Portugal
Austria
Ireland
Netherlands
SwedenItaly
United Kingdom
Greece
Figure 12: A�nity networks between the EU-15 countries for the 2009, 2010, 2011, and 2012editions of Eurovision. Each node represents a country and each directed edge connects twocountries if their a�nity was found di�erent than 0. Blue edges represent positive a�nities withwidth and darkness proportional to the estimated a�nity. Red edges denote instances of negativea�nities. All the networks where plotted with the weighted ARF layout algorithm, as explainedabove.
turbulent years with respect to debt and austerity measures in the EU. These suggest, in turn,that the political climate on the EU can in�uence the perception of culture across countries, andeconomic decisions of the involved states can change the way societies relate to each other in theEU.
Additional datasets are available to extend our results. Wikipedia also contains the results ofthe semi�nals of the contest, which can be used to re�ne the Friend-or-Foe coe�cient as an
22/27

David García and Dorian Tanase:
Measuring Cultural Dynamics Through the Eurovision Song Contest
aggregation of all the available data. Furthermore, our structural analysis can be combined withstatistics of online behavior, such as measures of search queries, website visits, or amounts ofviews and comments for the Youtube videos of participants. These extended datasets, in turn,could be used to create testable predictors for the outcome of Eurovision contests.
A clear limitation of our analysis is the country level restriction given the data provided bythe Eurovision song contest. Cultures do not need to map to countries, as ethnic minorities orpan-state cultures are neglected in this analysis. This limitation is present in the current state-of-the-art studies [1], waiting for sources of cultural data at di�erent levels of aggregation. Ourestimation of cultural a�nity through the Friend-or-Foe coe�cient depends on the way thesetwo relate to each other, which we explored through model simulations. In these simulations, wehave chosen a uniform distribution of the a�nities between -1 and 1, on an unbiased randomnetwork. For the purpose of completeness, future work should consider other distributions (forexample, normal distribution centered around 0 with some deviation) and other mechanisms oflink formation (e.g. reciprocity and clustering). The nature of this network, as well as the rulesto decide votes according to song quality, are empirically testable, and can be validated if moreprecise data becomes available.
The modeling and analysis approach presented here can be applied to other contests, for examplein artist popularity competitions [7], or beauty contests. The Friend-or-Foe coe�cient can beadapted to other contest schemes, looking for alternative support on the way cultural a�nitycreates voting biases. Finally, the metrics of positivity, asymmetry, and polarization compose a�European mood� metric, which we have shown to be related to the economical and politicaldecisions of the European Union, and its member states. Applying this metric to future contests,we can investigate how political decisions in�uence the state of cultural cohesion between theinhabitants of European countries.
Acknowledgments
We would like to thank Uwe Serdült, Andreas Flache, and Frank Schweitzer for providing usefulcomments and discussions.
References
[1] G. Ailon. Mirror, Mirror on the Wall: Culture's Consequences in A Value Test of its OwnDesign. Academy of Management Review, 33(4):885�904, October 2008.
[2] R. Axelrod. The Dissemination of Culture: A Model with Local Convergence and GlobalPolarization. Journal of Con�ict Resolution, 41(2):203�226, April 1997.
23/27

David García and Dorian Tanase:
Measuring Cultural Dynamics Through the Eurovision Song Contest
[3] Robert Axelrod and Leigh S. Tesfatsion. A Guide for Newcomers to Agent-Based Modeling
in the Social Sciences. 2006.
[4] Philip Ball. Social science goes virtual. Nature, 448(7154):647�648, August 2007.
[5] Claudio Castellano, Santo Fortunato, and Vittorio Loreto. Statistical physics of social dy-namics. Reviews of Modern Physics, 81(2), 2009.
[6] Simla Ceyhan, Xiaolin Shi, and Jure Leskovec. Dynamics of bidding in a P2P lendingservice. In Proceedings of the 20th international conference on World wide web - WWW '11,page 547, New York, New York, USA, March 2011. ACM Press.
[7] Fabio Ciulla, Delia Mocanu, Andrea Baronchelli, Bruno Gonçalves, Nicola Perra, andAlessandro Vespignani. Beating the news using social media: the case study of AmericanIdol. EPJ Data Science, 1(1):8, July 2012.
[8] R.N. Costa Filho, M.P. Almeida, J.E. Moreira, and J.S. Andrade. Brazilian elections:voting for a scaling democracy. Physica A: Statistical Mechanics and its Applications,322(null):698�700, May 2003.
[9] A. Dekker. The Eurovision Song Contest as a �Friendship � Network. Connections,27(3):53�58, August 2007.
[10] Giuseppe Facchetti, Giovanni Iacono, and Claudio Alta�ni. Computing global structuralbalance in large-scale signed social networks. Proceedings of the National Academy of Sci-
ences of the United States of America, 108(52):20953�8, December 2011.
[11] Gabriel J. Felbermayr and Farid Toubal. Cultural proximity and trade. European Economic
Review, 54(2):279�293, February 2010.
[12] Daniel Fenn, Omer Suleman, Janet Efstathiou, and Neil F. Johnson. How does EuropeMake Its Mind Up? Connections, cliques, and compatibility between countries in the Euro-vision Song Contest. Physica A: Statistical Mechanics and its Applications, 360(2):576�598,February 2006.
[13] Denise Rotondo Fernandez, Dawn S. Carlson, Lee P. Stepina, and Joel D. Nicholson. Hofst-ede's Country Classi�cation 25 Years Later. The Journal of Social Psychology, 137(1):43�54,February 1997.
[14] Andreas Flache and Michael W. Macy. Small Worlds and Cultural Polarization. The Journalof Mathematical Sociology, 35(1):146�176, January 2011.
[15] Serge Galam. Sociophysics: a personal testimony. Physica A: Statistical and Theoretical
Physics, 336(1-2):49�55, May 2004.
24/27

David García and Dorian Tanase:
Measuring Cultural Dynamics Through the Eurovision Song Contest
[16] Antonios Garas, David Garcia, Marcin Skowron, and Frank Schweitzer. Emotional persis-tence in online chatting communities. Scienti�c Reports, 2:402, May 2012.
[17] David Garcia, Antonios Garas, and Frank Schweitzer. Positive words carry less informationthan negative words. EPJ Data Science, 1(1):3, October 2012.
[18] David Garcia, Arvid Kappas, Dennis Kuester, Mathias Theunis, Elena Tsankova, AntoniosGaras, Peter Kuppens, and Frank Schweitzer. Measuring the Dynamics of Individual Emo-tions Under Online Interaction Through Subjective and Physiological Responses. In SPR
52nd annual meeting, New Orleans, Lousiana, June 2012.
[19] Derek Gatherer. Comparison of Eurovision Song Contest Simulation with Actual ResultsReveals Shifting Patterns of Collusive Voting Alliances. Journal of Arti�cial Societies andSocial Simulation, 9(2):1, March 2006.
[20] Jim Giles. Computational social science: Making the links. Nature, 488(7412):448�450,August 2012.
[21] Victor Ginsburgh and Abdul G. Noury. The Eurovision Song Contest. Is voting political orcultural? European Journal of Political Economy, 24(1):41�52, March 2008.
[22] Marco A. Haan, S. Gerhard Dijkstra, and Peter T. Dijkstra. Expert Judgment Versus PublicOpinion ? Evidence from the Eurovision Song Contest. Journal of Cultural Economics,29(1):59�78, February 2005.
[23] Geert Hofstede. Culture's Consequences: International Di�erences in Work-Related Values,volume 1980. SAGE, 1980.
[24] S. Jones and J. Subotic. Fantasies of power: Performing Europeanization on the Europeanperiphery. European Journal of Cultural Studies, 14(5):542�557, October 2011.
[25] Arvid Kappas, E. Tsankova, M. Theunis, and D. Kuester. CyberEmotions: Subjective andphysiological responses elicited by contributing to online discussion forums. In Poster pre-
sented at the 51st Annual Meeting of the Society for Psychophysiological Research, Boston,
Massachusetts, 2011.
[26] Peter Klimek, Yuri Yegorov, Rudolf Hanel, and Stefan Thurner. It's not the voting that'sdemocracy, it's the counting: Statistical detection of systematic election irregularities. Jan-uary 2012.
[27] Ari Kokko and Patrik Gustavsson Tingvall. The Eurovision Song Contest, Preferences andEuropean Trade. Technical report, January 2012.
25/27

David García and Dorian Tanase:
Measuring Cultural Dynamics Through the Eurovision Song Contest
[28] David Lazer, Alex Pentland, Lada A. Adamic, Sinan Aral, Albert-Laszlo Barabasi, DevonBrewer, Nicholas A. Christakis, Noshir Contractor, James H. Fowler, Myron Gutmann, TonyJebara, Gary King, Michael W. Macy, Deb Roy, and Marshall Van Alstyne. Social science.Computational social science. Science, 323(5915):721�723, February 2009.
[29] Jure Leskovec, Lada A. Adamic, and Bernardo A. Huberman. The dynamics of viral mar-keting. ACM Transactions on the Web, 1(1):39, May 2007.
[30] Michael Mas, Andreas Flache, and Dirk Helbing. Individualization as driving force of clus-tering phenomena in humans. PLoS computational biology, 6(10):1�8, January 2010.
[31] William N. McPhee. Formal theories of mass behavior. The Free Press of Glencoe, Collier-Macmillian, London, 1963.
[32] Q. Michard and Jean-Philippe Bouchaud. Theory of collective opinion shifts: from smoothtrends to abrupt swings. The European Physical Journal B, 47(1):151�159, September 2005.
[33] David L. Olson and Dursun Delen. Advanced Data Mining Techniques. March 2008.
[34] Gema Bello Orgaz, Raul Cajias, and David Camacho. A study on the impact of crowd-basedvoting schemes in the 'Eurovision' European contest. In Proceedings of the International
Conference on Web Intelligence, Mining and Semantics - WIMS '11, May 2011.
[35] Sherwin Rosen. The Economics of Superstars. The American Economic Review, 71(5):845�858, 1981.
[36] Diego Rybski, Sergey V. Buldyrev, Shlomo Havlin, Fredrik Liljeros, and Hernan A. Makse.Scaling laws of human interaction activity. Proceedings of the National Academy of Sciences,106(31):12640, August 2009.
[37] Serguei Saavedra, Janet Efstathiou, and Felix Reed-Tsochas. Identifying the underlyingstructure and dynamic interactions in a voting network. Physica A: Statistical Mechanics
and its Applications, 377(2):672�688, April 2007.
[38] L. Spierdijk and M.H. Vellekoop. Geography, culture, and religion: Explaining the bias inEurovision song contest voting, February 2006.
[39] Chunyan Wang and Bernardo a. Huberman. How Random are Online Social Interactions?Scienti�c Reports, 2, September 2012.
[40] G. Yair and D. Maman. The Persistent Structure of Hegemony in the Eurovision SongContest. Acta Sociologica, 39(3):309�325, January 1996.
26/27

David García and Dorian Tanase:
Measuring Cultural Dynamics Through the Eurovision Song Contest
[41] Gad Yair. �Unite Unite Europe� The political and cultural structures of Europe asre�ected in the Eurovision Song Contest. Social Networks, 17(2):147�161, April 1995.
[42] Slavoj Zizek. The Sublime Object of Ideology. Verso, 1989.
27/27