measuring change in small intestinal histology in … · in clinical practice these histologic...
TRANSCRIPT
CLINICAL AND SYSTEMATIC REVIEWS
© 2018 by the American College of Gastroenterology The American Journal of GASTROENTEROLOGY
339
RE
VIE
W
CLINICAL AND SYSTEMATIC REVIEWS
INTRODUCTION
Celiac disease is an acquired chronic immune disorder that
develops in genetically susceptible individuals upon exposure to
ingested prolamin glycoproteins found in wheat (gliadins), barley
(hordeins), and rye (secalins), collectively referred to as “gluten”
( 1 ). Innate and adaptive immunologic reactions to gluten result
in chronic infl ammatory responses in the small intestinal mucosa
resulting in both structural and functional abnormalities.
Th ere are several characteristics of disease activity that can serve
as potential measures of response to therapeutic intervention in
patients with celiac disease, including symptoms, small bowel his-
tologic injury, and celiac-specifi c serologies. Th ere can be wide
variance in these measures, with some asymptomatic or minimally
symptomatic patients exhibiting severe histologic changes, while
other patients can experience severe symptoms and highly abnor-
mal small bowel histologic changes with normal serologies.
For the patient whose symptoms and serologic test results
suggest the possible diagnosis of celiac disease, establishing the
diagnosis requires documentation of the characteristic histologic
changes in the small bowel mucosa that include shortening of villus
architecture, elongation or hypertrophy of the crypts, and lympho-
cytic infi ltration of intraepithelial spaces and the lamina propria.
In clinical practice these histologic features are most commonly
qualitatively assessed; however, in the context of clinical research
and therapeutics development, specifi c, reproducible, and quanti-
tative measures need to be utilized to monitor responses over time
and allow for clear measurement to assess effi cacy end points.
Th e purpose of this state-of-the-art review is to examine the
available methodologies to measure histologic response to gluten
exposure in celiac disease. Our review supports the use of quanti-
tative histology as the preferred method for accurately and repro-
ducibly demonstrating change in celiac disease mucosal activity
both for clinical disease management and for evaluating the effi -
cacy of dietary and non-dietary interventions.
SMALL BOWEL HISTOLOGY IN THE DIAGNOSIS OF
CELIAC DISEASE
Diagnosis of celiac disease
In current clinical practice the diagnosis of celiac disease is based
on a combination of clinical, serologic, and histologic factors
( 2,3 ). Th e symptoms of celiac disease are widely varied. Some
Measuring Change In Small Intestinal Histology In
Patients With Celiac Disease
Daniel C. Adelman , MD 1 , Joseph Murray , MD 2 , Tsung-Teh Wu , MD, PhD 3 , Markku Mäki , MD, PhD 4 , Peter H. Green , MD 5 and Ciarán P. Kelly , MD 6
Small intestinal histologic abnormalities in celiac disease include atrophy of the intestinal villi, hypertrophy of the
crypts and lymphocytic infi ltration of intraepithelial spaces and lamina propria. These fi ndings are central to diagnosis
and their severity and change over time are valuable to monitor disease course and response to therapy. Subjective
methods to grade celiac disease histological severity include the Marsh-Oberhuber and Corazza-Villanacci systems.
Quantitative histology uses villus height (Vh), crypt depth (Cd), and intra-epithelial lymphocyte count (per 100
enterocytes) to provide objective measures of histologic changes including Vh:Cd ratio. Here we examine the available
literature regarding these methodologies and support the use of quantitative histology as the preferred method for
accurately and reproducibly demonstrating change of relevant histologic end points over time. We also propose
a Quantitative-Mucosal Algorithmic Rules for Scoring Histology (Q-MARSH) system to partially align quantitative
histology results with the traditional Marsh, Marsh-Oberhuber, and Corazza-Villanacci systems. Q-MARSH can provide
a standardized, objective, and quantitative histology scoring system for use as a clinical or research application.
SUPPLEMENTARY MATERIAL is linked to the online version of the paper at http://www.nature.com/ajg
Am J Gastroenterol 2018; 113:339–347; doi: 10.1038/ajg.2017.480; published online 20 February 2018
1 Department of Medicine, Division of Allergy and Immunology, University of California, San Francisco , San Francisco , CA , USA ; 2 Department of Gastroenterology
and Hepatology, Mayo Clinic , Rochester , MN , USA ; 3 Department of Laboratory Medicine and Pathology, Mayo Clinic , Rochester , MN , USA ; 4 Faculty of Medicine
and Life Sciences, University of Tampere and Tampere University Hospital , Tampere , Finland ; 5 Celiac Disease Center, Columbia University , New York , NY , USA ;
6 Celiac Center, Beth Israel Deaconess Medical Center, Harvard Medical School , Boston , MA , USA . Correspondence: Ciarán P. Kelly, MD, Celiac Center, Beth
Israel Deaconess Medical Center, Harvard Medical School , 330 Brookline Avenue , DANA-601 , Boston , MA 02215 , USA . E-mail: [email protected] Received 11 April 2017 ; accepted 2 October 2017
CME

Adelman et al.
The American Journal of GASTROENTEROLOGY VOLUME 113 | MARCH 2018 www.nature.com/ajg
RE
VIE
W340
patients have no evident symptoms. When present symptoms
generally include some combination of gastrointestinal (e.g., diar-
rhea and abdominal discomfort) and systemic manifestations
(e.g., the dermatitis herpetiformis) ( 4 ). Nutritional defi ciencies
(e.g., iron defi ciency) may also lead to symptoms (e.g., tiredness
and fatigue) ( 5 ).
Th e usual initial test for diagnosis or exclusion of celiac disease
is to assay for specifi c, serum, celiac-associated IgA (or in the case
of IgA defi ciency, IgG) antibodies directed to endomysium, tissue
transglutaminase-2, and deamidated gliadin peptides ( 6 ). Th ese
serology tests used alone, or in combination, are highly sensitive
and specifi c for the diagnosis of untreated celiac disease. In specifi c
clinical circumstances, such as a patient presenting already on a
strictly gluten-free diet (GFD) but without prior testing for celiac
disease, evaluation for HLA DQ2 and DQ8 alleles can be useful, as
a negative result will largely exclude celiac disease ( 7 ). Character-
istic endoscopic features of celiac disease are also described (e.g.,
“mucosal scalloping”, nodularity, fl attening, or “decreased” folds)
but their diagnostic accuracy is modest ( 8 ).
Histologic evaluation of the small intestinal mucosa using endo-
scopic biopsy samples is the mainstay of diagnosis of celiac disease.
However, similar fi ndings may occur in other gastrointestinal dis-
orders and should be suspected especially in patients presenting
with villus atrophy but negative celiac-specifi c serology markers
( 9 ). Th is is another clinical scenario where testing for permissive
HLA DQ2 and DQ8 alleles may be diagnostically helpful.
Most of the diagnostic features (e.g., clinical, serologic, and his-
tologic) are expected to improve in most patients and in many, may
normalize following the successful avoidance of gluten ingestion;
the notable exception is HLA genotype. Hence, favorable response
to the GFD is an additional and important component of diagno-
sis; whereas failure to respond to starting a GFD is an indication
for additional evaluation ( 3,10 ).
Small intestinal mucosal histologic changes
Celiac disease primarily aff ects the superfi cial mucosa of the small
intestine. Deeper layers are rarely aff ected. Th e mucosal lesion
varies considerably in severity and extent but the most character-
istic features are a loss of normal villus structure with a reduction
in villus height (Vh), a marked enlargement of the crypts with
an increase in crypt depth (Cd), and infl ammatory cell infi ltra-
tion with an increase in the density of intraepithelial lymphocytes
(IELs) ( 11 ).
Th e lamina propria cellular infi ltrate consists largely of plasma
cells and lymphocytes. Th e number of plasma cells is increased
two- to sixfold, but, as in normal mucosa, IgA-producing cells
predominate ( 12 ). Th e number of IELs per unit area of absorptive
epithelium (oft en reported as number of IEL per 100 enterocytes)
is increased especially in the tips of the remaining villi ( 11,13 ). In
the normal small intestinal mucosa, lamina propria T lymphocytes
are predominantly CD4+ cells, whereas the IEL are mainly CD8+
cells. In untreated celiac disease, this distribution of lamina propria
T cells is maintained, but the density of cells in both compartments
is increased.
HISTOLOGIC CLASSIFICATION SYSTEMS IN CELIAC
DISEASE
Marsh classifi cation
Th e Marsh classifi cation was originally created to help describe
associations between gluten exposure, polymorphisms of the
major histocompatibility complex, and mucosal pathology rep-
resentative of the spectrum of mucosal appearances observed
in response to gluten exposure ( 14 ); the classifi cation was not
intended for use in clinical practice. Marsh originally described
fi ve interrelated lesions, pre-infi ltrative, infi ltrative, hyperplastic,
destructive, and hypoplastic. Th e classifi cation was later modifi ed
by Oberhuber ( 15 ) and was intended to be used by clinical pathol-
ogists to assist in diagnosing celiac disease through assessing and
categorizing the degrees of mucosal abnormality in small intesti-
nal biopsies. Th e descriptive categories of the Marsh-Oberhuber
classifi cation include six diagnostic grades as presented in Figure
1 and Tables 1, 3, and 4 .
Limitations of the Marsh-Oberhuber classifi cation
Th ere are several practical limitations of the Marsh-Oberhuber
classifi cation ( Table 1 ): it is descriptive, qualitative, categorical,
and not sensitive to change ( 16 ). Although there is no established
practice as to whether histologic assessment is based on the most
severe changes, the least severe changes, or the average degree
of change, the most common practice is to grade the histologic
change on the most severe injury observed in the biopsy speci-
men ( 17 ). Th e lack of clearly defi ned criteria as well as reliance
on judging the most severely aff ected areas contributes to the
unreliability of the Marsh-Oberhuber classifi cation to make accu-
rate assessments of change over time. Th e classifi cation relies on
the subjective judgment of the pathologist and because of this,
shows low interobserver agreement and therefore, reduced repro-
ducibility ( 18,19 ). Corazza et al. evaluated the percent observed
agreement between pathologists and showed mean kappa values
ranging from 0.28 to 0.40 (low agreement), with an overall agree-
ment kappa of 0.35 ( 18 ). Similar fi ndings were reported by others
( 19,20 ). Th e agreement between pathologists by lesion (i.e., 0, I,
II, IIIa, IIIb, and IIIc) is only moderate, with the highest for types
0 (normal, kappa=0.46), I (a nonspecifi c mild increase in IEL,
kappa=0.23), and III lesions (kappa for IIIa, IIIb, and IIIc=0.19,
0.24, and 0.64, respectively) ( 18 ). Th is, in practice, reduces the
scale to a functional binary scale (either “normal” or “abnormal”)
with inherently little ability to show small, but clinically signifi -
cant changes in intermediate histology ( 19–21 ). Moreover, the low
levels of agreement (even for Marsh 0, I, and III) means that even
as a binary scale, the level of agreement is low to moderate, at best.
Th ose features characterize the limitations of the Marsh-Oberhu-
ber classifi cation making it unsuitable for repeated measures to
assess, over time, the eff ects of either a limited gluten exposure or
an eff ective but non curative therapeutic intervention.
Corazza-Villanacci score
Th e Corazza-Villanacci score divides the spectrum of celiac dis-
ease into three grades.

Histologic Measures in Celiac Disease
© 2018 by the American College of Gastroenterology The American Journal of GASTROENTEROLOGY
RE
VIE
W
341
Grade A, so-called non-atrophic, where there are normal crypts
and villus architecture but increased IELs (utilizing a threshold of
25 IELs per 100 enterocytes).
Grade B consists of grades B1 and B2. Grade B1 is atrophic with
Vh:Cd ratio of <3:1 but where villi are still clearly detectable and
IELs are increased. Grade B2 is atrophic to the extent that villi
are fl at and not detectable. Th ere is also crypt hyperplasia and
increased intraepithelial lymphocytosis ( 18,22 ). Th e Corazza-
Villanacci score has less variability and greater agreement between
pathologists ( 18 ). It may also approximate what oft en is used in
clinical practice, separating biopsy fi ndings into just three groups:
architecturally intact; partial villus atrophy; or total villus atrophy.
Biopsy histology reporting in current clinical practice
Of the histopathologic features of celiac disease summarized
above, three key elements are the most commonly noted as a part
of routine, clinical pathology reporting: Vh, which is most oft en
referred to in terms of a reduction (i.e., villus “blunting”, “fl atten-
ing”, or “atrophy”), crypt enlargement (oft en using terms such as
“elongation” or “hyperplasia”), and an increase in IEL density,
especially at the tip of the villus. At one of our institutions a tem-
plate has been developed for use by all members of the pathology
department to reduce variability in reporting ( 23 ). Th is includes
number of biopsy pieces, degree of orientation, degree of infl am-
mation, IELs, and Vh:Cd. Th is template allows the clinician to
assess the value of the pathological assessment as it includes infor-
mation on multiple factors, including the adequacy of specimen
orientationed.
In the CeliAction Study (Alvine Pharmaceuticals, San Carlos,
CA), patients entering screening were required to have a docu-
mented diagnosis of celiac disease in the medical history ( 24 ).
Clinical pathology reports from academic university-based medi-
cal centers and community-based practices were reviewed to
determine eligibility to enter into the screening stage of the study.
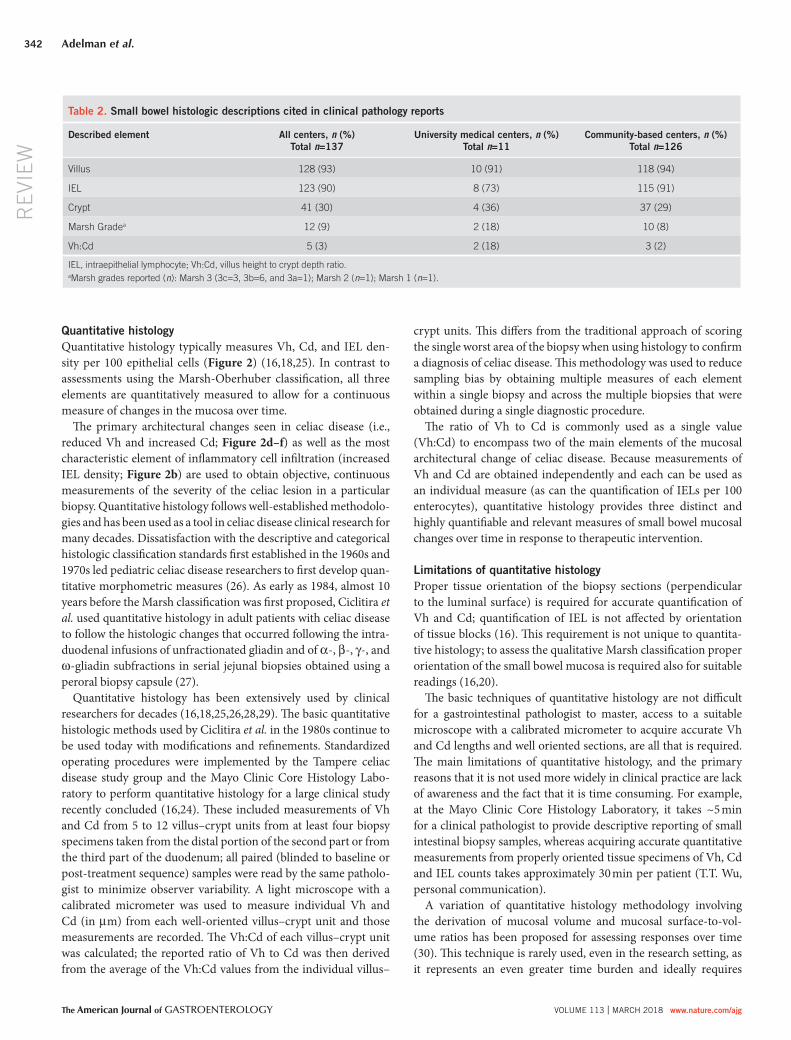
Table 2 provides a summary of the histopathologic elements
reported from 137 randomly selected diagnostic clinical pathol-
ogy reports. Th ese data reveal that in practice, clinical reporting
of pathology fi ndings are almost entirely descriptive, are seldom
comprehensive, and rarely cite Marsh grade (9%) or use any type of
scoring system (either descriptive or quantitative). Similar fi ndings
were reported by Arguelles-Grande et al. ( 20 ) on review of pathol-
ogy reports from pathologists in diff erent practice setting.
Healthy mucosa Celiac disease
Little malabsorption
Little crypt hyperplasia
Increased IELs
No villous atrophy
Minimal malabsorption
Some crypt hyperplasia
Increased IELs
Partial villous atrophy
Extensive malabsorption
Marked crypt hyperplasia
Increased IELs
Complete villous atrophy
0 I II IIIa IIIb IIIc
Figure 1 . Schematic depiction of Marsh-Oberhuber grades I–IIIc. Figure courtesy of M.M.; text adapted from Rostrom et al. ( 17 ). Footnote: due to sam-
pling variation histologic changes in small intestinal biopsy samples do not fully refl ect the totality of small intestinal histologic changes and also may not
correlate closely with clinical malabsorption.
Table 1 . Marsh-Oberhuber histologic grading in celiac disease
Grade Description and components
0 Normal—normal appearing villus architecture
I Infi ltrative—normal mucosal and villus architecture; increased numbers of IEL
II Hyperplastic—similar to I with enlarged crypts and increased crypt cell division
IIIa Partial villus atrophy—shortened, blunt villi; mild lymphocyte infi ltration, enlarged hyperplastic crypts
IIIb Subtotal villus atrophy—clearly atrophic villi, enlarged crypts whose immature epithelial cells are generated at an increased rate, infl ux of
infl ammatory cells
IIIc Hypoplastic—total villus atrophy, complete loss of villi, severe crypt hyperplasia, infi ltrative infl ammatory lesion
(Modifi ed from ( ref. 17 )).
Adelman et al.
The American Journal of GASTROENTEROLOGY VOLUME 113 | MARCH 2018 www.nature.com/ajg
RE
VIE
W342
Quantitative histology
Quantitative histology typically measures Vh, Cd, and IEL den-
sity per 100 epithelial cells ( Figure 2 ) ( 16,18,25 ). In contrast to
assessments using the Marsh-Oberhuber classifi cation, all three
elements are quantitatively measured to allow for a continuous
measure of changes in the mucosa over time.
Th e primary architectural changes seen in celiac disease (i.e.,
reduced Vh and increased Cd; Figure 2d–f ) as well as the most
characteristic element of infl ammatory cell infi ltration (increased
IEL density; Figure 2b ) are used to obtain objective, continuous
measurements of the severity of the celiac lesion in a particular
biopsy. Quantitative histology follows well-established methodolo-
gies and has been used as a tool in celiac disease clinical research for
many decades. Dissatisfaction with the descriptive and categorical
histologic classifi cation standards fi rst established in the 1960s and
1970s led pediatric celiac disease researchers to fi rst develop quan-
titative morphometric measures ( 26 ). As early as 1984, almost 10
years before the Marsh classifi cation was fi rst proposed, Ciclitira et
al. used quantitative histology in adult patients with celiac disease
to follow the histologic changes that occurred following the intra-
duodenal infusions of unfractionated gliadin and of α -, β -, γ -, and
ω -gliadin subfractions in serial jejunal biopsies obtained using a
peroral biopsy capsule ( 27 ).
Quantitative histology has been extensively used by clinical
researchers for decades ( 16,18,25,26,28,29 ). Th e basic quantitative
histologic methods used by Ciclitira et al. in the 1980s continue to
be used today with modifi cations and refi nements. Standardized
operating procedures were implemented by the Tampere celiac
disease study group and the Mayo Clinic Core Histology Labo-
ratory to perform quantitative histology for a large clinical study
recently concluded ( 16,24 ). Th ese included measurements of Vh
and Cd from 5 to 12 villus–crypt units from at least four biopsy
specimens taken from the distal portion of the second part or from
the third part of the duodenum; all paired (blinded to baseline or
post-treatment sequence) samples were read by the same patholo-
gist to minimize observer variability. A light microscope with a
calibrated micrometer was used to measure individual Vh and
Cd (in μ m) from each well-oriented villus–crypt unit and those
measurements are recorded. Th e Vh:Cd of each villus–crypt unit
was calculated; the reported ratio of Vh to Cd was then derived
from the average of the Vh:Cd values from the individual villus–
crypt units. Th is diff ers from the traditional approach of scoring
the single worst area of the biopsy when using histology to confi rm
a diagnosis of celiac disease. Th is methodology was used to reduce
sampling bias by obtaining multiple measures of each element
within a single biopsy and across the multiple biopsies that were
obtained during a single diagnostic procedure.
Th e ratio of Vh to Cd is commonly used as a single value
(Vh:Cd) to encompass two of the main elements of the mucosal
architectural change of celiac disease. Because measurements of
Vh and Cd are obtained independently and each can be used as
an individual measure (as can the quantifi cation of IELs per 100
enterocytes), quantitative histology provides three distinct and
highly quantifi able and relevant measures of small bowel mucosal
changes over time in response to therapeutic intervention.
Limitations of quantitative histology
Proper tissue orientation of the biopsy sections (perpendicular
to the luminal surface) is required for accurate quantifi cation of
Vh and Cd; quantifi cation of IEL is not aff ected by orientation
of tissue blocks ( 16 ). Th is requirement is not unique to quantita-
tive histology; to assess the qualitative Marsh classifi cation proper
orientation of the small bowel mucosa is required also for suitable
readings ( 16,20 ).
Th e basic techniques of quantitative histology are not diffi cult
for a gastrointestinal pathologist to master, access to a suitable
microscope with a calibrated micrometer to acquire accurate Vh
and Cd lengths and well oriented sections, are all that is required.
Th e main limitations of quantitative histology, and the primary
reasons that it is not used more widely in clinical practice are lack
of awareness and the fact that it is time consuming. For example,
at the Mayo Clinic Core Histology Laboratory, it takes ~5 min
for a clinical pathologist to provide descriptive reporting of small
intestinal biopsy samples, whereas acquiring accurate quantitative
measurements from properly oriented tissue specimens of Vh, Cd
and IEL counts takes approximately 30 min per patient (T.T. Wu,
personal communication).
A variation of quantitative histology methodology involving
the derivation of mucosal volume and mucosal surface-to-vol-
ume ratios has been proposed for assessing responses over time
( 30 ). Th is technique is rarely used, even in the research setting, as
it represents an even greater time burden and ideally requires
Table 2 . Small bowel histologic descriptions cited in clinical pathology reports
Described element All centers, n (%)
Total n =137
University medical centers, n (%)
Total n =11
Community-based centers, n (%)
Total n =126
Villus 128 (93) 10 (91) 118 (94)
IEL 123 (90) 8 (73) 115 (91)
Crypt 41 (30) 4 (36) 37 (29)
Marsh Grade a 12 (9) 2 (18) 10 (8)
Vh:Cd 5 (3) 2 (18) 3 (2)
IEL, intraepithelial lymphocyte; Vh:Cd, villus height to crypt depth ratio.
a Marsh grades reported ( n ): Marsh 3 (3c=3, 3b=6, and 3a=1); Marsh 2 ( n =1); Marsh 1 ( n =1).

Histologic Measures in Celiac Disease
© 2018 by the American College of Gastroenterology The American Journal of GASTROENTEROLOGY
RE
VIE
W
343
Th is preference is based on the quality of the data that are derived
by assessing the three independent and biologically relevant ele-
ments, Vh, Cd, and IEL densities. Furthermore, multiple measure-
ments can be obtained within a single biopsy and from multiple
biopsy specimens to reduce sampling error.
One of the most important advantages of quantitative histology,
particularly in the context of clinical research and drug develop-
ment applications, is the sensitivity to assessing change. Lähdeaho
et al. used quantitative histologic methods to demonstrate the
absolute change in Vh:Cd and IEL density in well-treated patients
with celiac disease (seronegative and without celiac-related symp-
toms) undergoing a 6-week gluten challenge with varying doses
of gluten. Because of the ability and sensitivity of quantitative his-
tology to show continuous change in mucosal architecture and
three-dimensional digital reconstruction of the mucosa using mul-
tiple stacked sections to obtain accurate results.
It is important to note that intestinal changes in celiac disease
vary from the proximal to distal small intestine and are oft en focal
or patchy. Hence, apparent histologic changes in small intestinal
biopsy samples do not fully refl ect the totality of small intestinal
histologic changes and may not correlate closely with clinical mal-
absorption. Th is important sampling limitation remains despite
expert and even quantitative histologic evaluation of mucosal
biopsies.
Advantages of quantitative histology
Quantitative histology is the preferred methodology for assess-
ing outcomes in clinical research and therapeutics development.
Figure 2 . Quantitative histology: evaluating intraepithelial lymphocyte (IEL) numbers and villus height to crypt depth (Vh:Cd) ratios. Mucosal sections at
high-power magnifi cations stained for CD3+ lymphocytes, ( a ) normal numbers and ( b ) increased IELs especially at the tip of the villus (>30 IELs per 100
enterocytes). Mucosal sections cut perpendicular to the luminal surface from ( c ) a patient with well-treated celiac disease on a gluten-free diet (GFD;
Vh:Cd=3.50; Vh 301.87 μ m, Cd 197.90 μ m), ( d , e ) patients on a GFD with incompletely treated celiac disease and varying degrees of architectural
abnormality ( d : Vh:Cd=1.53; Vh 524.79 μ m, Cd 150.02 μ m and e : Vh:Cd=1.38; Vh 225.69 μ m, Cd 162.96 μ m), and ( f ) total villus atrophy in a patient with
newly diagnosed celiac disease; the villi are fl at and the crypts are elongated (Vh:Cd=0).

Adelman et al.
The American Journal of GASTROENTEROLOGY VOLUME 113 | MARCH 2018 www.nature.com/ajg
RE
VIE
W344
IEL densities, the authors were able to demonstrate a linear dose–
response curve at daily gluten doses of 1.5, 3.0, and 6.0 g ( Supple-
mentary Figure F1 online) ( 28 ).
Quantitative histology measurements of Vh:Cd and IEL have
been shown to be both reliable and reproducible continuous meas-
ures (interclass correlation coeffi cients for intra- and interobserver
Vh:Cd 0.983 and 0.978, respectively, and for intra- and interob-
server IEL measures (0.961 and 0.842, respectively) ( 18 ). Th us,
quantitative histology allows for the most objectively derived,
quantitative and continuous measures and show superior repro-
ducibility to the Marsh-Oberhuber classifi cation.
APPLICATION OF QUANTITATIVE HISTOLOGIC
MEASURES IN CLINICAL RESEARCH AND
THERAPEUTICS DEVELOPMENT
Quantitative histology has been used in celiac disease clinical
research for over three decades ( 26,27 ). Th e advantages of quan-
titative histology include, objective, accurate, and highly repro-
ducible measurements ( 16 ), which have been used by researchers
when reliable serial assessment of the small intestinal mucosa
over time are needed to identify small or transient changes. Typi-
cally, these studies have examined the dose response and kinetics
of the responses to gluten exposure and withdrawal. Th ere is a
rich medical literature of reports detailing the use of quantitative
histology in celiac disease research to evaluate mucosal changes
between study groups and over time ( Table 3 ). Th e fi ndings and
relevance of selected studies listed in Table 3 are described in
Supplementary Table S1 and Supplementary Text .
It must be noted that the studies of quantitative histologi-
cal evaluation of duodenal biopsies to date have been limited to
assessing biopsies of the more distal duodenum and not biopsies
of the duodenal bulb that have been proposed to confer increased
sensitivity but also perhaps reduced specifi city for diagnosis
( 3,31–33 ).
QUANTITATIVE-MUCOSAL ALGORITHMIC RULE FOR
SCORING HISTOLOGY
On the basis of the information summarized above we propose
a Quantitative-Mucosal Algorithmic Rule for Scoring Histol-
ogy (Q-MARSH) in celiac disease. Th is can act as a quantitative
refi nement of the qualitative and categorical Marsh, Marsh-Ober-
huber and Corazza-Villanacci Scales. In the CeliAction Study
1,345 patients with celiac disease following a GFD and who still
complained of moderate or severe symptoms associated with
celiac disease underwent upper gastrointestinal endoscopy with
duodenal mucosal biopsy ( 24 ). Figure 3 shows the frequency dis-
tribution of the Vh:Cd in these patients at baseline assessment.
Of note, 38% showed a Vh:Cd value of ≤2.0, values that in the
proper clinical context would be confi rmatory of a diagnosis of
active celiac disease. In contrast, only 8% of patients had a Vh:Cd
of ≥3.0, which is consider to be “normal” ( 34,35 ). Th e major-
ity of patients with celiac disease (54%) on a GFD in this study
had Vh:Cd values between 2.1 and 2.9, demonstrating that in a
“real-world” setting the GFD alone is not suffi cient to allow heal-
ing and normalization of the mucosa in many patients. On the
basis of these data, anchored on quantitative histologic criteria, a
more quantitative categorical classifi cation could be constructed
to assist clinical practitioners in the diagnosis of patients and to
facilitate the evaluation of changes in mucosal injury over time for
patient management and for the evaluation of novel therapeutic
interventions. Such a system, called the Q-MARSH is presented
in Figure 3 and Table 4 .
Establishing a broadly accepted and objective celiac disease
activity measure will be valuable in facilitating development of
non-dietary interventional therapeutics for the treatment of celiac
disease. As discussed by Dr Janet Woodcock at a Critical Path
Institute presentation, an accepted disease measure can reduce
or eliminate second guessing during therapeutics development
regarding the validity and interpretation of the meaning of the
measure ( http://www.fda.gov/downloads/AboutFDA/CentersOf-
Table 3 . Comparison of main elements of histology measure in celiac disease
Marsh-Oberhuber grade Quantitative histology
0 I II IIIa IIIb IIIc Measures
Descriptor Infi ltrative Hyperplastic Partial villus
atrophy
Subtotal villus
atrophy
Total villus atrophy NA
Villus architecture Normal Normal Normal Shortened, blunt Clearly atrophic Complete loss Continuous range of
villus height (μ m)
Crypt architecture Normal Normal Enlarged Enlarged Enlarged Severe hyperplasia Continuous range of
crypt depth (μ m)
IEL Normal Increased Increased Mild infi ltration Infl ux Infi ltrative Lymphocyte count per
100 enterocytes
Interobserver
reproducibility a , b
Fair κ =0.46 Low κ =0.23 Very low κ =0.04 Low κ =0.19 Low κ =0.24 Good κ =0.64 Excellent ICC=0.978
Intraobserver ICC=0.983
ICC, intraclass correlation coeffi cient; IEL, intraepithelial lymphocyte; NA, not applicable; Vh:Cd, villus height to crypt depth ratio.
a Kappa for Marsh-Oberhuber ( 18 ).
b Intraclass correlation coeffi cient for quantitative histology ( 16 ).

Histologic Measures in Celiac Disease
© 2018 by the American College of Gastroenterology The American Journal of GASTROENTEROLOGY
RE
VIE
W
345
clinical researchers and therapeutics developers as a reliable meas-
ure of mucosal histology ( 24,25,27–29,36,37 ).
Th e reasons for preferring quantitative histology become
evident when comparing the two main methodologies ( Table
3 ). Both methods take into consideration the key elements of
fi ces/Offi ceofMedicalProductsandTobacco/CDER/UCM352761.
pdf ). At present an accepted measure widely used in practice by
clinical researchers, therapeutic development scientists, clinical
pathologists, and practitioners does not exist; however, quantita-
tive histology has been used for decades and is widely accepted by
140
Number of subjects
120
100
80
60
40
20
0
0.0
0.1
0.2
0.3
0.4
0.5
0.6
0.7
0.8
0.9
1.0
1.1
1.2
1.3
1.4
1.5
1.6
1.7
1.8
1.9
2.0
2.1
2.2
2.3
Baseline Vh:Cd2.
4
2.5
2.6
2.7
2.8
2.9
3.0
3.1
3.2
3.3
3.5
3.4
3.6
3.7
3.8
3.9
4.0
4.1
4.2
4.3
(0.0 – ≤2.0) 38%
(1.0 – ≤2.0) 31%
(0.0 – ≤0.5) 3%
(2.0 – ≤3.0) 54%
(>3.0) 8%
3C 3B 3A 2 1 or 0 (depending on IEL count)
Figure 3 . Villus height to crypt depth (Vh:Cd) frequency distribution of 1,345 patients with self-reported moderate or severe celiac disease-associated
symptoms. Frequency distribution of Vh:Cd in duodenal biopsies taken from 1,348 patient with celiac disease on treatment with a gluten-free diet but with
continuing moderate or severe celiac-associated symptoms (from CeliAction Study) ( 24 ). Proposed Quantitative-Mucosal Algorithmic Rules for Scoring
Histology scores are illustrated.
Table 4 . Q-MARSH and proposed comparisons with Marsh, Marsh-Oberhuber, and Corazza-Villanacci systems
Q-MARSH Marsh ( 14 ) Marsh-Oberhuber ( 15 ) Corazza-Villanacci ( 18 )
IELs Vh:Cd
Normal ≥3.0 0 0 Normal
Increased a ≥3.0 1 1 Grade A
Increased ≥2.0–<3.0 2 b 2 b
Increased ≥1.0–<2.0 3 c 3a d Grade B1 e
Increased ≥0.5–<1.0 3b d
Increased >0.5 3c d Grade B2 f
IEL, intraepithelial lymphocyte; Vh:Cd, villus height to crypt depth ratio; Q-MARSH, Quantitative-Mucosal Algorithmic Rules for Scoring Histology.
a Varies between studies but circa 30 per 100 enterocytes.
b Crypt hyperplasia or elongation. Vh:Cd in Q-MARSH does not discriminate between crypt elongation and shortening of the villi.
c Villus atrophy.
d Increasing villus atrophy.
e Partial villus atrophy.
f Complete villus atrophy.
Adelman et al.
The American Journal of GASTROENTEROLOGY VOLUME 113 | MARCH 2018 www.nature.com/ajg
RE
VIE
W346
mucosal architecture (i.e., Vh, Cd, and IEL density); however,
the Marsh-Oberhuber classifi cation incorporates subjective,
non-quantitative evaluation of the key mucosal elements into an
assigned categorical grading of the appearance of the mucosa. In
contrast, quantitative histology methodology relies on objective,
quantitative, and continuous measures of the key mucosal struc-
tural elements. Rather than pooling the key elements into one
qualitative assessment (Marsh-Oberhuber), quantitative histology
can objectively and accurately measure the key mucosal elements
to assess changes over time. Quantitative histology is sensitive
to change over time, reproducible, and demonstrates excellent
intra- and interobserver agreement. In practice, for over two dec-
ades quantitative histology has been used by clinical investigators
and drug developers to defi ne the underlying pathophysiology of
celiac disease in terms of response to specifi c gliadin peptides, as
well as the dose–response and time course to graded gluten expo-
sure ( 18,28 ). Th e inability to achieve uniformity in the application
of the Marsh-Oberhuber classifi cation is the greatest limitation
of a non-quantitative interpretation of histology. Th is certainly
calls into question the value of this methodology for accurately
assessing mucosal histologic change over time in response to ther-
apeutic intervention. As a future, alternative approach computer-
ized assessment of biopsy slides using quantitative sophisticated
image-processing technology has been suggested as an automated
approach that lacks human observer bias and easily lends itself to
standardization ( 38 ).
As potential therapeutic interventions are being brought
through the development process, it is critically important to be
able to identify clinically meaningful improvements, or a lack
thereof, in both symptoms and quantifi able histology measures of
disease activity. Th is necessitates the use of reliable, reproducible,
and accurate measures that are sensitive to change; full and com-
plete normalization of histology (i.e., moving from Marsh-Ober-
huber grade III to grade 0 lesions) is unlikely to be necessary for a
potential drug in development to be, in fact, clinically benefi cial to
patients with celiac disease.
We believe that descriptive reporting of small intestinal mucosal
histopathology, with or without Marsh-Oberhuber or Corazza-
Villanacci grading, is adequate in the majority of clinical circum-
stances for initial diagnosis of celiac disease. However, quantitative
histology is required to adequately measure change in histopathol-
ogy over time. Th is is relevant to two main clinical circumstances.
First, although not universal, many physicians recommend repeat
biopsy aft er 6–24 months of treatment with a GFD both to confi rm
the diagnosis of a gluten-sensitive enteropathy and to evaluate the
degree of response to therapy ( 3,39 ). Th ese goals are best achieved
by a quantitative comparison of current to initial (diagnostic)
biopsies.
Second, the examination of biopsy histopathology and its
comparison to prior biopsies is a pivotal point in the diff erential
diagnosis and management of non-responsive celiac disease. Cur-
rent guidelines use this assessment of histopathologic response
to determine the course of further investigation and treatment
( 3,39 ). Th is important evaluation is best achieved by quantitative
measurement of the relevant biopsy specimens in order to provide
clinicians with the best possible information as to the degree of
mucosal improvement or deterioration.
A third, less prevalent, clinical situation that is best served by
quantitative histopathology is the fi nding of non-celiac villous
atrophy. A reduction in villous height to Cd ratio that is not associ-
ated with a substantial increase in IELs can point to an alternative
diagnosis such as peptic duodenitis or auto-immune enteropathy.
Quantitative histology highlights this important distinction.
Quantitative histology is, at present, the best research tool to
measure mucosal immune response in celiac disease. It also has
the potential to become a valuable and accepted disease measure
for routine clinical application as outlined above. It can provide
very valuable summary measures of celiac disease activity (e.g., in
the form of Vh:Cd ratio and IEL count) for evaluating response
to therapy over time. Th us, we propose a set of quantitative-based
rules for scoring histology in celiac disease, called the Q-MARSH.
A hypothetic alignment of Q-MARSH scores against the more
traditional, subjective scoring systems of Marsh, Marsh-Oberhu-
ber, and Corazza-Villanacci is proposed in Table 4 . Accordingly,
as shown in Figure 3 , Vh:Cd values ≥3.0 without increased IEL
would be category 0 (normal) ( 34,35 ); Vh:Cd ≥3.0 with elevated
IEL, category 1; values ≥2.0–<3.0 with elevated IEL, category 2;
values ≥1.0–<2.0 with elevated IEL, category 3A; ≥0.5–<1.0 with
elevated IEL, category 3B; and <0.5 with elevated IEL, category
3C. Hence the Q-MARSH can be considered a parallel, alternative
approach that can provide a standardized quantitative histology
scoring system for use as a clinical or research application.
CONFLICT OF INTEREST
Guarantor of the article: Ciarán P. Kelly, MD.
Specifi c author contributions: Daniel C. Adelman: conceived article, co-
wrote early draft s, edited and fi nalized text, and developed fi gures. Joseph
Murray, Tsung-Teh Wu, Markku Mäki, and Peter H. Green: edited and
fi nalized text, and developed fi gures. Ciarán P. Kelly: conceived article, co-
wrote early draft s, edited and fi nalized text, and developed fi gures.
Financial support : Th is study was sponsored by a grant from Alvine
Pharmaceuticals, San Carlos, CA.
Potential competing interests: Joseph Murray has received grant
support from the National Institutes of Health, Alvine Pharmaceuti-
cals, and Alba Th erapeutics; receives ongoing support from Oberkot-
ter Foundation and Broad Medical Research Program at CCFA;
serves on the advisory board of Celimmune, LLC; was a consultant
to BioLineRx, GlaxoSmithKline (GSK), Genentech, and Glenmark
Pharmaceuticals; and is a consultant to ImunnosanT, Institute for
Protein Design (PvP Biologics), Takeda Pharmaceutical Company,
Innovate Biopharmaceuticals, and Intrexon. Peter Green: former
Scientifi c Advisor, Alvine Pharmaceuticals, Scientifi c Advisor, Immu-
nogenX, ImmusanT. Markku Mäki: Scientifi c Advisor, ImmusanT,
Cellimmune LLC, ImmunogenX and Innovate Biopharmaceuticals,
former Scientifi c Advisor, Alvine Pharmaceuticals. Daniel C. Adel-
man: former employee, Alvine Pharmaceuticals; Scientifi c Advisor,
ImmunogenX, ImmusanT, Takeda. Ciarán P. Kelly: Scientifi c Advisor
Celimmune, Cour, Innovate, Immunogenx, Takeda; former Scientifi c
Advisor Alvine Pharmaceuticals and Alba Pharmaceuticals; Research
sponsor Aptalis. Tsung-Teh Wu declare no confl ict of interest.
Histologic Measures in Celiac Disease
© 2018 by the American College of Gastroenterology The American Journal of GASTROENTEROLOGY
RE
VIE
W
347
21. Tack GJ , van de Water JM , Bruins MJ et al. Consumption of gluten with gluten-degrading enzyme by celiac patients: a pilot-study . World J Gastro-enterol 2013 ; 19 : 5837 – 47 .
22. Corazza GR , Villanacci V . Coeliac disease . J Clin Pathol 58 : 573 – 4 . 2005 . 23. Bao F , Bhagat G . Histopathology of celiac disease . Gastrointes Endosc Clin
North Am 2012 ; 22 : 679 – 94 . 24. Murray JA , Kelly CP , Green PHR et al. No diff erence between latiglutenase
and placebo in reducing villous atrophy or improving symptoms in patients with symptomatic celiac disease . Gastroenterology 2017 ; 152 : 787 – 798.e2 .
25. Lahdeaho ML , Maki M , Laurila K et al. Small-bowel mucosal changes and antibody responses aft er low- and moderate-dose gluten challenge in celiac disease . BMC Gastroenterol 2011 ; 11 : 129 .
26. Kuitunen P , Kosnai I , Savilahti E . Morphometric study of the jejunal mu-cosa in various childhood enteropathies with special reference to intraepi-thelial lymphocytes . J Pediatr Gastroenterol Nutr 1982 ; 1 : 525 – 31 .
27. Ciclitira PJ , Evans DJ , Fagg NL et al. Clinical testing of gliadin fractions in coeliac patients . Clin Sci (Lond) 1984 ; 66 : 357 – 64 .
28. Lahdeaho ML , Kaukinen K , Laurila K et al. Glutenase ALV003 attenuates gluten-induced mucosal injury in patients with celiac disease . Gastroenter-ology 2014 ; 146 : 1649 – 58 .
29. Catassi C , Fabiani E , Iacono G et al. A prospective, double-blind, placebo-controlled trial to establish a safe gluten threshold for patients with celiac disease . Am J Clin Nutr 2007 ; 85 : 160 – 6 .
30. Risdon RA , Keeling JW . Quantitation of the histological changes found in small intestinal biopsy specimens from children with suspected coeliac disease . Gut 1974 ; 15 : 9 – 18 .
31. Gonzalez S , Gupta A , Cheng J et al. Prospective study of the role of duo-denal bulb biopsies in the diagnosis of celiac disease . Gastrointest Endosc 2010 ; 72 : 758 – 65 .
32. Stoven SA , Choung RS , Rubio-Tapia A et al. Analysis of biopsies from duo-denal bulbs of all endoscopy patients increases detection of abnormalities but has a minimal eff ect on diagnosis of celiac disease . Clin Gastroenterol Hepatol 2016 ; 14 : 1582 – 8 .
33. Taavela J , Popp A , Korponay-Szabo IR et al. A prospective study on the usefulness of duodenal bulb biopsies in celiac disease diagnosis in children: urging caution . Am J Gastroenterol 2016 ; 111 : 124 – 33 .
34. Kaukinen K , Collin P , Holm K et al. Wheat starch-containing gluten-free fl our products in the treatment of coeliac disease and dermatitis herpeti-formis. A long-term follow-up study . Scand J Gastroenterol 1999 ; 34 : 163 – 9 .
35. Salmi TT , Collin P , Reunala T et al. Diagnostic methods beyond conven-tional histology in coeliac disease diagnosis . Dig Liver Dis 2010 ; 42 : 28 – 32
36. Sturgess R , Day P , Ellis HJ et al. Wheat peptide challenge in coeliac disease . Lancet 2010 ; 343 : 758 – 761x .
37. Leffl er D , Schuppan D , Pallav K et al. Kinetics of the histological, serologi-cal and symptomatic responses to gluten challenge in adults with coeliac disease . Gut 2013 ; 62 : 996 – 1004 .
38. Ciaccio EJ , Bhagat G , Lewis SK et al. Suggestions for automatic quantita-tion of endoscopic image analysis to improve detection of small intestinal pathology in celiac disease patients . Comput Biol Med 2015 ; 65 : 364 – 8 .
39. Kelly CP , Bai JC , Liu E et al. Advances in diagnosis and management of celiac disease . Gastroenterology 2015 ; 148 : 1175 – 86 .
AQ8
REFERENCES 1. Schuppan D , Junker Y , Barisani D . Celiac disease: from pathogenesis to
novel therapies . Gastroenterology 2009 ; 137 : 1912 – 33 . 2. Green PH , Cellier C . Celiac disease . N Engl J Med 2007 ; 357 : 1731 – 43 . 3. Rubio-Tapia A , Hill ID , Kelly CP et al. ACG clinical guidelines: diagnosis
and management of celiac disease . Am J Gastroenterol 2013 ; 108 : 656 – 76 . quiz 677 .
4. Farrell RJ , Kelly CP . Celiac sprue . N Engl J Med 2002 ; 346 : 180 – 8 . 5. Th eethira TG , Dennis M , Leffl er DA . Nutritional consequences of celiac
disease and the gluten-free diet . Expert Rev Gastroenterol Hepatol 2014 ; 8 : 123 – 9 .
6. Leffl er DA , Schuppan D . Update on serologic testing in celiac disease . Am J Gastroenterol 2010 ; 105 : 2520 – 4 .
7. Pallav K , Kabbani T , Tariq S et al. Clinical utility of celiac disease-associated HLA testing . Dig Dis Sci 2014 ; 59 : 2199 – 206 .
8. Barada K , Habib RH , Malli A et al. Prediction of celiac disease at endos-copy . Endoscopy 2014 ; 46 : 110 – 9 .
9. Pallav K , Leffl er DA , Tariq S et al. Noncoeliac enteropathy: the diff erential diagnosis of villous atrophy in contemporary clinical practice . Aliment Pharmacol Th er 2012 ; 35 : 380 – 90 .
10. Leffl er DA , Dennis M , Hyett B et al. Etiologies and predictors of diagnosis in nonresponsive celiac disease . Clin Gastroenterol Hepatol 2007 ; 5 : 445 – 50 .
11. Rubin CE , Brandborg LL , Phelps PC et al. Studies of celiac disease. I. Th e apparent identical and specifi c nature of the duodenal and proximal jejunal lesion in celiac disease and idiopathic sprue . Gastroenterology 1960 ; 38 : 28 – 49.
12. Baklien K , Brandtzaeg P , Fausa O . Immunoglobulins in jejunal mucosa and serum from patients with adult coeliac disease . Scand J Gastroenterol 1977 ; 12 : 149 – 59 .
13. Walker MM , Murray JA , Ronkainen J et al. Detection of celiac disease and lymphocytic enteropathy by parallel serology and histopathology in a population-based study . Gastroenterology 2010 ; 139 : 112 – 9 .
14. Marsh MN . Gluten, major histocompatibility complex, and the small intes-tine. A molecular and immunobiologic approach to the spectrum of gluten sensitivity (‘celiac sprue’) . Gastroenterology 1992 ; 102 : 330 – 54 .
15. Oberhuber G . Histopathology of celiac disease . Biomed Pharmacother 2000 ; 54 : 368 – 72 .
16. Taavela J , Koskinen O , Huhtala H et al. Validation of morphometric analyses of small-intestinal biopsy readouts in celiac disease . PLoS ONE 2013 ; 8 : e76163 .
17. Rostom A , Murray JA , Kagnoff MF . American Gastroenterological Associa-tion (AGA) Institute technical review on the diagnosis and management of celiac disease . Gastroenterology 2006 ; 131 : 1981 – 2002 .
18. Corazza GR , Villanacci V , Zambelli C et al. Comparison of the interobserv-er reproducibility with diff erent histologic criteria used in celiac disease . Clin Gastroenterol Hepatol 2007 ; 5 : 838 – 43 .
19. Mubarak A , Nikkels P , Houwen R et al. Reproducibility of the histological diagnosis of celiac disease . Scand J Gastroenterol 2011 ; 46 : 1065 – 73 .
20. Arguelles-Grande C , Tennyson CA , Lewis SK et al. Variability in small bowel histopathology reporting between diff erent pathology practice settings: impact on the diagnosis of coeliac disease . J Clin Pathol 2012 ; 65 : 242 – 7 .