measuring capital in the australian health and welfare
TRANSCRIPT

Welfare Division Working Paper Number 22
Australian Institute of Health and Welfare
Canberra
Cat. no. WWP22
Measuring capital in the Australian health and welfare sectors
Concepts, sources and methods
October 1999 Health and Welfare Expenditure Unit

The Australian Institute of Health and Welfare is Australia’s national health and welfare statistics and information agency. The Institute’s mission is
better information and statistics for better health and wellbeing.
© Australian Institute of Health and Welfare 1999
This work is copyright. Apart from any use as permitted under the Copyright Act 1968, no part may be reproduced without prior written permission from the Australian Institute of Health and Welfare. Requests and enquiries concerning reproduction and rights should be directed to the Head of the Communications, Media and Marketing Unit, Australian Institute of Health and Welfare, GPO Box 570, Canberra ACT 2601.
A complete list of the Institute’s publications is available from the Institute’s website <www.aihw.gov.au>.
Suggested citation
Australian Institute of Health and Welfare 1999. Measuring capital in the Australian health and welfare sectors: concepts, sources and methods. Canberra: AIHW.
Australian Institute of Health and Welfare
Board Chair
Professor Janice Reid
Director Dr Richard Madden
Any enquiries about or comments on this publication should be directed to:
John Goss or Maneerat Pinyopusarerk Australian Institute of Health and Welfare GPO Box 570 Canberra ACT 2601
Phone: (02) 6244 1151, (02) 6244 1161
Published by the Australian Institute of Health and Welfare
Please note that there is the potential for minor revisions of data in this report. Please check the online version at <www.aihw.gov.au> for any amendments.

iii
Contents Acknowledgments............................................................................................................................... v
Abbreviations...................................................................................................................................... vi
1 Introduction....................................................................................................................................1
2 Concepts..........................................................................................................................................2
2.1 Capital flow concepts .............................................................................................................2
2.2 Capital stock concepts ............................................................................................................3
2.3 Deriving capital stocks from capital flows ..........................................................................3
2.4 Types of capital........................................................................................................................4
2.5 Institutional sectors.................................................................................................................5
2.6 Industry segments...................................................................................................................5
3 Sources and methods....................................................................................................................6
3.1 GFCE.........................................................................................................................................6
3.2 Price indexes ............................................................................................................................7
3.3 Depreciation model and asset lives .......................................................................................9
3.4 Rental prices-combining the stock estimates for different asset types..........................10
4 Future developments ......................................................................................................................11
4.1 Concerns with ABS measures of capital stock and depreciation ....................................11
4.2 More specific price indexes...................................................................................................11
4.3 Possible future developments ..............................................................................................11
Appendix I: The Perpetual Inventory Model ............................................................................13
I.1 Mechanics of the PIM ...........................................................................................................13
I.2 Applying the PIM to the health and welfare sectors .......................................................14
Appendix II: Data on Gross Fixed Capital Expenditure.......................................................15
II.1 Private GFCE: building and construction-non-dwellings ...............................................15
II.2 Private GFCE: equipment.....................................................................................................16
II.3 Public enterprise GFCE.........................................................................................................17
II.4 General government GFCE ..................................................................................................18
II.5 Accuracy of GFCE data in the Australian National Accounts ........................................18
Appendix III: Data on prices of capital ..........................................................................................20
Appendix IV: Data on asset lives of capital ..................................................................................21
IV.1 Mean asset lives....................................................................................................................21
Asset lives-private equipment.............................................................................................21
Asset lives-private building and construction-non-dwellings .......................................22
Asset lives-public trading enterprise non-dwelling construction and equipment......22
Asset lives-general government non-dwelling construction and equipment ..............22
IV.2 Asset life distributions.........................................................................................................22

iv
Asset life distribution-alterations and additions ..............................................................22
Asset life distribution- all other asset types ......................................................................23
Appendix V: Gross and net capital stock.......................................................................................24
Appendix VI: Analysis of Gross Fixed Capital Expenditures and depreciation data ...........25
Introduction ..................................................................................................................................25
GFCE public sector.......................................................................................................................25
Trend: all states, all industry segments..............................................................................25
Hospitals.................................................................................................................................26
Mental health institutions ....................................................................................................28
Nursing homes ......................................................................................................................29
Other health ...........................................................................................................................30
Welfare services.....................................................................................................................31
Private GFCE.................................................................................................................................31
Depreciation..................................................................................................................................32
Appendix VII: Figures and tables of public sector gross fixed capital expenditures (GFCE), for health and welfare sectors, by type, State and industry segment, current and constant 1989-90 prices, 1962-1996 ............................................................................................36
VII.1 Estimates of public sector GFCE non-dwelling construction by State and by area of health and welfare expenditure in current prices ($ million) .........................................38
VII.2 Estimates of public sector GFCE non-dwelling construction by State and by area of health and welfare expenditure in constant 1989-90 prices ($ million).........................45
VII.3 Estimates of public sector GFCE equipment by State and by area of health and welfare expenditure in current prices ($ million).............................................................52
VII.4 Estimates of public sector GFCE equipment by State and by area of health and welfare expenditure in constant 1989-90 prices ($ million) ............................................59
VII.5 Estimates of public sector GFCE by area of expenditure, State, and industry segment in current prices ($ million) .................................................................................66
VII.6 Estimates of public sector GFCE by area of expenditure, State, and industry segment in constant 1989-90 prices ($ million) .................................................................73
Bibliography........................................................................................................................................80

v
Acknowledgments
This paper was written by the Analytical Services Section, Methodology Division, Australian Bureau of Statistics for the Australian Institute of Health and Welfare. Persons contributing included Ken Tallis, Ruel Abello and Joanne Caddy.

vi
Abbreviations
ABS Australian Bureau of Statistics
ANA Australian National Accounts
ANZSIC Australian and New Zealand Standard Industry Classification
GFCE Gross Fixed Capital Expenditure
GKS Gross Capital Stock
GPC Government Purpose Classification
IPD Implicit Price Deflator
NKS Net Capital Stock
OECD Organisation for Economic Co-operation and Development
PIM Perpetual Inventory Model
SNA93 United Nations System of National Accounts 1993

1
1 Introduction
This document is a guide to the estimates of capital stocks and flows for the Australian Health and Community Service sectors. It outlines the major concepts and definitions, describes the data sources and methods that have been used to construct the estimates, and discusses the accuracy of the estimates and what might be done to improve them. Since the ABS prepared this data in 1998, they have published in the Australian System of National Accounts (ABS 1999) an upgrade of capital stock and multi-factor productivity (MFP) estimates. Major changes include a switch from constant price estimates to chain volume measures, the weighting of the components of capital stock at a more detailed level, the expansion of the capital asset boundary, and the full integration of capital stock and MFP estimates.

2
2 Concepts
This chapter provides simplified definitions of key concepts that arise when discussing capital flows and stocks in the Australian Health and Welfare sectors.
A more technical treatment of these and related concepts is provided in the Australian Bureau of Statistics publication Australian National Accounts: Concepts, Sources and Methods (ABS Catalogue No. 5216.0).
2.1 Capital flow concepts Gross fixed capital expenditure [GFCE] is the expenditure on additions to durable goods (including purchases, both new and second-hand and own-account production, i.e. the creation of durable goods by entities for use in their own production processes) less sales of similar second-hand goods. It covers outlays on assets with a productive life of one year or more.
Capital expenditure estimates are shown on a 'gross' basis (i.e. deductions have not been made for the consumption of existing assets during the production process). However, the estimates are net of the sale of second-hand capital assets, where capital assets are defined as long-lasting durable goods such as machine tools and computers which are used as factor inputs in the production of other goods, as opposed to being sold directly to consumers.
The acquisition of non-reproducible tangible assets such as land, mineral deposits and timber tracts is regarded as a transfer of assets, not an addition to them, and is not included in GFCE.
However, capital costs associated with the extension or development of these assets are included, as are outlays on land reclamation and improvement. Expenditure associated with the improvement and alteration of durable assets which significantly extend their productive life is also included, but ordinary repairs and maintenance expenses are not.
The acquisition of intangible assets such as patents and copyrights is also excluded from GFCE.
Certain conventions have been adopted to resolve cases where ambiguities or boundary problems might arise. For example:
• Work put in place on structures is considered to be gross fixed capital expenditure of the unit for which the construction is being carried out, at the time the work is put in place. On the other hand, partially completed work on items of heavy machinery and equipment during the reference period is included as part of stocks of work-in-progress of the producer of the goods.
• Expenses associated with the transfer of real estate (real estate agents' commissions, lawyers' fees and government taxes and charges) are included in gross fixed capital expenditure.
Consumption of fixed capital (often referred to as 'economic depreciation') is that part of gross production that is required to replace the fixed capital used up in the production process during the reference period. It is based on the concept of the expected economic lifetime of an asset and is designed to cover the loss in value of capital due to normal wear

3
and tear, foreseen obsolescence, and the normal amount of accidental damage which is not made good by repair. Unforeseen obsolescence is treated as a capital loss, rather than as consumption of fixed capital.
Retirements are those assets that exit the capital stock in the reference period (i.e. capital items that will never again be used in production by the entity that made the original GFCE). Typically in the Australian national accounts which assume straight-line depreciation, retirements occur at the end of the assumed asset life, so an asset is retired once it is fully depreciated.
2.2 Capital stock concepts Gross capital stock [GKS] is the accumulation of past investment (GFCE) flows less retirements at the end of the reference period (typically, at 30 June of each year), before any deduction is made for the consumption of fixed capital.
Net capital stock [NKS] is the gross capital stock less the accumulated consumption of fixed capital.
Depending on the questions an analyst wishes to answer, either the GKS or the NKS concept may be the more appropriate. For studies of wealth, NKS or something akin to it is probably suitable. As discussed below, for studies of the contribution of capital to the production process, many analysts use a meld of the GKS and NKS measures.
2.3 Deriving capital stocks from capital flows In principle, it may be possible to estimate the capital stock for an industry by directly valuing the buildings, machines, etc. used in the industry. In practice, most countries (including Australia) do not adopt this direct approach to estimating the capital stock. Instead, they derive capital stock estimates from historical time series estimates of capital expenditures. The analytical device used for this derivation is the Perpetual Inventory Model [PIM]. PIM is summarised in Figure 2.1 and is described in greater detail in Appendix I.
To derive capital stock estimates for a given asset type using the PIM, one requires the following kinds of data:
• a time series of GFCE
• a time series of prices (or a price index) for the asset,
• a profile (or model or table) expressing the rate at which the asset depreciates (typically, analysts assumes some depreciation model, such as the straight-line or the diminishing balance model, which is not based on historical cost value, and assumes a mean asset life).
More sophisticated applications of the PIM may take into account retirements of assets with non zero accounting values, as well as depreciation of assets (which do not use the historical cost value of assets). Or they may take into account the fact that not all buildings or machines of a given type go out of service at exactly the time when the mean asset life expires.

4
Figure 2.1: Flowchart of the Perpetual Inventory Model
2.4 Types of capital Capital stocks and flows are classified by type of asset. The asset types shown in Australian national accounts statistics are as follows:
Dwellings covers houses and other dwellings (flats, home units, etc.). Expenditure on the construction of hostel-type accommodation and motels is included in building and construction - non-dwellings. Dwellings do not represent a significant proportion of the total GFCE in the Health and Welfare sectors, and they are not discussed further in this document.
Building and construction - Non-dwellings covers such assets as: industrial, commercial, and non-dwelling residential buildings; water and sewerage installations; lifts, heating, ventilating and similar equipment forming an integral part of buildings and structures; land development; roads; bridges; wharves; harbours; railway lines; pipelines; and power and telephone lines.
Equipment covers machinery and equipment including vehicles, aircraft, ships, electrical apparatus, office equipment such as computers, furniture, fixtures and fittings not forming an integral part of buildings, durable containers, special tooling, etc.
More details of the classification of capital are provided in Section 8 of the Australian Bureau of Statistics publication Australian National Accounts: Concepts, Sources and Methods (ABS Catalogue No. 5216.0).

5
2.5 Institutional sectors Capital stocks and flows are classified by the institutional sector that owns or uses them. The institutional sectors most relevant to Health and Welfare are as follows:
Private enterprises covers private companies registered under the Companies Act, private unincorporated enterprises, trusts and partnerships that maintain independent financial records.
Public trading enterprises covers publicly owned or controlled enterprises that are mainly engaged in the production of goods and services (in a cost-recovery manner) for sale in the market.
General government covers departments, offices and other bodies in the government sector mainly engaged in the production of goods and services outside the normal market mechanism. Costs of production are mainly financed from public revenues.
More details of the institutional sector classification are provided in Section 3 of the Australian Bureau of Statistics publication Australian National Accounts: Concepts, Sources and Methods (ABS Catalogue No. 5216.0). There have been changes to the institutional sector classification as detailed in SESCA 1998 (ABS Catalogue No. 1218.0) but these changes do not affect the results below.
2.6 Industry segments The industry classification used in the estimates of capital flows and stocks for Health and Welfare is based on the ANZSIC [Australian and New Zealand Standard Industry Classification] and the GPC [Government Purpose Classification].
Estimates of capital stock have been prepared for the following public sector segments according to the GPC classification:
• Hospitals
• Mental health institutions
• Nursing homes
• Other health
• Welfare services
and for the following major private sector segments according to ANZSIC classification:
• Hospitals
• Nursing homes
• Medical services
• Other health services
• Community services/welfare
and the following minor private sector segments according to ANZSIC classification:
• Pharmaceutical manufacturing
• Surgical manufacturing
• Pharmaceutical retailing
• Health insurance.

6
3 Sources and methods
This section provides an overview of key data sources and data construction methods used to compile estimates of capital flows and stocks for the Australian Health and Welfare sectors. Section 2.3 mentioned the three prerequisites in deriving estimates of capital stocks and depreciation.
3.1 GFCE The estimation of GFCE for the Health and Welfare sectors began from the estimates included in the national accounts (which are at the level of the ANZSIC Division, dissected by institutional sector).
Ideally as input to the PIM, one would wish to obtain a GFCE estimate for each major segment of Health and Welfare-hospitals, nursing homes, medical services, other health, welfare, pharmaceutical manufacturing, surgical manufacturing, pharmaceutical retailing, and health insurance. At present, this is possible only for: private equipment; public building and construction - non-dwellings and public equipment.
The key data sources for GFCE estimates are summarised in Table 3.1. A more detailed description is in Appendix II.

7
Table 3.1: Key data sources for estimates of Gross Fixed Capital Expenditure
Institutional sector Asset type Key data sources Annual estimates
Key data sources Quarterly estimates
Private enterprises Buildings and construction- Non-dwellings
Aggregations of quarterly estimates, dissected by sector and Industry. The dissections are based mainly on data collected In the ABS's quarterly survey of capital expenditure.
Data on the value of work done collected In the ABS's survey of building activity.
Equipment Data on depreciable assets complied by the Australian Taxation Office, with coverage and classification adjustments based on the ABS's quarterly survey of capital expenditure.
Data collected in the ABS's quarterly survey of capital expenditure.
Public
enterprises
Buildings and construction- Non-dwellings
Data constructed as part of the ABS's public finance system. The basic data sources Include annual reports, Auditor-Generals' reports and special collections conducted by the Commonwealth Grants Commission.
Data collected in a quarterly ABS survey of public enterprises.
Equipment Data constructed as part of the ABS's public finance system. The basic data sources include annual reports, Auditor-Generals' reports and special collections conducted by the Commonwealth Grants Commission.
Data collected in a quarterly ABS survey of public enterprises.
General
government
Buildings and construction- Non-dwellings
Data constructed as part of the ABS's public finance system. The basic data sources Include budget papers, Auditor-Generals' reports and special collections conducted by the ABS.
Data extracted from quarterly ledgers and receipt-expenditure statements of governments.
Equipment Data constructed as part of the ABS's public finance system. The basic data sources Include budget papers, Auditor-Generals' reports and special collections conducted by the ABS.
Data extracted from quarterly ledgers and receipt-expenditure statements of governments.
3.2 Price indexes The capital price indexes used for the Health and Welfare sectors are the same as those included in the national accounts (which are at the level of the ANZSIC Division, dissected by institutional sector).

8
Ideally as input to the PIM, one would wish to obtain a price index specific to each major segment of Health and Welfare. At present, such indexes are not available.
The key data sources for price indexes are summarised in Table 3.2. A more detailed description is in Appendix III.
Table 3.2: Key data sources for Capital Price Indexes
Institutional sector Asset type Key data sources and method of deflation
Buildings and construction-Non-dwelling (From December quarter 1978) GFCE Is deflated using weighted price indexes developed by Australian Construction Services, % of these are weighted according to the value of building and construction· non-dwellings work done.
Published source: Building Activity. Australia (ABS cat. No. 8752.0)
Private enterprise
Equipment GFCE Is deflated using weighted price Indexes for capital equipment manufactured In Australia and manufactured overseas. % of these are weighted according the value of domestic manufacturers’ sales and imports.
Published sources: Price Indexes of Articles produced by Manufacturing Industry, Australia (ABS cat. No. 6412.0) and unpublished Implicit price deflators for imports.
Buildings and construction-Non-dwelling GFCE is generally deflated using weighted price Indexes combining wage rates (primarily for persons employed in the building and construction industry) and construction output and input prices.
Published sources: Derived from Price Indexes of Articles Produced by Manufacturing Industry. Australia (ABS cat. No. 6412.0). Price Indexes of Materials Used in Manufacturing Industries. Australia (ABS cat. No. 6411.0) and Award Rates of Pay Indexes. Australia (ABS cat No. 6312.0).
Public enterprise
Equipment GFCE is generally deflated using weighted price indexes of capital equipment.
Published sources: Derived from Price Indexes of Articles Produced by
Manufacturing Industry. Australia (ABS cat. No. 6412.0). and Price Indexes of
Materials Used in Manufacturing Industries. Australia (ABS Cat. No. 6411.0).
General government Buildings and construction-Non-dwelling GFCE is generally deflated using weighted price indexes combining wage rates (primarily for persons employed in the building and construction Industry) and construction output and Input

9
prices.
Published sources: Derived from Price Indexes of Articles Produced by Manufacturing Industry. Australia (ABS cat. No. 6412.0). Price Indexes of Materials Used in Manufacturing Industries. Australia (ASS cat. No. 6411.0), and Award Rates of Pay Indexes. Australia (ABS cat No. 6312.0)
Equipment GFCE Is generally deflated using weighted price indexes of capital equipment.
Published sources: Derived from Price Indexes of Articles Produced by Manufacturing Industry. Australia (ASS Cat. No. 6412.0) and Price Indexes of Materials Used in Manufacturing Industries, Australia (ASS Cat. No. 6411.0).
3.3 Depreciation model and asset lives The assumptions regarding the depreciation model and asset lives used for the Health and Welfare sectors are the same as those used in the national accounts (which are at the level of the ANZSIC Division, dissected by institutional sector).
Depreciation model
For all applications of the PIM to the Health and Welfare sectors, a straight-line depreciation model has been assumed. An item of capital is retired from the capital stock once it is fully depreciated-thus, no separate assumption regarding retirements in the PIM is needed.
Mean asset lives
While there is some minor variation of asset lives between industries, the assumed mean asset lives for buildings and structures is fifty years or a little over, and for equipment thirteen years.
The values chosen for mean asset lives have been based on expert judgment, informed by an examination of the following data sources:
• asset lives that are implicit in the depreciation provisions of Australian tax law
• asset lives used by businesses to calculate depreciation for their own accounting purposes
• asset lives back-derived from data on the stocks of certain assets
• asset lives used in the PIMs of national statistical offices in other DECO countries.
More details of the asset life assumptions are provided in Appendix IV.
Asset life distributions
It is recognised that not all assets in a class will be fully depreciated (and hence disappear from the capital stock) at precisely the time the mean asset life expires. To provide more realistic and robust estimates, the Australian national accounts assume a distribution of asset lives around the mean life.
Australia follows the bell-shaped asset life distribution that was proposed by Winfrey (based chiefly on engineering studies) in 1938.

10
More details of the asset life distributions used for each asset class are provided in Appendix IV.
3.4 Rental prices-combining the stock estimates for different asset types To obtain an index of overall capital input, the different assets should be weighted together according to the capital services they provide. Capital stocks of the different asset types are usually combined using a so-called Tornqvist (symmetric, variable weighted) index, using rental prices as weights. According to a comprehensive view of rental prices, they can be calculated by reference to measures of price change, the internal rate of return, economic depreciation and the effects of tax laws, and also potentially investment allowances and the so-called Tobin "Q" ratio.
The Australian national accounts (and our experimental estimates for Health and Welfare) adopt a simplified rental price formula that has reference to only:
• price change,
• depreciation, and
• the internal rate of return.
More technical details of the hypothetical rental price and the estimates used in the Australian national accounts are provided in Bailey (1981) and Walters and Dippelsman (1985).

11
4 Future developments
4.1 Concerns with ABS measures of capital stock and depreciation The present estimates of capital stock data are derived using the PIM. The ABS has several concerns about them, including the following:
• the asset life assumptions may be out of date
• the changing composition of assets (especially equipment) may not be adequately taken into account
• the depreciation assumptions need to be re-examined
• the extended asset boundary implied by SNA93 must be worked through to the capital stock estimates.
The ABS undertook a project to address these concerns. A revamped methodology and reworked estimates of capital stock and depreciation was made available in 1999.
4.2 More specific price indexes The deflators for capital in the government sector (especially general government) are less satisfactory than those for the private sector. Ideally, one would wish to obtain price deflators for capital which relate specifically to the various segments of government Health and Welfare. The national accounts provide distinct deflators for:
• two levels of government (Commonwealth government | State and local government) and
• two types of assets (building and construction - non-dwellings | equipment)
but not for the different government service "industries". Thus the deflator for government Health is the same as the deflators for, say, Education and Law and order.
This has two consequences. First, the deflators used for the experimental estimates reflect prices for a variety of capital items (e.g. agricultural machinery) not relevant to Health. Second, even for capital items that are relevant to health services, the relative weights applied to the component price indexes are probably inappropriate.
Our assessment is that if we were to attempt to construct deflators specific to the segments of government health services (such as public acute care hospitals), the major difficulty would lie in obtaining suitable weights to combine low-level price indexes rather than in obtaining the low-level indexes themselves.
4.3 Possible future developments Other work the ABS may undertake in the future includes:

12
• Compiling aggregate estimates of capital stock, by weighting the individual asset types according to various measures of the user cost of capital.
• Testing the sensitivity of our experimental results to assumptions and alternative data constructions by:
– varying the mean asset lives
– varying the depreciation and retirement profiles
– compiling price indexes specific to public acute care hospitals (or at least specific to government health services).
– assessing quality adjustment bias in capital goods price indexes
– exploring the consequences of departures from perfect competition in the markets for capital inputs.
• Attempting some adjustment for variations in the utilisation of capital.

13
riod t
Appendix I: The Perpetual Inventory Model
This Appendix describes the Perpetual Inventory Model [PIM] which is used to derive capital stock and depreciation estimates from historical time series estimates of capital expenditures. See Figure 2.1 for a diagrammatic representation of the PIM.
To derive capital stock estimates for a given asset type using the PIM, one requires a time series of GFCE, a time series of prices (or a price index) for the asset, and a profile (or model or table) expressing the rate at which the asset depreciates. .
I.1 Mechanics of the PIM Broadly, the PIM produces estimates of gross capital stock by cumulating past flews of GFCE. At constant prices, gross capital stock at the end of the reference period is computed as follows:
previous period's stock
plus gross fixed capital expenditure during the reference period
less retirements during the reference period.
In our application of the PIM to the Health and Welfare sectors, we have assumed a straight-line depreciation model, and retirements occur only when the asset is fully depreciated.
Estimates of the consumption of fixed capital, and hence of the net capital stock, are derived using a depreciation function based on the expected economic lives of the assets. Net capital stock is computed in much the same way as gross capital stock, except that depreciation (consumption of fixed capital) is subtracted period by period as it occurs (rather than retiring the entire asset from the capital stock once its asset life has expired).
In algebraic form:
GKS$t = (GKS t-1+GI t-R t) * (PI t + PI t-1)/2
NKS$t= (NKS t-1+GI t-CC t) * (PI t + PI t+1)/2
Where
GKS t = deflated gross capital stock at end of pe
NKS t = deflated net capital stock at end of period t
GI t = deflated gross investment in period t
R t = deflated retirements in period t
CC t = deflated capital consumption in period t
PI t = price index in period t
$ = denotes the current dollar equivalent of the respective deflated series.

14
I.2 Applying the PIM to the health and welfare sectors Broadly, in constructing capital stock and depreciation estimates for the Health and Welfare sectors, the same data and assumptions have been used as underlie the national accounts estimates. The major departure from national accounts estimates relates to the level of industry disaggregation. • GFCE series have been compiled for various segments of Health and Welfare-hospitals,
nursing homes, medical services, other health, welfare, pharmaceutical manufacturing, surgical manufacturing, pharmaceutical retailing, and health insurance.
• However, the data construction for the Health and Welfare sectors has used price index series and mean asset lives at the same high level of aggregation as underlies the national accounts. In the main; these data are at the ANZSIC Division level. Data more specific to the various segments of Health and Welfare are not available at present.

15
Appendix II: Data on Gross Fixed Capital Expenditure
This Appendix summarises the sources of the GFCE data for the major types of capital relevant to the Health and Welfare sectors.
• In each case, the estimation begins from the highly aggregated estimates included in the national accounts. In the main, these are at the level of the ANZSIC Division, dissected by institutional sector.
• Then, if more detailed data are available, they are used to drill down to a finer level of disaggregation. Ideally as input to the PIM, one would wish to obtain a GFCE estimate for each major segment of Health and Welfare-hospitals, nursing homes, medical services, other health, welfare, pharmaceutical manufacturing, surgical manufacturing, pharmaceutical retailing, and health insurance. At present, this is possible only for: private equipment; public building and construction - non-dwellings and public equipment.
II.1 Private GFCE: building and construction-non-dwellings Sources used in the Australian National Accounts
Annual estimates for the total private sector are obtained by aggregating quarterly estimates. As the sources used to compile the total level estimates do not contain any sectoral or industry information, sectoral dissections and estimates for individual industries are derived mainly using data from the ABS Quarterly Survey of Private New Capital Expenditure as an indicator. Because the survey only includes the value of new assets, adjustments are made to reflect net purchases of second-hand assets from the public sector.
Quarterly estimates are based primarily on the value of work done during the period on private non-residential buildings from the Building Activity Survey and the value of work done during the period on private non-building construction activity from the Engineering Construction Survey.
Adjustments are made to the basic source data to allow for the exclusion from the Building Activity Survey of non-residential building jobs with an approval value of less than $30,000. A further adjustment is made to include buildings and structures on farms (which are not covered in these surveys). The estimates are also adjusted to reflect net purchases of second-hand assets from the public sector. Unlike the annual estimates, which are disaggregated into institutional sector and industries, quarterly estimates are compiled in total only.
Estimates for the most recent quarter are based on preliminary data from the above-mentioned surveys (the Building Activity Survey and the Engineering Construction Survey).
Further disaggregation (by segment of Health and Welfare)
The data sources available at present do not provide a finer disaggregation hence there are no available GFCE estimates for non-dwelling construction in the private sector. However, there are estimates of gross and net capital stock - non-dwelling construction. These numbers

16
are derived from the relevant Equipment figures using the assumption that the average split of GFCE between NDC and Equipment in the public sector also applies in the private sector (Table 11.1)
Table II.1: Gross and net capital stock in constant 1989-90 prices ($ million)
II.2 Private GFCE: equipment Sources used in the Australian National Accounts
Annual estimates are based on statistics of depreciable assets available from the Taxation Commissioner. Allowance is made for special taxation provisions applying to the mining, finance and agricultural industries and for those cases where there is a difference between when expenditure on plant can be recorded for tax purposes and when expenditure is actually incurred.
A further timing adjustment is made to account for those businesses that operate on a non-June financial year. An estimate is also made for late taxation returns by companies and

17
unincorporated businesses and for organisations which, due to the nature of their operations, are not subject to taxation. As complete taxation statistics only become available after a lag of about two years, estimates for the most recent two years are obtained by summing quarterly estimates.
Data are compiled separately for companies, individuals (sole traders), and partnerships and trusts, by industry, thereby providing the basis of the institutional sector and industry estimates. As data reported to the Taxation Commissioner are on an industry of ownership basis, adjustments have to be made to accord with Australian Accounting Standard 17 (Accounting for Leases) which requires that assets be recorded on an industry of effective ownership (use) basis. At the total private enterprise level, adjustments are required to take account of the net effect of assets leased to or from the public sector. These adjustments are made using data on net assets acquired under finance lease agreements collected from individual public trading enterprises and government financial institutions. At the institutional sector by industry level, significant adjustments are required to reallocate gross fixed capital expenditure from the financial enterprises sector to the corporate and unincorporated trading enterprise sectors and from the finance industry to other industries. Indicators for these adjustments include data from the ABS Quarterly Survey of Private New Capital Expenditure (data were collected on both the industry of ownership and industry of use bases for 1985-86 and 1986-87) and from Lease Finance, Australia (5644.0). As data on which to base the adjustments are not as detailed as would ideally be required, sector and industry estimates of gross fixed capital expenditure should be interpreted with caution.
An estimate of the value of net purchases of second-hand assets from the public sector is derived using data from quarterly surveys of public enterprises and general government units. An estimate of the value of motor vehicle sales from businesses-to households is deducted. The latter estimate is first derived on an annual basis using a perpetual inventory model of the stock of vehicles incorporating data from the ABS Survey of Motor Vehicle Usage and motor vehicle registrations data. Quarterly estimates are then interpolated and extrapolated according to new motor vehicle sales.
Further disaggregation (by segment of Health and Welfare)
From the ABS's business statistics group, it has been possible to obtain taxation-based data at the 4-digit ANZSIC level. In particular, this means that it has been possible to construct GFCE estimates for the following segments of Health and Welfare - hospitals, nursing homes, medical services, other health, welfare, pharmaceutical manufacturing, surgical manufacturing, pharmaceutical retailing and health insurance.
These data are available back to financial year 1989-90. There is a minor discontinuity in the series at 1996:
• Prior to 1996, there was a discrepancy between the Australian Taxation Office (ATO) industry codes and the ANZSIC codes.
• From 1996 onwards the data are classified by ANZSIC codes.
II.3 Public enterprise GFCE Sources used in the Australian National Accounts
Annual estimates for the public trading enterprises (including public marketing boards) component are derived from the Public Finance System. The main sources used are financial statements attached to public enterprise Annual Reports, Auditor-Generals' Reports, and a

18
joint ABS/Commonwealth Grants Commission Collection from each local government authority. The extracted data are coded using a standard classification framework which allows unit data to be aggregated to required levels. Gross fixed capital expenditure is classified according to type of asset (dwellings, building and construction - non-dwellings and equipment), industry and purpose. Because of delays in the receipt of data, estimates for the latest year are based on quarterly sources. Estimates for public financial enterprises are derived from an annual collection from each of the enterprises.
Quarterly estimates are based on a quarterly collection covering all significant public enterprises and a sample survey of local government authorities.
II.4 General government GFCE Sources used in the Australian National Accounts
Annual estimates for Commonwealth and State general government are extracted from administrative by-product sources such as financial statements prepared by the Minister for Finance, Commonwealth and State Budget Papers and Auditor-Generals' Reports, Commonwealth Department of Finance ledgers and supplementary departmental documents, and by direct collection from general government units. The extracted data are coded using a standardised classification framework which allows unit data to be aggregated to the required level. Gross fixed capital expenditure transactions are classified by type of asset and purpose.
A joint ABS/Commonwealth Grants Commission annual return on capital expenditure is collected from each local government authority in Australia.
Quarterly estimates for Commonwealth and State general government, are extracted from administrative by-product sources such as the Commonwealth Department of Finance quarterly ledger, and State government monthly and quarterly state:p1ents of receipts and expenditure. Data are also obtained from a quarterly sample of general government non-budget units. Data for local government are available from a quarterly sample of about 20 per cent of authorities.
Further disaggregation (by segment of Health and Welfare)
From the ABS's public authority finance group, it has been possible to obtain GFCE data for both building and construction - non-dwellings and equipment dissected by segment of Health and Welfare. These data are dissected according to the Government Purpose Classification, which mirrors ANZSIC.
II.5 Accuracy of GFCE data in the Australian National Accounts Chapter 5 of the Australian Bureau of Statistics publication Australian National Accounts: Concepts, Sources and Methods (ABS Catalogue No. 5216.0) includes subjective ratings of the accuracy of various national accounts. While these ratings are not based on a strict statistical derivation, they are broadly intended to indicate the following margins of error:
A ± less than 5 per cent "good"
B ± from 5 per cent to less than 10 per cent "fair"

19
C ± from 10 per cent to less than 20 per cent "poor"
D ± greater than 20 per cent "very poor"
Table II.2 reproduces the accuracy ratings for national accounts GFCE series.
Table 11.2: Accuracy ratings of Gross Fixed Capital Expenditure (current prices)
Sector Asset type Accuracy rating for annual estimates
Accuracy rating for quarterly estimates
Private enterprises Building and construction -Non-dwellings Equipment Real estate transfer expenses Total
B A B A
B B B B
Public enterprise Building and construction -Non-dwellings Equipment Total
B B A
np np np
General government Building and construction -Non-dwellings Equipment Total
C C A
np np A
np = not published

20
Appendix III: Data on prices of capital
This Appendix summarises the sources of the price index data for the major types of capital relevant to the Health and Welfare sectors.
In each case, the PIM used the highly aggregated indexes underlying the estimates included in the national accounts. In the main, these are at the level of the ANZSIC Division, dissected by institutional sector. This implies that the price indexes generally cover a broader range of Health and Welfare segments than do the GFCE series that they are used to deflate.
Ideally, separate price indexes would be available for each vintage of investment, cover the whole lifetime of the expenditure and be based on the composition of the expenditure at that time or, better still, the composition of expenditure which still survives in the capital stock. But because of - the long time period that must be covered by series used in the PIM, the price indexes used relate to a number of different base periods.
The ABS has published constant price estimates of the national accounts with base years of 1953-54, 1959-60, 1966-67, 1974-75, 1979-80, 1984-85 and currently 1989-90. The indexes on different base periods have been spliced together.
Although one price index series results for each item, it is a hybrid of several series. When the PIM calculates the current replacement cost of equipment purchased in 1949-50 for example, it is using price indexes for the early 1950s which reflect the composition of GFCE in 1953-54. In the mid to late 1950s, the PIM is using price indexes which reflect the composition of GFCE in 1959-60, and so on.
The splicing may introduce some distortion in the estimates of capital stock and depreciation.
This distortion is likely to be most serious for very long-lived assets. However, old assets tend to make up relatively low proportions of the Australian capital stock. Furthermore, equipment (which has the most diverse components and therefore is most likely to have compositional change and different rates of price increase) is relatively short lived.
Table 3.2 summarised the major data sources for price indexes used in the PIM model for the Health and Welfare sectors.
The deflators for capital in the government sector (especially general government) are less satisfactory than those for the private sector. Broadly, the national accounts deflators for government capital are compiled using the following price indexes and other data:
• producer price indexes for materials used by manufacturing industry [MUMI]
• producer price indexes for articles produced by manufacturing industry [APMI]
• producer price indexes for materials used in building and construction - non-dwellings
• data on award and average wages
and using weighting data from the following sources:
• Input-Output tables (at present compiled at five-yearly intervals for Australia, although annual compilation will begin in the next couple of years)
• surveys of engineering construction and other capital-creation actiVIIy.

21
Appendix IV: Data on asset lives of capital
This Appendix summarises the assumptions made about asset lives (and about the allied concept of asset life distributions) for the major types of capital relevant to the Health and Welfare sectors.
In each case, the PIM applied to the Health and Welfare sectors has used the same asset life assumptions as underlie the more highly aggregated estimates included in the national accounts.
In the main, these are at the level of the ANZSIC Division, dissected by institutional sector.
The estimates of capital stock and depreciation generated by the PIM are quite sensitive to the asset lives which are assumed.
National accounts experts have formulated their asset life assumptions having regard to several sources of information:
• asset lives that are implicit in the depreciation provisions of Australian tax law
• asset lives used by businesses to calculate depreciation for their own accounting purposes
• asset lives back-derived from data on the stocks of certain assets
• asset lives used in the PIMs of national statistical offices in other OECD countries.
IV.1 Mean asset lives The mean asset lives assumed for building and construction - non-dwellings and equipment in each segment of Health and Welfare are summarised in Table IV.1.
Asset lives-private equipment
Implicit tax lives are used as the source of relativities between industries, as they are Australian-based, comprehensive in their coverage and use prescribed lives derived from detailed ATO investigations.
However, OECD lives, business records, transport equipment data and anecdotal evidence all suggest that the Australian tax lives are shorter than economic lives. The all-industries ratio of OECD average life to implicit tax life was around 1.5.
Thus the asset lives used in the PIM are obtained by multiplying the tax lives by 1.5.
Most countries assume a fixed mean asset life, but several studies suggest a decreasing mean asset life. Asset lives may also be reducing owing to unforeseen obsolescence. (This may be of some importance to Health Services as advancement in medical technology and practices can make expensive machinery obsolete.) For national accounts purposes, an arbitrary 0.5% decline in asset life per year since 1950 is assumed for private equipment. The assumption of a decline in asset life over time reflects the increasing pace of technological change, the increasing pace of economic change, and changes in the relative costs of purchasing replacements and maintaining old equipment.
22
Asset lives-private building and construction-non-dwellings
Taxation lives are considered too short, and lacking in discrimination between different industries and types of buildings.
Unpublished data used in compiling the ABS's estimates of building activity showed separately new work, and alterations and additions for different types of buildings. Alterations and additions have an average asset life about half that of new work.
Information on types of other construction for the private sector was obtained from the ABS's estimates of construction (other than building) operations.
For national accounts purposes, estimates of mean asset lives for private non-dwelling construction were struck on a subjective basis, taking into account lives used in other OECD countries, accounting estimates, and estimated proportions of new buildings, alterations and additions and non-building construction.
Asset lives-public trading enterprise non-dwelling construction and equipment
The asset lives for ANZSIC Divisions D (Electricity, gas and water supply), G and H (Transport and storage, and Communication) and L (Recreation, personal and other services) are based on special industry investigations conducted by the ABS. Together, these industries account for around 90 per cent of public trading enterprises GFCE.
For other industries, the private sector asset life estimates were used.
Asset lives-general government non-dwelling construction and equipment
This category consists largely of offices, schools, hospitals and roads. Estimates for the non-road construction element were derived by referring to overseas sources, estimates for comparable private sector industries and prescribed tax lives applied to general government gross fixed capital expenditure data by commodity at purchasers' prices from input - output tables.
IV.2 Asset life distributions The Australian national accounts assume a distribution of asset lives around the mean life.
Australia follows the bell shaped asset life distribution (Winfrey 1938).
Asset life distribution-alterations and additions
For alterations and additions, the national accounts assume a "Winfrey S0" distribution which has a flat, symmetrical bell shape.

23
Asset life distribution- all other asset types
For all other types of capital, the national accounts assume a "Winfrey S3" distribution. This implies that 75 per cent of assets are retired within ±30 per cent of the mean life.
Table IV.I: Mean asset lives of capital in the Health and Welfare Sectors
Segment of Health and Welfare GPC/ANZSIC code and description Mean asset life
Hospitals and other Institutional services GPC 051 - Hospital and other institutional services and benefits
NDC-54 Eq -13
Other health GPC 052 - Clinic and other non-institutional services and benefits GPC 053 - Public health GPC 054 - Pharmaceuticals, medical aids and appliances GPC 055 - Health research GPC 059 - Health nec.
NDC-54 Eq -13
Welfare GPC 062 - Welfare services NDC-54 Eq -13
Private hospitals ANZSIC 8611 - Hospitals (except psychiatric hospitals) ANZSIC 8612 - Psychiatric hospitals
NDC-51 Eq -13
Medical services ANZSIC 8621 - General practice medical services ANZSIC 8622 - Specialist medical services
NDC-51 Eq -13
Other health services ANZSIC 5613 - Nursing homes ANZSIC 5623 - Dental services ANZSIC 8631 - Pathology services ANZSIC 8632 - Optometry and optical dispensing ANZSIC 8633 - Ambulance services ANZSIC 8634 - Community health centres ANZSIC 8635 - Physiotherapy services ANZSIC 8636 - Chiropractic services ANZSIC 8639 - Health services nec.
NDC-51 Eq -13
Community services (welfare) ANZSIC 8710 - Child care centres ANZSIC 8721 - Accommodation for the aged ANZSIC 8722 - Residential care services nec.
ANZSIC 8729 - Non-residential care services nec.
NDC-51 Eq -13
Health insurance ANZSIC 7421 - Health Insurance NDC-51 Eq -13
Pharmaceutical, cosmetic and toiletry retailing
ANZSIC 5251 - Pharmaceutical, cosmetic and toiletry retailing
NDC-51 Eq -13
Medical and surgical equipment manufacturing
ANZSIC 2832 - Medical and surgical equipment manufacturing
NDC-51 Eq -13
Medicinal and pharmaceutical product manufacturing
ANZSIC 2543 - Medicinal and pharmaceutical product manufacturing
NDC-51 Eq -13
NOC = Building and construction - non-dwellings, Eq = Equipment

24
Appendix V: Gross and net capital stock
Gross capital stock (GKS) is the accumulation of past investment (GFCE) flows less retirements at the end of the reference period.
Net capital stock (NKS) is the gross capital stock less the accumulated consumption of fixed capital.
At present, the Australian national accounts measure of net capital stock series reflects primarily the economic value of capital, not the contribution of capital to production in such-and-such a period. An item of capital which is near the end of its life may have a low economic value (because it has largely been depreciated and the value of the future income stream it can generate is small), but it may still be used effectively in current-period production an extreme example is a light bulb near its mean-time-to-failure.
• If net capital stock is used as the capital input measure, the contributions of assets to production are assumed to decline at the same rate as the assets' decline in economic value (say, in conformity with a straight-line depreciation profile). There is a good deal of debate about the validity of this approach, particularly for buildings and structures.
• If gross capital stock is used, the decline in capital's contribution to production is not recognised at all in the capital input measures.
Acknowledging these difficulties, the ABS's multifactor productivity computations use a weighted average of the gross and net capital stock estimates, with weights of 1:1 for buildings and structures and 1:3 for equipment. This approximates the method used by the US Bureau of Labour Statistics. More recent calculation of multifactor productivity (ABS 1999) use a more sophisticated method based on chain volume estimates for measuring output and capital input, excluding ownership transfer costs.
Experimental estimates of the productive capital stock in Health and Welfare have been constructed using the following formulae:
Weighted average capital stock at constant prices non-dwelling construction = (O.5*net capital stock at constant prices) + (O.5*gross capital stock at constant prices)
Weighted average capital stock at constant prices equipment = (O.75* net capital stock at constant prices) + (O.25*gross capital stock at constant prices)

25
Appendix VI: Analysis of Gross Fixed Capital Expenditures and depreciation data
Introduction Gross fixed capital expenditure (GFCE) is one of the series that comes into the estimation of capital stock using the PIM. As described in Section 2.1, GFCE is the expenditure on additions to durable goods less sales of similar second-hand capital assets. Consumption of fixed capital (depreciation), on the other hand, is that part of gross production that is required to replace the fixed capital used up in the production process during the reference period.
This section describes the observed trends in GFCE and depreciation data for the health and welfare sector. GFCE in this appendix refers to two types of assets: non-dwelling construction (NDC) and equipment. NDCs, by definition, cover such assets as industrial, commercial, and non-dwelling residential buildings; water and sewerage installations; lifts, heating, ventilating and similar equipment forming an integral part of buildings and structures; land development; roads, bridges, wharves, harbours, railway lines; pipelines; and power and telephone lines. Some of the asset types in the definition may not be relevant to the health and welfare sectors.
The trends described are those for constant price estimates. The movements in the deflators used to convert current price to constant price estimates are also briefly discussed.
One of the major problems encountered in analysing these data is the implication of zero-rounded values (anything less than $500,000 are rounded to 0). The reader is thus cautioned that constant GFCE series with zero values may give false trends. Thus a description of the average annual growth rate covering long periods containing zero values should be interpreted with care.
Where possible, trends are described for each of the industry segment in the health and welfare sector. For the public sector, these are the hospitals, mental health institutions, nursing homes, other health, and welfare.
GFCE public sector The movements in GFCE are depicted in the charts and tables contained in Appendix VII. From among these charts and tables, the following are highlighted in this appendix:
Trend: all states, all industry segments
Overall, from 1962 to 1996, GFCE on NDCs by all states grew by an annual average of 3.4 per cent. Expenditures on NDCs by the Commonwealth Government, on the other hand, dropped by an average of 10.2 per cent annually over the same period. On equipment, the states' GFCE expanded by an annual average of 10.1 per cent. The corresponding growth for the Commonwealth was negative 4.2 per cent (Table VI.l and Figure VI.l).

26
Table VI.I Average annual GFCE growth rates, 1962-96
Annual average growth (%)
NDC
All States 3.4
Commonwealth -10.2
Equipment
All States 10.1
Commonwealth -4.2
Figure VI.I: GFCE, All States and Commonwealth, :-U1 Industry Segments, 1962-1996
Hospitals
In real terms, the states hospital GFCE (Fig. VI.2) on non-dwelling constructions grew by an annual average of 4.1 per cent during the period 1962 to 1996. Gross fixed capital expenditure on equipment, on the other hand, grew by an average of 10.9 per cent annually. On a decade-by-decade movement, expenditures on non-dwelling construction expanded the fastest in the 80s; for equipment, it was in the first half of the 90s. In 1990 prices, expenditures on non-dwelling construction peaked in 1994 ($788 million); for equipment, expenditures peaked in 1976 due largely to expenditures in New South Wales and Victoria.

27
Figure VI.2: Public Hospitals (All States) GFCE: Average Annual Real Growth Rate (%)
There are three distinct trends on expenditures on non-dwelling construction: (1) the moderate increasing trend from 1962 to 1977 when GFCE on NDC rose annually by an average of 6.2 percent; (2) the declining trend in 1978-83, when GFCE on NDC fell by an average 14.2 percent annually; and (3) the rapid increase starting 1984 and going for a decade at an average growth of 16.3 per cent annually (Table VI.2). Largely, the first and second trends are accounted for by movements of GFCE on NDC in Queensland, South Australia and Western Australia, while the third trend is explained mostly by the significant jump in GFCE on NDC in New South Wales in the second half of the 80s. '
Table VI.2: GFCE trends, All States, Public Hospitals: Average annual real growth rate (%)
Non-dwelling construction Equipment
Rising 1962-1977 6.2 Flat growth 1962-73 2.1
Declining 1978-1983 -14.2 Rapid rise 1974-78 51.4
Rising 1984-1994 16.3 Rapid decline 1977-82 -18.2
Erratic growth 1983-96 21.7
The constant price value of GFCE on equipment jumped dramatically in 1974-76, after more than a decade of sluggish growth at 2.1 per cent annually. After 1976, however, GFCE on equipment started to decline, reaching a new low in 1987. Since then expenditure on equipment displayed an upward see-sawing trend (Fig. VI.3).
Figure VI.4 shows the current versus constant prices capital expenditures by public state hospitals on non-dwelling construction and equipment. The constant price estimates control for price changes. For non-dwelling construction, GFCE is deflated using weighted price indexes combining wage rates (primarily for persons employed in the building and construction industry) and construction output and input prices. This weighted price index had been inching up during the decade 1962-72 by an annual average of 2.4 per cent (Table VI.3). From 1973 to 1983 the annual increase was much faster, averaging 14.9 per cent. From 1984 onwards, the annual average growth stood again at 2.4 per cent. For equipment, prior to 1987, the weighted prices of capital equipment grew at a similar pace as the non-dwelling construction. But starting 1988, the weighted price index dropped at an annual average rate of minus 2.0 per cent.

28
Figure VI.3: Public hospitals (all states) historical series
Figure VI.4: GFCE, all states, public hospitals, current and constant prices estimates
Table VI.3: Weighted price indexes (deflators) average annual growth (%)
Non-dwelling construct/on Equipment
1962-72 4.3 3.3
1973-83 14.9 11.3
1984 onward 4.3 -
1988 onward - -2.0
Mental health institutions
Victoria and New South Wales are the only states which had sizeable expenditures on non-dwelling construction of mental health institutions. In New South Wales, GFCE on NDC (constant prices) were relatively high in the 60s but dropped significantly in the early 70s. They remained low from 1974 onwards but picked up again in 1991. In Victoria, GFCE on

29
NDC were also high in the 60s and 70s but has been displaying a downward trend towards the 90s. Despite this, average growth rate from 1962 to 1996 stood at 6.6 per cent per annum.
Expenditures on equipment by New South Wales and Victoria were also significant, notably by the former which spent $199 million on equipment in 1996 (current prices) (Figure VI.5).
Figure VI.5: Expenditure on non-dwelling construction by mental health institutions
Nursing homes
Victoria is the only state to have recorded spending significant amounts on non-dwelling construction in the nursing homes industry (Figure VI.6). Expenditures peaked in 1979 at $19 million (1990 prices), then dropped to negligible levels in the first half of the 80s and then picked up again in recent periods" However most of this apparent expenditure on nursing homes is likely to be coding errors. Most of this expenditure is in fact for other health institutions. The Commonwealth Government, on the other hand, spent some $7 million (1990 prices) on NDCs in 1975-76 and about a million dollars on equipment in 1987.

30
Figure VI.6: Nursing homes GFCE (NDC)
Other health
The states and commonwealth governments had spent on both NDCs and equipment (Figures VI.7 and VI.B). Summing all states, GFCE on NDCs grew by an annual average of 24 per cent from 1970 to 1996. The expenditure of the Commonwealth government peaked in the middle of the 70s and since then has been declining and has been nil in the last couple of years. GFCE on equipment for all states followed the trend in NDCs. They also peaked in the late 70s, declined in the 80s and then caught up again in the 90s to reach a new high in 1995.

31
Figure VI.7: Other health GFCE (NDC)
Figure VI.8: Other health GFCE (Equipment)
Welfare services
The Commonwealth government made a substantial contribution to the welfare services sector's GFCE on both non-dwelling construction and equipment (Figures VI.9 and VI.10). Its expenditures on NDC has grown by an annual average rate of 22 per cent from 1975 to 1996. The states, on the other hand, spent on NDCs at an annual average growth rate of 25 per cent during the same period. But individually, the state governments' GFCE on NDC had been much smaller than the Commonwealth's and had fluctuated quite frequently from the 1962 to 1996.
Figure VI.9: Welfare GFCE (NDC)
Figure VI.l0: Welfare GFCE (equipment)
Private GFCE The following describes the trend in GFCE in the private sector. As mentioned in 11.1, it has not been possible to disaggregate non-dwelling construction into Health and Welfare segments. Thus this section describes the trends in private sector GFCE on equipment only. Breakdown by state was also not available. Table VI.4 shows the real growth rate of private sector GFCE on equipment by industry segments. Health Insurance and Welfare lead in terms of annual growth in the last decade. (The computerisation of these segments may explain the rapid spending on equipment). Figure VI.10 shows the GFCE on equipment at current prices. Expenditures on equipment by pharmaceutical manufacturing and medical services have been the largest among the sectors. Private sector equipment expenditures peaked in 1994 largely because of expenditures in these two sectors.
Table VI.4: Private sector GFCE (equipment) average annual real growth rates
Industry segment Period Average growth (%)
Hospitals 1978-1996 25.0
Nursing homes 1983-1996 29.8

32
Medical services 1972-1998 20.6
Other health 1979-1996 31.5
Welfare 1987-1996 100.2
Pharmaceutical manufacturing 1973-1996 21.2
Surgical manufacturing 1978-1996 18.2
Pharmaceutical retailing 1977-1996 28.1
Health insurance 1988-1996 307.5
Figure VI.11: Private sector GFCE (equipment) in current prices
Depreciation Tables VI.5 and VI.6 show the constant price value of the consumption of fixed capital (economic depreciation) for non-dwe11ing construction and equipment, respectively for the public sector.
Figure VI.12 shows the trend for the sum of all states by type of capital expenditure. Depreciation of non-dwelling construction follows a smooth upward trend. It is growing at an annual average of 7.4 per cent Depreciation of equipment, on the other hand, is growing at an annual average of 5.1 per cent it peaked in the 80s because of the large estimated capital stocks around that decade.
Constant price depreciation values, by states, are shown in Figures VI.13 and VI.14.

33
Table VI.5: Public sector consumption of fixed capital (depreciation), non-dwelling construction at constant 1989-90 prices ($ million)

34
Table VI.6: Public sector consumption of fixed capital (depreciation), equipment at constant 1989-90 prices ($ million)
Figure VI.12: Depreciation, all states

35
Figure VI.13: Depreciation of NDCs
Figure VI.l4: Depreciation of equipment

36
Appendix VII: Figures and tables of public sector gross fixed capital expenditures (GFCE), for health and welfare sectors, by type, State and industry segment, current and constant 1989-90 prices, 1962-1996
Figure VII.1 Hospitals: Estimates of GFCE Non-dwelling Construction by state (current price $ million)..............................................................................................................................................39
Figure VII.2: Mental Health Institutions: Estimates of GFCE Non-dwelling Construction by state (current price $ million)..................................................................................................................40
Figure Vll.3: Nursing Homes: Estimates of GFCE Non-dwelling Construction by state (current price $ million)..............................................................................................................................................41
Figure VII.4: Other Health: Estimates of GFCE Non-dwelling Construction by state (current price $ million)..............................................................................................................................................42
Figure Vll.5: Welfare: Estimates of GFCE Non-dwelling Construction by state (current price $ million)43
Figure VII.6: All Industry Segments Estimates of GFCE Non-dwelling Construction by state (current price $ million) .................................................................................................................................44
Figure Vll.7: Hospitals: Estimates of GFCE Non-dwelling Construction by state (constant price $ million)..............................................................................................................................................46
Figure VII.8: Mental Health Institutions: Estimates of GFCE Non-dwelling Construction by state (constant price $ million)................................................................................................................47
Figure VII.9: Nursing Homes Estimates of GFCE Non-dwelling Construction by state (constant price $ million)..............................................................................................................................................48
Figure VII.10: Other Health: Estimates of GFCE Non-dwelling Construction by state (constant price $ million)..............................................................................................................................................49
Figure VII.11: Welfare Estimates of GFCE Non-dwelling Construction by state (constant price $ million)..............................................................................................................................................50
Figure VII.12: All Industry Segments: Estimates of GFCE Non-dwelling Construction by state (constant price $ million)................................................................................................................51
Figure VII.13: Hospitals: Estimates of GFCE Equipment by state (current price $ million) .....................53
Figure VII.14: Mental Health Institutions Estimates of GFCE Equipment by state (current price $ million)..............................................................................................................................................54
Figure VII.15: Nursing Homes: Estimates of GFCE Equipment by state (current price $ million)..........55
Figure VII.16: Other Health: Estimates of GFCE Equipment by state (current price $ million)...............56
Figure VII.17: Welfare: Estimates of GFCE Equipment by state (current price $ million) ........................57
Figure VII.18: All Industry Segments: Estimates of GFCE Equipment by state (current price $ million)58
Figure VII.19: Hospitals Estimates of GFCE Equipment by state (constant price $ million)....................60
Figure VII.20: Mental Health Institutions: Estimates of GFCE Equipment by state (constant price $ million)..............................................................................................................................................61

37
Figure VII.21: Nursing Homes: Estimates of GFCE Equipment by state (constant price $ million)........62
Figure VII.22: Other Health: Estimates of GFCE Equipment by state (constant price $ million).............63
Figure VII.23: Welfare: Estimates of GFCE Equipment by state (constant price $ million)......................64
Figure VII.24: An Industry Segments: Estimates of GFCE Equipment by state (constant price $ million)65
Table VII.1: Estimates of Public Gross Fixed Capital Expenditure by type, state and Industry segment ($m at current and constant prices)...............................................................................................67
Table VII.2: Estimates of Public Gross Fixed Capital Expenditure, by type, state and Industry segment ($m at current and constant prices)...............................................................................................68
Table VII.3: Estimates of Public Gross Fixed Capital Expenditure. by type, state, and industry segment ($m at current and constant prices)...............................................................................................69
Table VII.4: Estimates of Public Gross Fixed Capital expenditure, by type, state, and Industry segment ($m at current and constant prices)...............................................................................................70
Table VII.5: Estimates of Public Gross Fixed Capital Expenditure, by type, state, and Industry segment ($m at current and constant prices)...............................................................................................71
Table VII.6: Estimates of Public Gross Fixed Capital Expenditure, by type, state, and Industry segment ($m at current and constant prices)...............................................................................................72
Table VII.7: Estimates of Public Gross Fixed Capital Expenditure by type, state, and Industry segment ($m at current and constant prices)...............................................................................................74
Table VII.8: Estimates of Public Gross Fixed Capital Expenditure, by type, state, and Industry segment ($m at current and constant prices)...............................................................................................75
Table VII.9: Estimates of Public Gross Fixed Capital Expenditure, by type, state, and Industry segment ($m at current and constant prices)...............................................................................................76
Table VII.10: Estimates of Public Gross Fixed Capital Expenditure by type, state, and Industry segment ($m at current and constant prices)...............................................................................77
Table VII.11: Estimates of Public Gross Fixed Capital Expenditure, by type, state, and Industry segment ($m at current and constant prices)...............................................................................78
Table VII.12: Estimates of Public Gross Fixed Capital Expenditure, by type, state, and Industry segment ($m at current and constant prices)...............................................................................79

VII.1 Estimates of public sector GFCE non-dwelling construction by State and by area of health and welfare expenditure in current prices ($ million)
38

Figure VII.1 Hospitals: Estimates of GFCE Non-dwelling Construction by state (current price $ million)
39

Figure VII.2: Mental Health Institutions: Estimates of GFCE Non-dwelling Construction by state (current price $ million)
40

Figure Vll.3: Nursing Homes: Estimates of GFCE Non-dwelling Construction by state (current price $ million)
41

Figure VII.4: Other Health: Estimates of GFCE Non-dwelling Construction by state (current price $ million)
42

Figure Vll.5: Welfare: Estimates of GFCE Non-dwelling Construction by state (current price $ million)
43

Figure VII.6: All Industry Segments Estimates of GFCE Non-dwelling Construction by state (current price $ million)
44

VII.2 Estimates of public sector GFCE non-dwelling construction by State and by area of health and welfare expenditure in constant 1989-90 prices ($ million)
45

Figure Vll.7: Hospitals: Estimates of GFCE Non-dwelling Construction by state (constant price $ million)
46

Figure VII.8: Mental Health Institutions: Estimates of GFCE Non-dwelling Construction by state (constant price $ million)
47

Figure VII.9: Nursing Homes Estimates of GFCE Non-dwelling Construction by state (constant price $ million)
48

Figure VII.10: Other Health: Estimates of GFCE Non-dwelling Construction by state (constant price $ million)
49

Figure VII.11: Welfare Estimates of GFCE Non-dwelling Construction by state (constant price $ million)
50

Figure VII.12: All Industry Segments: Estimates of GFCE Non-dwelling Construction by state (constant price $ million)
51

VII.3 Estimates of public sector GFCE equipment by State and by area of health and welfare expenditure in current prices ($ million)
52
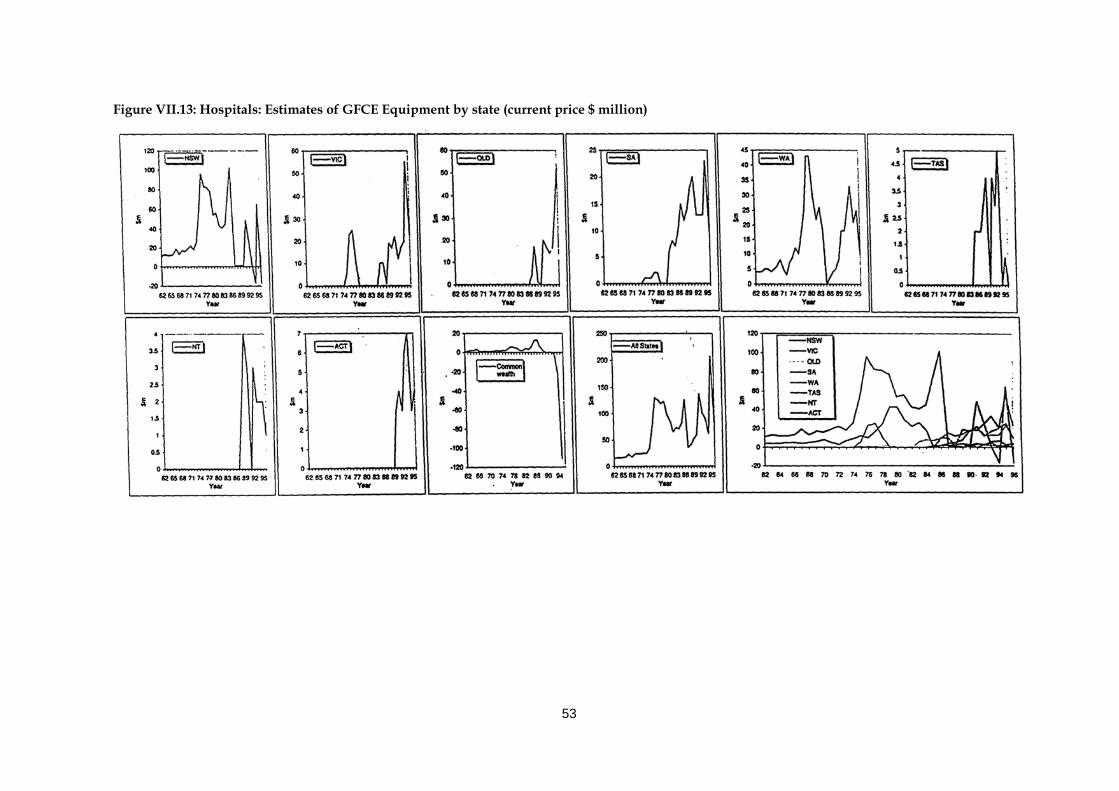
Figure VII.13: Hospitals: Estimates of GFCE Equipment by state (current price $ million)
53

Figure VII.14: Mental Health Institutions Estimates of GFCE Equipment by state (current price $ million)
54

Figure VII.15: Nursing Homes: Estimates of GFCE Equipment by state (current price $ million)
55

Figure VII.16: Other Health: Estimates of GFCE Equipment by state (current price $ million)
56

Figure VII.17: Welfare: Estimates of GFCE Equipment by state (current price $ million)
57

58
Figure VII.18: All Industry Segments: Estimates of GFCE Equipment by state (current price $ million)

VII.4 Estimates of public sector GFCE equipment by State and by area of health and welfare expenditure in constant 1989-90 prices ($ million)
59

Figure VII.19: Hospitals Estimates of GFCE Equipment by state (constant price $ million)
60

Figure VII.20: Mental Health Institutions: Estimates of GFCE Equipment by state (constant price $ million)
61
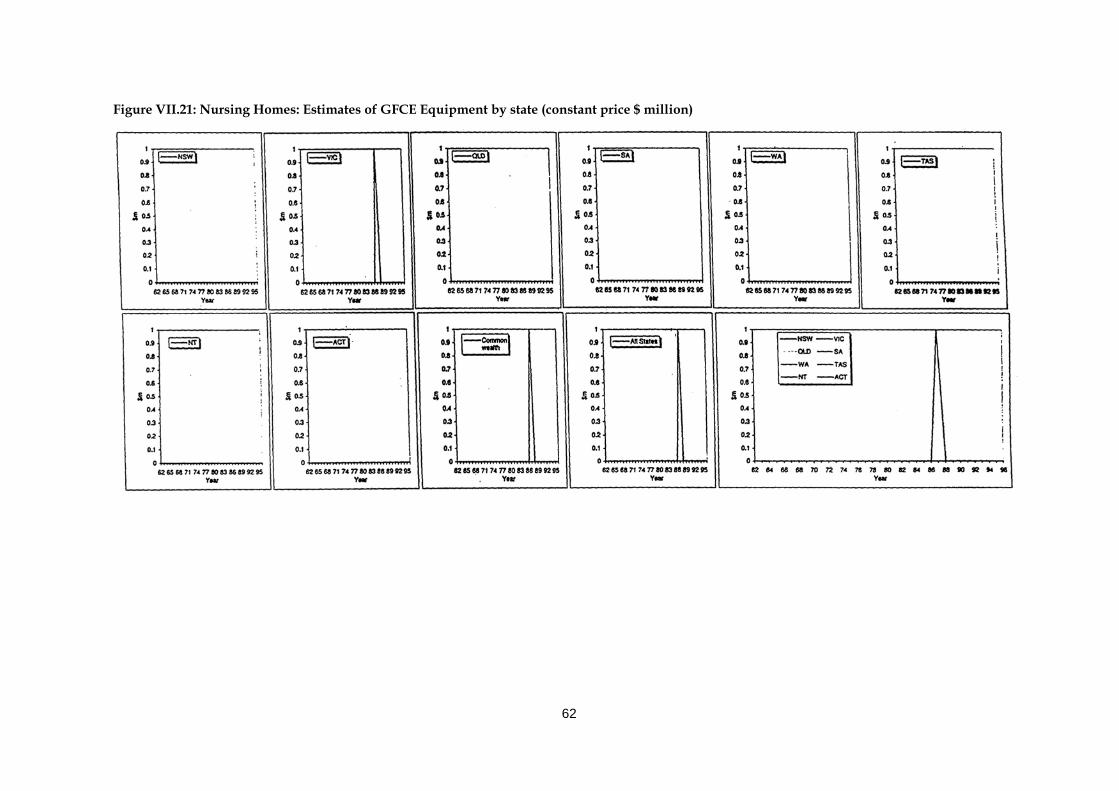
Figure VII.21: Nursing Homes: Estimates of GFCE Equipment by state (constant price $ million)
62

Figure VII.22: Other Health: Estimates of GFCE Equipment by state (constant price $ million)
63

Figure VII.23: Welfare: Estimates of GFCE Equipment by state (constant price $ million)
64
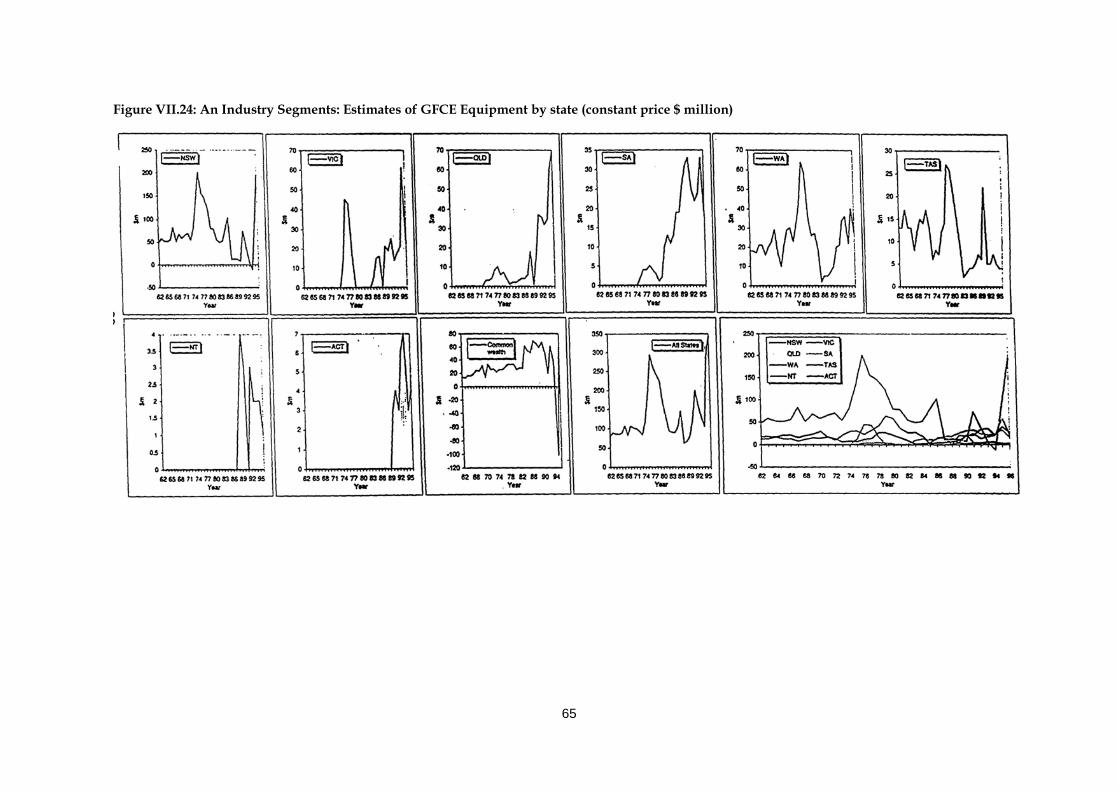
65
Figure VII.24: An Industry Segments: Estimates of GFCE Equipment by state (constant price $ million)

VII.5 Estimates of public sector GFCE by area of expenditure, State, and industry segment in current prices ($ million)
66

Table VII.1: Estimates of Public Gross Fixed Capital Expenditure by type, state and Industry segment ($m at current and constant prices)
67

Table VII.2: Estimates of Public Gross Fixed Capital Expenditure, by type, state and Industry segment ($m at current and constant prices)
68

Table VII.3: Estimates of Public Gross Fixed Capital Expenditure. by type, state, and industry segment ($m at current and constant prices)
69

Table VII.4: Estimates of Public Gross Fixed Capital expenditure, by type, state, and Industry segment ($m at current and constant prices)
70

Table VII.5: Estimates of Public Gross Fixed Capital Expenditure, by type, state, and Industry segment ($m at current and constant prices)
71

Table VII.6: Estimates of Public Gross Fixed Capital Expenditure, by type, state, and Industry segment ($m at current and constant prices)
72

VII.6 Estimates of public sector GFCE by area of expenditure, State, and industry segment in constant 1989-90 prices ($ million)
73

Table VII.7: Estimates of Public Gross Fixed Capital Expenditure by type, state, and Industry segment ($m at current and constant prices)
74

Table VII.8: Estimates of Public Gross Fixed Capital Expenditure, by type, state, and Industry segment ($m at current and constant prices)
75

Table VII.9: Estimates of Public Gross Fixed Capital Expenditure, by type, state, and Industry segment ($m at current and constant prices)
76

Table VII.10: Estimates of Public Gross Fixed Capital Expenditure by type, state, and Industry segment ($m at current and constant prices)
77

Table VII.11: Estimates of Public Gross Fixed Capital Expenditure, by type, state, and Industry segment ($m at current and constant prices)
78

79
Table VII.12: Estimates of Public Gross Fixed Capital Expenditure, by type, state, and Industry segment ($m at current and constant prices)

80
Bibliography
Australian Bureau of Statistics (ABS) various years. Australian national accounts: capital stock. Cat. No. 5221.0. Canberra: AGPS.
Australian Bureau of Statistics (ABS) various years. Australian national accounts: capital stock Cat. No. 5204.0. Canberra: AGPS.
Australian Bureau of Statistics (ABS) various years. Australian national accounts: concepts, sources and methods Cat. No. 5216.0. Canberra: AGPS.
Australian Bureau of Statistics (ABS) various years. Building activity, Australia Cat. No. 8752.0. Canberra: AGPS.
Australian Bureau of Statistics (ABS) various years. Award rates of pay indexes, Australia Cat. No. 6312.0. Canberra: AGPS. (Discontinued)
Australian Bureau of Statistics (ABS) various years. Price indexes of articles used in manufacturing industries, Australia. Cat No. 6411.0. Canberra: AGPS.
Australian Bureau of Statistics (ABS) various years. Price indexes of articles produced by manufacturing industries, Australia. Cat No. 6412.0. Canberra: AGPS.
Australian Bureau of Statistics (ABS) 1998. Standard economic sector classifications of Australia (SESCA). Cat. No. 1218.0. Canberra: AGPS.
Australian Bureau of Statistics (ABS) 1999. Australian system of national accounts 1997-98. Cat. No. 5204.0. Canberra: AGPS.
Bailey, C. 1981. Current cost and constant cost depreciation and net capital stock, ABS Occasional Paper 1981/1.
Butlin, N. G. 1962. Australian domestic product, investment and foreign borrowing, 1861 -1938/39, Cambridge.
Haig, B. D. 1980. Capital stock in Australian manufacturing, Department of Economics, Research School of Social Sciences, Australian National University, Canberra.
Inter-Secretariat Working Group on National Accounts, 1993. System of national accounts 1993, Geneva.
Keating, M. 1967. The growth and composition of the Australian workforce 1910-11 to 1960-61, Thesis submitted to the Australian National University, Canberra.
Walters, R. and R. Dippelsman 1985. Estimates of depreciation and capital stock, Australia ABS Occasional Paper 1985/3.
Winfrey, R. 1938. Statistical analysis of industrial property retirements, Iowa State College of Agricultural and Mechanic Arts.