measuring and specifying pavement smoothnesstech brief measuring and specif ying pavement smoothness...
TRANSCRIPT
Tech Brief
MEASURING AND SPECIFYING PAVEMENT SMOOTHNESS
JUNE 2016 FHWA-HIF-16-032
INTRODUCTION Smoothness is a measure of the level of comfort experienced by the traveling public while riding over a pavement surface. As an important indicator of pavement performance, smoothness is used interchangeably with roughness as an expression of the deviation of a surface from a true planar surface (as defined by ASTM E867) and is often cited as the most important indicator of user satisfaction. However, smoothness also imparts a number of other benefits, including improved pavement performance and service life, improved safety, and reduced fuel and vehicle maintenance cost (Smith et al. 1997; FHWA 2006; Chatti and Zaabar 2012; Van Dam et al. 2015). In recognition of the importance of pavement smoothness, many highway agencies employ specifications to control initial pavement smoothness during construction and then monitor it over time as an indicator of performance and as a trigger for maintenance or rehabilitation. The purpose of this Tech Brief is to describe the tools and techniques used to measure and express pavement smoothness.
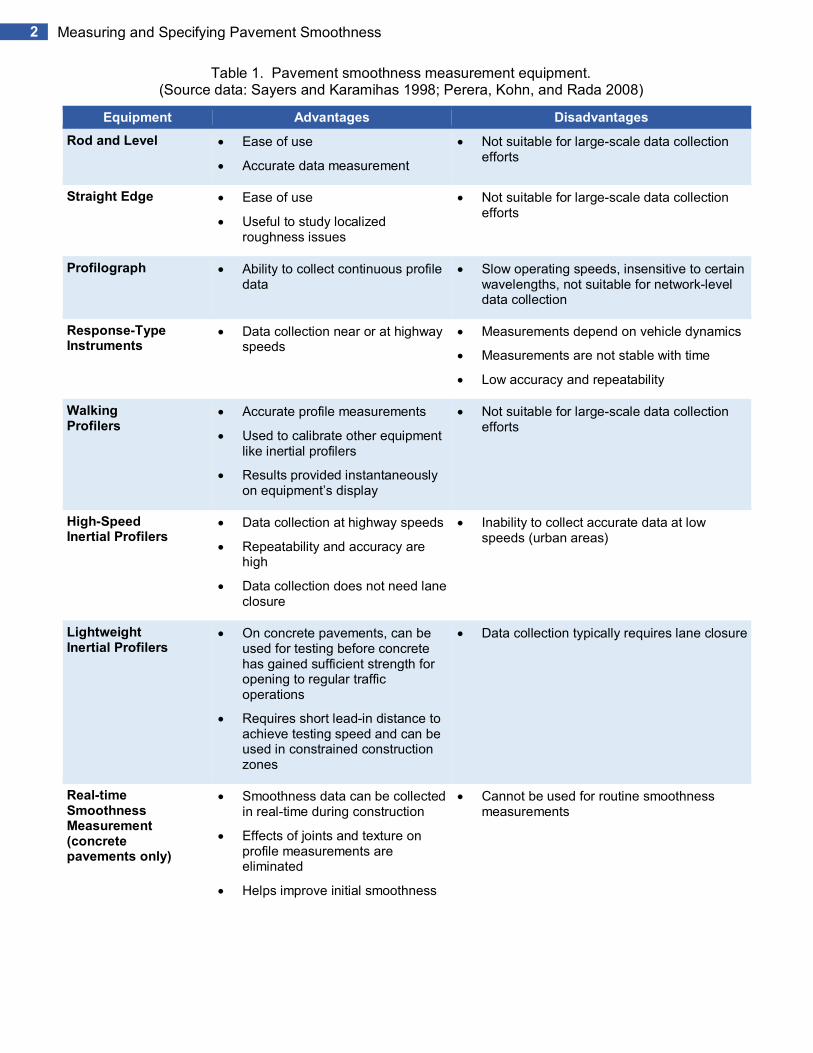
EQUIPMENT FOR MEASURING PAVEMENT SMOOTHNESS A number of different devices have been used over the years for measuring pavement smoothness, from simple straightedges that indicate localized deviations in the surface to inertial profilers equipped with laser sensors that record actual elevation measurements along the pavement. Table 1 provides a listing of the primary types of smoothness-measuring devices, including a summary of their respective advantages and disadvantages.
For monitoring of initial smoothness on new pavement construction, the profilograph has a long history of service, but the use of lightweight inertial profilers has become increasingly common in the last two decades. The latter is particularly attractive because it is compatible with the high-speed profiling devices that highway agencies use to monitor pavement smoothness at the network-level, thereby promoting the use of a single technology for measuring smoothness of a pavement structure from cradle to grave. A more detailed description of these two pavement smoothness measuring devices is provided in the following sections.
Profilographs Profilographs were widely implemented by State Highway Agencies in the 1980s/1990s exclusively for measuring and controlling initial pavement smoothness. Profilographs are low-speed profile measurement systems (2 to 5 mi/hr [3 to 8 km/hr]) that consist of a rigid frame, a center profiling wheel, and a system of support wheels to provide a datum. Originally, profilographs mechanically recorded data on a strip chart recorder that was linked to the profile wheel, but today most profilographs are computerized and record data electronically.
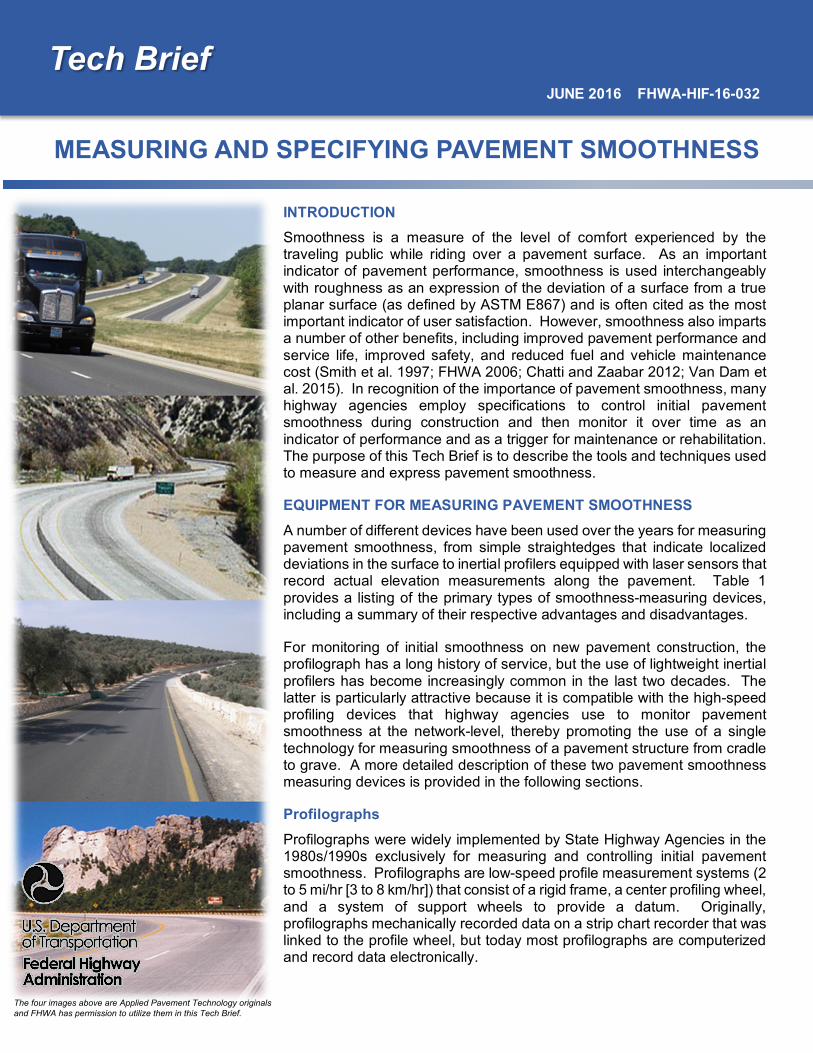
The four images above are Applied Pavement Technology originals and FHWA has permission to utilize them in this Tech Brief.
2 Measuring and Specifying Pavement Smoothness
Table 1. Pavement smoothness measurement equipment. (Source data: Sayers and Karamihas 1998; Perera, Kohn, and Rada 2008)
Equipment Advantages Disadvantages Rod and Level • Ease of use
• Accurate data measurement
• Not suitable for large-scale data collectionefforts
Straight Edge • Ease of use
• Useful to study localizedroughness issues
• Not suitable for large-scale data collectionefforts
Profilograph • Ability to collect continuous profiledata
• Slow operating speeds, insensitive to certainwavelengths, not suitable for network-leveldata collection
Response-Type Instruments
• Data collection near or at highwayspeeds
• Measurements depend on vehicle dynamics
• Measurements are not stable with time
• Low accuracy and repeatability
Walking Profilers
• Accurate profile measurements
• Used to calibrate other equipmentlike inertial profilers
• Results provided instantaneouslyon equipment’s display
• Not suitable for large-scale data collectionefforts
High-Speed Inertial Profilers
• Data collection at highway speeds
• Repeatability and accuracy arehigh
• Data collection does not need laneclosure
• Inability to collect accurate data at lowspeeds (urban areas)
Lightweight Inertial Profilers
• On concrete pavements, can beused for testing before concretehas gained sufficient strength foropening to regular trafficoperations
• Requires short lead-in distance toachieve testing speed and can beused in constrained constructionzones
• Data collection typically requires lane closure
Real-time Smoothness Measurement (concrete pavements only)
• Smoothness data can be collectedin real-time during construction
• Effects of joints and texture onprofile measurements areeliminated
• Helps improve initial smoothness
• Cannot be used for routine smoothnessmeasurements
3 Measuring and Specifying Pavement Smoothness
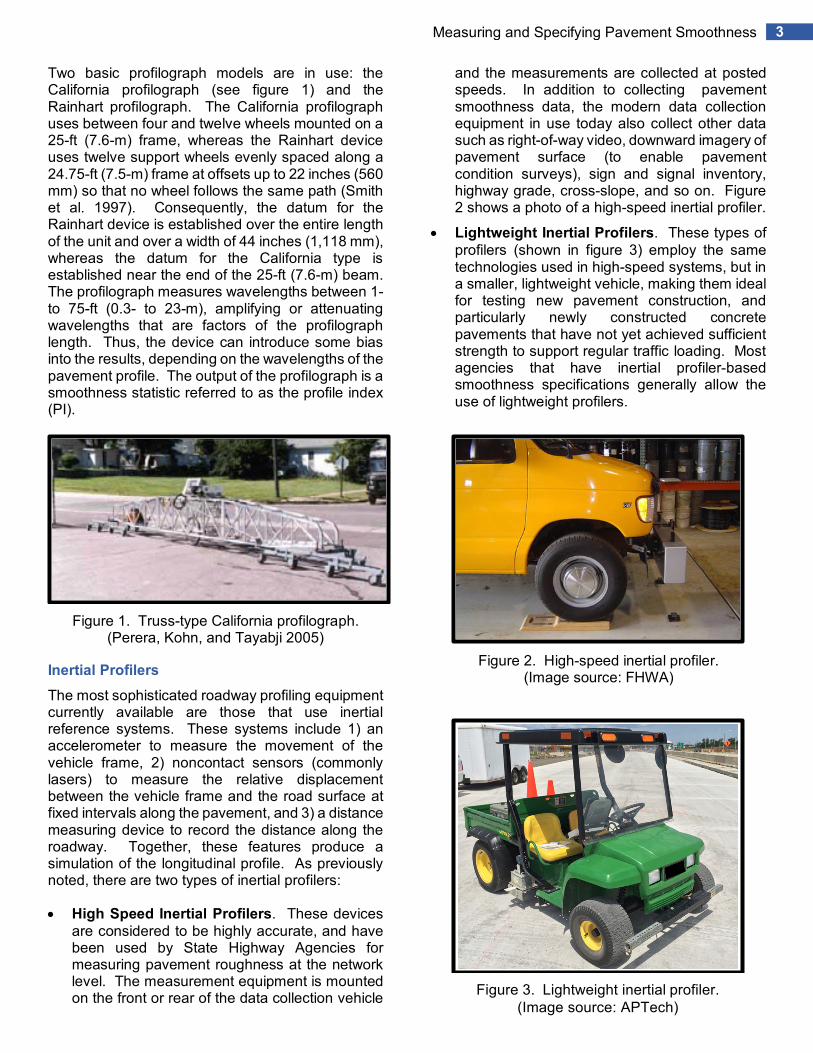
Two basic profilograph models are in use: the California profilograph (see figure 1) and the Rainhart profilograph. The California profilograph uses between four and twelve wheels mounted on a 25-ft (7.6-m) frame, whereas the Rainhart device uses twelve support wheels evenly spaced along a 24.75-ft (7.5-m) frame at offsets up to 22 inches (560 mm) so that no wheel follows the same path (Smith et al. 1997). Consequently, the datum for the Rainhart device is established over the entire length of the unit and over a width of 44 inches (1,118 mm), whereas the datum for the California type is established near the end of the 25-ft (7.6-m) beam. The profilograph measures wavelengths between 1- to 75-ft (0.3- to 23-m), amplifying or attenuating wavelengths that are factors of the profilograph length. Thus, the device can introduce some bias into the results, depending on the wavelengths of the pavement profile. The output of the profilograph is a smoothness statistic referred to as the profile index (PI).
Figure 1. Truss-type California profilograph. (Perera, Kohn, and Tayabji 2005)
Inertial Profilers The most sophisticated roadway profiling equipment currently available are those that use inertial reference systems. These systems include 1) an accelerometer to measure the movement of the vehicle frame, 2) noncontact sensors (commonly lasers) to measure the relative displacement between the vehicle frame and the road surface at fixed intervals along the pavement, and 3) a distance measuring device to record the distance along the roadway. Together, these features produce a simulation of the longitudinal profile. As previously noted, there are two types of inertial profilers:
• High Speed Inertial Profilers. These devicesare considered to be highly accurate, and havebeen used by State Highway Agencies formeasuring pavement roughness at the networklevel. The measurement equipment is mountedon the front or rear of the data collection vehicle
and the measurements are collected at posted speeds. In addition to collecting pavement smoothness data, the modern data collection equipment in use today also collect other data such as right-of-way video, downward imagery of pavement surface (to enable pavement condition surveys), sign and signal inventory, highway grade, cross-slope, and so on. Figure 2 shows a photo of a high-speed inertial profiler.
• Lightweight Inertial Profilers. These types ofprofilers (shown in figure 3) employ the sametechnologies used in high-speed systems, but ina smaller, lightweight vehicle, making them idealfor testing new pavement construction, andparticularly newly constructed concretepavements that have not yet achieved sufficientstrength to support regular traffic loading. Mostagencies that have inertial profiler-basedsmoothness specifications generally allow theuse of lightweight profilers.
Figure 2. High-speed inertial profiler. (Image source: FHWA)
Figure 3. Lightweight inertial profiler. (Image source: APTech)
4 Measuring and Specifying Pavement Smoothness
The inertial profiling systems produce a relatively accurate and repeatable simulation of the pavement profile, which can then be analyzed to produce various smoothness statistics, including the PI or the International Roughness Index, IRI. The use of laser-based systems has led to an issue related to pavement texture. Specifically, the use of small footprint lasers (point lasers) can result in artificially high roughness measurements on concrete pavements due to the texture of the surface created through longitudinally tining or grooving. Because of this, a line laser that is more representative of a tire footprint is recommended when measuring smoothness on textured concrete surfaces (ACPA 2003; ACPA 2013).
Real-Time Smoothness Measurements (Concrete Pavements Only) A new and emerging technology is the measurement of concrete pavement smoothness immediately behind the paver. This addresses one concern associated with conventional concrete pavement profile measurements, in that the identification of smoothness-related issues are not obtained until after construction, and more substantial corrective actions may then be required over a significant portion of pavement. These profiling systems employ non-contact sensors used in a stand-alone set-up (top photo of figure 4) or attached to the paver (bottom photo of figure 4) to provide real-time measurements directly behind the paving machine (Rasmussen et al. 2013; Van Dam et al. 2015).
EXPRESSING PAVEMENT SMOOTHNESS Several metrics are available to indicate or report pavement smoothness, and the most commonly used expressions are discussed in this section.
Pavement Serviceability Rating (PSR) Pavement smoothness has been reported using subjective rating methods. In the large-scale road test conducted by the American Association of State Highway Officials (AASHO) in the late 1950s, a subjective 0 to 5 rating scale (0 being Very Poor and 5 Being Very Good) was used to express the condition of the pavement in terms of the ride quality. This AASHO rating system was called the “present serviceability rating” (PSR). The “present serviceability index” (PSI), which uses the same 0 to 5 scale, was developed through statistical analyses to predict PSR as a function of pavement condition data. Although PSR and PSI are falling out of use, some agencies still make correlations between
smoothness statistics and PSI values, and PSI is the basis for the AASHTO 1986/1993 pavement design procedure.
Figure 4. Real-time smoothness measurement equipment for concrete pavements. (Image source: GOMACO, AMES)
Profile Index The Profile Index (PI) is a commonly used smoothness statistic for pavements. Traditionally based on the results of the profilograph, it can also be computed from the profile trace produced by inertial profilers using tools such as ProVAL (Transtec 2015), which is software that allows users to view and analyze pavement profile data. The PI is most commonly used for quality control of the initial smoothness of new pavement construction.
5 Measuring and Specifying Pavement Smoothness
The key steps in determining the PI are summarized below. Additional details are provided in California Test Method 526 (Caltrans 2012).
• Outline Trace. This is a process of drawing anew profile line through the mid-point of thespikes of the field trace to reduce the variabilityand expedite the tracing process. The primarypurpose of outlining the trace is to average outthe spikes and minor deviations due to debris,dirt, rocks, and pavement surface texture.
• Position Blanking Band. The second step is toplace the “blanking band” over the profilemeasurements to eliminate the consideration ofminor elevation deviations in determining the PI.Traditionally, a 0.2-inch (5 mm) width blankingband was used, but many agencies moved to a0-inch blanking band in an effort to captureadditional profile deviations that might becontributing to roughness.
• Compute Profile Index. The heights of thescallops (deviations or excursions from thereference line) above and below the blankingband are measured and aggregated. Thesummation of the heights within a given segmentrepresents the PI for that segment. Themeasurement units are inches/mi or mm/km.
PI values indicating acceptably smooth pavements vary by agency, and also depend on the blanking band setting and the facility type. For a 0.2-inch (5 mm) blanking band on a highway pavement, acceptable PI values are commonly in the range of 7 to 10 inches/mi (110 to 158 mm/km), while for a 0-inch blanking band on a highway pavement, acceptable PI values are often in the range of 20 to 45 inches/mi (316 to 710 mm/km). The relevancy of the PI is limited by the frequency response of the profilograph and, as previously mentioned, may yield biased results depending on the wavelengths present in the pavement.
International Roughness Index Since its development in the 1980s, the IRI has become the standard for expressing pavement smoothness. The IRI can be computed using profile measurements obtained from devices such as the inertial profiler, Dipstick®, and rod and level. AASHTO standard R 43M/R 43-07, Standard Practice for Quantifying Roughness of Pavements and the ASTM standard E1926, Standard Practice for Computing International Roughness Index of Roads from Longitudinal Profile Measurements provide standardized methods to compute the IRI.
The IRI is computed using a mathematical model known as the “quarter-car model,” which represents the way a single tire system (a quarter of a car) is affected by the profile of the pavement. The quarter-car model includes one tire represented by a vertical spring, the axle mass supported by the tire, a suspension spring and damper, and the body mass of the vehicle supported by the suspension for that tire. The response of this system is simulated over the profile of the pavement, and the summation of the absolute values of the suspension motions obtained from the simulation divided by the simulation length gives the average suspension motion over the simulated length, which is the IRI.
As with the PI, the acceptable IRI values for new pavement construction varies by agency as well as the type of facility and equipment used to collect the smoothness data. For new asphalt highway pavements, typical acceptable IRI values range from 52 to 66 inches/mi (810 to 1030 mm/km). For new concrete highway pavements, typical acceptable IRI values range from 57 to 72 inches/mi (890 to 1130 mm/km) (Merritt, Chang, and Rutledge 2015); however, the Minnesota DOT has specified initial IRI values of 50 inches/mile (781 mm/km) for their concrete pavements since 2012 (MnDOT 2015).
The primary advantages of using IRI are (Sayers and Karamihas 1998; FHWA 2014):
• Time-stable, reproducible mathematical processing of a measured pavement profile.
• Broadly representative of the effects ofroughness on vehicle response and user’sperception over the range of wavelengths ofinterest, and therefore relevant to the definitionof roughness.
• Compatible with profile measuring equipmentavailable in the U.S.
• Independent of section length and amenable tosimple averaging.
• Consistent with established internationalstandards and correlates well with otherroughness measures.
Mean Ride Index (MRI) and Half Car Ride Index (HRI) Two smoothness statistics based on IRI measurements are used by some agencies: the Mean Ride Index (MRI) and the Half-car Ride Index (HRI). Strictly speaking, the IRI is reflective of a single profile measured in one of the wheelpaths (often the right wheelpath) of a pavement. However,
6 Measuring and Specifying Pavement Smoothness
some agencies collect IRI values in both the left and right wheelpaths and then average the results, which is reported as the MRI.
The HRI, on the other hand, is a model used to compute the average of two profiles (left and right wheelpaths). The response of the half-car model is computed using the same fundamental equations used in the quarter-car model. The average profiles from both wheelpaths is used as the input for the quarter-car model to compute the HRI, as opposed to the profile from each individual wheelpath. The primary disadvantage of the half-car model is that the profile measurements from the left and right wheelpaths have to be perfectly synchronized to obtain accurate results. However, for profilers measuring the profiles in both wheelpaths simultaneously, this is typically not an issue (Sayers and Karamihas 1998). The HRI generally results in values that are lower than those reported for the IRI or MRI.
Index Relationships Several studies investigating the relationships between MRI, HRI, and IRI have been conducted (Sayers 1989; Smith, Titus-Glover, and Evans 2002; Gagarin, Mekemson, and Nemmers 2006; Karamihas and Senn 2012), and show that some approximate statistical correlations can be developed between various smoothness indices such as the PI, IRI, MRI, and HRI. These correlations are typically specific for each study that has been conducted and they depend on factors such as pavement type, equipment characteristics, filtering methods, and statistical approaches used. While these correlations can be used to obtain a rough idea of the relationships between various smoothness indices, none of them should be used for developing specifications or formal reporting purposes.
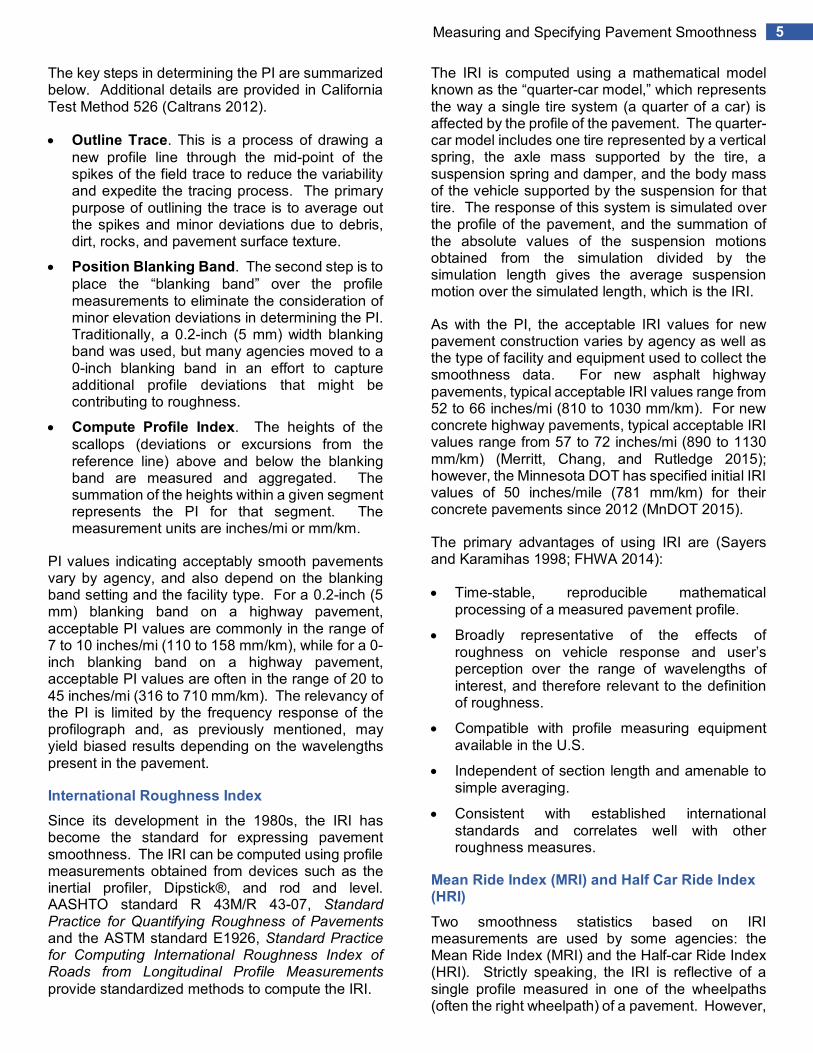
SMOOTHNESS SPECIFICATIONS Smoothness specifications are used to control initial pavement smoothness and encourage the construction of quality pavements. Based on a 2014 survey, summaries of the smoothness specifications for new asphalt and concrete pavement construction or reconstruction (not overlays) by state are shown in figures 5(a) and 5(b), respectively.
Figure 5. Smoothness specifications for (a) asphalt and (b) concrete pavements in the U.S.
(Merritt, Chang, and Rutledge 2015).
For asphalt pavements, the results indicate that 39 states (78 percent) are using the IRI, 9 states are using the PI, and the remaining 2 states are using the Ride Number (RN). For concrete pavements, the results show that 23 states (46 percent) are using the IRI, 21 states (42 percent) are using the PI, and the remaining 6 states do not have concrete pavement smoothness specifications. (Merritt, Chang, and Rutledge 2015).
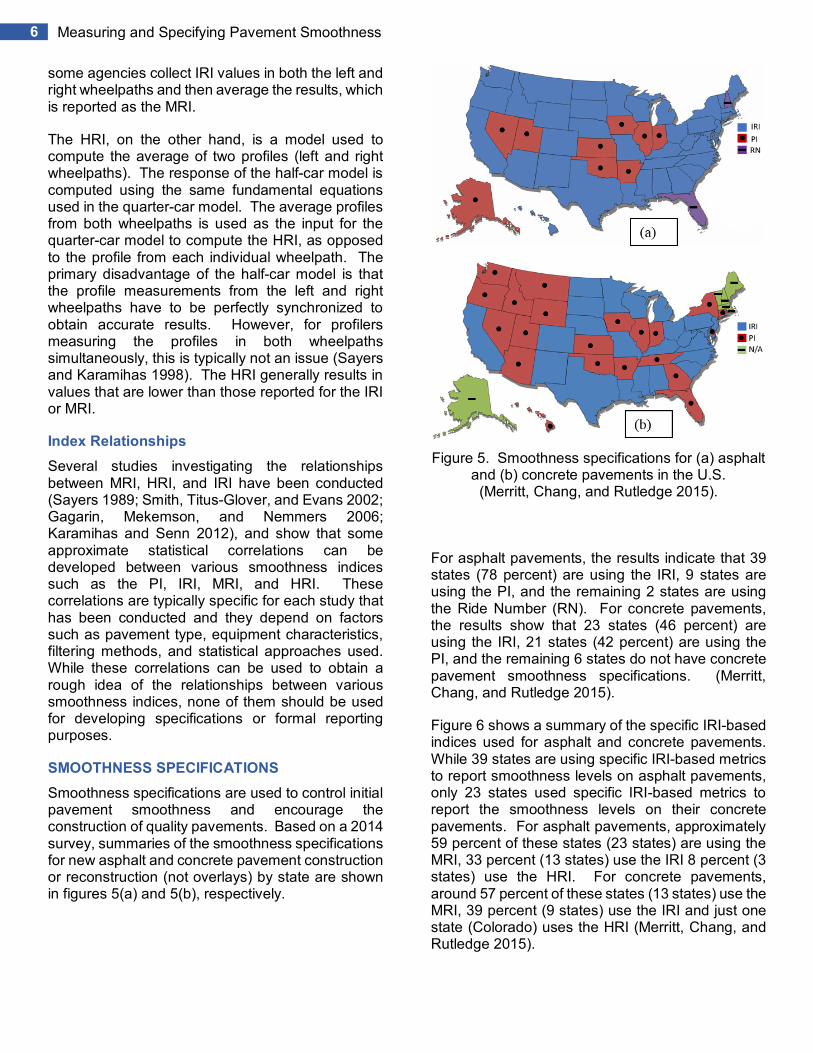
Figure 6 shows a summary of the specific IRI-based indices used for asphalt and concrete pavements. While 39 states are using specific IRI-based metrics to report smoothness levels on asphalt pavements, only 23 states used specific IRI-based metrics to report the smoothness levels on their concrete pavements. For asphalt pavements, approximately 59 percent of these states (23 states) are using the MRI, 33 percent (13 states) use the IRI 8 percent (3 states) use the HRI. For concrete pavements, around 57 percent of these states (13 states) use the MRI, 39 percent (9 states) use the IRI and just one state (Colorado) uses the HRI (Merritt, Chang, and Rutledge 2015).
7 Measuring and Specifying Pavement Smoothness
Figure 6. Specific IRI-based indices used for (a) asphalt and (b) concrete pavements in the U.S.
(Merritt, Chang, and Rutledge 2015).
Initial Smoothness Specification Provisions Smoothness specifications for new pavement construction commonly include the following provisions:
• Equipment. The type of equipment to be usedfor smoothness measurement is typicallyspecified by the agency. Most agencies specifythe use of inertial profilers, along withrequirements on type of laser sensors andrecording interval to be used to data collection.The testing equipment typically undergoes anannual certification process and the equipmentoperator is required to be trained and certified bythe agency prior to testing. The test equipmenttypically undergoes a verification process a fewdays prior to the actual testing. A control sectionthat has similar texture and roughness to theproject specification is established and used forthe verification process in accordance with theAASHTO R 57-10 standard and other agencyand manufacturer standards.
• Testing and Analysis Procedures. The lanesand wheelpaths to be tested and the exceptionsfor testing (such as turn lanes, bridgeapproaches, intersections, auxiliary lanes, etc.)are specified. Requirements for quality control(QC) testing by the contractor (such as long- and
short-interval roughness testing along with data filtering requirements) are also specified. For concrete pavements, testing during different times of the day to evaluate diurnal changes in profile measurements may be specified in some cases. Quality assurance (QA) test requirements (which is typically conducted by the agency or an independent tester and includes test procedures, threshold limits for acceptable differences between the QC and QA testing, and acceptance criteria) are also specified. Contractor test results that are used by an agency for QA require the equipment and operator to be certified by that agency following the guidelines of 23 CFR 637 Subpart B - Quality Assurance Procedures for Construction. The agency typically should conduct independent QA testing on 10 percent of a project (FHWA 2015).
• Surface Tolerances. Minimum average valuesfor the smoothness index used by the agencyover a specific section length (such as 0.1 mi[160 m]) based on the type of facility (high-speedor low-speed) are typically specified.
• Reporting Segment Length. The majority ofthe pavement smoothness specifications arebased on a reporting segment length of 0.1 mi(160 m), although other segment lengths canalso be used.
• Measurement and Payment. Many states useIRI-based smoothness thresholds fordetermining the incentives/disincentives forcontractor payments. Three common categoriesused for determining contractor payments arediscussed below. The data suggests that thereis no general consensus on the most suitablethresholds for determiningincentives/disincentives (Merritt, Chang, andRutledge 2015; Transtec 2012).− Incentive Pay. Various levels of incentives
may be provided for contractors when IRI or MRI values fall within ranges that are significantly lower than the specified acceptable value. MRI and IRI values that qualify for incentive payments often range between 35 and 80 inches/mile (550 and 1260 mm/km) for asphalt pavements and 40 and 70 inches/mi (630 and 1105 mm/km) for concrete pavements.
− Full Pay. The contractor receives fullpayment when the MRI or IRI value is at or slightly lower than the specified acceptable value. The lower limit of the full payment range is typically the upper limit of the
8 Measuring and Specifying Pavement Smoothness
incentive pay range described above; the upper limit is typically the specified acceptable IRI or MRI value, which typically ranges between 43 and 100 inches/mile (680 and 1575 mm/km) for asphalt pavements and 54 and 93 inches/mi (850 and 1470 mm/km) for concrete pavements. These values also depend on pavement classification, construction conditions, and agency preferences.
− Disincentive Pay. Various levels ofdisincentives may be applied (in lieu of corrections or removal and replacement) when the MRI or IRI value exceeds the specified acceptable value. MRI and IRI values subject to disincentive penalties typically range from anything greater than the specified acceptable value to the value where corrective action is required.
− Correction. Threshold limits wherecorrective action is required before acceptance. The limits typically vary between 60 and 150 inches/mi (950 and 2370 mm/km) for both asphalt and concrete pavements. Corrective actions are typically required only for localized roughness.
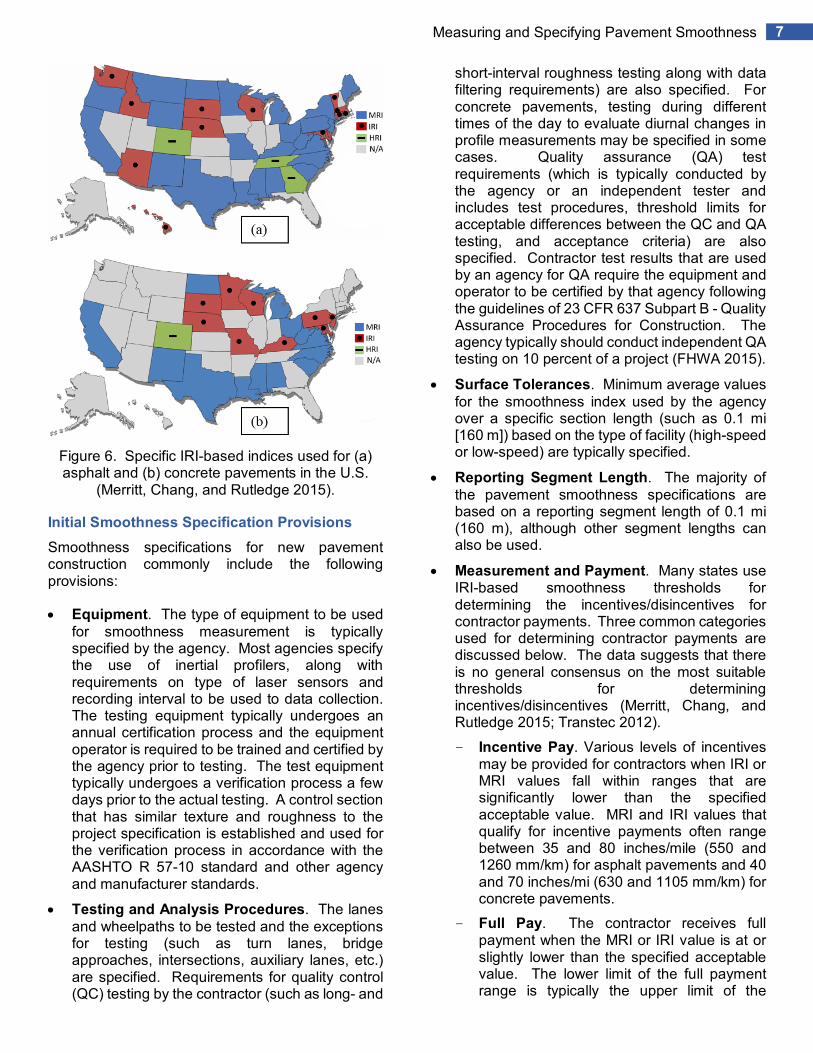
Figure 7 provides a summary of the use of incentives and disincentives for asphalt and concrete pavement construction in the U.S.
Smoothness specification for asphalt pavements has been published by the FHWA Western Federal Lands Highway Division (WFLHD 2006). The American Concrete Pavement Association (ACPA) recently published a guide specification that summarizes all the provisions necessary to develop project-level smoothness specifications (ACPA 2013).
Figure 7. Incentive/disincentive schemes used by various states for (a) asphalt and (b) concrete
pavements in the U.S. (Merritt, Chang, and Rutledge 2015).
Localized Roughness In addition to having specifications for overall pavement smoothness, most states also have provisions for localized roughness, which is typically identified and reported separately. The primary reason for having localized roughness specifications is to identify isolated areas of rough stretches along a pavement that is otherwise smooth, which can potentially present a hazardous situation for the traveling public (Merritt, Chang, and Rutledge 2015; Transtec 2012).
Localized roughness is typically specified as a deviation of up to 0.125 inches (3.175 mm) to 0.25 inches (6.35 mm) over a 10- or 16-ft (3 to 4.9-m) straightedge. This requirement addresses obvious localized roughness issues (such as construction joints) that are typically corrected during construction; however, it does not explicitly identify localized roughness issues that directly impact ride quality and smoothness after construction. Most of the states using IRI-based specifications have localized roughness specifications that use data collected by an inertial profiler.
9 Measuring and Specifying Pavement Smoothness
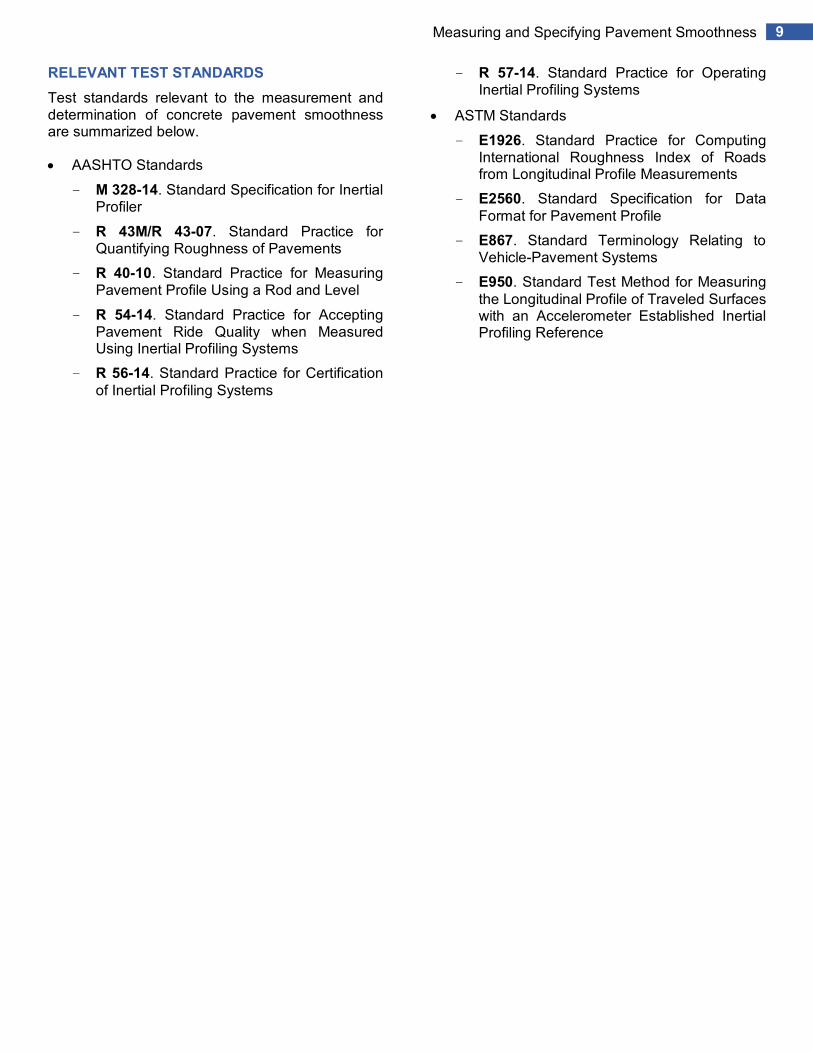
RELEVANT TEST STANDARDS Test standards relevant to the measurement and determination of concrete pavement smoothness are summarized below.
• AASHTO Standards− M 328-14. Standard Specification for Inertial
Profiler − R 43M/R 43-07. Standard Practice for
Quantifying Roughness of Pavements − R 40-10. Standard Practice for Measuring
Pavement Profile Using a Rod and Level − R 54-14. Standard Practice for Accepting
Pavement Ride Quality when Measured Using Inertial Profiling Systems
− R 56-14. Standard Practice for Certificationof Inertial Profiling Systems
− R 57-14. Standard Practice for OperatingInertial Profiling Systems
• ASTM Standards− E1926. Standard Practice for Computing
International Roughness Index of Roads from Longitudinal Profile Measurements
− E2560. Standard Specification for DataFormat for Pavement Profile
− E867. Standard Terminology Relating toVehicle-Pavement Systems
− E950. Standard Test Method for Measuringthe Longitudinal Profile of Traveled Surfaces with an Accelerometer Established Inertial Profiling Reference

10 Measuring and Specifying Pavement Smoothness
REFERENCES American Concrete Pavement Association (ACPA). 2003. Constructing Smooth Concrete Pavements. TB006.02P. American Concrete Pavement Association, Rosemont, IL. (Web Link)
American Concrete Pavement Association (ACPA). 2013. Pavement Smoothness Requirements. American Concrete Pavement Association, Rosemont, IL. (Web Link)
Applied Pavement Technology (APTech). 2017. The four cover images and figure 3 are Applied Pavement Technology originals and FHWA has permission to utilize them in this TechBrief.
Cable, J. K., S. M. Karamihas, M. Brenner, M. Leichty, T. Tabbert, and J. Williams. 2005. Measuring Pavement Profile at the Slip-Form Paver. Report FHWA DTFH61-01-X-00042 (Project 12). Iowa State University, Ames, IA. (Web Link)
California Department of Transportation (Caltrans). 2012. Method of Test for Operation of California Highway Profilograph and Evaluation of Profiles. California Department of Transportation, Sacramento, CA. (Web Link)
Chatti, K. and I. Zaabar. 2012. Estimating the Effects of Pavement Condition on Vehicle Operating Costs. NCHRP Report 720. Transportation Research Board, Washington, DC. (Web Link)
Federal Highway Administration (FHWA). 2006. Priority, Market-Ready Technologies and Innovations: Pavement Smoothness Methodologies. Federal Highway Administration, Washington, DC. (Web Link)
Federal Highway Administration (FHWA). 2014. Highway Performance Monitoring System Field Manual: Appendix E. OMB no. 2125-0028. Federal Highway Administration, Washington, DC. (Web Link)
Federal Highway Administration (FHWA). 2015. Federal Aid Policy Guide, Subchapter G - Engineering and Traffic Operations, Part 637 - Construction Inspection and Approval, Subpart B - Quality Assurance Procedures for Construction. Federal Highway Administration, Washington, DC. (Web Link)
Gagarin, N., J. R. Mekemson, and C. J. Nemmers. 2006. Assessing IRI vs. PI as a Measurement of Pavement Smoothness. OR06-17. Missouri Department of Transportation, Rolla, MO. (Web Link)
Karamihas, S. M. and K. Senn. 2012. Curl and Warp Analysis of the LTPP SPS-2 Site in Arizona. FHWA-HRT-12-068. Federal Highway Administration, Washington, DC. (Web Link)
Merritt, D. K., G. K. Chang, and J. L. Rutledge. 2015. Best Practices for Achieving and Measuring Pavement Smoothness, A Synthesis of State-of-Practice. FHWA/LA.14/550. Louisiana Transportation Research Center, Baton Rouge, LA. (Web Link)
Minnesota Department of Transportation (MnDOT). 2015. Pavement Surface Smoothness Specifications. Minnesota Department of Transportation, St. Paul, MN. (Web Link)
Perera, R. W., S. D. Kohn, and G. R. Rada. 2008. LTPP Manual for Profile Measurements and Processing. FHWA-HRT-08-056. Federal Highway Administration, McLean, VA.
Perera, R. W., S. D. Kohn, and S. Tayabji. 2005. Achieving a High Level of Smoothness in Concrete Pavements without Sacrificing Long-Term Performance. FHWA-HRT-06-068. Federal Highway Administration, Washington, DC. (Web Link)
Rasmussen, R. O., H. N. Torres, R. C. Sohaney, S. M. Karamihas, and G. Fick. 2013. Real-Time Smoothness Measurements on Portland Cement Concrete Pavements during Construction. SHRP 2 Report S2-R06E-RR-1. Transportation Research Board, Washington, DC. (Web Link)
Sayers, M. W. 1989. “Two Quarter-Car Models for Defining Road Roughness: IRI and HRI.” Transportation Research Record 1215. Transportation Research Board, Washington, DC. (Web Link)
Sayers, M. W., and S. M. Karamihas. 1998. The Little Book of Profiling: Basic Information About Measuring and Interpreting Road Profiles. University of Michigan Transportation Research Institute, Ann Arbor, MI. (Web Link)

11 Measuring and Specifying Pavement Smoothness
Smith, K. L., K. D. Smith, L. D. Evans, T. E. Hoerner, M. I. Darter, and J. H. Woodstrom. 1997. Smoothness Specifications for Pavements. NCHRP Web Document 1 (Project 1-31). Transportation Research Board, Washington, DC. (Web Link)
Smith, K. L., L. Titus-Glover, and L. D. Evans. 2002. Pavement Smoothness Index Relationships. FHWA-RD-02-057. Federal Highway Administration, Washington, DC. (Web Link)
The Transtec Group (Transtec). 2012. Smooth Pavements Website. The Transtec Group, Austin, TX. (Web Link)
The Transtec Group (Transtec). 2015. ProVAL Website. The Transtec Group, Austin, TX. (Web Link)
Van Dam, T. J., J. T. Harvey, S. T. Muench, K. D. Smith, M. B. Snyder, I. L. Al-Qadi, H. Ozer, J. Meijer, P. V. Ram, J. R. Roesler, and A. Kendall. 2015. Towards Sustainable Pavement Systems: A Reference Document. FHWA-HIF-15-002. Federal Highway Administration, Washington, DC. (Web Link)
Western Federal Lands Highway Division (WFLHD). 2006. Section 401: Superpave Hot Asphalt Concrete Pavement: Construction Requirements. Federal Highway Administration, Washington, DC. (Web Link)
12 Measuring and Specifying Pavement Smoothness
Contact: For more information, contact:
Federal Highway Administration (FHWA) Pavement Design and Analysis Team (HIAP-10) Tom Yu ([email protected])
Researcher: This Tech Brief was developed by Kurt Smith and Prashant Ram (Applied Pavement Technology, Inc.) and prepared under FHWA’s Concrete Pavement Best Practices Program (DTFH61-14-D-00006). Applied Pavement Technology, Inc. of Urbana, Illinois served as the contractor to FHWA.
Distribution: This Tech Brief is being distributed according to a standard distribution. Direct distribution is being made to the Divisions and Resource Center.
Availability: This Tech Brief may be found at http://www.fhwa.dot.gov/pavement.
Key Words: concrete pavements, asphalt pavements, smoothness, roughness
Notice: This Tech Brief is disseminated under the sponsorship of the U.S. Department of Transportation in the interest of information exchange. The U.S. Government assumes no liability for the use of the information contained in this document. The U.S. Government does not endorse products or manufacturers. Trademarks or manufacturers’ names appear in this report only because they are considered essential to the objective of the document.
Quality Assurance Statement: The Federal Highway Administration (FHWA) provides high-quality information to serve Government, industry, and the public in a manner that promotes public understanding. Standards and policies are used to ensure and maximize the quality, objectivity, utility, and integrity of its information. FHWA periodically reviews quality issues and adjusts its programs and processes to ensure continuous quality improvement.
JUNE 2016 FHWA-HIF-16-032