measuring and managing environmental sustainability… · measuring and managing environmental...
TRANSCRIPT

Measuring and Managing Environmental Sustainability: Using Activity-Based Costing/Management (ABC/M)
September 2012
The Consortium for Advanced Management – International
(CAM-I)
Environmental Sustainability Special Interest Group
Authors: Anthony Pember (Pilbara Group) & Mark Lemon (Grant Thornton)
Other Contributors: Andrea Civichino (CMA Canada), Stathis Gould (IFAC), James Hendricks (The Boeing
Company), David Malone (Weber State University), Keith Renison (SAS Institute), Todd Scaletta (CMA
Canada), Scott Wisler (Dresser-Rand)

2012 Copyright CAM-I
All Rights Reserved
No part of this publication may be reproduced or transmitted in any form
or by any means without permission in writing from the copyright
owners unless they are sponsors of the program that funded the research.
6836 Bee Caves, Suite 256
Austin, Texas 78746 USA
Ph 512-617-6428
www.cam-i.org

What is the issue? Consumers, shareholders and other stakeholders have become increasingly aware of environmental concerns and are pressuring organizations to consider environmental issues and how they relate to an organization’s bottom line. There are costs associated with addressing environmental issues. Accurately quantifying the costs of environmental impacts and remediation efforts has proven to be a daunting challenge.
Why is it important? Understanding the costs of addressing environmental issues can help organizations make informed decisions which can minimize these costs and create a competitive advantage.
What can be done? –Use proven strategic management accounting tools such as activity-based costing/management (ABC/M) to help organizations make better decisions and manage the costs of environmentally sustainable business.
What is the benefit? There is direct visibility to high cost / high environmental impact activities within your organization through the integration of environmental and financial methodologies.
Introduction
An environmentally sustainable organization balances its current strategic and financial objectives with long-term natural resource preservation and usage to meet the needs of the present without compromising those of future generations. There is an opportunity to leverage accounting tools to effectively manage environmental sustainability initiatives within organizations.
Every organization’s operations have an environmental impact. There are pressures – strategic, regulatory, and otherwise – to reduce the impact through responsible environmental stewardship. These pressures require organizations to change the way they do business, and assign additional costs to address the environmental impact. These costs have a significant effect on the way an organization does business. Building a clear understanding of the environmental impact and the actual costs associated with reducing the impact can provide an organization with a competitive advantage over those organizations that cannot quantify or evaluate their own environmental impact.
Accurately quantifying the environmental impact and the costs of remediation efforts is challenging because they do not show up as part of traditional cost accounting models. Under traditional applications of activity-based costing/management (ABC/M), costs associated with environmental stewardship are not explicitly identified. Understanding these costs and layering them into an organization’s decision-making processes will allow the organization to effectively and efficiently utilize its resources. ABC/M is a tool organizations can utilize to more accurately account for their environmental impact. It is based on the principle that it is not the products or services that an organization produces that generate costs, but rather the activities that are performed in producing the products and services. ABC/M provides information on the rate at which activities consume resources as well as why the resources are being used, and provides a link between resources consumed and the organization’s outputs.
Traditionally, ABC/M has been used by accountants. Over time, the use of ABC/M has moved beyond pure cost analysis. ABC/M has been used to track non-cost value items like full-time equivalents (head count) and effort (in the form of hours).
The purpose of this article is to describe how a well-developed ABC/M model can provide not only a management view of cost data but also a management view of greenhouse gas (GHG) emission

Wal-Mart enforces carbon ratings on all of their product lines and asks its suppliers to become “greener” or face being delisted. Walmart’s supply chain network includes more than 60,000 suppliers in different sectors.
In 2009, Walmart announced a sustainability index that would create a more transparent supply chain. The company asks its suppliers to answer 15 questions on the sustainable practices of their respective companies. This initiative is sending a strong message and reiterates the importance of measuring and reporting greenhouse gas emissions.
Source:
https://www.cdproject.net/en-US/WhatWeDo/Pages/Case-Study-Walmart.aspx
data. Further, combining cost and GHG emissions data to arrive at product/service and activity level information for each measure type provides a significant opportunity for organizations to maximize the management of their environmental impact. A model that includes cost, revenue, and GHG emissions would provide GHG/cost/revenue metrics that would allow organizations to measure profit and GHG emission impacts for product lines or services. This model provides a clear perspective on how the GHG footprint of r products, services, and activities relates to profit. This information will provide managers with powerful information on how to reduce an organization’s costs and GHG footprint.
This article is part of a series authored by the Consortium for Advanced Management – International (CAM-I) which explores how the Consortium’s proven cost, performance and process management tools can be applied to environmental sustainability. This article focuses on GHG emissions as an example of an environmental sustainability issue; however, the principles can be easily extended to other environmental concerns, such as water usage, waste, pollutants, or any other environmental measure.
Impetus for addressing environmental sustainability
For years, organizations have received pressure from shareholders and other stakeholders (including but not limited to consumers, government entities, and NGOs) to address environmental issues. Consumers have become increasingly aware of environmental concerns and are demanding better accountability and sustainable offerings from organizations. Similarly, shareholders and other stakeholders are pressuring organizations to address environmental issues in a financially responsible manner. Governments have also increased the number of environmental regulations that require organizations to limit and/or clean up pollution. All of these factors are pushing organizations to become better environmental stewards.
The environmental issue that has gained the greatest amount of public interest in recent years is climate change related to the emission of GHGs. There are a number of market and regulatory pressures driving organizations to reduce GHG emissions. From a regulatory perspective, many countries are requiring organizations to monitor and measure Scope 1 and Scope 21 GHG emissions. In the United States, for example, the Environmental Protection Agency (EPA) began requiring emission reporting from major GHG emitters in January 2011, and climate change
1 Scope 1 - Direct emissions from the generation of electricity, production of goods controlled and owned by the
business Scope 2 - Indirect Emissions - that is those emissions generated from the use of purchased electricity, heat or steam.
Fuel usage are also scope 2 emissions
policies are being debated by Congress. In addition, many organizations are already voluntarily addressing their GHG footprints in response to market pressures. Reporting standards – such as the Greenhouse Gas Protocol2 and clearinghouses, such as the Carbon Disclosure Project3 and Global Reporting Initiative4 – provide a means for companies to report their GHG footprint in verifiable, transparent and repeatable ways.
Most GHG regulations and initiatives focus on accurately reporting emission levels. It is equally important to understand the cost impact of regulatory and voluntary GHG emission programs. The economic principle behind regulation or market pressure is to require that an organization internalizes the full social cost of GHG emissions so that it includes these costs in its strategic and tactical decision making. Thus, in a regulated market, an organization needs to know its emission profile, the costs associated with compliance, and the impact this profile has on profitability. Without this understanding leadership cannot effectively assess the impact of their GHG emissions.
What is ABC/M?
ABC/M is an effective management tool that can help managers evaluate a number of environmental issues, such as polluting emissions, water usage, energy usage, and waste. ABC/M focuses on the management of an organization’s activities as a means to improve its performance and improve the value received by its customers. It is based on the principle that it is not the products or services that an organization produces that generate costs, but rather the activities that are performed in producing the products and services.
ABC/M is used to calculate the cost of particular activities (e.g. train employees) and cost objects (e.g. products, services, customers) by assigning “resource drivers” (e.g. number of employees) and “activity drivers” (e.g. number of times an activity is performed) to traditional line item data.5 CAM-I defines ABC/M as:
“A methodology that measures the cost and performance of activities, resources, and cost objects. Resources are assigned to activities, then activities are assigned to cost objects based on their use. Activity-based costing recognizes the causal relationships of cost drivers to activities.” 6
ABC/M starts by matching the resources of an organization with the activities that are being performed by the organization. In order to achieve this it is necessary to find out which tasks are performed and then identify which personnel and other resources are required to perform each activity. The costs of an organization’s products or services are then calculated by driving the activity costs down to the products or services based on how each consumes the activities. Each product or service requires a different level of support from each activity. For example, in a manufacturing environment one product may require a lot of prototyping, or generate regular engineering change activities; while another product may require little or no prototyping, and may
2 Greenhouse Gas Protocol, http://www.ghgprotocol.org/ 3 Carbon Disclosure Project, https://www.cdproject.net/ 4 Global Reporting Initiative, http://www.globalreporting.org/ 5 Adapted from “The CAM-I Glossary of Activity-Based Management”. Ed. Norm Raffish and Peter B.B. Turney. Arlington: CAM-I, 1991. 6 “The CAM-I Glossary of Activity-Based Management (Version 1.2)”. Ed. Norm Raffish and Peter B.B. Turney. Arlington: CAM-I, 1992.

not require any engineering changes. These differing activity consumptions can create large cost differentials between product and service costs. Controlling activities, rather than individual resource costs, aids in improving the effectiveness of the activities performed in the life cycle of the various products. Figure 1 illustrates how cost “flows” through an ABC/M model. Figure 1 - The "CAM-I Cross" (CAM-I’s expanded ABC/M model)
ABC/M facilitates the identification of overhead and hidden costs which are difficult to attribute when applied outside the context of activities. Applying a traditional view of costs (usually the chart of accounts from an organization’s general ledger) to products or services is often difficult in the absence of activities. In particular, applying costs that do not directly impact the product or service can be very difficult to attribute. For example, it is challenging to apply salaries and travel of management directly to products or services. Using activities as a means to connect management’s tasks to the areas they support (i.e. the direct activities) makes linking indirect management costs to products and services easier. Consequently, a product or service cost arrived at by ABC/M methods is a more accurate representation of the true cost of delivering an organization’s products or services.
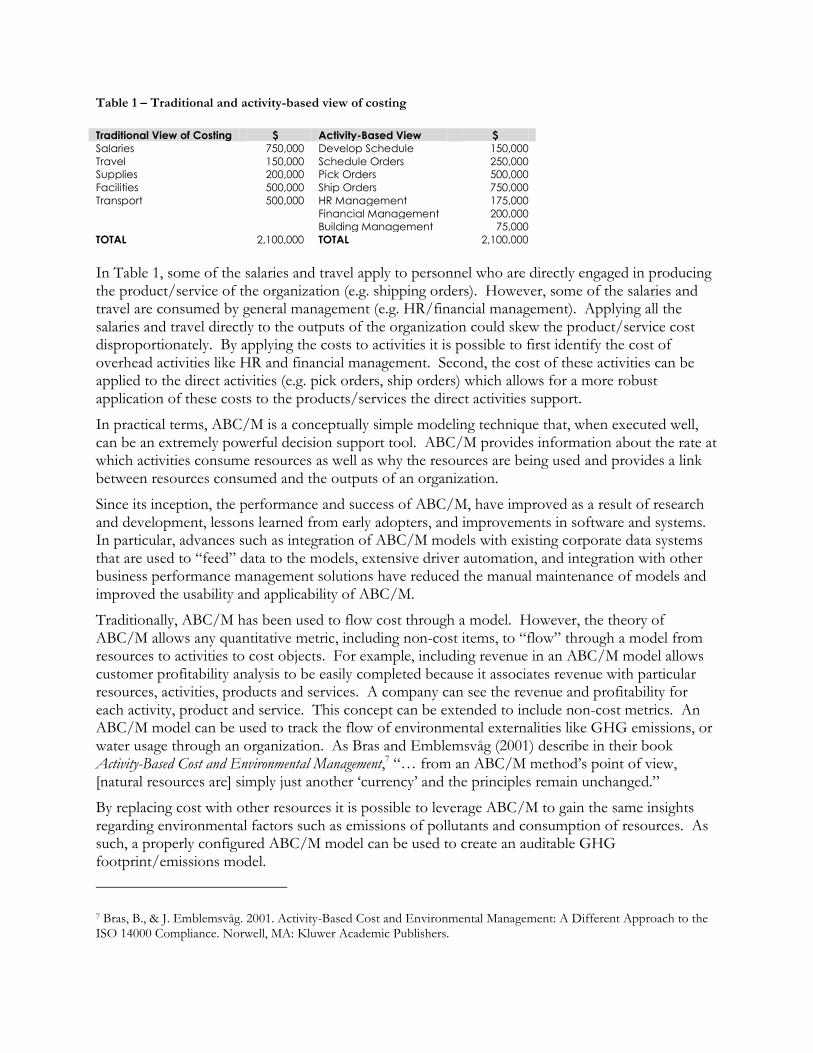
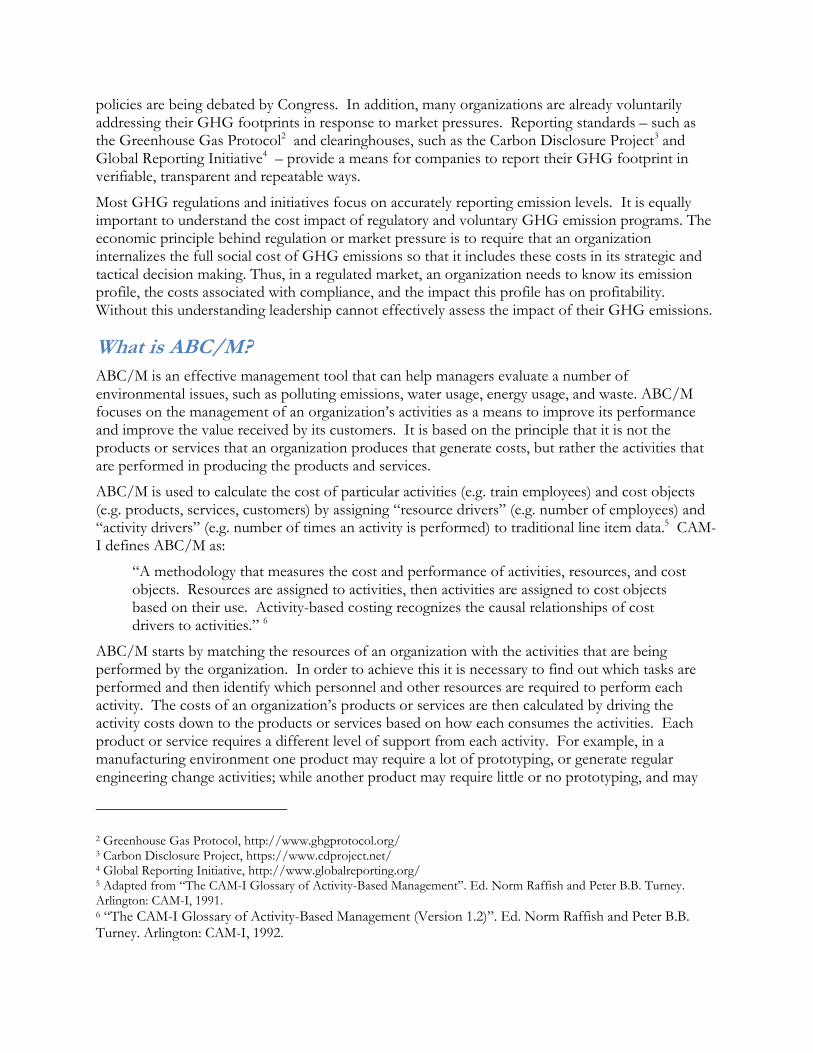
Table 1 – Traditional and activity-based view of costing
Traditional View of Costing $ Activity-Based View $
Salaries 750,000 Develop Schedule 150,000
Travel 150,000 Schedule Orders 250,000
Supplies 200,000 Pick Orders 500,000
Facilities 500,000 Ship Orders 750,000
Transport 500,000 HR Management 175,000
Financial Management 200,000
Building Management 75,000
TOTAL 2,100,000 TOTAL 2,100,000
In Table 1, some of the salaries and travel apply to personnel who are directly engaged in producing the product/service of the organization (e.g. shipping orders). However, some of the salaries and travel are consumed by general management (e.g. HR/financial management). Applying all the salaries and travel directly to the outputs of the organization could skew the product/service cost disproportionately. By applying the costs to activities it is possible to first identify the cost of overhead activities like HR and financial management. Second, the cost of these activities can be applied to the direct activities (e.g. pick orders, ship orders) which allows for a more robust application of these costs to the products/services the direct activities support.
In practical terms, ABC/M is a conceptually simple modeling technique that, when executed well, can be an extremely powerful decision support tool. ABC/M provides information about the rate at which activities consume resources as well as why the resources are being used and provides a link between resources consumed and the outputs of an organization.
Since its inception, the performance and success of ABC/M, have improved as a result of research and development, lessons learned from early adopters, and improvements in software and systems. In particular, advances such as integration of ABC/M models with existing corporate data systems that are used to “feed” data to the models, extensive driver automation, and integration with other business performance management solutions have reduced the manual maintenance of models and improved the usability and applicability of ABC/M.
Traditionally, ABC/M has been used to flow cost through a model. However, the theory of ABC/M allows any quantitative metric, including non-cost items, to “flow” through a model from resources to activities to cost objects. For example, including revenue in an ABC/M model allows customer profitability analysis to be easily completed because it associates revenue with particular resources, activities, products and services. A company can see the revenue and profitability for each activity, product and service. This concept can be extended to include non-cost metrics. An ABC/M model can be used to track the flow of environmental externalities like GHG emissions, or water usage through an organization. As Bras and Emblemsvåg (2001) describe in their book Activity-Based Cost and Environmental Management,7 “… from an ABC/M method’s point of view, [natural resources are] simply just another ‘currency’ and the principles remain unchanged.”
By replacing cost with other resources it is possible to leverage ABC/M to gain the same insights regarding environmental factors such as emissions of pollutants and consumption of resources. As such, a properly configured ABC/M model can be used to create an auditable GHG footprint/emissions model.
7 Bras, B., & J. Emblemsvåg. 2001. Activity-Based Cost and Environmental Management: A Different Approach to the ISO 14000 Compliance. Norwell, MA: Kluwer Academic Publishers.

How to apply ABC/M to environmental sustainability
An emissions inventory is a form of accounting. Accurately understanding the amount of emissions and tracking that amount over time is not unlike financial accounting performed by virtually every organization on the planet. For this reason, tracking and managing environmental emissions, such as GHGs, can be addressed in much the same way – and employ the same tools and techniques – as financial management. As in financial accounting, only having an “inventory” provides little insight into how particular activities are performing. Performance indicators provide information that allow for effective management. In order to make management decisions about resources it is necessary to understand what is driving them. Building models that show how activities drive resources to products and services provides this insight – it shows how, why, and by whom resources are consumed. ABC/M is a proven methodology in the management of cost and it is now becoming apparent that ABC/M can help a company effectively manage is GHG emissions.
Numerous papers and articles have been written on how ABC/M could improve environmental management accounting. The International Federation of Accountants’ (IFAC) international guidance document, “Environmental Management Accounting,” discusses the current challenges faced in environmental management accounting. In particular, the article points out that environment-related costs often get “hidden” in overhead accounts. The guidance states:
“Organizations have taken different approaches to resolving the issue of hidden environment-related costs. One common solution is to set up separate cost categories or cost centers for the more obvious and discrete environmental management activities. The less obvious costs that will still appear in other accounts and cost centers can be more clearly labeled as environment related so that they can be traced more easily. An assessment of the relative importance of environment-related costs and cost drivers of different process and product lines, in line with the general practice of ABC, can help an organization determine whether or not the cost allocation bases being used are appropriate for those costs.” 8
For the same reasons ABC/M was originally used to track overhead costs by assigning those costs to particular activities. ABC/M uncovers “hidden” costs by directly assigning those costs to activities. The “Environmental Management Accounting Procedures and Principles” paper from the United Nations Division for Sustainable Development advocates the allocation of environment-related costs directly to the activity that causes the cost.
“Whenever possible, environment-driven costs should be allocated directly to the activity that causes the costs and to the respective cost centers and cost drivers. Consequently, the costs of treating, for example, the toxic waste arising from a product should directly and exclusively be allocated to that product. Many terms are used to describe this correct allocation procedure, such as environmentally enlightened cost accounting, full cost accounting or ABC/M. ABC/M, “is a product costing system... that allocates costs typically allocated to overhead in proportion to the activities associated with a product or product family”” 9
8 IFAC. International Guidance Document – Environmental Management Accounting. New York: IFAC, 2005 (p.27) 9 United Nations Division for Sustainable Development. Environmental Management Accounting Procedures and Principles. New York: United Nations, 2001 (p. 75)

Suppliers who have a firm grasp on their environment-related costs and their GHG footprint are at a distinct advantage when customers become aggressive in their desire to reduce their environmental impact.
Simply put, ABC/M can help move GHG costs from the catch-all line item of “overhead” and directly assign them to particular activities and cost objects which can then be analyzed for performance.
How ABC/M addresses a firm’s GHG emissions
A traditional ABC/M model can be used to determine the cost of environmental measures. For example, an environmentally focused ABC/M model could be used as a standalone model where the resource inputs would include the total spend on environmental costs (e.g. electrical bill, estimate of energy costs included as part of building lease, and information from suppliers and the portion of supplier selling price that is energy related). The model would also include significant activities that consume the resources and the products and services that consumed the activities. At the end of the
day, a model like this would provide the environmental cost for an organization in terms of its activities and outputs. The example in Table 2 below shows how to arrive at the environmental cost for an organization’s activities by determining what each resource is used for and then assigning that resource cost to the business process or activity.
Table 2 – Traditional and activity-based view of environmental costs
Traditional View Activity-Based View
$ Cost Pool $ Activity $
Electricity 80,000 Electricity for HVAC 20,000 Develop schedule 7,500
Electricity for manufacturing 40,000 Process raw material 15,000
Electricity to run servers 15,000 Manufacture product 60,000
Electricity for lighting 5,000 Ship products 22,500
Natural gas 30,000 Natural Gas for manufacturing 25,000 HR management 10,000
Natural Gas for HVAC 5,000 Financial management 10,000
Petrol/diesel 25,000 Petrol for vans/forklifts 5,000 IT management 25,000
Diesel for trucks 20,000
Work-related travel 15,000 Work-related air travel 10,000
Work-related train travel 1,000
Work-related motor vehicle travel 4,000
TOTAL 150,000 TOTAL 150,000 TOTAL 150,000
Alternatively, instead of resource inputs being framed in terms of costs the resource inputs could be framed in terms of an environmental measure of importance to the organization. So, rather than the cost of electricity, natural gas, fuel and travel, the model could contain the carbon dioxide equivalent (CO2e) for each of these resources. This would then provide a true picture of the environmental “impact” of each of the organizations’ activities. This view may look vastly different to the cost view as there is not necessarily a relationship between a resource’s cost and its GHG footprint. In the example below “Ship products” and “HR management” are big contributors to the organization’s carbon footprint. Yet these activities are not large cost activities when compared to “manufacture product” (as seen in Table 2). This differential is due to the type of resource being consumed. In this example, work-related travel and usage of petrol/diesel, while comparatively inexpensive to purchase, have large carbon footprints. Since “Ship Products” and “HR management” are the biggest consumers of these two resources they receive the largest proportion of CO2e.
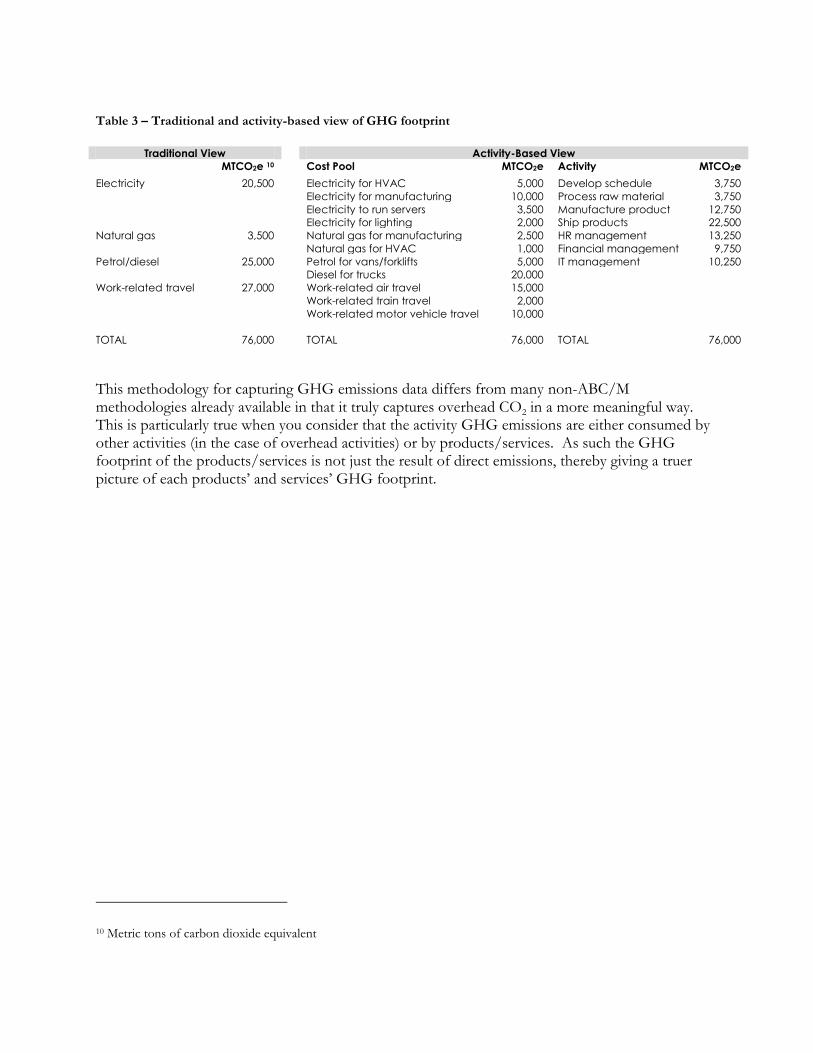
Table 3 – Traditional and activity-based view of GHG footprint
Traditional View Activity-Based View
MTCO2e 10 Cost Pool MTCO2e Activity MTCO2e
Electricity 20,500 Electricity for HVAC 5,000 Develop schedule 3,750
Electricity for manufacturing 10,000 Process raw material 3,750
Electricity to run servers 3,500 Manufacture product 12,750
Electricity for lighting 2,000 Ship products 22,500
Natural gas 3,500 Natural gas for manufacturing 2,500 HR management 13,250
Natural gas for HVAC 1,000 Financial management 9,750
Petrol/diesel 25,000 Petrol for vans/forklifts 5,000 IT management 10,250
Diesel for trucks 20,000
Work-related travel 27,000 Work-related air travel 15,000
Work-related train travel 2,000
Work-related motor vehicle travel 10,000
TOTAL 76,000 TOTAL 76,000 TOTAL 76,000
This methodology for capturing GHG emissions data differs from many non-ABC/M methodologies already available in that it truly captures overhead CO2 in a more meaningful way. This is particularly true when you consider that the activity GHG emissions are either consumed by other activities (in the case of overhead activities) or by products/services. As such the GHG footprint of the products/services is not just the result of direct emissions, thereby giving a truer picture of each products’ and services’ GHG footprint.
10 Metric tons of carbon dioxide equivalent

However, the true power of using an ABC/M methodology comes by integrating multiple value items into a model. Consider an ABC/M model that combines cost, revenue, and GHG emissions as value items in the same model. Each of these value items flows through the model such that activities and products/services within the model have a cost, revenue, and a GHG footprint.
Table 4 – Traditional and activity-based view of cost per CO2e
Traditional View Activity-Based View
Cost per
MTCO2e
Cost Pool Cost per
MTCO2e
Activity Cost per
MTCO2e
Electricity 3.90 Electricity for HVAC 4.00 Develop schedule 2.00
Electricity for manufacturing 4.00 Process raw material 4.00
Electricity to run servers 4.29 Manufacture Product 4.71
Electricity for lighting 2.50 Ship Products 1.00
Natural Gas 8.57 Natural Gas for manufacturing 10.00 HR Management 0.75
Natural Gas for HVAC 5.00 Financial Management 1.03
Petrol/Diesel 1.00 Petrol for vans/forklifts 1.00 IT management 2.44
Diesel for trucks 1.00
Work Related Travel 0.56 Work-related air travel 0.67
Work-related train travel 0.50
Work-related motor vehicle travel 0.40
This model such as this would enable the correlation of GHG emissions to other business specific cost and performance metrics, providing a more robust assessment of performance to management. A model that includes cost, revenue, and GHG emissions would provide GHG/cost/revenue metrics that would allow organizations to measure profit and GHG emission impacts for product lines or services. Such a model provides a clear perspective on how the GHG footprint of particular products, services and activities relates to profit (or anything else of value for the organization). Decision-makers will be able to know which products, services and activities have a high GHG footprint but little value versus those with a lower GHG footprint but high value (Figure 2). Managers will be able to evaluate the overall impact GHG emissions have on a company’s bottom line and prioritize best practices that will yield the lowest GHG footprint with the most value. Managers will thus have a clear roadmap to move from activities, products and services with a high footprint and low value (red) to low impact and high value (green). This could be extended further to cover a company’s supply and selling chains.
Cisco Systems Inc. is no stranger to the GHG emissions reporting process. The company developed software that would allow the collection of energy-use data to become a standard business process. In order to coordinate an emissions calculation that covered 500 buildings in over 80 countries, the company trained and encouraged people from all over the world to send data into their custom software. The next step was to create a reduction goal. Cisco’s “EcoBoard” – an executive-level body responsible for the company’s environmental vision and strategy – supports the company’s efforts on this initiative.
Source: https://www.cdproject.net/en-US/WhatWeDo/Pages/Case-Study-Cisco-SystemsInc.aspx
Figure 2 – The relationship between value and footprint
Using ABC/M track environment-related costs and measures would position an organization to incorporate sustainability into its ongoing management initiatives. ABC/M is familiar to management accountants and provides a transparent model for distributing GHG emissions through an organization to the final products / services. It also helps in reporting the true emissions profile of the individual products or services organizations provide to customers by using an auditable and disciplined modeling approach rather than an ad-hoc approach. Beyond understanding a company’s GHG profile, ABC/M will help management identify high GHG activities and processes and actively manage these activities/processes to reduce emissions by using more efficient techniques, greener sources of energy, or buying or selling emission permits. An example is Cisco, which first learned to report its GHG emissions, and is now moving toward full management of those emissions (see sidebar).
An ABC/M model for GHG emissions provides an organization with the tools to address these decisions. The benefits of this approach include:
Identifying the GHG footprint of particular products and services;
Providing a detailed understanding of the energy consumption and emissions of particular activities within a company;

Better defining the “boundaries” of emissions for which a company is responsible;
Understanding how energy and GHG intensity affect cost and how those costs are passed from producer to consumer;
Building a valuable knowledge-base to help measure and justify future corporate environmental and financial decisions;
Enhancing ability to evaluate and compare GHG intensity and cost implications of activities, products and services
Articulating GHG related costs, risks and opportunities to shareholders and other stakeholders
Engaging staff in targeted energy reduction steps;
Setting the example and expectation to suppliers and contractors to do the same; and
Enhancing public profile and reputation as a good corporate citizen.
Is your organization ready to measure and manage its GHG emissions?
There are many factors an organization must consider before it begins an initiative to monitor and evaluate its GHG emissions. An organization must have the proper resources and information in place to effectively utilize ABC/M to evaluate its GHG emissions. Some important questions to consider before beginning a GHG initiative (and why these considerations are important) are included in Table 5 below.
Table 5 – Maturity matrix for GHG emissions tracking
Questions for consideration
Why this question is important
Sample responses
"More likely to succeed" "Less likely to succeed"
Is there support within the entire organization to implement this initiative?
To have the greatest impact, a sustainability initiative must be undertaken by the entire company. Determining whether there is buy-in from all relevant decision makers illustrates whether the organization is ready and willing to undertake such an initiative.
This is core to our business strategy, and I give annual status reports to our executive teams.
We feel that making improvements here will ultimately improve our efficiency and ultimately our bottom line.
Everyone is on board; it’s part of our culture.
Our organization has traditionally been closed to the idea; however, there seems to be a slow change in our peoples' perspective.
Right now we're looking at the landscape and it seems like all of our peers are going this route and we don't want to be left out.
While this is not part of our culture, I am sure we can convince people to participate.

Questions for consideration
Why this question is important
Sample responses
"More likely to succeed" "Less likely to succeed"
Do the people in charge of the initiative have the proper authority to make change within their organization?
In order to be fully utilized, a sustainability initiative must be fully integrated into an organization’s decision-making processes. The ability of those in charge to directly influence key decisions will largely determine the success of the initiative.
I'm in charge of facilities, however Bob, who is in charge of fleet management and Tom in finance and I work very closely to implement what we need to hit our CEO's reduction target. If it makes sense, then I feel we could get it done.
My team acts as an advisor to the rest of the organization and delivers important information to the board. Management of energy is just one part of what I do. Much of our fleet management is controlled by Sven in Sweden, whom I don't know very well.
How will the information be used and who within the organization will use it?
Sustainability information can be used in multiple ways, from reporting GHG emission levels to tracking emission trends and analyzing emission reduction and cost performance. Describing how the information will be used demonstrates how an organization plans to assess its sustainability measures and also speaks to the level of influence those in charge hold in driving the initiative.
Our regional office managers need to know a couple of very important metrics we've defined as key to achieving our reduction goals. We also have the leadership of our core business that is responsible for much of the emissions. We need to provide them details on where their emissions are coming from and what they can do to reduce them.
We've only just started measuring our footprint, and our CEO has made a royal proclamation. However, it's unclear how we're supposed to get there and how exactly we'll manage performance. Once we start to see the numbers, I think we'll have a better idea of where we can make improvements.
Does the organization have the capacity to get energy consumption information from individual responsibility centers (buildings, vehicles, etc.) and activities?
The ability to do ABC/M is contingent on being able to collect and analyze unit information from individual responsibility centers to assess the relative emissions, cost and efficiency of each center. Organizations must be able to collect information from each of its responsibility centers to effectively utilize an ABC/M methodology.
Our organization has installed a smart grid system that tracks energy consumption for each individual building at our office park. This level of information allows us to track the consumption and relative efficiency of each building.
Our organization does not utilize smart grid technology but we do have good metrics that we could use to approximate energy consumption in each of our buildings/facilities.
To generate our GHG footprint we get the total amount of energy consumed by our organization from the power company. We do not have the technology available to get energy consumption data at the facility level. Nor do we have any metrics that we could use to approximate energy consumption at each of our facilities.

Questions for consideration
Why this question is important
Sample responses
"More likely to succeed" "Less likely to succeed"
How many suppliers does the company use? How challenging will it be to get GHG emission reporting information from them?
Tracking and reporting Scope 311 GHG emissions requires receiving information from a company’s supply chain. The company must be able to get this information in order to effectively track Scope 3 emissions. It is possible to build a GHG emissions model that does not include Scope 3 emissions. However, eventually it is recommended that any model built include Scope 3 emissions. As such, a “Less likely to succeed” answer to this question should not deter an organization from going forward with modeling Scope 1 and Scope 2 emissions.
In reality, this is where we can make our biggest improvements. We have welcomed the emergence of Scope 3 because it gives us a chance to expand the playing field to areas that are seeing massive improvement, and can be impacted by each employee's behavior.
We see Scope 3 as important, but the regulations are just now coming together, many of which are still abstract and lack direction. Plus, the data around this is very scarce. We're having a hard enough time collecting data for Scope 1 and Scope 2.
How to move towards a GHG mode using ABC/M
How does an organization move from simple GHG compliance reporting using a spreadsheet to managing emissions through the use of an enduring model? The principles and lessons learned from ABC/M implementations provide insight necessary to implement a successful activity based GHG emissions model. The six steps are:
1) Define the purpose of the model;
2) Define the boundary and scope of the model;
3) Find data sources necessary to support the model;
4) Build your model;
5) Document the model;
6) Use the model.
This section details the steps in the process for developing such a model.
11 Scope 3 – Emissions embedded in inputs to the organization. These emissions encompass all emissions that are not direct emissions from the generation of electricity, or production of goods controlled and owned by the business (scope 1), or indirect emissions from the use of purchased electricity (Scope 2). Examples of scope 3 emissions are those resulting from waste disposal, purchased materials, business travel, fuel usage for transporting outputs, and outsourced activities.

Unlike financial accounting, there are no “official” standards for GHG emission accounting and reporting. However, the World Resource Institute (WRI) is unofficially recognized as the leader in this area and the WRI GHG Protocol - A Corporate Accounting and Reporting Standard (GHG Protocol)1 is considered by most as the de-facto standard. This document defines organizational boundaries and scopes and is a good starting point for determining the scope and boundary for any GHG emissions model. 1 World Resource Institute GHG Protocol - A Corporate Accounting and Reporting Standard. (http://www.wri.org/publication/greenhouse-gas-protocol-corporate-accounting-and-reporting-standard-revised-edition)
STEP 1: Define the purpose of the model
The first step in any project is to clearly define its purpose. A clearly defined purpose and goal provide clarity and direction for the project team. The project should be tied to critical processes and issues arising from the business case analysis. Linking the project to a critical process within the organization will also help define the purpose of the model. .
Before taking steps to build and implement ABC/M to capture your GHG emissions, it is important to ensure that the model has programmatic support throughout the organization. There should be a plan to have a well-established organizational framework to support the ABC/M model. Where possible there should be dedicated personnel and dedicated business unit points of contacts (both financial and operational).
STEP 2: Define the boundary and scope of the model
It is important to define what entities and types of emissions within an organization will be monitored. Boundary defines specific components of an organization that will be monitored, and scope refers to what types of emissions will be monitored (direct, indirect and supply chain) An organization will select an approach for consolidating GHG emissions and will then use that approach in a consistent manner.
Boundary
As outlined in the WRI’s GHG Protocol, two distinct approaches can be used to define boundaries and consolidate GHG emissions: the equity share and control approaches. Under the equity share approach, an organization accounts for GHG emissions from operations according to its share of equity in the operation. The equity share reflects economic interest, which is the extent of rights an organization has to the risks and rewards flowing from an operation. Under the control approach, a company accounts for 100 percent of the GHG emissions from operations over which it has control. It does not account for GHG emissions from operations in which it owns an interest but has no control. In a voluntary setting a company can use either approach. What is important is that a company selects an approach for consolidating GHG emissions and then consistently applies the selected approach and underlying methodology. Where a reporting company wholly owns all its operations, its organizational boundary will be the same whichever approach is used. However, for organizations with joint operations, the organizational boundary and the resulting emissions may differ depending on the approach used.
However, in many jurisdictions there are local standards and industry specific standards. Any and all applicable standards, organizational mandates and the model’s purpose should all be understood when defining the scope and boundary of any model.
Scope

Carbon emissions have been divided into three scopes:
Scope 1 – direct emissions from within the organization;
Scope 2 – indirect generation of emissions through the use of electricity;
Scope 3 – encompass the balance of activities in an organization such as waste disposal, purchased materials, and business. Scope 3 emissions have not been completely defined and at the moment they are not required for any reporting purposes.
Table 6 - Description of Scope 1, 2 and 3 GHG emissions
Scope 1 Scope 2 Scope 3
Emission type Direct
Emissions from within the
organization
Indirect
Emissions from purchased
electricity
Embodied
Emissions embedded in
inputs
Examples • Electricity generation
• Industrial processes
• Fuel usage for
transporting inputs
• Fugitive emissions
• On-site waste
• Electricity consumption • Waste disposal
• Purchased materials
• Business travel
• Fuel usage for
transporting outputs
• Outsourced activities
Supply chain Impacted Impacted Impacted
Mandatory reporting Report (if > threshold) Report (if > threshold) Voluntary
Emission trading Liable (if > threshold and
at point of obligation)
Impacts compensation
calculations only
Difficulty in
modeling
Easy Easy Hard
It is recommended that an organization start by modeling Scope 1 GHG emissions then add in Scope 2 GHG emissions. As knowledge and maturity in the modeling process increases Scope 3 emissions can be added. This allows the organization to increase its knowledge as it goes and leverage what has already been built. Any modeling process should tag emissions with their appropriate scope so that in the final analysis the makeup of the GHG footprint can be divided into the 3 scopes.
STEP 3: Find data sources necessary to support the model
Data used to support the model will come from both internal and external sources. It is generally best practice to identify systems of record and use these. Most organizations are in the early stages of environmental management and much of the required data may prove to be elusive. Therefore any model built must be able to account for automated electronic collection of source data as well as manual surveys or data entry directly into the model. The later two are not ideal mechanisms for sourcing data but they do provide a bridge to automated source data population which should always be the end goal when building an enterprise model of this type.
Several types of data are commonly used for calculations in a GHG emissions model:

General ledger information (expenses and revenue). This data constitutes the expenses that are entered into the model. It would include discretionary expenditure, payroll expenses, supplier and raw material expenses as well as other costs incurred by the organization.
Human resource information. Typically this data provides information regarding personnel within the organization. It generally is used to determine where personnel work; possibly what work they are performing through the use of job codes (or something similar); and sometimes even the hours they work on specified tasks.
Emission data. The data needed to determine the emissions created by an organization. Sometimes these emissions are directly measured by sensors in smokestacks or exhaust piping. However, more often than not they need to be calculated using two key pieces of information:
o Emissions factors – the amount of emissions associated with a given activity (e.g. CO2e per kWh or CO2e per mile for a specific engine type). Emissions factors will vary based on geography and other variables. As an example, electricity sourced in the North West of the United States will generally have lower emissions per kWh than electricity sourced in the Mid-West region of the United States. This is because the North West uses a large amount of hydroelectric power generation while the Mid-West predominately uses coal power to generate electricity. These factors are usually provided by a 3rd party.12
o Resource/activity metric information – the volume of “activity” that creates the emissions. An example of metric to measure Scope 1 emissions would be the number of miles a truck was driven. A Scope 2 emission metric would be the electricity consumption of the resource/activity. In an IT organization metrics would include CPU Usage and HDD utilization.
Transactional data used to “drive” emissions through the model (emissions factors and activity metrics) serve two primary purposes: 1) increases automation, which speeds model development and 2) serves as the best reflection of what drives the business. Where possible, transactional drivers should be captured and entered into the model in an automated fashion.
As a general rule, when considering data sources (corporate or transactional) it is always important to consider the balance of automation versus manual input. An ABC/M model that is largely automated greatly reduces the manual burden on the organization and contributes to its continued success.
STEP 4: Build your model
Once the purpose, boundary, scope, and data sources of the model have been identified, it is time to build the ABC/M GHG emissions model. The exact structure of your model will vary depending upon the factors described previously. However, the diagram below outlines a generic structure of a
12 AMEE is an example of a 3rd party provider of emissions factors. AMEE’s web service allows users to develop local applications that calculate emissions levels for their organization. The user’s application submits data describing their emission producing assets and processes and retrieves the calculated emissions. AMEE utilizes their collection of emission factors to perform these calculations. Typically the AMEE emission factors are incorporated into the model as drivers (to “drive” GHG quantities through the model). These emissions factors can be accessed by using the AMEE Explorer. For an introduction to AMEE Explorer go to:
http://explorer.amee.com/categories/Introduction_to_AMEE_Explorer

model and how it would function. At a bare minimum an activity based GHG emissions model will have at least 4 modules. Each of these modules would be appropriately structured to account for things like organizational hierarchy, geography, and other relevant information.
External Units Module – this module will contain all the emissions factor information used by the model;
Resource Module – this module will contain organizational resource information (e.g. general ledger and human resource data). The amount of data in this module and how it is structured will depend upon the scope, boundary and purpose of the model. This module consumes the emissions factor information from the External Units Module;
Activity Module – this module contains the activities of the organization. The activities consume the resources in the Resource Module. A good model will intra-modularly allocate overhead activities to the activities that directly produce products/services. Activities can be defined at a variety of levels from high-level strategic to low-level operational. The level of activity detail used will depend on many factors including: the purpose of the model, required granularity and data availability.
Cost Object Module – this module will contain the products and/or services of the organization. The cost objects consume the activities performed in the creation of the organization’s products/services.
Once these modules have been established, costs or externality data (e.g., emission data) will be assigned to cost objects consistent with the relationships existing among these modules. These assignments are highly dependent on the specific criteria such as activities, cost objects, needs, and data available for an organization and thus there is not a “one size fits all” solution. In most instances, relationships will exist among the modules sequentially from left to right; however, in some instances resources (indirect) will be allocated to other resources (direct) for further allocation to the next module. In other instances, activities (internal) will be used to assign resources to other activities (external) which will then be assigned to the next module. Costs, as suggested in the model will only arise as a result of resource consumption. Externalities, in contrast, will only arise (by definition) in the external units module.

Figure 3 – Modules of an ABC/M GHG emissions model
STEP 5: Document the model
It is important that the model be fully documented. This includes documenting the purpose, boundary, scope, data sources and tools used. A well documented system helps reduce the impact of personnel changes as well as facilitating a model’s auditability.
The methodology is the cornerstone on which a system is developed because it guides the way in which activities are defined, resources are collected and assigned, and product / customer costs are calculated. A methodology manual serves as a key document for model users who want to understand the fundamentals of costing results in order to make better use of the data. As a reference document, it should also be used when changes to the model are contemplated. In order for the model to remain meaningful, any changes must be consistent with the underlying methodology, and must ensure that the methodology remains coherent.
Business rules document each of the major decisions on how model resources, activities and products are to be treated (defined, classified, valued, stored, and processed) by the model. These rules are derived from the methodology, and should be seen as the first step in transforming the methodology into practice.
STEP 6: Use the model

Coca-Cola (UK) has calculated the carbon footprint of three of its biggest brands: Coca-Cola, Diet Coke, and Coke Zero. It says that a 330ml can of Coca-Cola sold in Great Britain has a carbon footprint of 170 grams while the same sized can of Diet Coke or Coke Zero has a footprint of 150 grams. Coca-Cola claims that this is the first time a carbon footprint of any brand of carbonated drink has been certified by the Carbon Trust.
Coca-Cola found that packaging accounts for the largest portion of the drinks’ carbon footprint, between 30 to 70 percent, depending on the type of container used. This discovery allows Coca-Cola to better address the environmental impact of its products.
Source: http://www.marketingweek.co.uk/news/coke-reveals-brands-carbon-footprints/2064575.article
Management systems fail because once they are built they are not used appropriately. The exact use of an emissions model will depend upon its defined goals.
A good model will be multidimensional. These multiple dimensions will exist throughout the model and will facilitate reporting and analysis. Each dimension essentially provides a different perspective with which to view the data.
The use of model data will vary depending upon stakeholder’s perspective and needs. IT departments, for example, will be concerned about energy consumption of equipment and would likely use a model to determine high energy consumption locations; with an eye to reducing overall consumption. Executive management is more likely concerned with the ability of the model to supply the required information for regulatory reporting.
ABC/M can help trace or identify the activities and resources that contributed to a product or service’s high carbon footprint. This analysis then allows management to identify areas upon which to focus as they aim to reduce carbon footprints. For example, Coca Cola (using a non ABC/M methodology) was able to identify that their packaging contributed the largest proportion to their drinks’ carbon footprint. Knowing this allows a targeted effort in reducing each drink’s overall footprint. In the United Kingdom, where carbon represents a cost to organizations, reducing the overall carbon footprint of a product will ultimately reduce its cost and potentially increase its profitability. However, had Coca Cola used an ABC/M methodology and combined this carbon footprint information with product profitability information and activity information they would have had an extremely valuable set of data that would allow them to prioritize initiatives to minimize carbon footprints while maximizing profitability for each brand.
Summary
Understanding an organization’s cost base has always been a critical element of doing business. The rise of environmental social consciousness means that organizations need to go beyond simply understanding their internal, line item costs of doing business. There is now a need to understand that many company behaviors have impacts and real costs related to the environment.
The use of ABC/M to manage costs has matured to the point where it is an accepted form of cost analysis. Many organizations already have ABC/M models in some form. Extending these models to account for non-cost measures is a relatively simple process. The combination of cost and environmental measures within a single ABC/M model provides a common “language” for the basis of cost/profit and environmental measure management. Trying to manage environmental measures like carbon emissions or water usage without considering cost and profit is only managing half the issue. However, more often than not, costs are not captured in the same “language” as environmental measures. So determining the impact of increased environmental stewardship on

profit is often a difficult endeavor. A well constructed ABC/M model will help reduce this difficulty.
Ultimately organizations need to view GHG emissions and impacts the same way they look at costs – because ultimately they translate directly into cost. If an organization can understand and manage its GHG emissions, or other environmental factors like water usage, then it can better control its costs and have a positive environmental impact. Applying ABC/M to include GHG emissions can give organizations the ability to better manage the environmental sustainability costs of doing business.
About CAM-I
The Consortium for Advanced Management - International (CAM-I) is a research organization consisting of sponsoring companies and academia who work in collaboration to study and solve management problems and critical business issues common to the group in the areas of cost, process and performance management. More information can be found at: http://www.cam-i.org/
The CAM-I Environmental Sustainability Interest Group aims to give value to all member participants by providing practical support on establishing an integrated strategy toward environmental sustainability management. Through the use of CAM-I’s Body of Knowledge surrounding cost, performance and process management the interest group seeks to facilitate the understanding and measurement of environmental sustainability impacts within organizations.