measuring a nation’s income gdp and other measures · measuring a nation’s income gdp and other...
TRANSCRIPT

Principles of MacroeconomicsModule 2.1
Measuring a Nation’s IncomeGDP and Other Measures
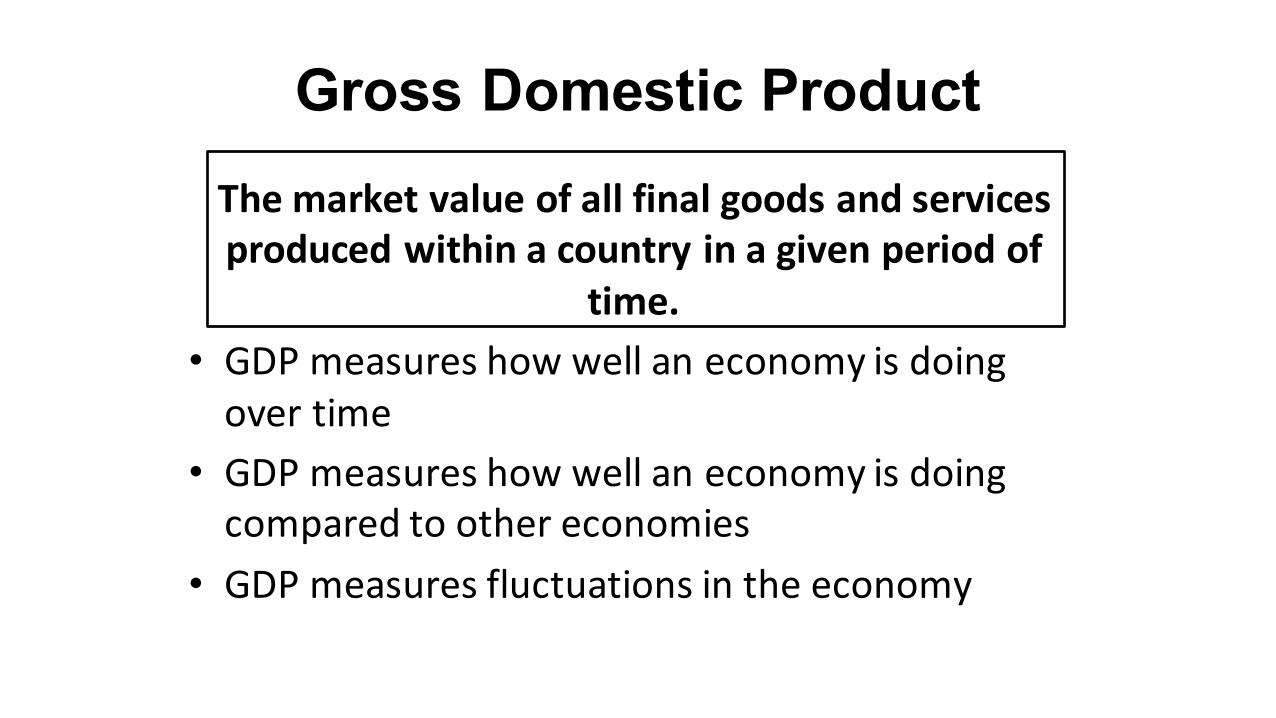
Gross Domestic ProductThemarketvalueofallfinalgoodsandservicesproducedwithinacountryinagivenperiodof
time.• GDPmeasureshowwellaneconomyisdoingovertime
• GDPmeasureshowwellaneconomyisdoingcomparedtoothereconomies
• GDPmeasuresfluctuationsintheeconomy
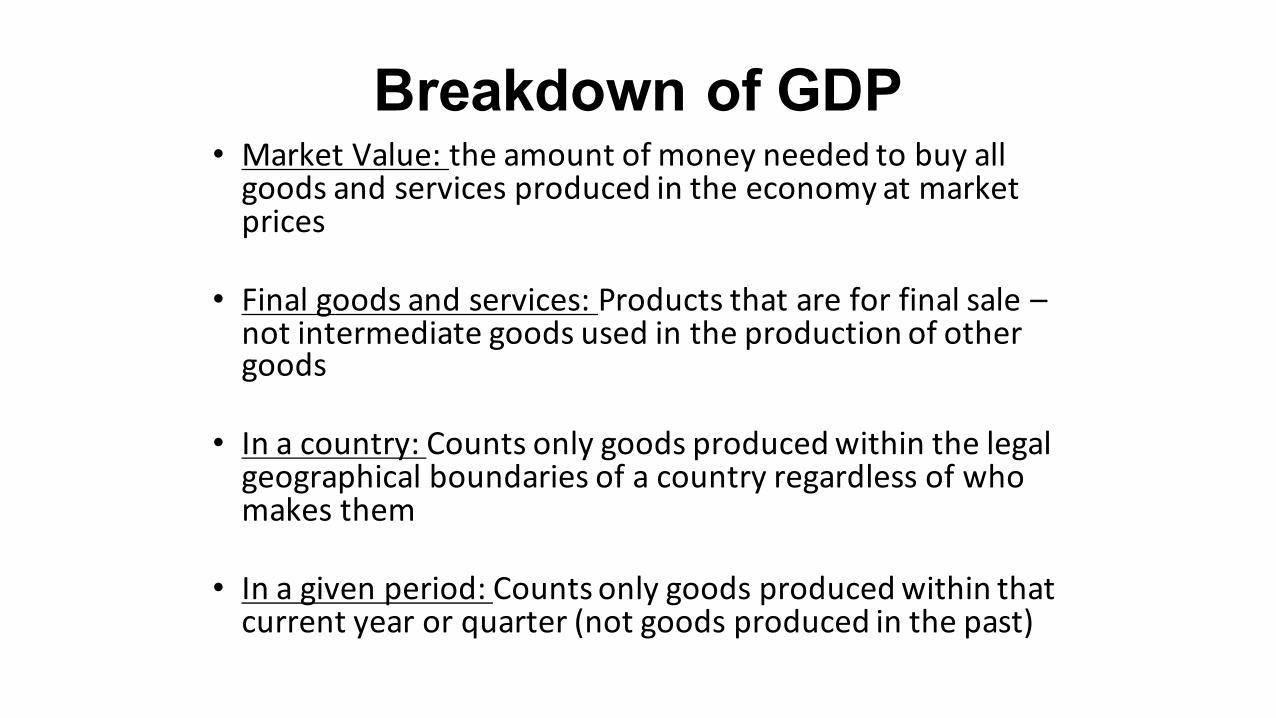
Breakdown of GDP• MarketValue:theamountofmoneyneededtobuyallgoodsandservicesproducedintheeconomyatmarketprices
• Finalgoodsandservices:Productsthatareforfinalsale–notintermediategoodsusedintheproductionofothergoods
• Inacountry:Countsonlygoodsproducedwithinthelegalgeographicalboundariesofacountryregardlessofwhomakesthem
• Inagivenperiod:Countsonlygoodsproducedwithinthatcurrentyearorquarter(notgoodsproducedinthepast)
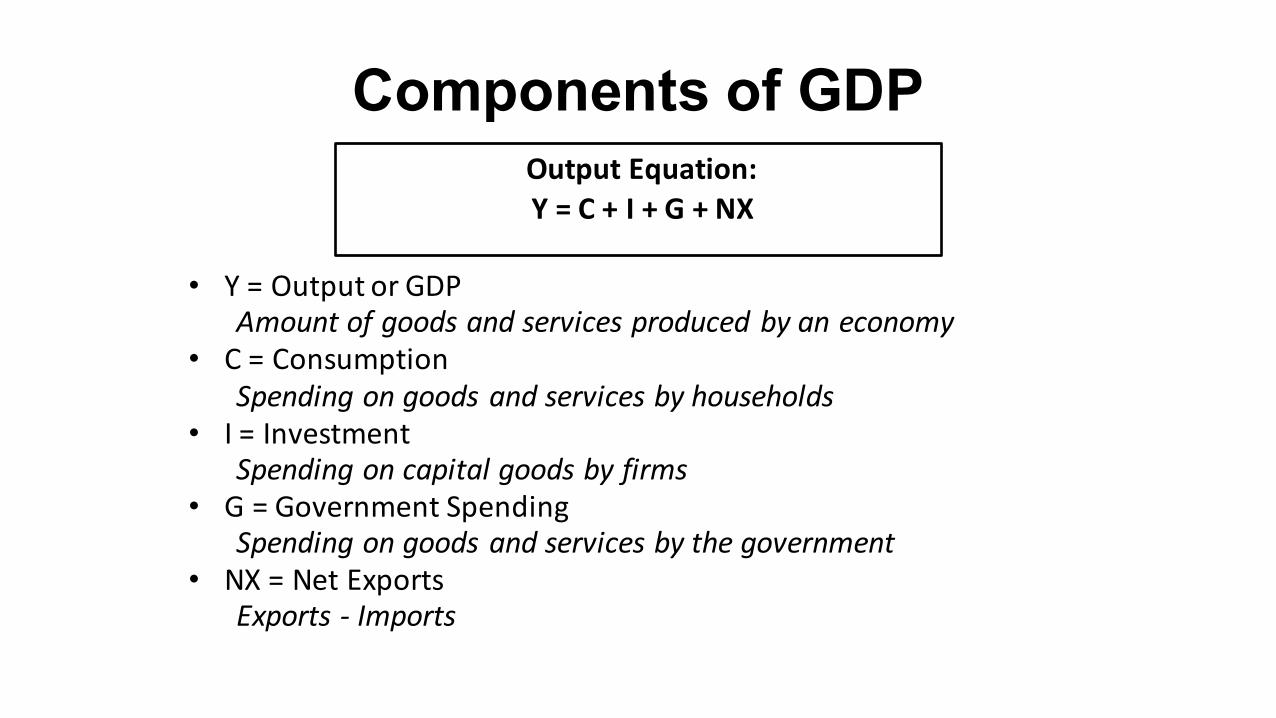
Components of GDPOutputEquation:Y=C+I+G+NX
• Y=OutputorGDPAmountofgoodsandservicesproducedbyaneconomy
• C=ConsumptionSpendingongoodsandservicesbyhouseholds
• I=InvestmentSpendingoncapitalgoodsbyfirms
• G=GovernmentSpendingSpendingongoodsandservicesbythegovernment
• NX=NetExportsExports- Imports
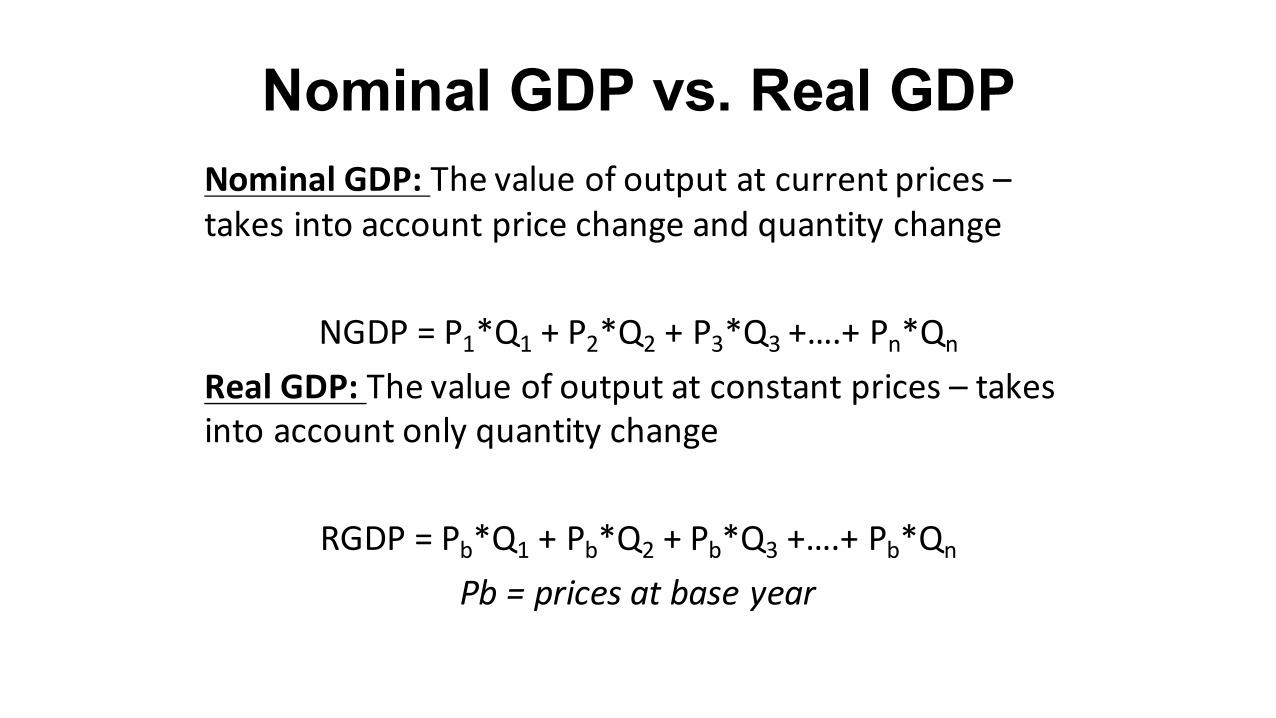
Nominal GDP vs. Real GDPNominalGDP:Thevalueofoutputatcurrentprices–takesintoaccountpricechangeandquantitychange
NGDP=P1*Q1 +P2*Q2 +P3*Q3 +….+Pn*Qn
RealGDP:Thevalueofoutputatconstantprices– takesintoaccountonlyquantitychange
RGDP=Pb*Q1 +Pb*Q2 +Pb*Q3 +….+Pb*Qn
Pb=pricesatbaseyear
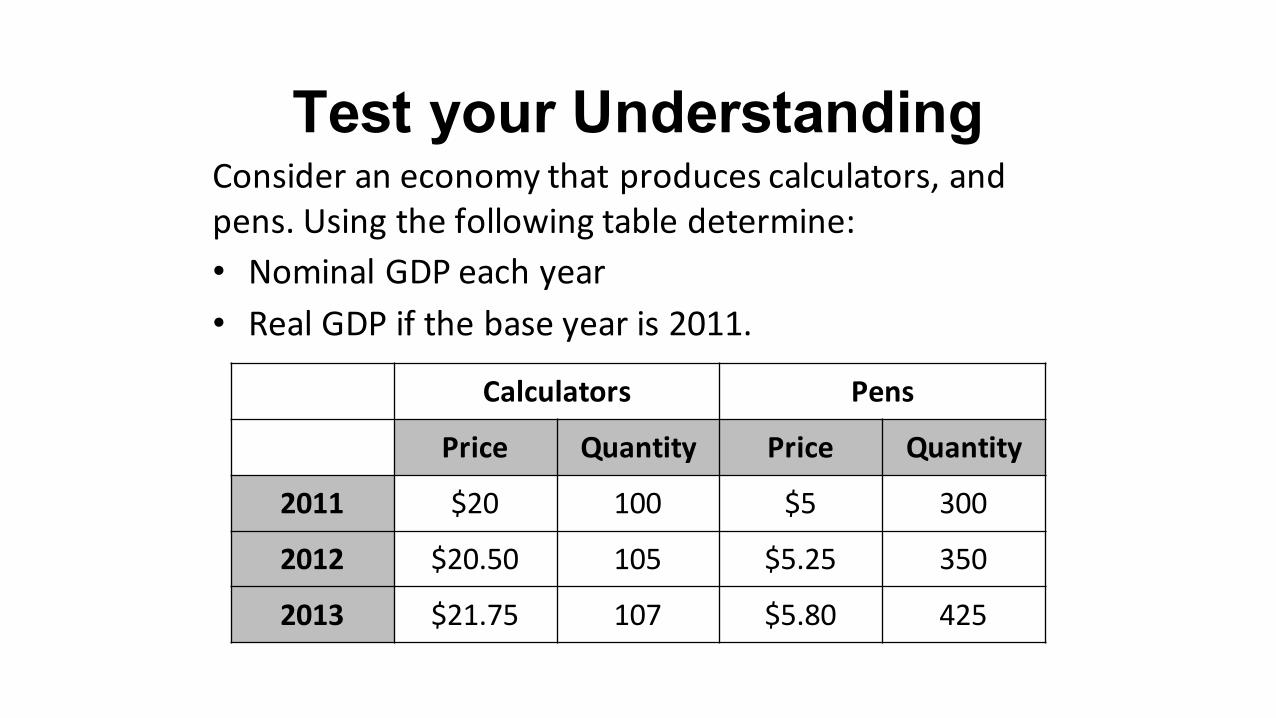
Consideraneconomythatproducescalculators,andpens.Usingthefollowingtabledetermine:• NominalGDPeachyear• RealGDPifthebaseyearis2011.
Calculators Pens
Price Quantity Price Quantity
2011 $20 100 $5 300
2012 $20.50 105 $5.25 350
2013 $21.75 107 $5.80 425
Test your Understanding
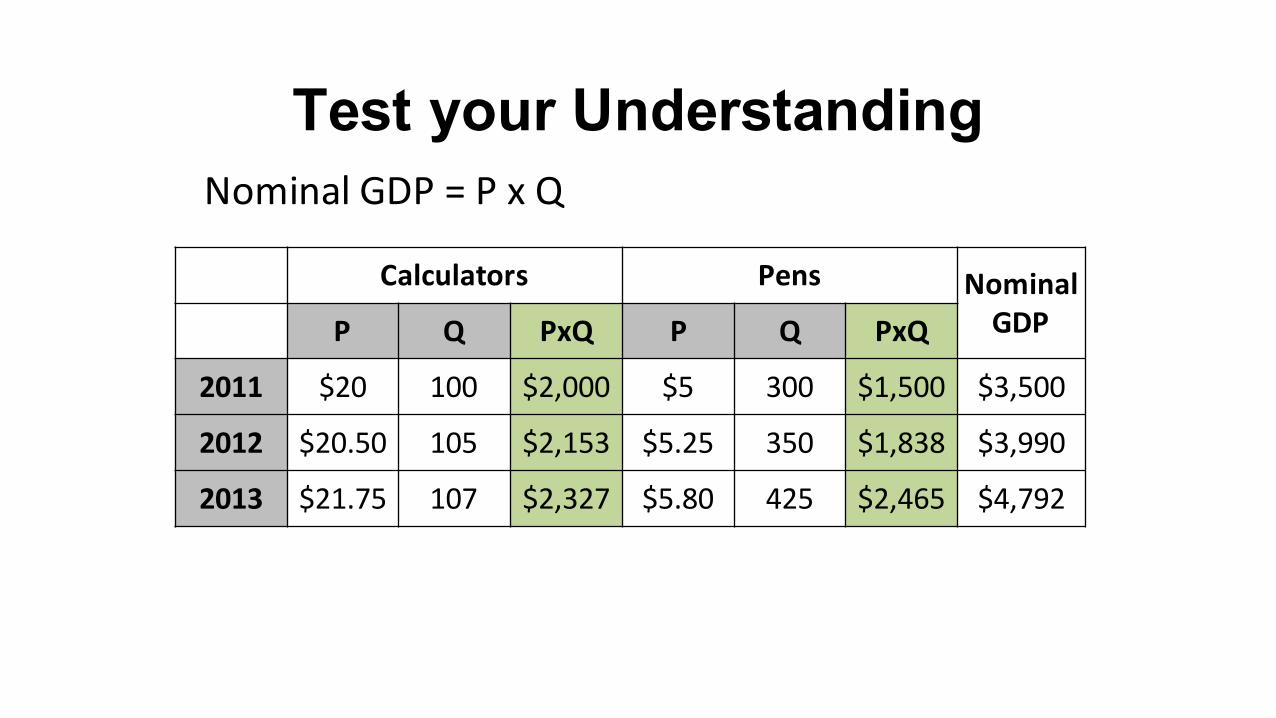
Calculators Pens NominalGDPP Q PxQ P Q PxQ
2011 $20 100 $2,000 $5 300 $1,500 $3,500
2012 $20.50 105 $2,153 $5.25 350 $1,838 $3,990
2013 $21.75 107 $2,327 $5.80 425 $2,465 $4,792
NominalGDP=PxQ
Test your Understanding
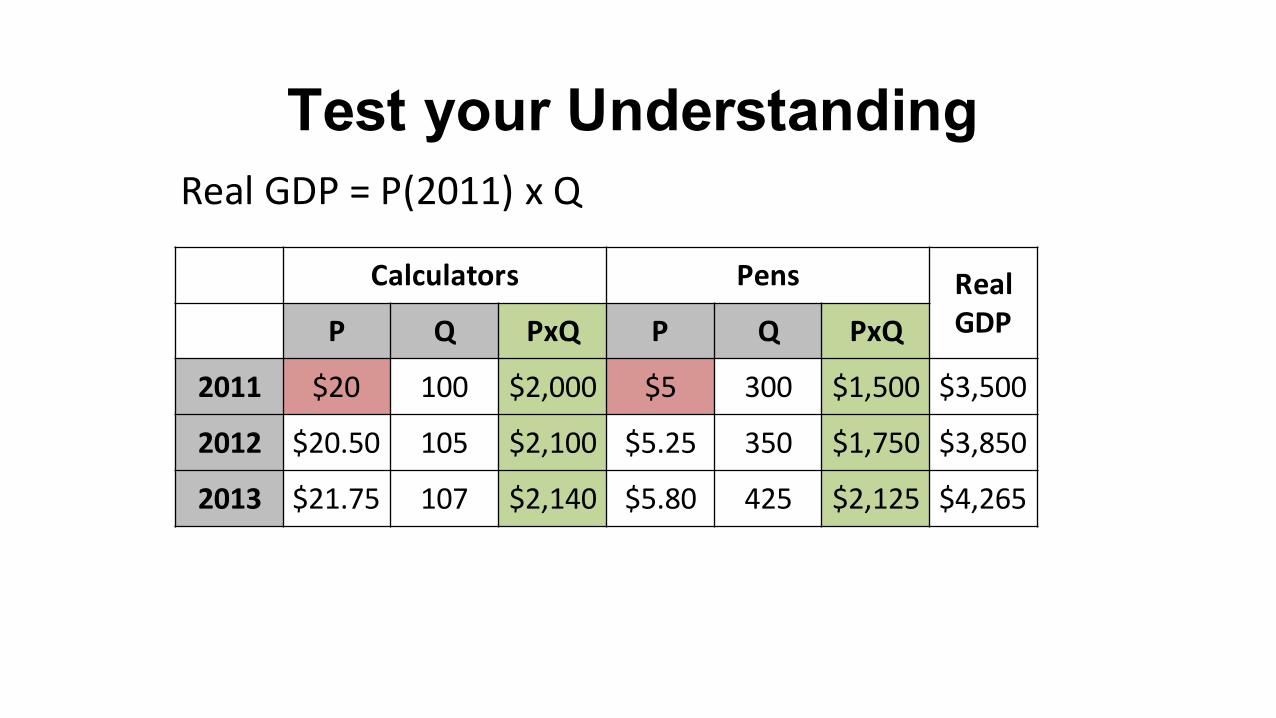
RealGDP=P(2011)xQ
Calculators Pens RealGDPP Q PxQ P Q PxQ
2011 $20 100 $2,000 $5 300 $1,500 $3,500
2012 $20.50 105 $2,100 $5.25 350 $1,750 $3,850
2013 $21.75 107 $2,140 $5.80 425 $2,125 $4,265
Test your Understanding
Change in GDP
• ChangeinnominalGDP– reflectschangesinbothpricesandquantitiesproduced
• ChangeinrealGDP– reflectsonlychangesinquantitiesproducedRealGDPis“corrected”forinflation
Growthinproduction– growthinrealGDP!Incomeandeconomicwellbeing isrising!
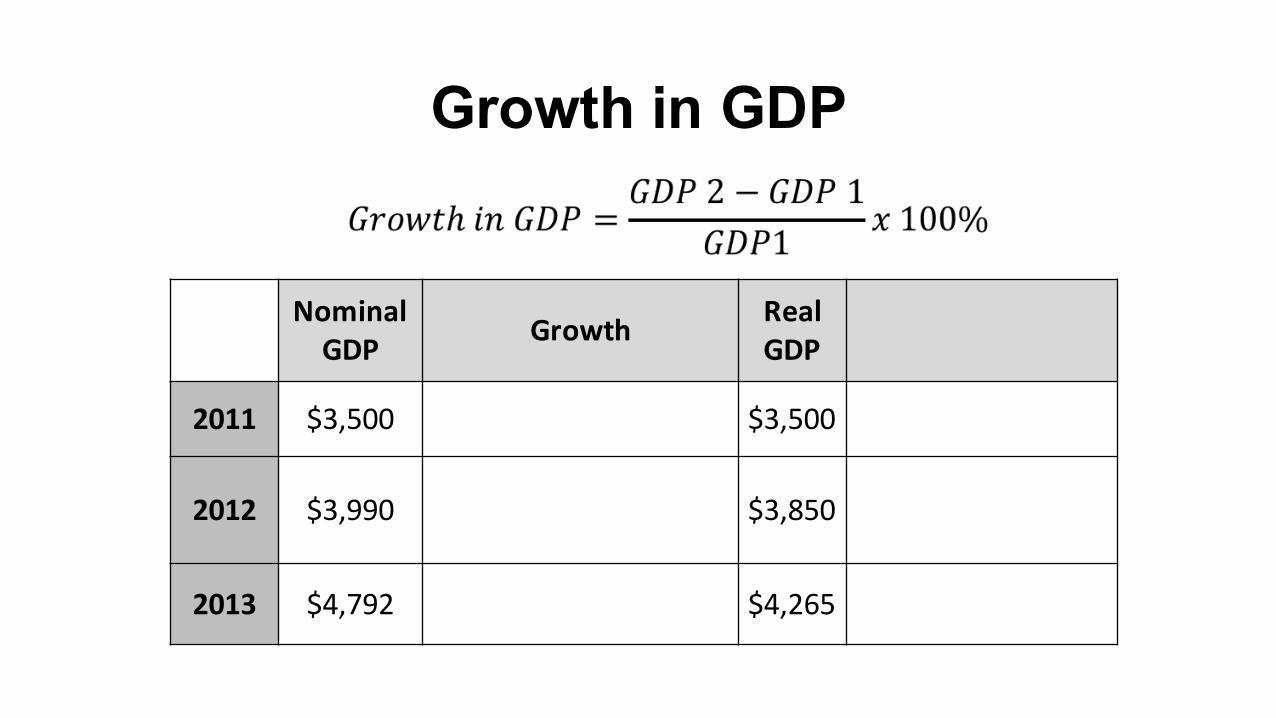
Growth in GDP
NominalGDP Growth Real
GDP
2011 $3,500 $3,500
2012 $3,990 $3,850
2013 $4,792 $4,265
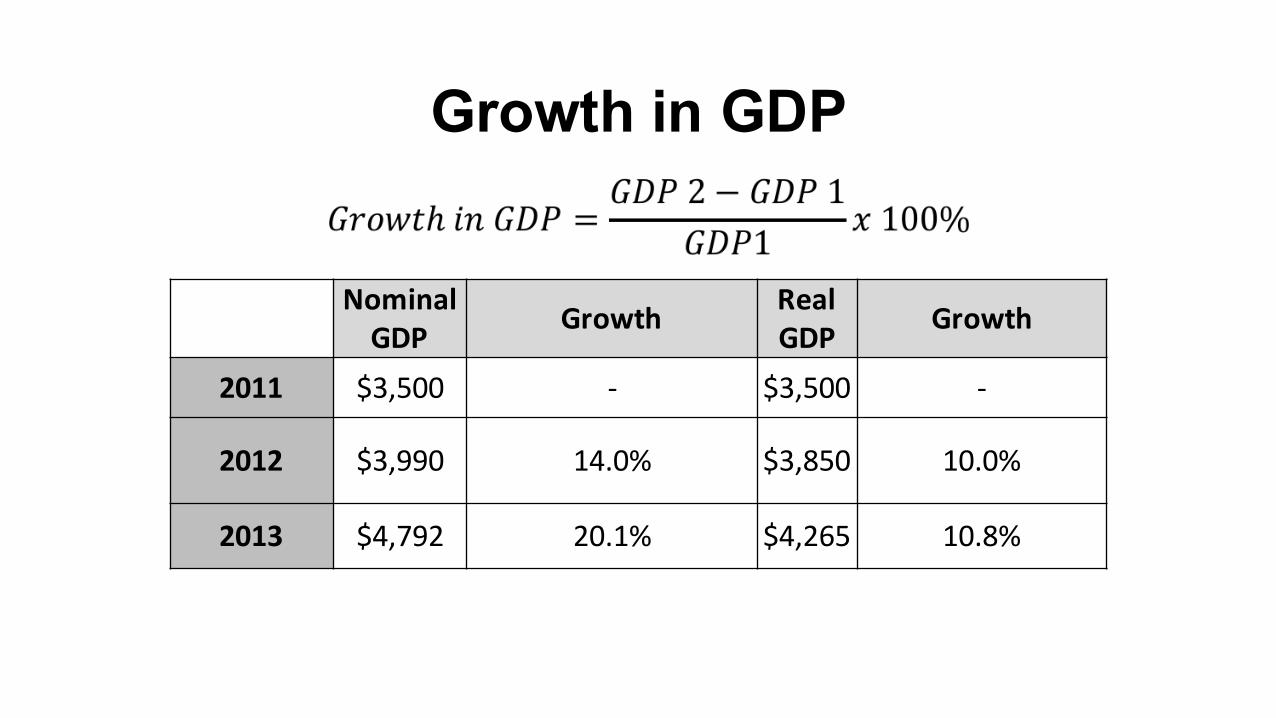
Growth in GDP
NominalGDP Growth Real
GDP Growth
2011 $3,500 - $3,500 -
2012 $3,990 14.0% $3,850 10.0%
2013 $4,792 20.1% $4,265 10.8%
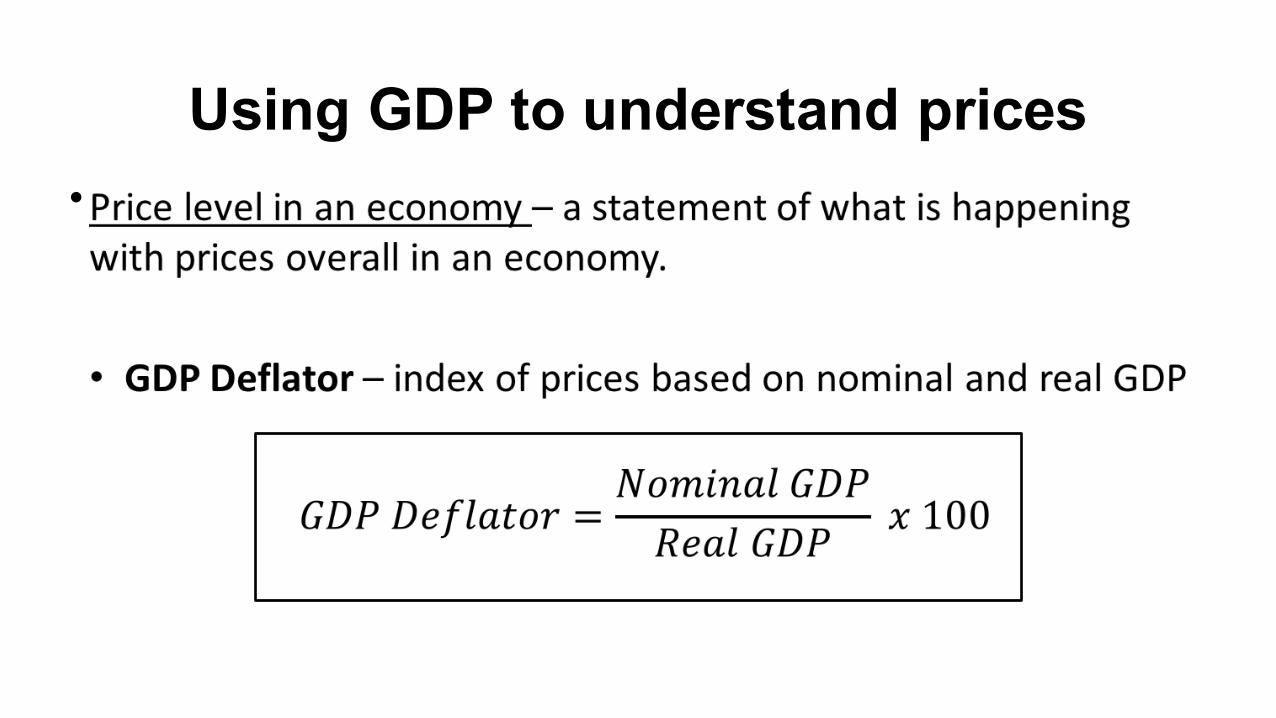
Using GDP to understand prices•
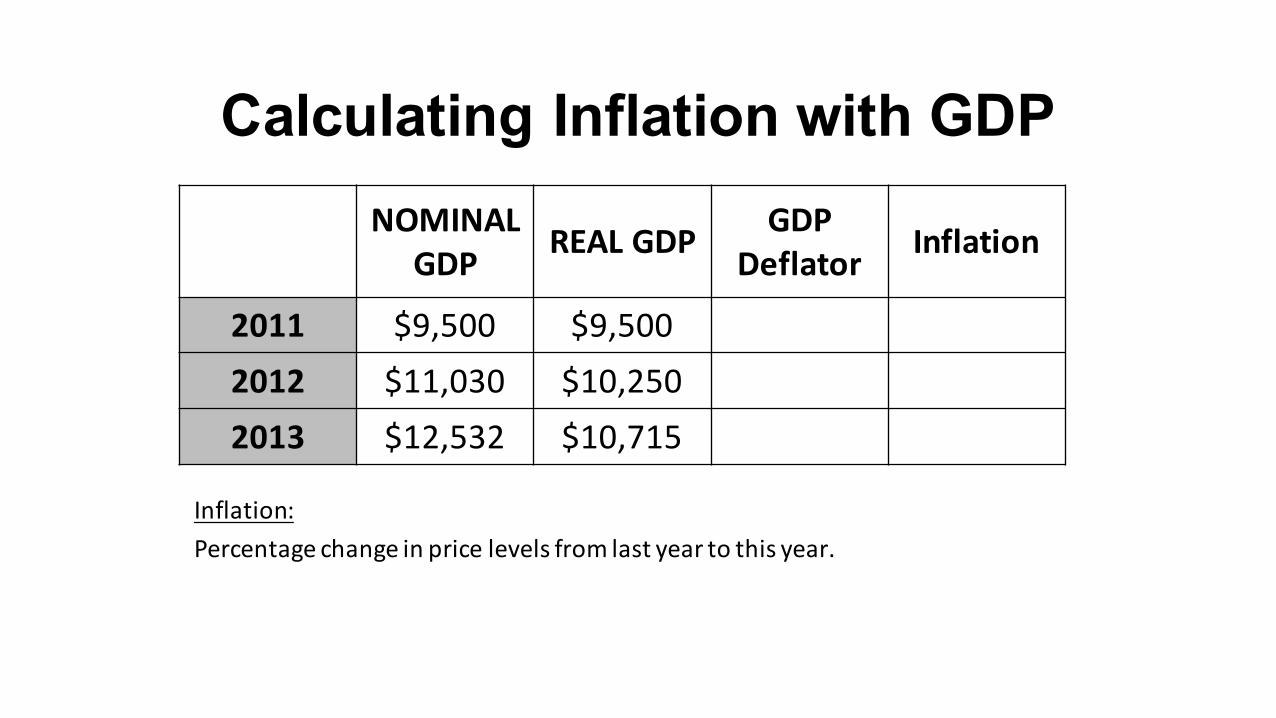
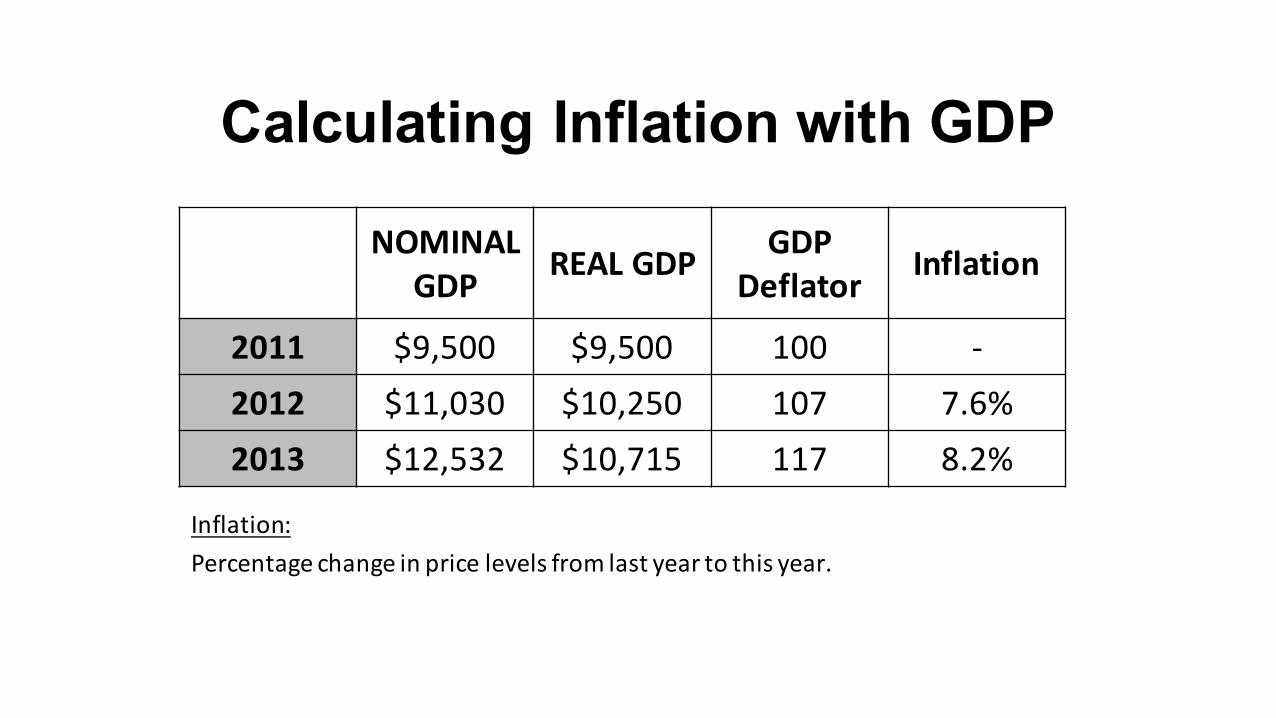
Calculating Inflation with GDP
Inflation:Percentagechangeinpricelevelsfromlastyeartothisyear.
NOMINALGDP REALGDP GDP
Deflator Inflation
2011 $9,500 $9,5002012 $11,030 $10,2502013 $12,532 $10,715

Calculating Inflation with GDP
Inflation:Percentagechangeinpricelevelsfromlastyeartothisyear.
NOMINALGDP REALGDP GDP
Deflator Inflation
2011 $9,500 $9,500 100 -2012 $11,030 $10,2502013 $12,532 $10,715

Calculating Inflation with GDP
Inflation:Percentagechangeinpricelevelsfromlastyeartothisyear.
NOMINALGDP REALGDP GDP
Deflator Inflation
2011 $9,500 $9,500 100 -
2012 $11,030 $10,250 107 7.6%
2013 $12,532 $10,715
Calculating Inflation with GDP
Inflation:Percentagechangeinpricelevelsfromlastyeartothisyear.
NOMINALGDP REALGDP GDP
Deflator Inflation
2011 $9,500 $9,500 100 -2012 $11,030 $10,250 107 7.6%2013 $12,532 $10,715 117 8.2%
Key Takeaways• GDPisoneofthemostimportantmeasuresusedbyeconomiststogaugewhatis
happeningwiththeeconomy
• Itaccountsforconsumption,investment,governmentspendingandnetexports
• RealGDPcontrolsforchangingpriceswhilenominalGDPiscalculatedusingactualpricesobservedintheeconomyinthatyear

PrinciplesofMacroeconomicsModule2.2
Measuring the Cost of Living Inflation, CPI, and Prices
Cost of Living• Anothermeasureofwhatishappeningintheeconomyisthecostofliving
• Pricesofmanygoodsandserviceschangeindifferentdirections– someincrease,somedecrease,somestaythesame
• Whenthemajorityofpricesincrease– inflation!Useapriceindextomeasureoverallpricesinan
economy
TheConsumerPriceIndex(CPI)• Measuresthetypicalconsumer’scostofliving
• CPIismadeupofafixedbasketofgoodswhosepriceschangeyearoveryear
• Thechangeinpricesforthebasketofgoodsindicatesinflation
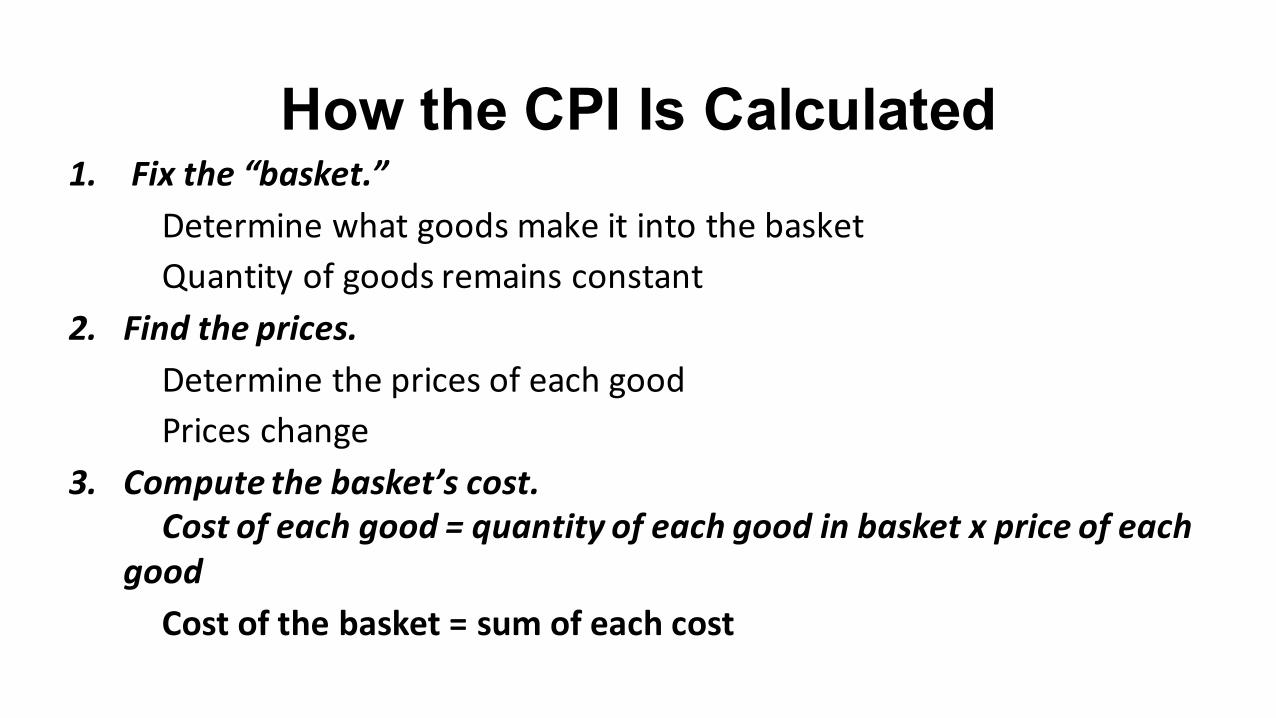
How the CPI Is Calculated1. Fixthe“basket.”
DeterminewhatgoodsmakeitintothebasketQuantityofgoodsremainsconstant
2. Findtheprices.DeterminethepricesofeachgoodPriceschange
3. Computethebasket’scost.Costofeachgood=quantityofeachgoodinbasketxpriceofeach
goodCostofthebasket=sumofeachcost
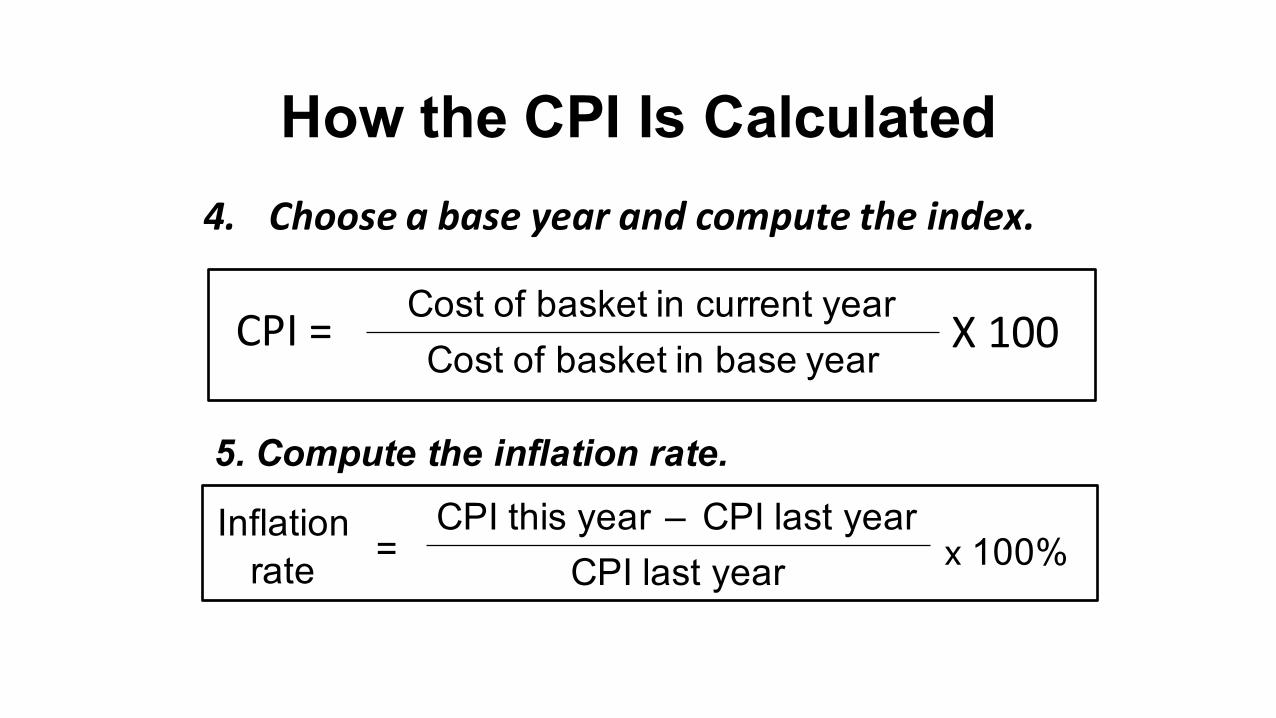
How the CPI Is Calculated4. Chooseabaseyearandcomputetheindex.
5. Compute the inflation rate.
Cost of basket in current yearCost of basket in base year
CPI this year – CPI last yearCPI last year
Inflationrate x 100%=
X100CPI=
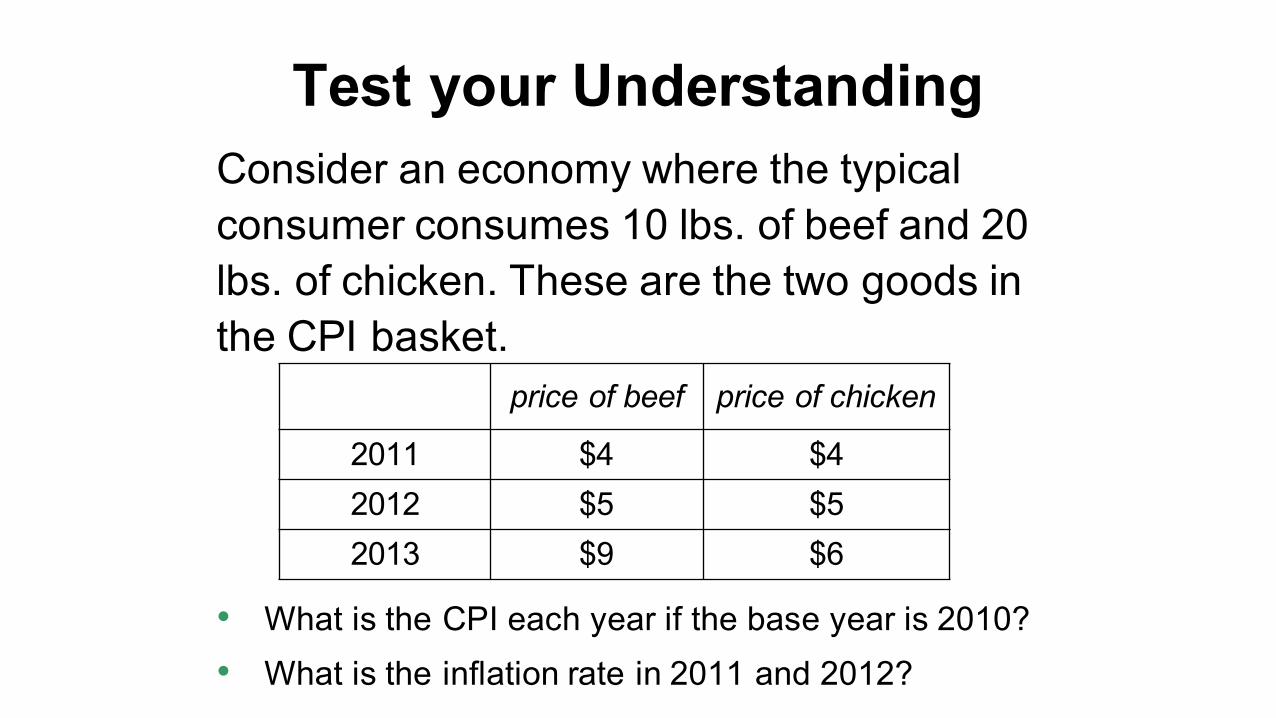
Consider an economy where the typical consumer consumes 10 lbs. of beef and 20 lbs. of chicken. These are the two goods in the CPI basket.
• What is the CPI each year if the base year is 2010?• What is the inflation rate in 2011 and 2012?
price of beef price of chicken
2011 $4 $42012 $5 $52013 $9 $6
Test your Understanding
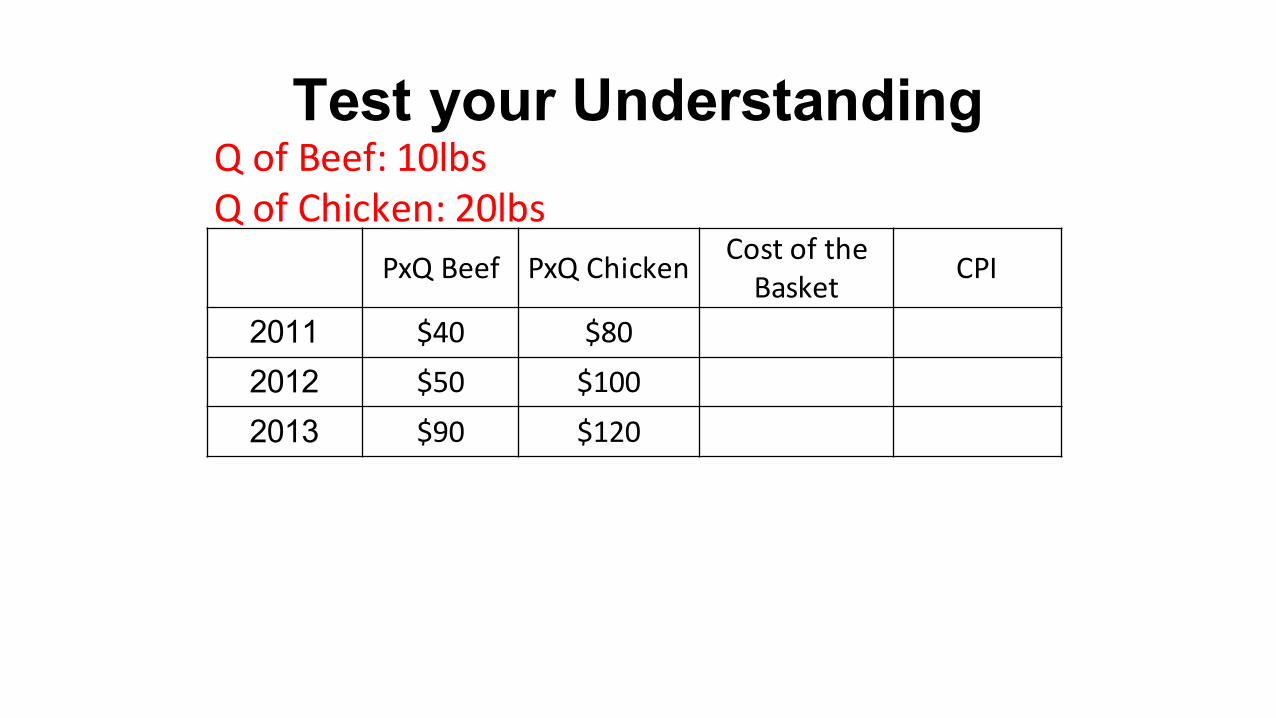
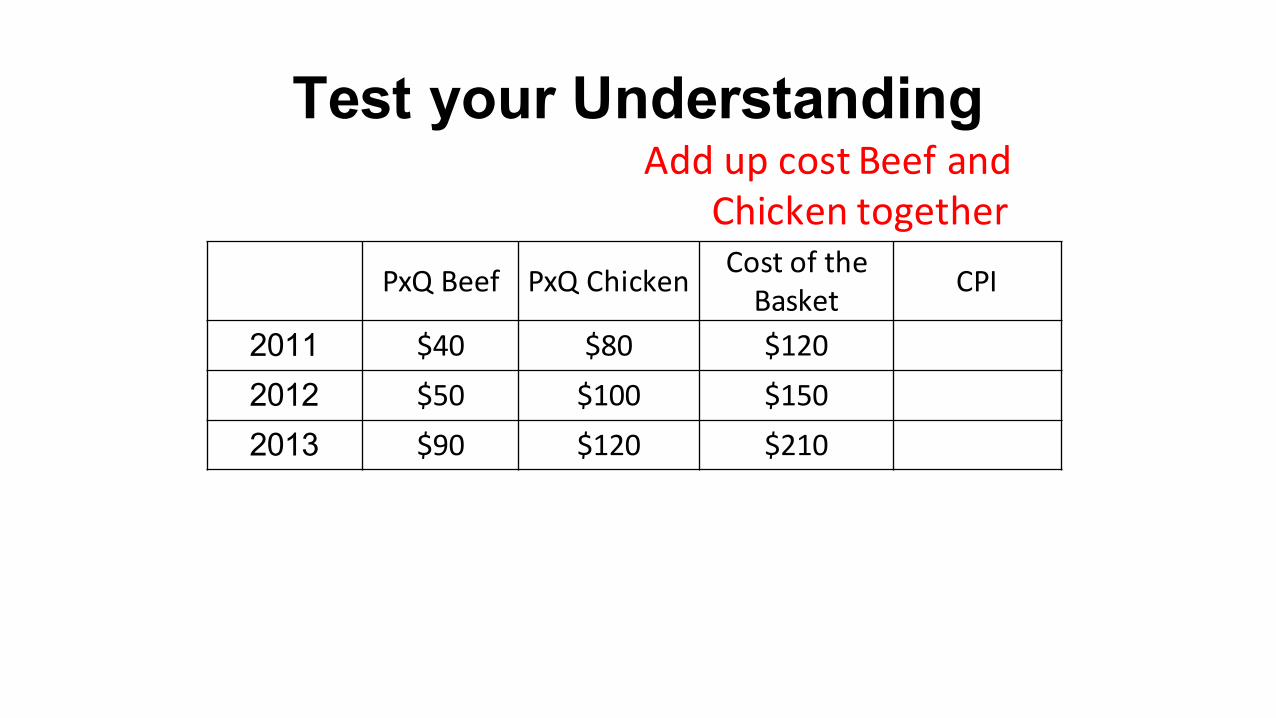
Test your Understanding
PxQBeef PxQChicken CostoftheBasket CPI
2011 $40 $802012 $50 $1002013 $90 $120
QofBeef:10lbsQofChicken:20lbs
Test your Understanding
PxQBeef PxQChicken CostoftheBasket CPI
2011 $40 $80 $1202012 $50 $100 $1502013 $90 $120 $210
AddupcostBeefandChickentogether
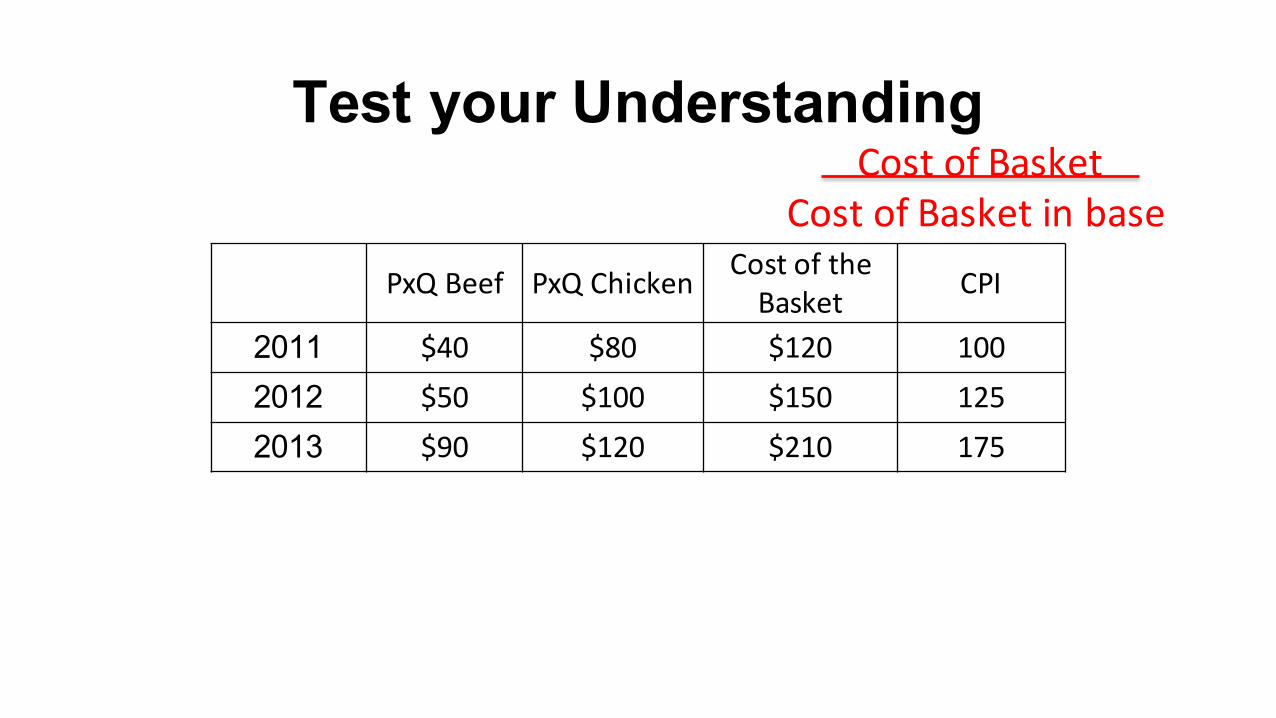
Test your Understanding
PxQBeef PxQChicken CostoftheBasket CPI
2011 $40 $80 $120 1002012 $50 $100 $150 1252013 $90 $120 $210 175
CostofBasketCostofBasketinbase
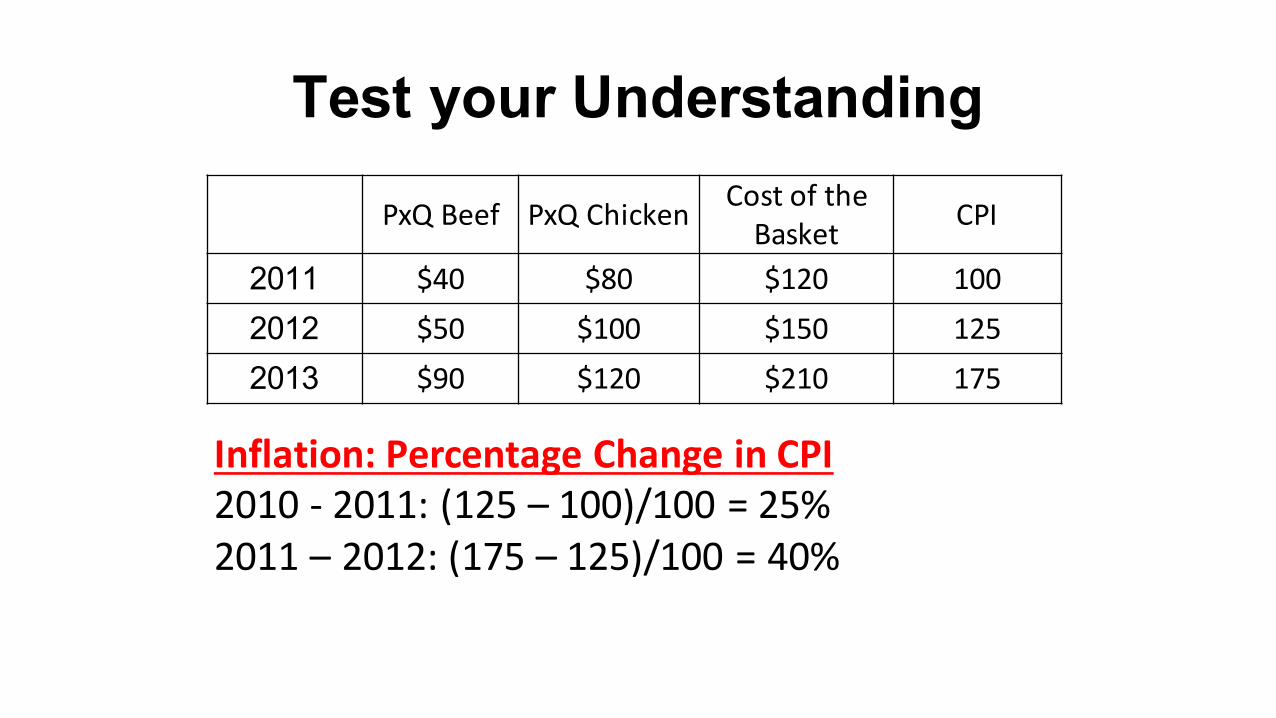
Test your Understanding
PxQBeef PxQChicken CostoftheBasket CPI
2011 $40 $80 $120 1002012 $50 $100 $150 1252013 $90 $120 $210 175
Inflation:PercentageChangeinCPI2010- 2011:(125– 100)/100=25%2011– 2012:(175– 125)/100=40%
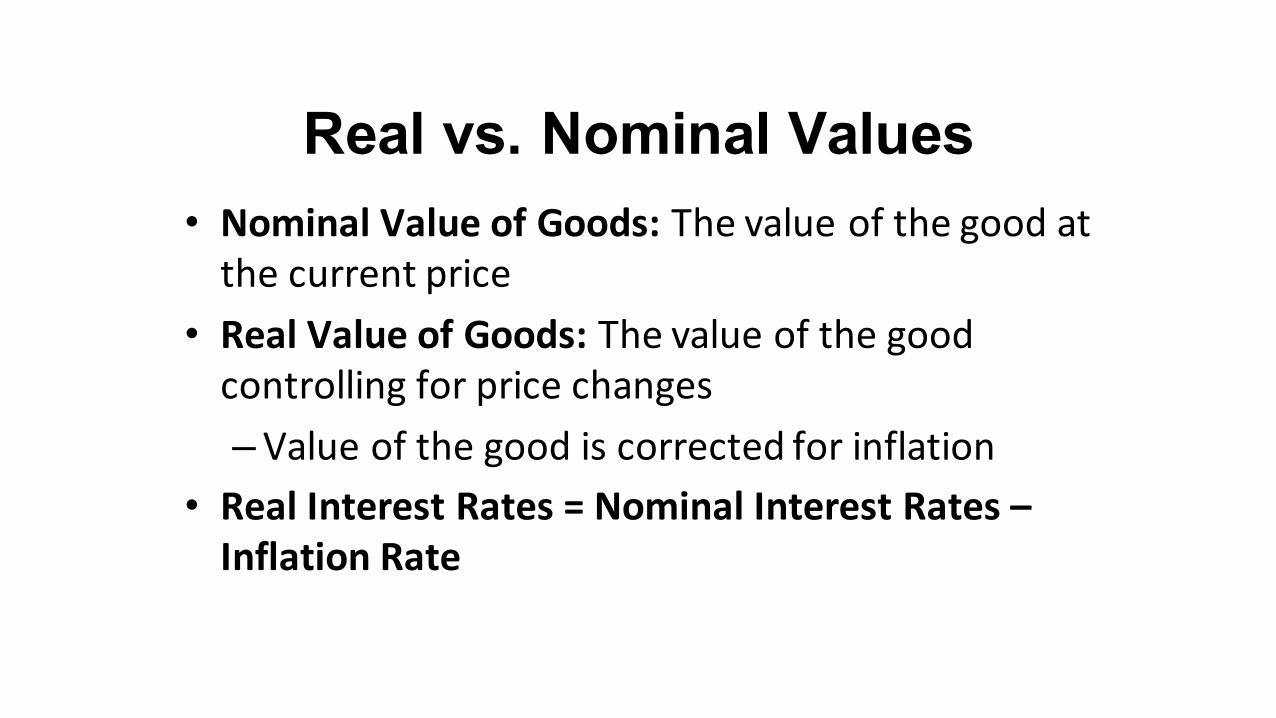
Real vs. Nominal Values• NominalValueofGoods:Thevalueofthegoodatthecurrentprice
• RealValueofGoods:Thevalueofthegoodcontrollingforpricechanges–Valueofthegoodiscorrectedforinflation
• RealInterestRates=NominalInterestRates–InflationRate
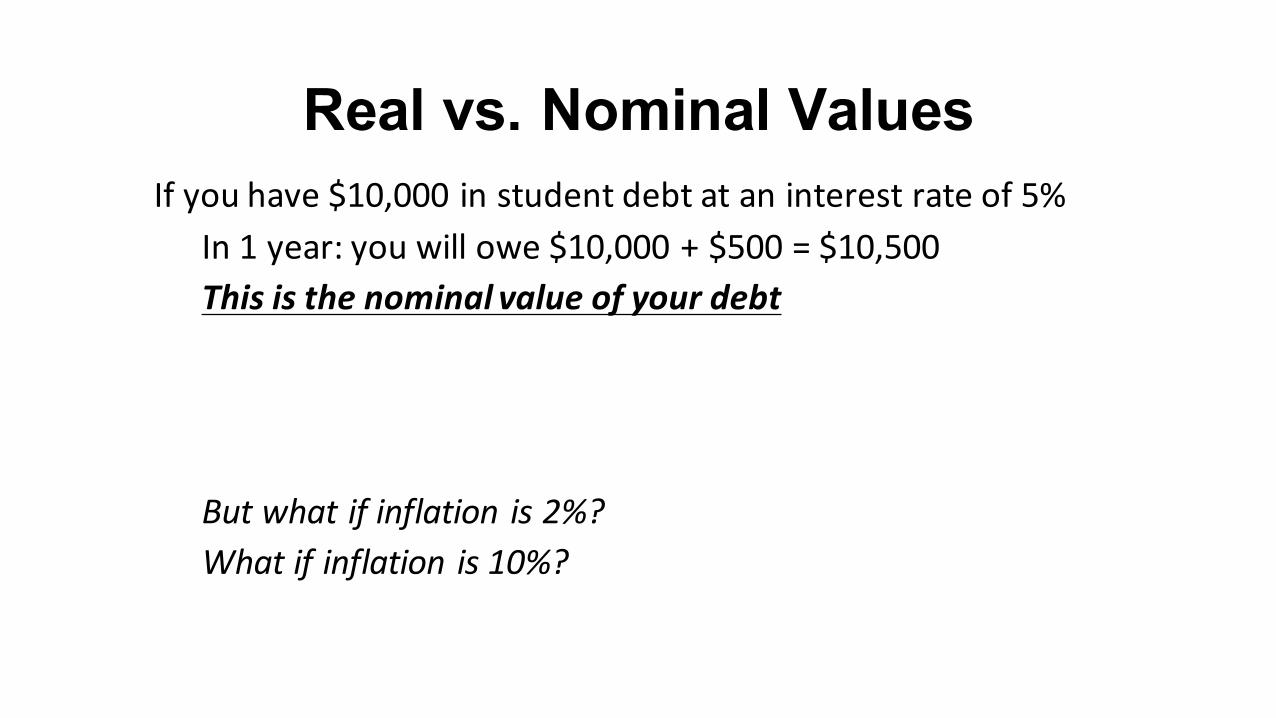
Real vs. Nominal ValuesIfyouhave$10,000instudentdebtataninterestrateof5%
In1year:youwillowe$10,000+$500=$10,500Thisisthenominalvalueofyourdebt
Butwhatifinflation is2%?Whatifinflation is10%?
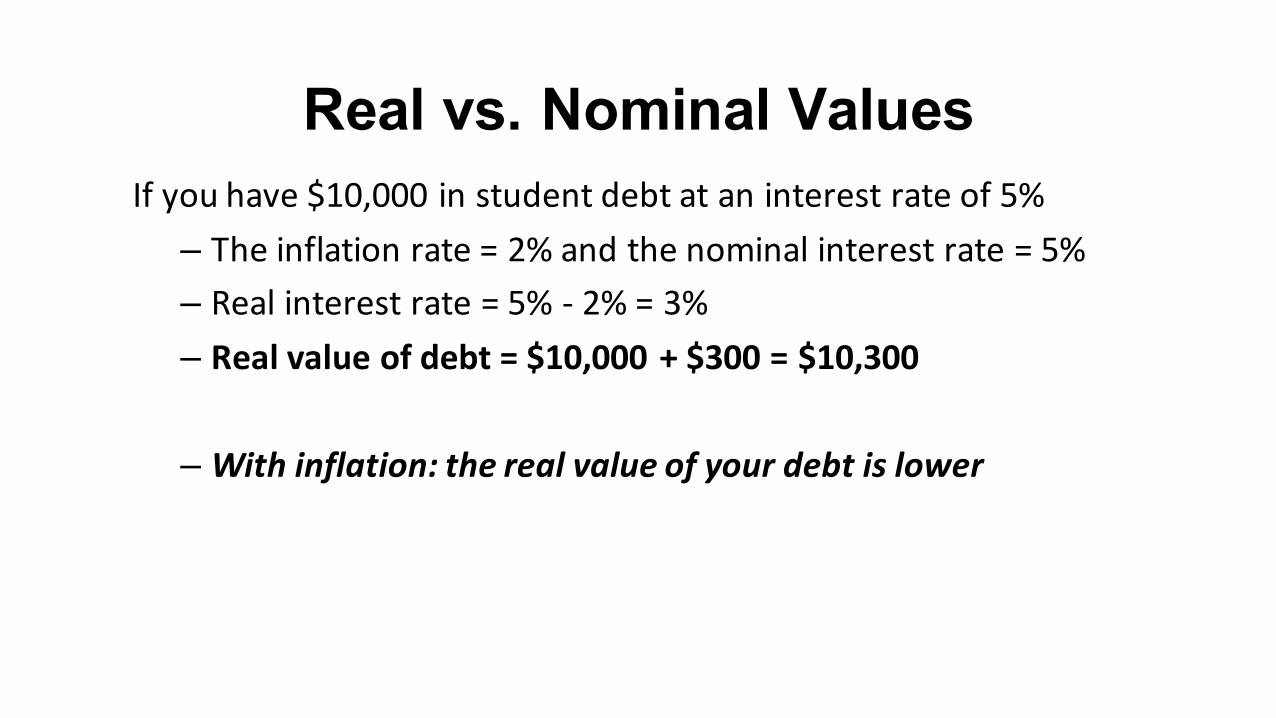
Real vs. Nominal ValuesIfyouhave$10,000instudentdebtataninterestrateof5%
– Theinflationrate=2%andthenominalinterestrate=5%– Realinterestrate=5%- 2%=3%– Realvalueofdebt=$10,000+$300=$10,300
– Withinflation:therealvalueofyourdebtislower
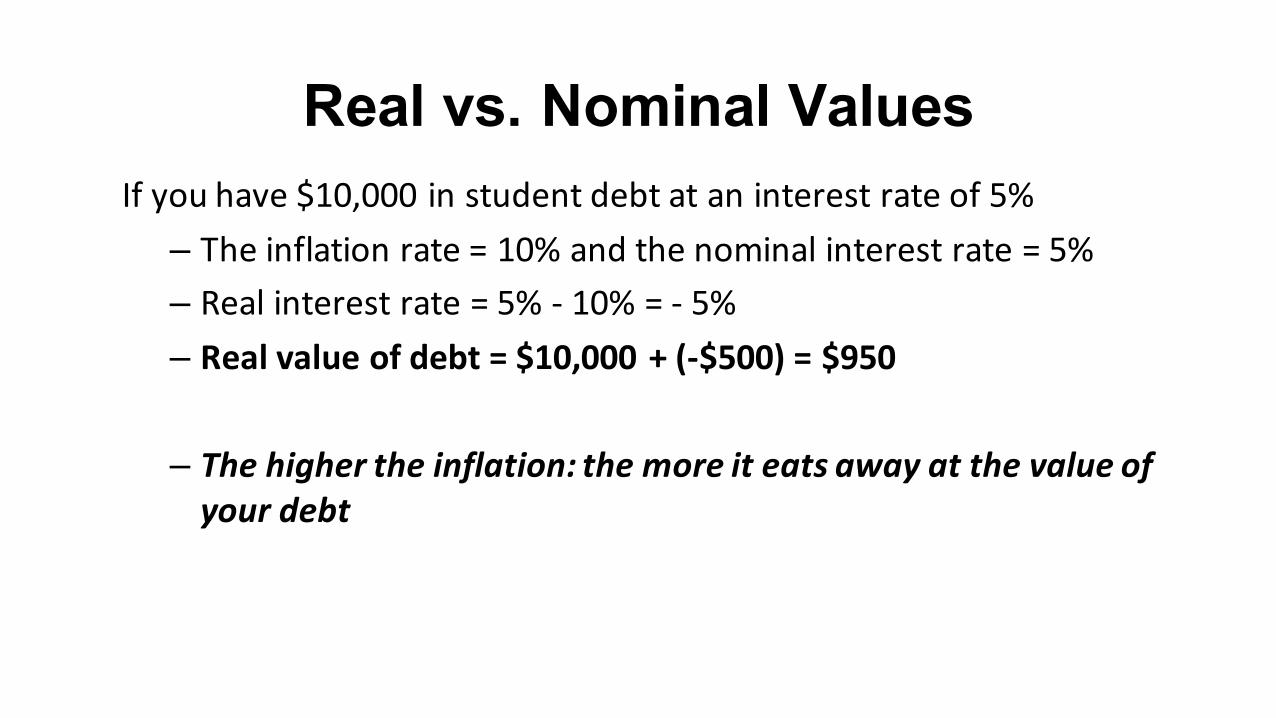
Real vs. Nominal ValuesIfyouhave$10,000instudentdebtataninterestrateof5%
– Theinflationrate=10%andthenominalinterestrate=5%– Realinterestrate=5%- 10%=- 5%– Realvalueofdebt=$10,000+(-$500)=$950
– Thehighertheinflation:themoreiteatsawayatthevalueofyourdebt
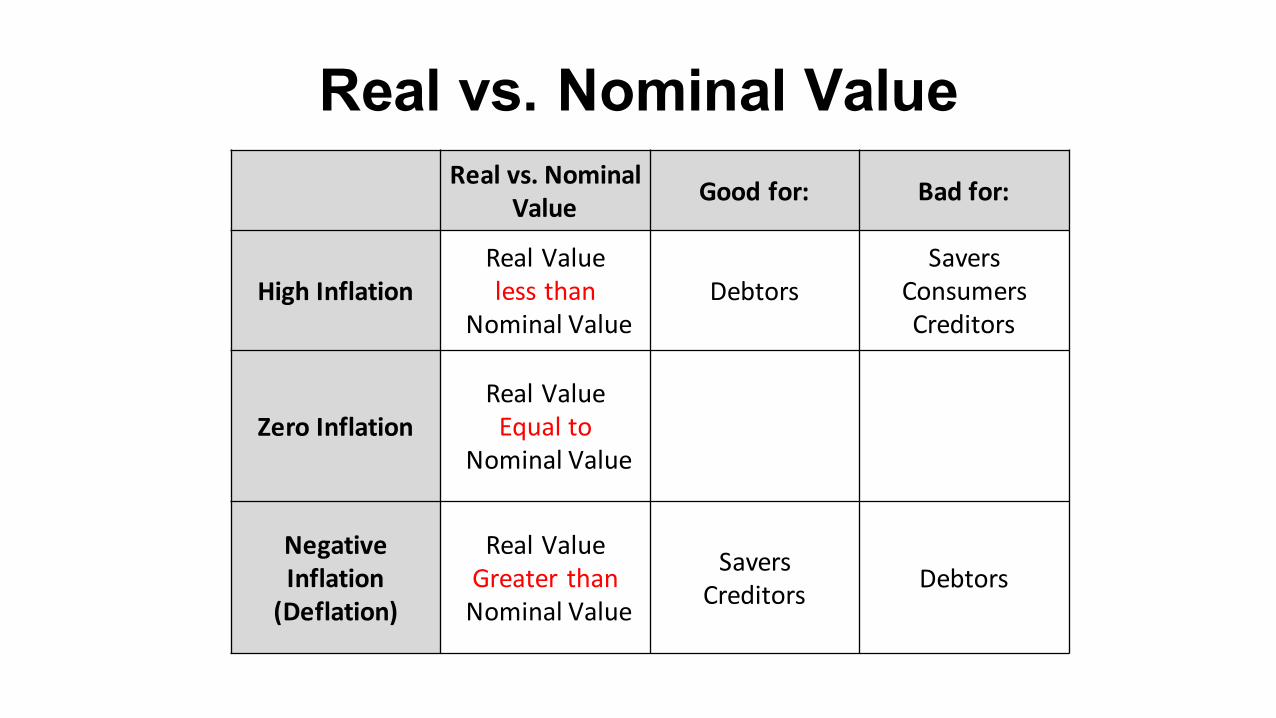
Real vs. Nominal ValueRealvs.Nominal
Value Goodfor: Badfor:
HighInflationRealValuelessthan
NominalValueDebtors
SaversConsumersCreditors
ZeroInflationRealValueEqualto
NominalValue
NegativeInflation(Deflation)
RealValueGreater thanNominalValue
SaversCreditors Debtors
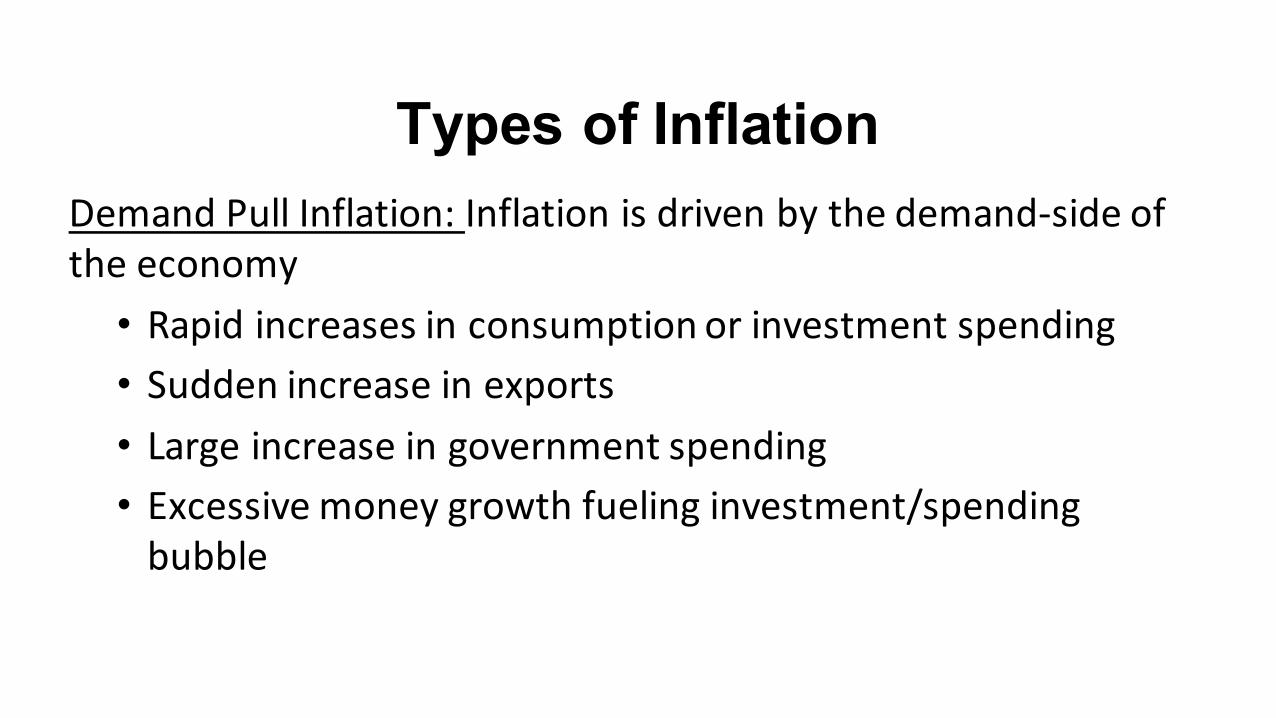
Types of InflationDemandPullInflation:Inflationisdrivenbythedemand-sideoftheeconomy
• Rapidincreasesinconsumptionorinvestmentspending• Suddenincreaseinexports• Largeincreaseingovernmentspending• Excessivemoneygrowthfuelinginvestment/spendingbubble
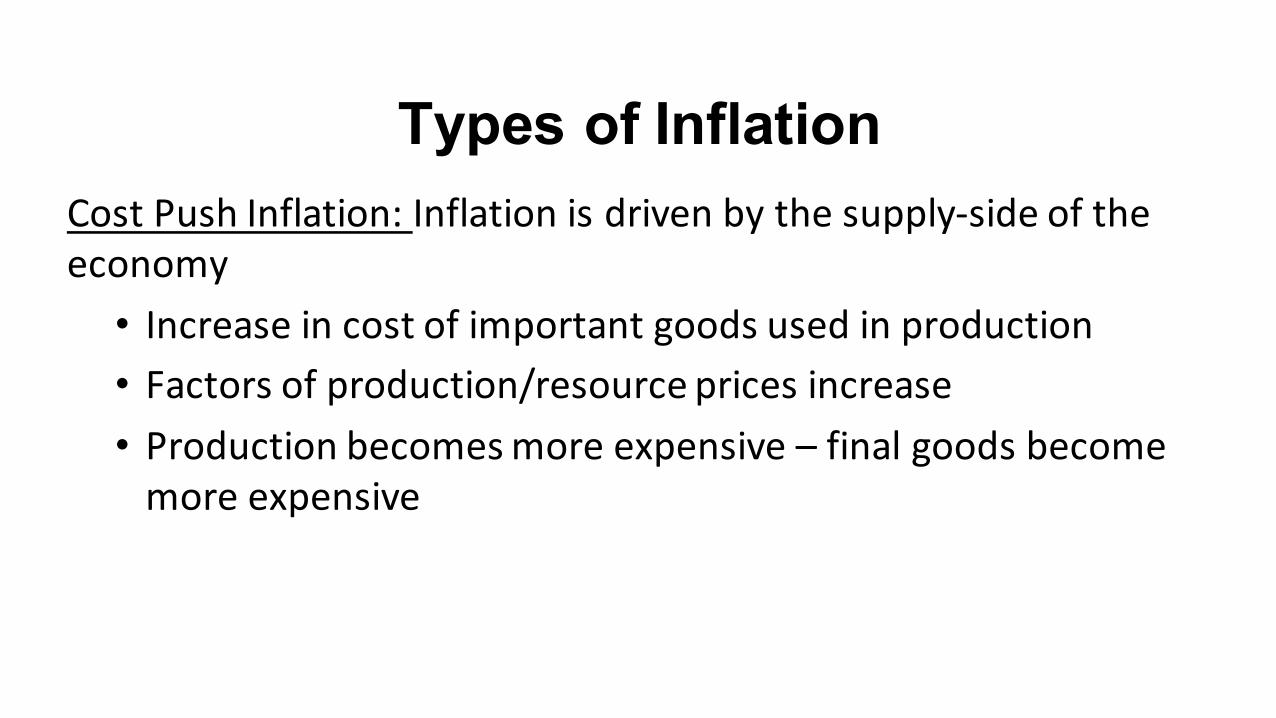
Types of InflationCostPushInflation:Inflationisdrivenbythesupply-sideoftheeconomy
• Increaseincostofimportantgoodsusedinproduction• Factorsofproduction/resourcepricesincrease• Productionbecomesmoreexpensive– finalgoodsbecomemoreexpensive
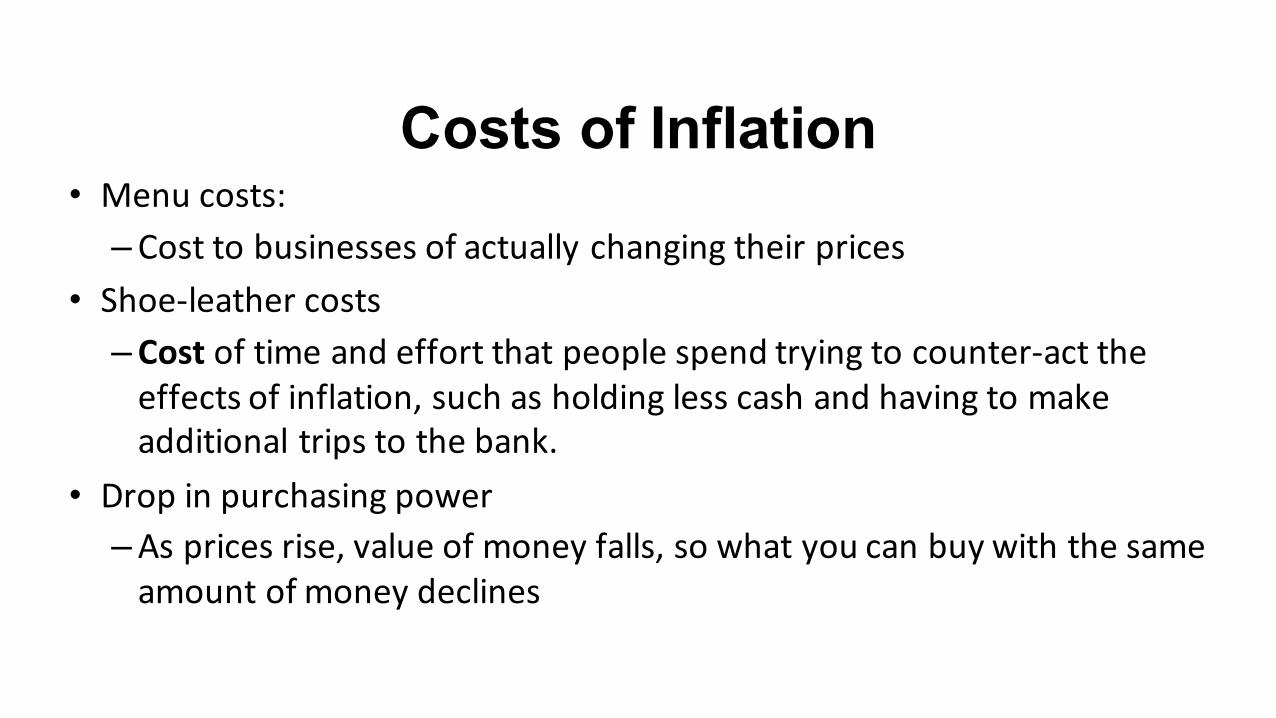
Costs of Inflation• Menucosts:
–Costtobusinessesofactuallychangingtheirprices• Shoe-leathercosts
–Cost oftimeandeffortthatpeoplespendtryingtocounter-acttheeffectsofinflation,suchasholdinglesscashandhavingtomakeadditionaltripstothebank.
• Dropinpurchasingpower–Aspricesrise,valueofmoneyfalls,sowhatyoucanbuywiththesameamountofmoneydeclines
Key Takeaways• TheCPIshowsthecostofabasketofgoodsandservicesthatmostconsumerspurchase.
• Thoughimperfect,itprovidesadecentreflectiononthecostoflivinginacountryandhowitchanges
• Withthepriceindex(CPIorGDPdeflator)wecancalculateinflationandadjustforthevalueofgoodsovertime

PrinciplesofMacroeconomicsModule2.3
Unemployment
93
UnderstandingtheLaborMarket
• Thelabormarketreflectsthenumberofjobsandnumberofworkersinaneconomy
• Ifthereisamismatch,shortfall,ordifferencebetweenworkersandjobsavailable,theeconomyexperiencesunemployment
• Twotypesofunemployment– cyclical(whatisactuallyreported)andnatural(estimated)
94
LaborForceStatistics
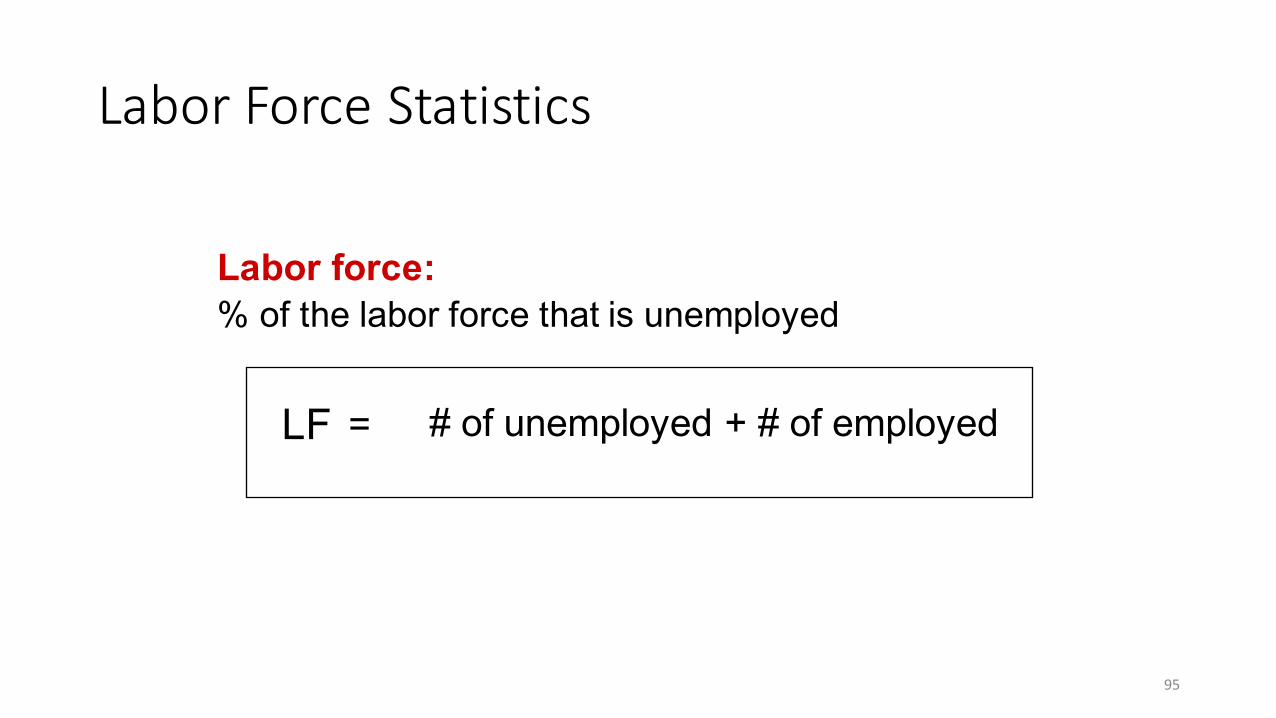
Labor force:% of the labor force that is unemployed
LF # of unemployed + # of employed =
95
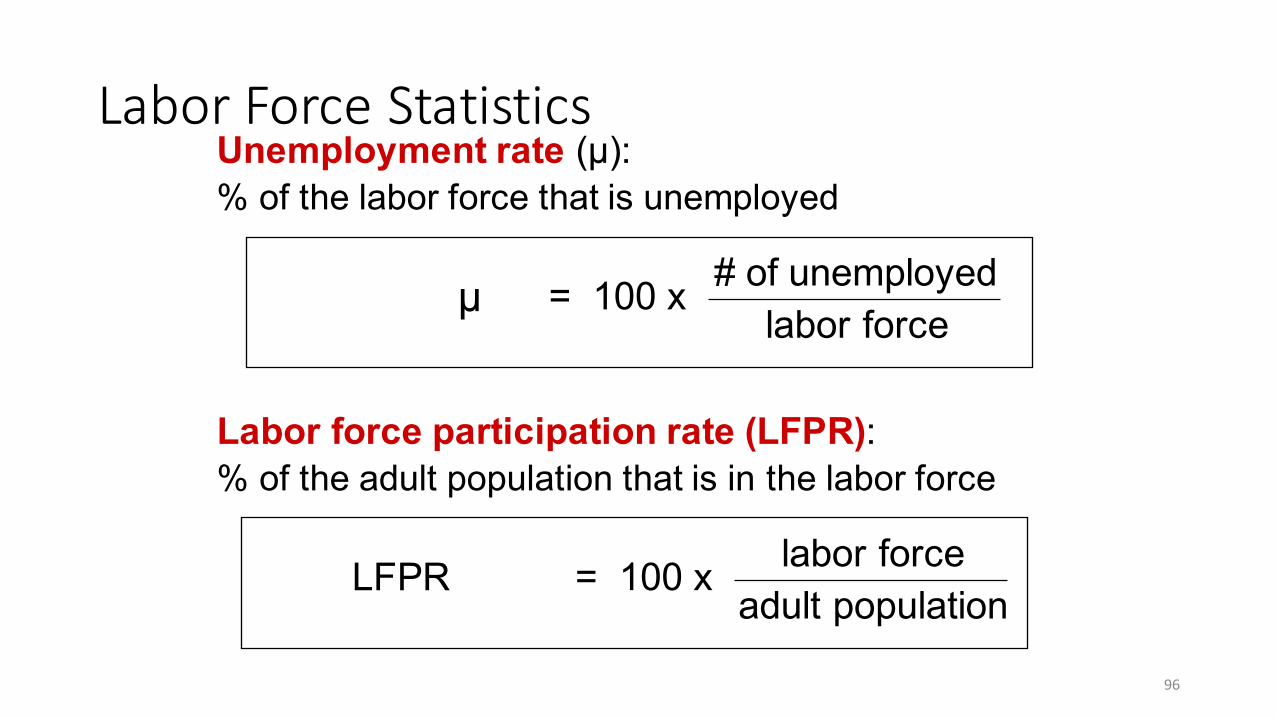
LFPR labor forceadult population
= 100 x
LaborForceStatistics
Labor force participation rate (LFPR): % of the adult population that is in the labor force
Unemployment rate (μ): % of the labor force that is unemployed
μ # of unemployedlabor force
= 100 x
96
Country
AdultPopulation
LaborForce
EmployedPeople
UnemployedPeople
UnemploymentRate
Labor-ForceParticipationRate
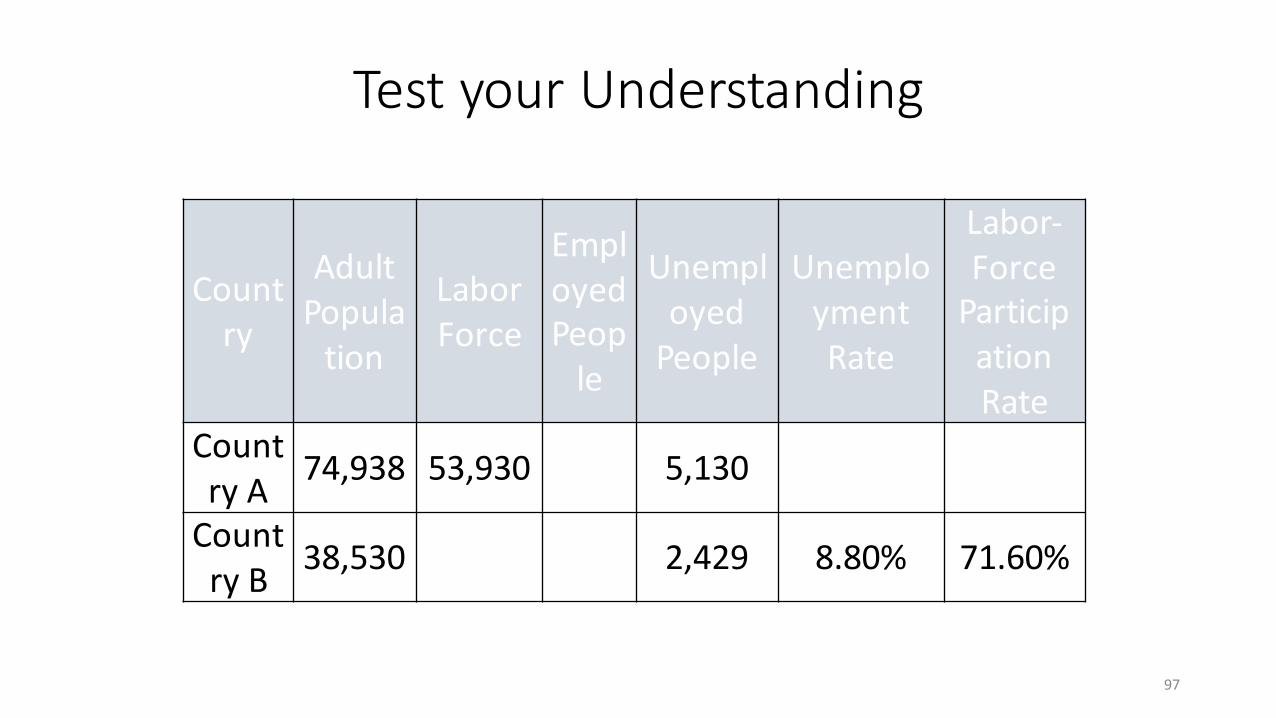
CountryA
74,938 53,930 5,130
CountryB
38,530 2,429 8.80% 71.60%
97
TestyourUnderstanding
CountryAdult
PopulationLaborForce
EmployedPeople
UnemployedPeople
UnemploymentRate
Labor-ForceParticipation
Rate
CountryA 74,938 53,930 48,800 5,130 9.51% 72.00%
CountryB 38,530 27,600 25,171 2,429 8.80% 71.60%
98
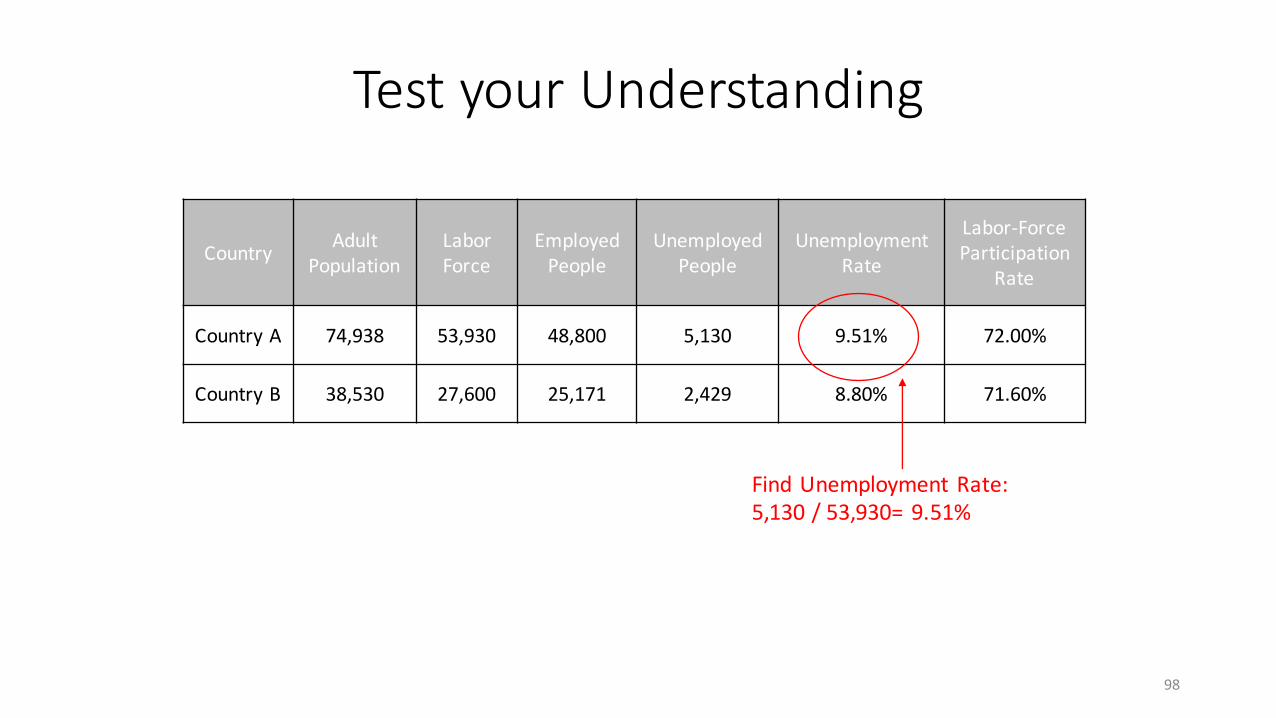
TestyourUnderstanding
FindUnemploymentRate:5,130/53,930=9.51%
CountryAdult
PopulationLaborForce
EmployedPeople
UnemployedPeople
UnemploymentRate
Labor-ForceParticipation
Rate
CountryA 74,938 53,930 48,800 5,130 9.51% 72.00%
CountryB 38,530 27,600 25,171 2,429 8.80% 71.60%
99
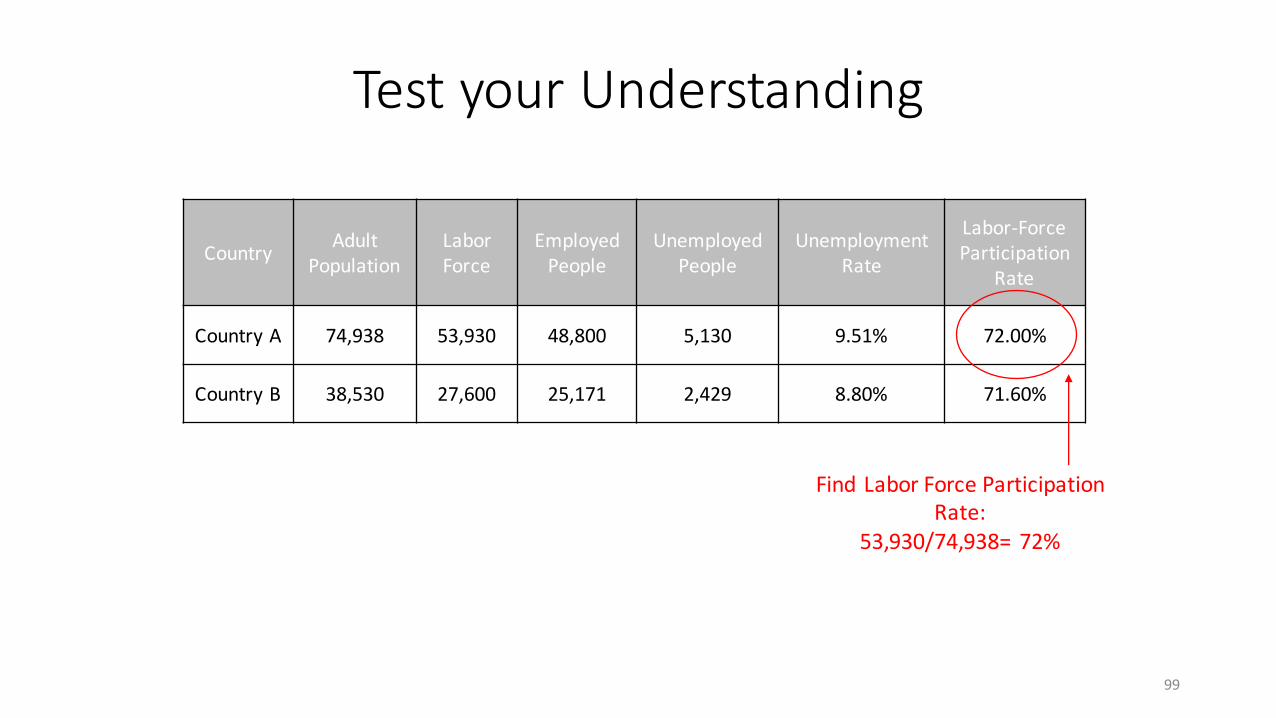
TestyourUnderstanding
FindLaborForceParticipationRate:
53,930/74,938=72%
CountryAdult
PopulationLaborForce
EmployedPeople
UnemployedPeople
UnemploymentRate
Labor-ForceParticipation
Rate
CountryA 74,938 53,930 48,800 5,130 9.51% 72.00%
CountryB 38,530 27,600 25,171 2,429 8.80% 71.60%
100
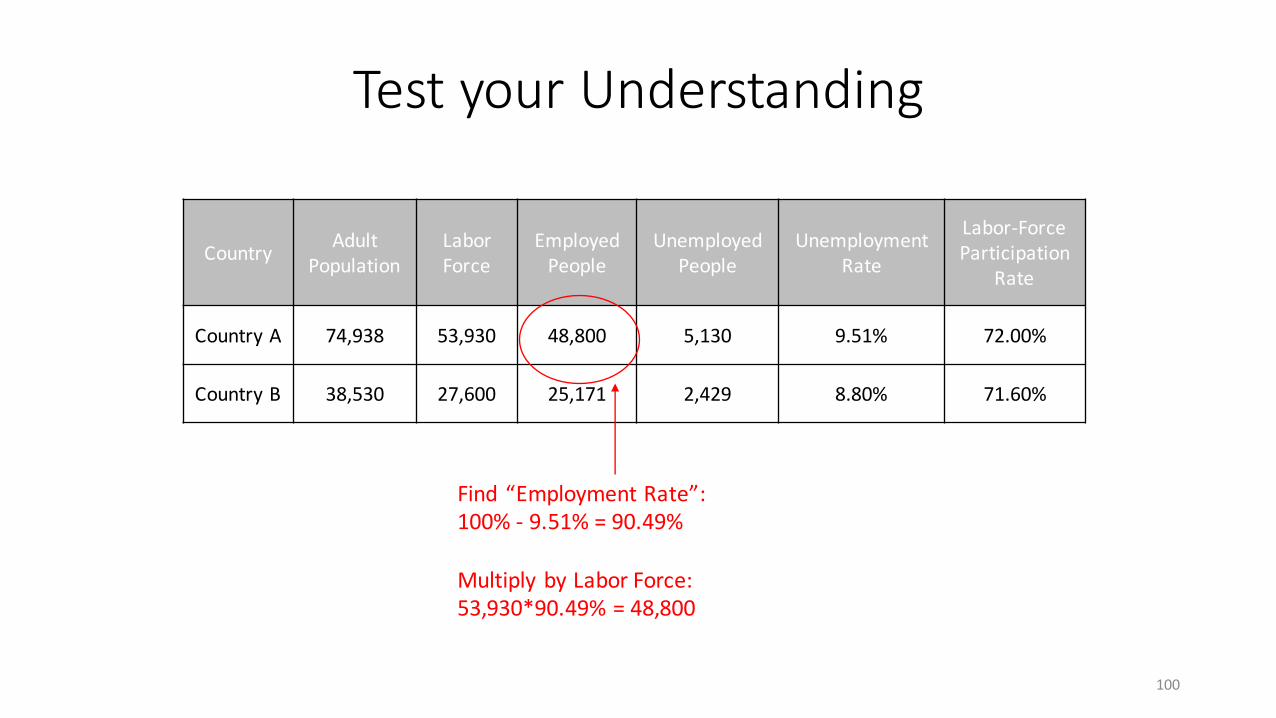
TestyourUnderstanding
Find“EmploymentRate”:100%- 9.51%=90.49%
MultiplybyLaborForce:53,930*90.49%=48,800
CountryAdult
PopulationLaborForce
EmployedPeople
UnemployedPeople
UnemploymentRate
Labor-ForceParticipation
Rate
CountryA 74,938 53,930 48,800 5,130 9.51% 72.00%
CountryB 38,530 27,600 25,171 2,429 8.80% 71.60%
101
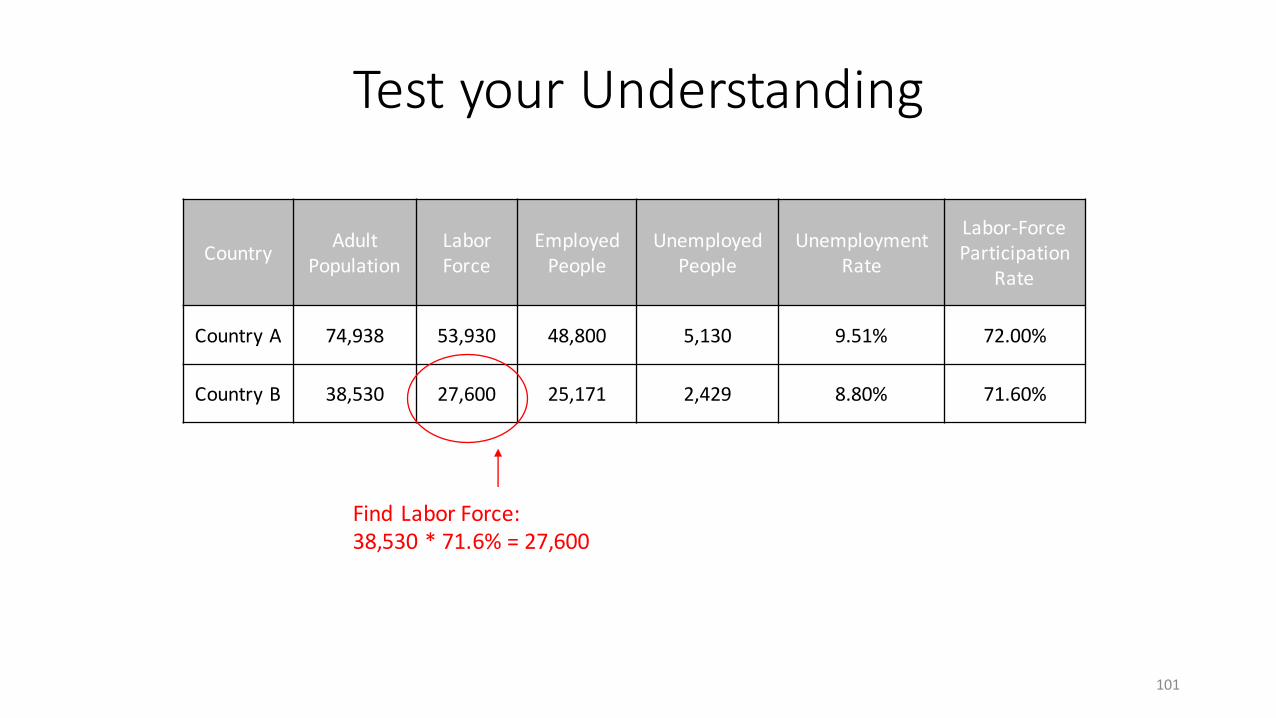
TestyourUnderstanding
FindLaborForce:38,530*71.6%=27,600
CountryAdult
PopulationLaborForce
EmployedPeople
UnemployedPeople
UnemploymentRate
Labor-ForceParticipation
Rate
CountryA 74,938 53,930 48,800 5,130 9.51% 72.00%
CountryB 38,530 27,600 25,171 2,429 8.80% 71.60%
102
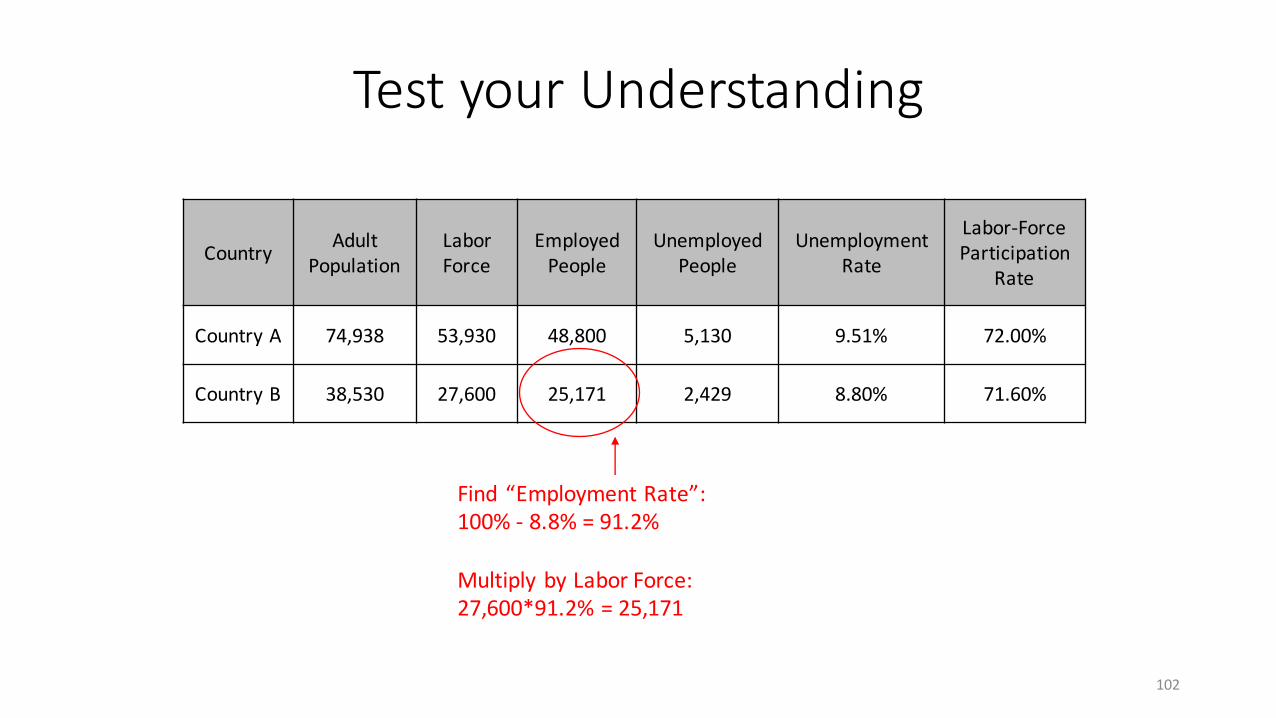
TestyourUnderstanding
Find“EmploymentRate”:100%- 8.8%=91.2%
MultiplybyLaborForce:27,600*91.2%=25,171
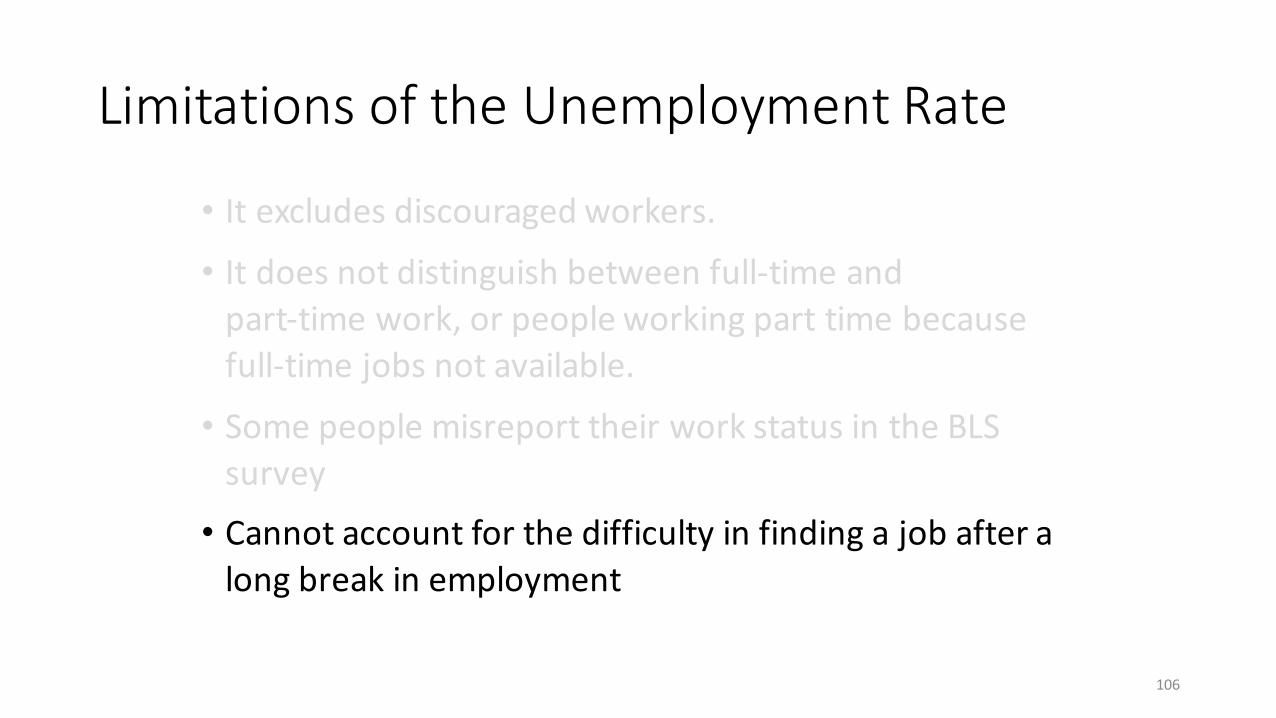
LimitationsoftheUnemploymentRate
• Itexcludesdiscouragedworkers.• Itdoesnotdistinguishbetweenfull-timeandpart-timework,orpeopleworkingparttimebecausefull-timejobsnotavailable.
• SomepeoplemisreporttheirworkstatusintheBLSsurvey
• Cannotaccountforthedifficultyinfindingajobafteralongbreakinemployment
103
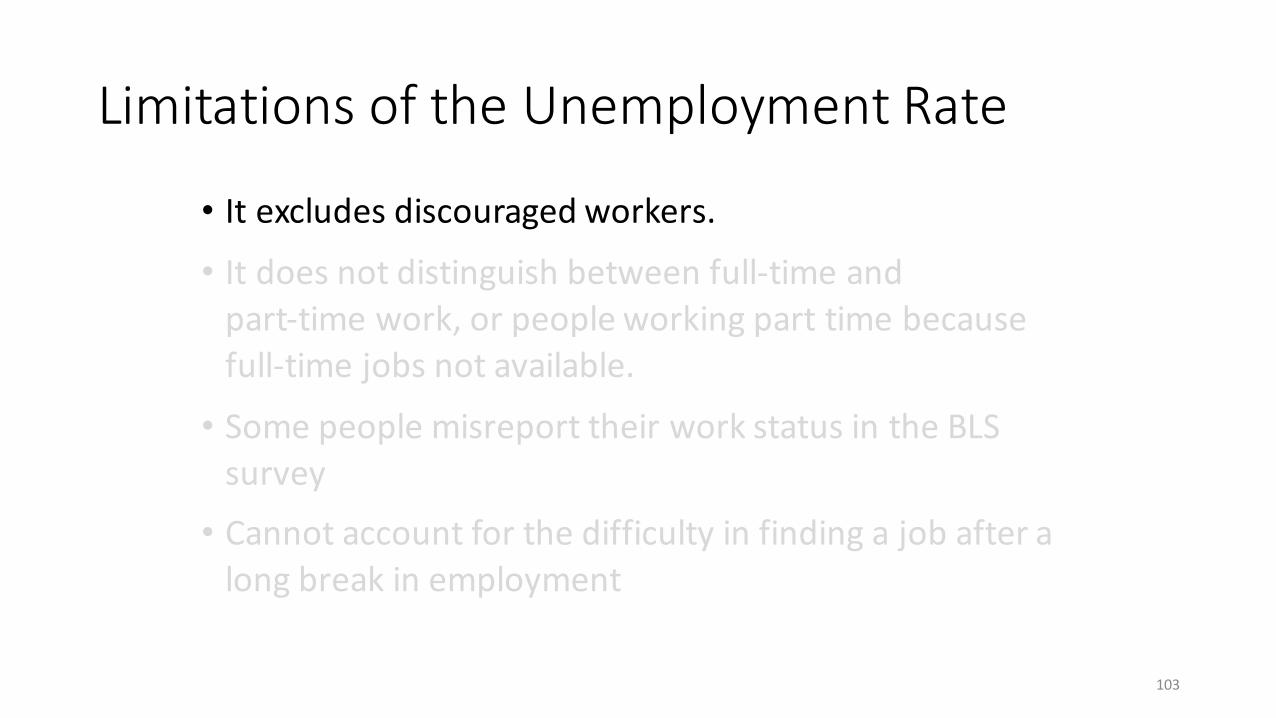
LimitationsoftheUnemploymentRate
• Itexcludesdiscouragedworkers.• Itdoesnotdistinguishbetweenfull-timeandpart-timework,orpeopleworkingparttimebecausefull-timejobsnotavailable.
• SomepeoplemisreporttheirworkstatusintheBLSsurvey
• Cannotaccountforthedifficultyinfindingajobafteralongbreakinemployment
104
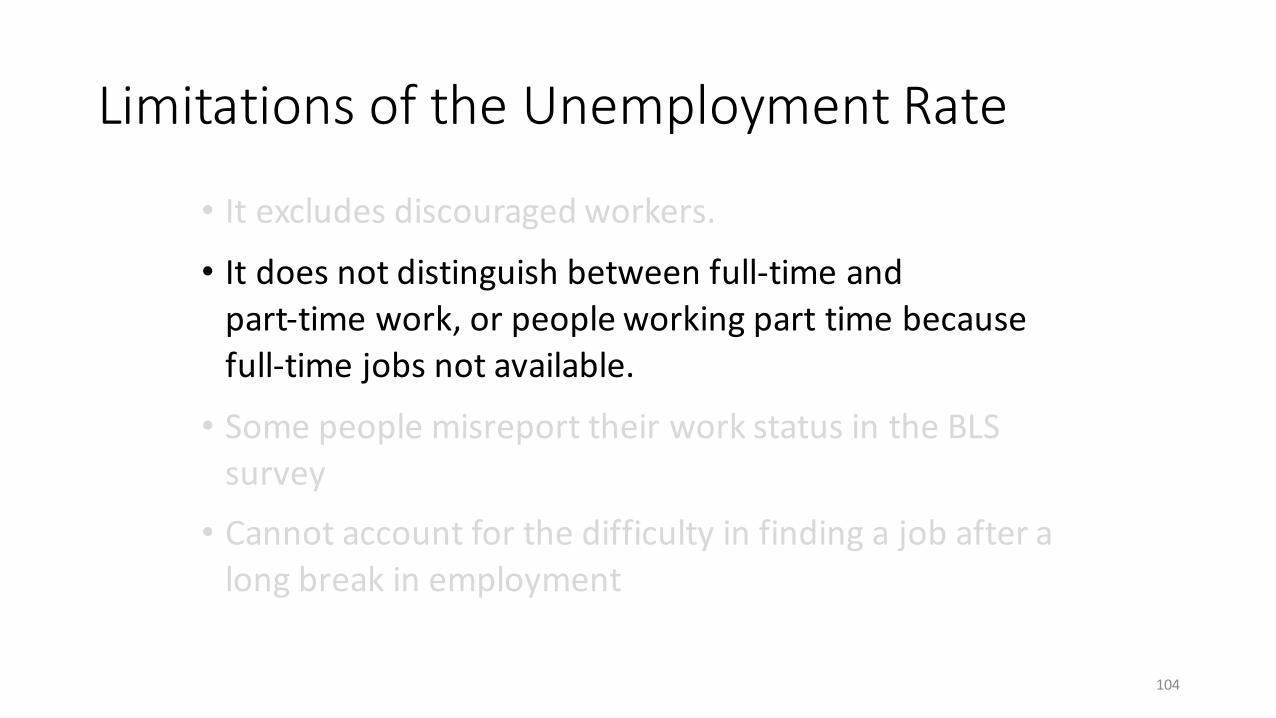
LimitationsoftheUnemploymentRate
• Itexcludesdiscouragedworkers.• Itdoesnotdistinguishbetweenfull-timeandpart-timework,orpeopleworkingparttimebecausefull-timejobsnotavailable.
• SomepeoplemisreporttheirworkstatusintheBLSsurvey
• Cannotaccountforthedifficultyinfindingajobafteralongbreakinemployment
105
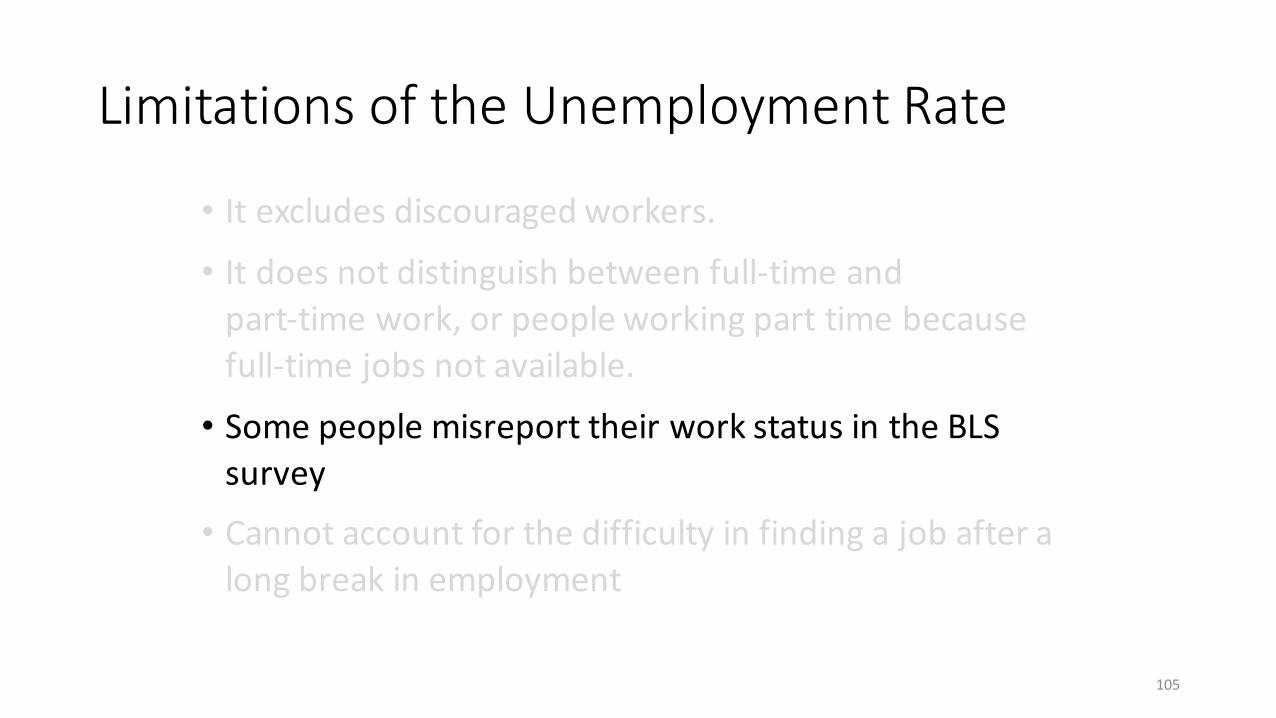
LimitationsoftheUnemploymentRate
• Itexcludesdiscouragedworkers.• Itdoesnotdistinguishbetweenfull-timeandpart-timework,orpeopleworkingparttimebecausefull-timejobsnotavailable.
• SomepeoplemisreporttheirworkstatusintheBLSsurvey
• Cannotaccountforthedifficultyinfindingajobafteralongbreakinemployment
106
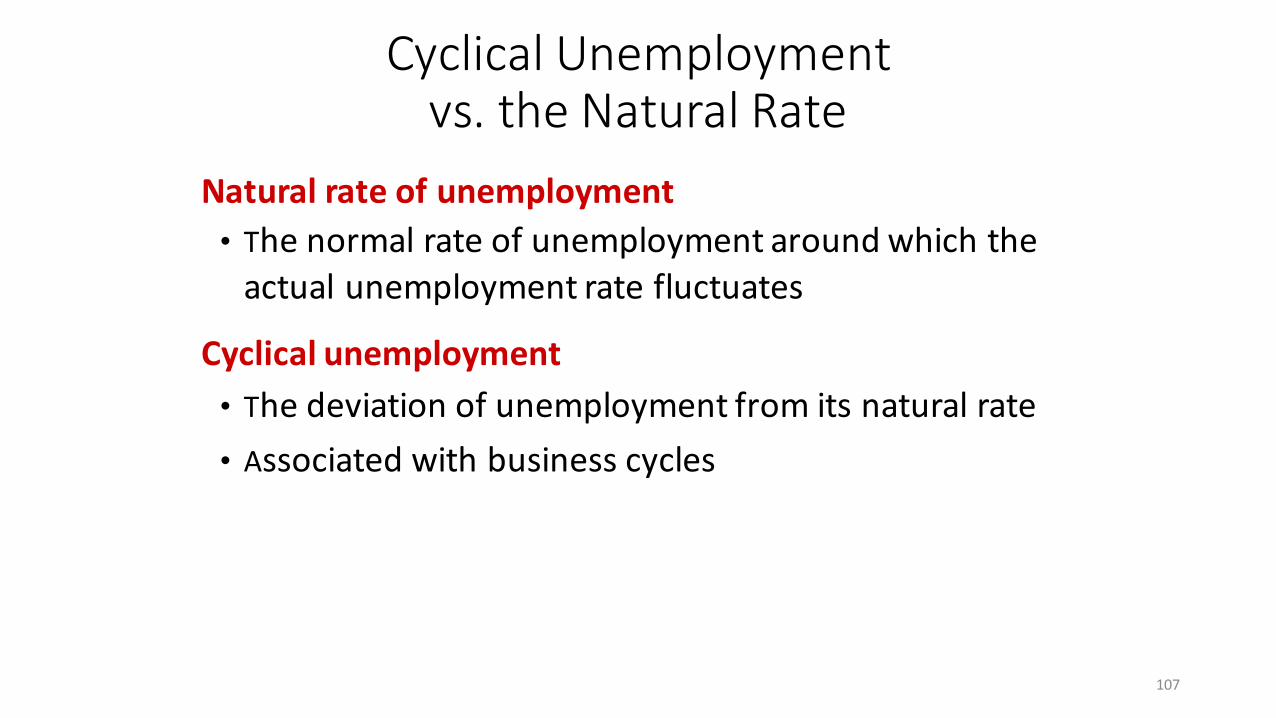
CyclicalUnemploymentvs.theNaturalRate
Naturalrateofunemployment• Thenormalrateofunemploymentaroundwhichtheactualunemploymentratefluctuates
Cyclicalunemployment• Thedeviationofunemploymentfromitsnaturalrate
• Associatedwithbusinesscycles
107
0
2
4
6
8
10
12
1960 1965 1970 1975 1980 1985 1990 1995 2000 2005 2010
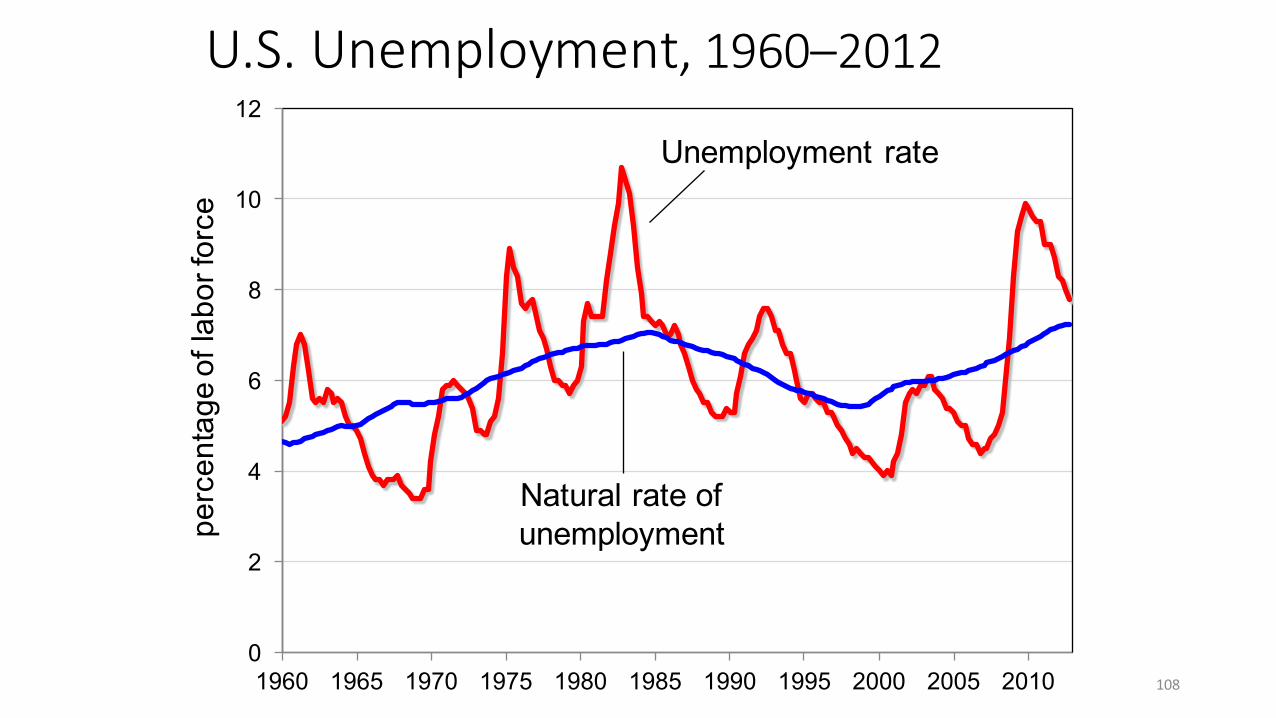
U.S.Unemployment,1960–2012
Natural rate of unemployment
Unemployment ratepe
rcen
tage
of l
abor
forc
e
108

WhyaNaturalRateofUnemployment?Evenwhentheeconomyisdoingwell,thereisalwayssomeunemployment:
Frictionalfactors• Occurswhenworkersspendtimesearchingforthejobsthatbestsuittheir
skillsandtastes• Short-termformostworkers
Structuralfactors• Occurswhenthereisamismatchbetweenskillsofworkersandskillsrequired
forjobs• Industriesexpandorcontractwithnewtechnologycreatingnewemployment
opportunitiesthatmakesomeproductsandjobsobsolete• Barriersexistinthelabormarketthatcreateunemployment
109

Structuralvs.FrictionalUnemployment• JeremygraduatedfromhisMBAinDecember.HeislookingforajobinBoston.
• MinimumwagelawsincreaseinNYCto$15perhour.McDonald’sreplacesitsservicestaffwithelectronicterminalswherecustomerscanplacetheirorder.
• Sarahwaslaidofffromherpositioninapublishinghouse.Sheisapplyingtodifferentpositionstomakeacareerchange.
110
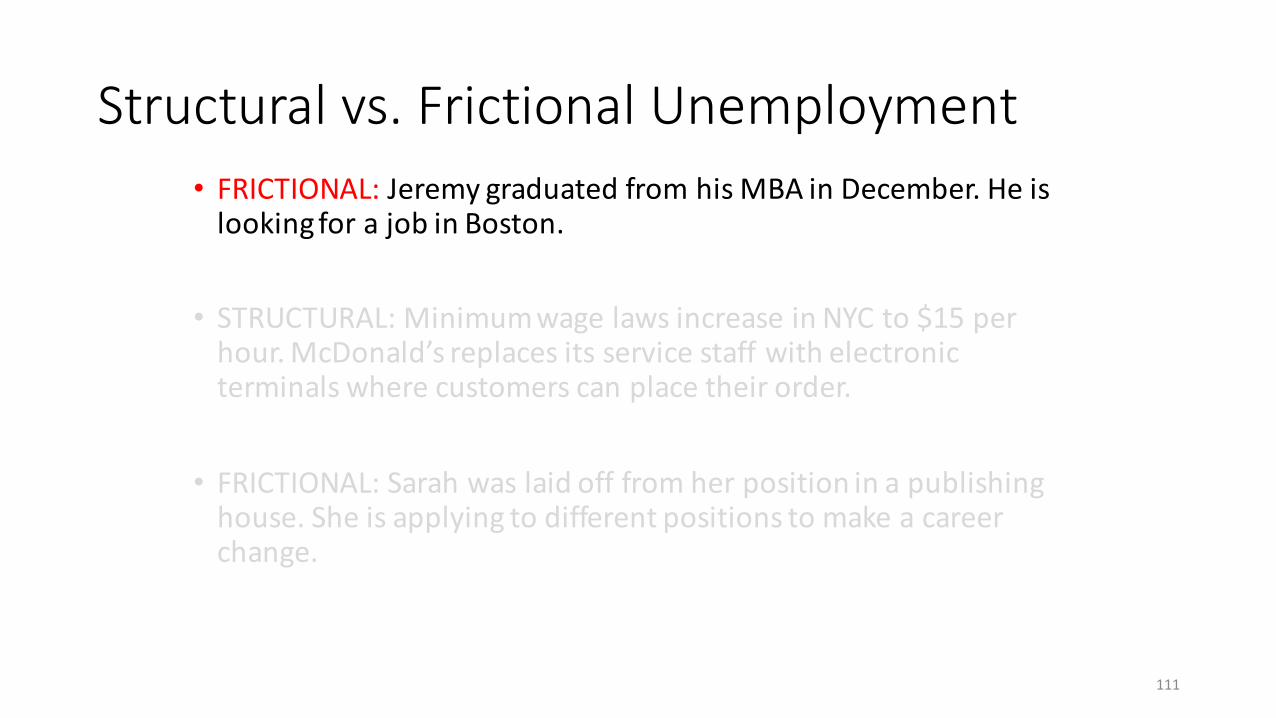
Structuralvs.FrictionalUnemployment• FRICTIONAL:JeremygraduatedfromhisMBAinDecember.HeislookingforajobinBoston.
• STRUCTURAL:MinimumwagelawsincreaseinNYCto$15perhour.McDonald’sreplacesitsservicestaffwithelectronicterminalswherecustomerscanplacetheirorder.
• FRICTIONAL:Sarahwaslaidofffromherpositioninapublishinghouse.Sheisapplyingtodifferentpositionstomakeacareerchange.
111

Structuralvs.FrictionalUnemployment• JeremygraduatedfromhisMBAinDecember.HeislookingforajobinBoston.
• MinimumwagelawsincreaseinNYCto$15perhour.McDonald’sreplacesitsservicestaffwithelectronicterminalswherecustomerscanplacetheirorder.
• Sarahwaslaidofffromherpositioninapublishinghouse.Sheisapplyingtodifferentpositionstomakeacareerchange.
• TheemploymentsituationforUSworkerswhosemanufacturingfirmhasmovedoperationstoMexico.
112
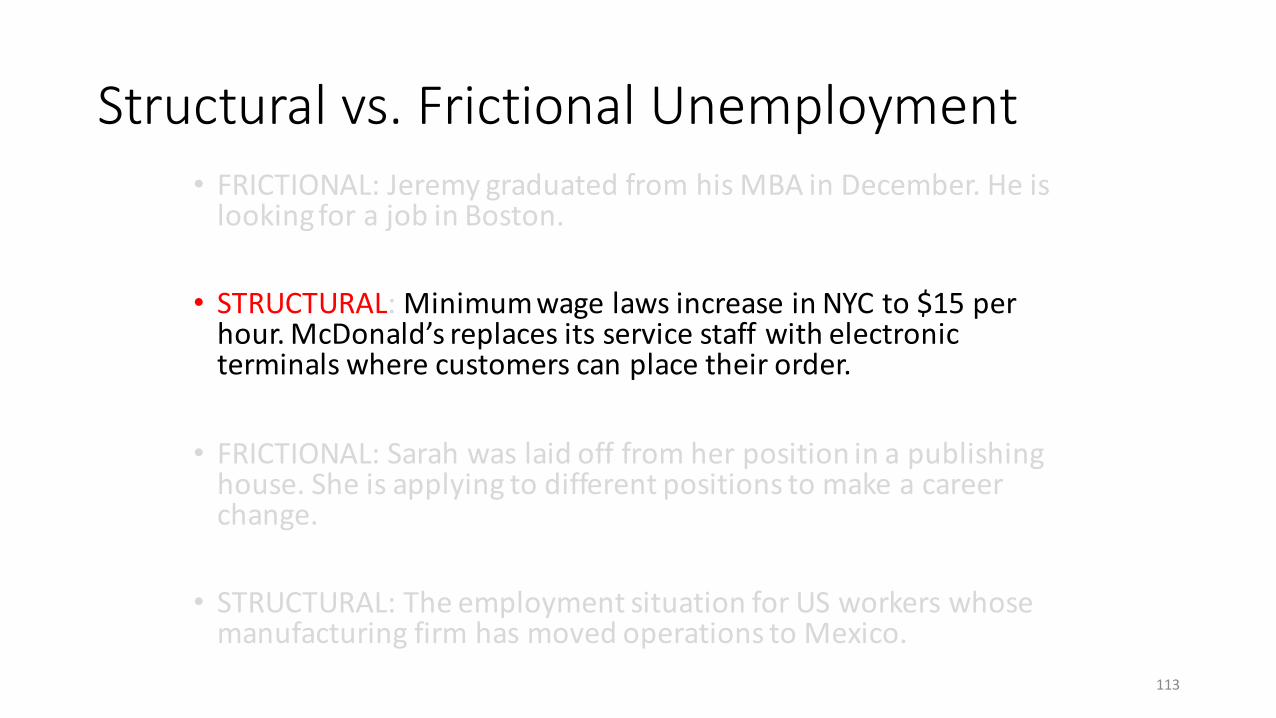
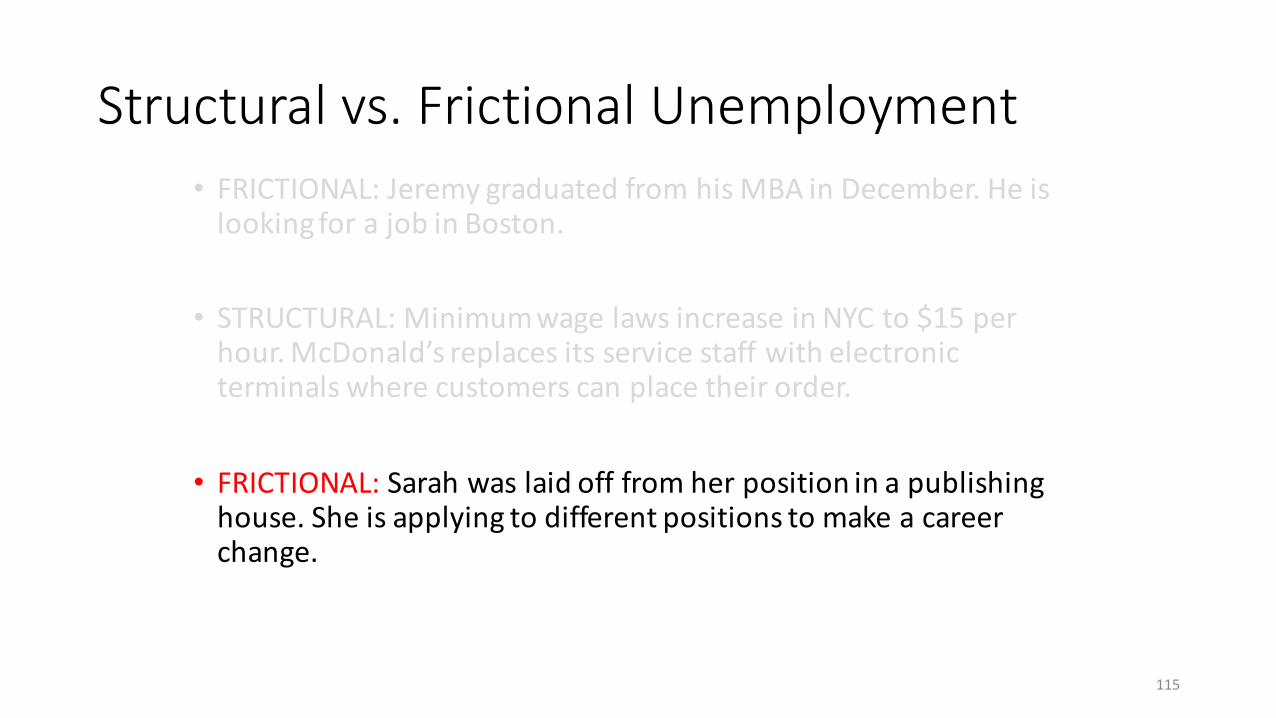
Structuralvs.FrictionalUnemployment• FRICTIONAL:JeremygraduatedfromhisMBAinDecember.HeislookingforajobinBoston.
• STRUCTURAL:MinimumwagelawsincreaseinNYCto$15perhour.McDonald’sreplacesitsservicestaffwithelectronicterminalswherecustomerscanplacetheirorder.
• FRICTIONAL:Sarahwaslaidofffromherpositioninapublishinghouse.Sheisapplyingtodifferentpositionstomakeacareerchange.
• STRUCTURAL:TheemploymentsituationforUSworkerswhosemanufacturingfirmhasmovedoperationstoMexico.
113

Structuralvs.FrictionalUnemployment• JeremygraduatedfromhisMBAinDecember.HeislookingforajobinBoston.
• MinimumwagelawsincreaseinNYCto$15perhour.McDonald’sreplacesitsservicestaffwithelectronicterminalswherecustomerscanplacetheirorder.
• Sarahwaslaidofffromherpositioninapublishinghouse.Sheisapplyingtodifferentpositionstomakeacareerchange.
114
Structuralvs.FrictionalUnemployment• FRICTIONAL:JeremygraduatedfromhisMBAinDecember.HeislookingforajobinBoston.
• STRUCTURAL:MinimumwagelawsincreaseinNYCto$15perhour.McDonald’sreplacesitsservicestaffwithelectronicterminalswherecustomerscanplacetheirorder.
• FRICTIONAL:Sarahwaslaidofffromherpositioninapublishinghouse.Sheisapplyingtodifferentpositionstomakeacareerchange.
115
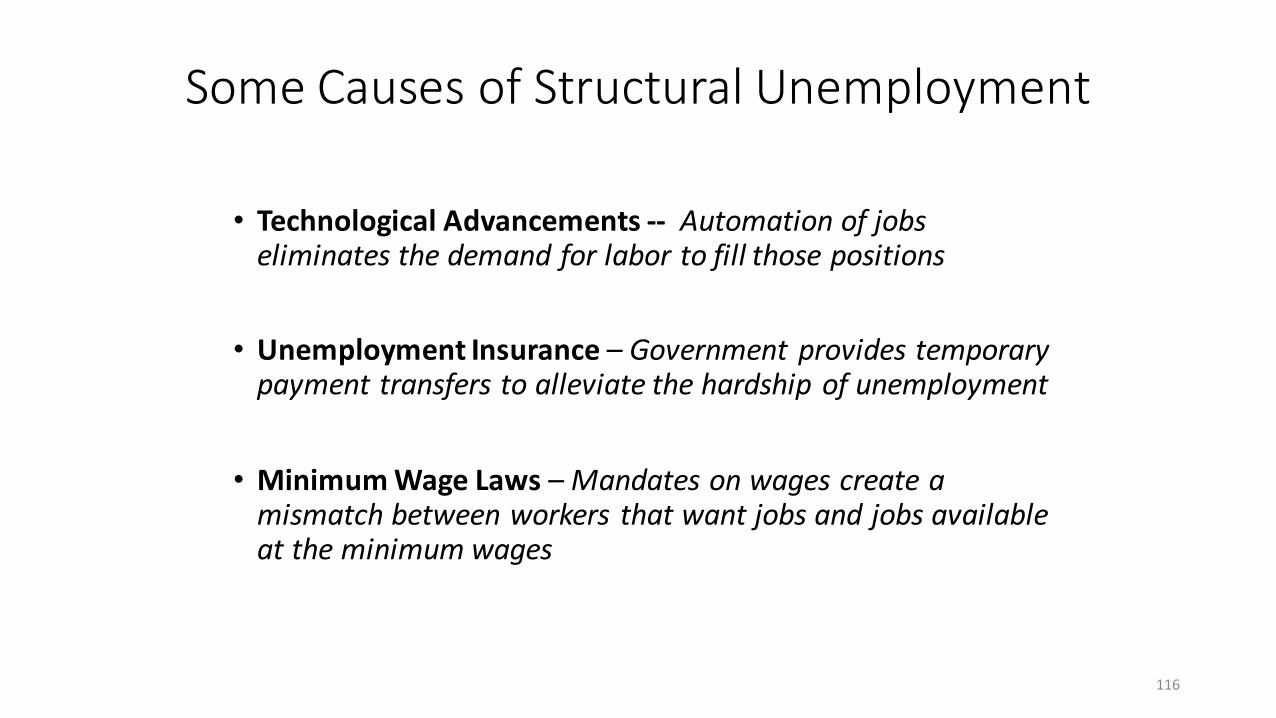
SomeCausesofStructuralUnemployment
• TechnologicalAdvancements-- Automationofjobseliminatesthedemandforlabortofillthosepositions
• UnemploymentInsurance– Governmentprovidestemporarypaymenttransferstoalleviatethehardshipofunemployment
• MinimumWageLaws –Mandatesonwagescreateamismatchbetweenworkers thatwantjobsandjobsavailableattheminimumwages
116

SomeCausesofStructuralUnemployment
• Unions – Collectivebargainingandunionrepresentationmakesitdifficultforemployerstoadjusttheirdemandforlaborinresponse tomarketconditions
117
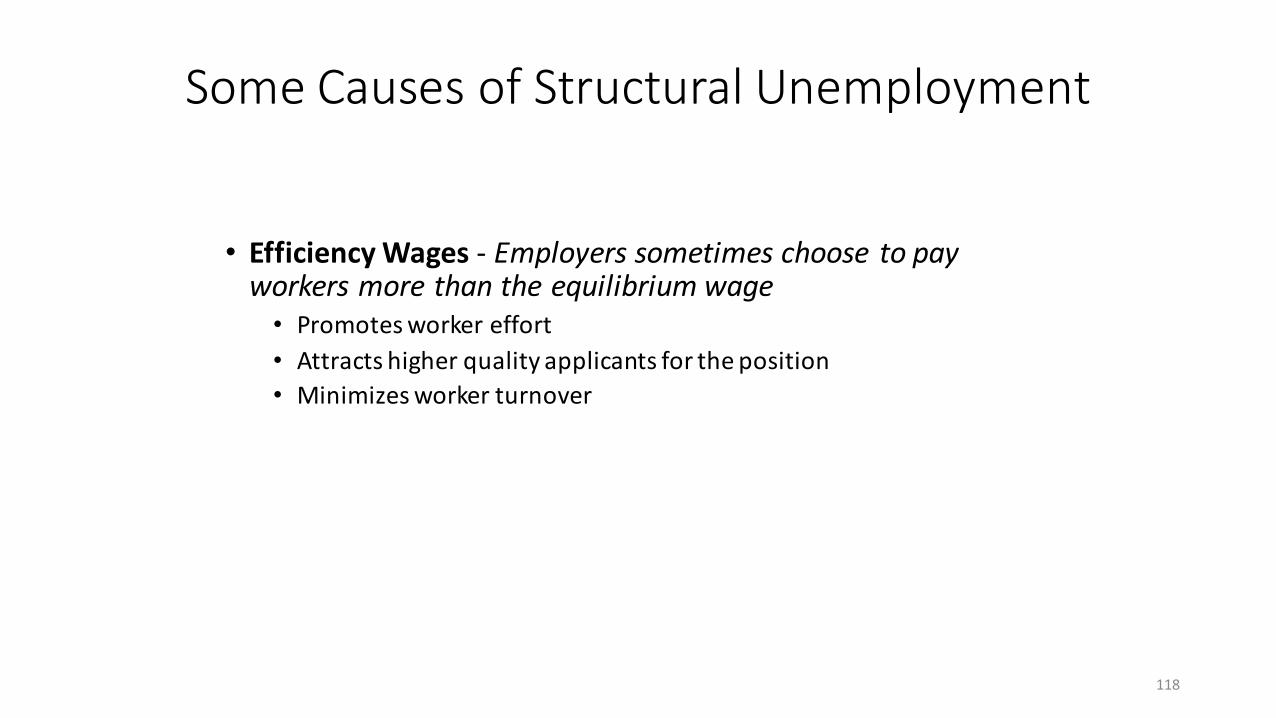
SomeCausesofStructuralUnemployment
• EfficiencyWages- Employerssometimeschoose topayworkersmorethantheequilibriumwage
• Promotesworkereffort• Attractshigherqualityapplicantsfortheposition• Minimizesworkerturnover
118
KeyTakeaways• Unemploymentintheeconomyisinevitable– thereisalwayssomeoneinbetweenjobsorlookingforthenextjob
• Thelevelofnaturalunemploymentvariesbetweencountriesbecauseofstructuralunemploymentorcertainbarriersthatexistinthelabormarket
• Theunemploymentratediffersfromthenaturalrateduetoshorttermfluctuationsintheeconomy(businesscycles)whichalsoreflectfluctuationsinoutput
119