measures unified and coherent land surface temperature and
TRANSCRIPT
MEaSUREs Unified and Coherent Land Surface Temperature and Emissivity
(LST&E) Earth System Data Record (ESDR):
The Combined ASTER and MODIS Emissivity database over Land (CAMEL) Version 2 Users’ Guide
Technical documentation
*E. Borbas, **G. Hulley, *R. Knuteson and *M. Feltz *Space Science and Engineering Center, University of Wisconsin - Madison **Jet Propulsion Laboratory, NASA
February 2019
MEASURES LAND SURFACE EMISSIVITY ESDR: CAMEL – USERS’ GUIDE
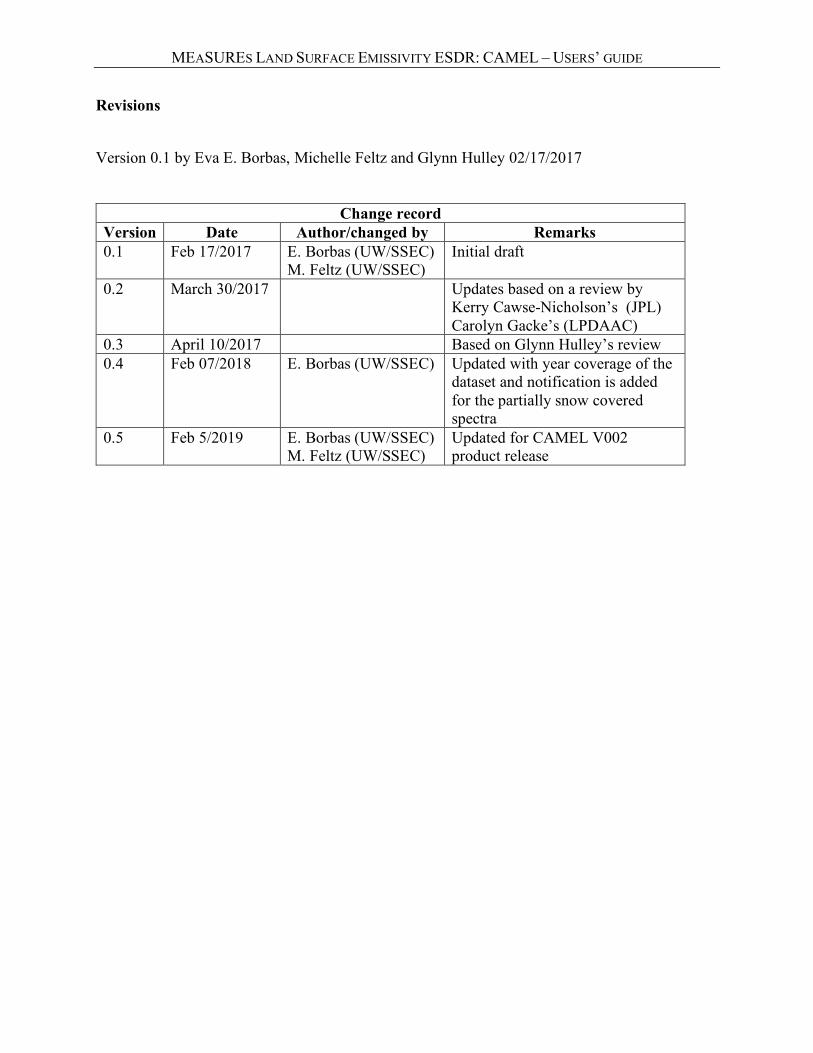
Revisions
Version 0.1 by Eva E. Borbas, Michelle Feltz and Glynn Hulley 02/17/2017
Change record Version Date Author/changed by Remarks 0.1 Feb 17/2017 E. Borbas (UW/SSEC)
M. Feltz (UW/SSEC) Initial draft
0.2 March 30/2017 Updates based on a review by Kerry Cawse-Nicholson’s (JPL) Carolyn Gacke’s (LPDAAC)
0.3 April 10/2017 Based on Glynn Hulley’s review 0.4 Feb 07/2018 E. Borbas (UW/SSEC) Updated with year coverage of the
dataset and notification is added for the partially snow covered spectra
0.5 Feb 5/2019 E. Borbas (UW/SSEC) M. Feltz (UW/SSEC)
Updated for CAMEL V002 product release
MEASURES LAND SURFACE EMISSIVITY ESDR: CAMEL – USERS’ GUIDE
This research was carried out at Space Science and Engineering Center, University of Wisconsin-Madison and at the Jet Propulsion Laboratory, California Institute of Technology, under a contract with the National Aeronautics and Space Administration – contract reference MEAS-12-0023.

MEASURES CAMEL USERS’ GUIDE
ii
Contacts
Readers seeking additional information about this study may contact the following researchers:
Eva E. Borbas Space Science and Engineering Center University of Wisconsin-Madison 1226 W Dayton Street Madison WI, 53705 Email: [email protected] Office: (608) 263-0228
Glynn C. Hulley MS 183-501 Jet Propulsion Laboratory 4800 Oak Grove Dr. Pasadena, CA 91109 Email: [email protected] Office: (818) 354-2979
Robert O. Knuteson Space Science and Engineering Center University of Wisconsin-Madison 1226 W Dayton Street Madison WI, 53705 Email: [email protected] Office: (608) 263-7974
MEASURES CAMEL USERS’ GUIDE
iii
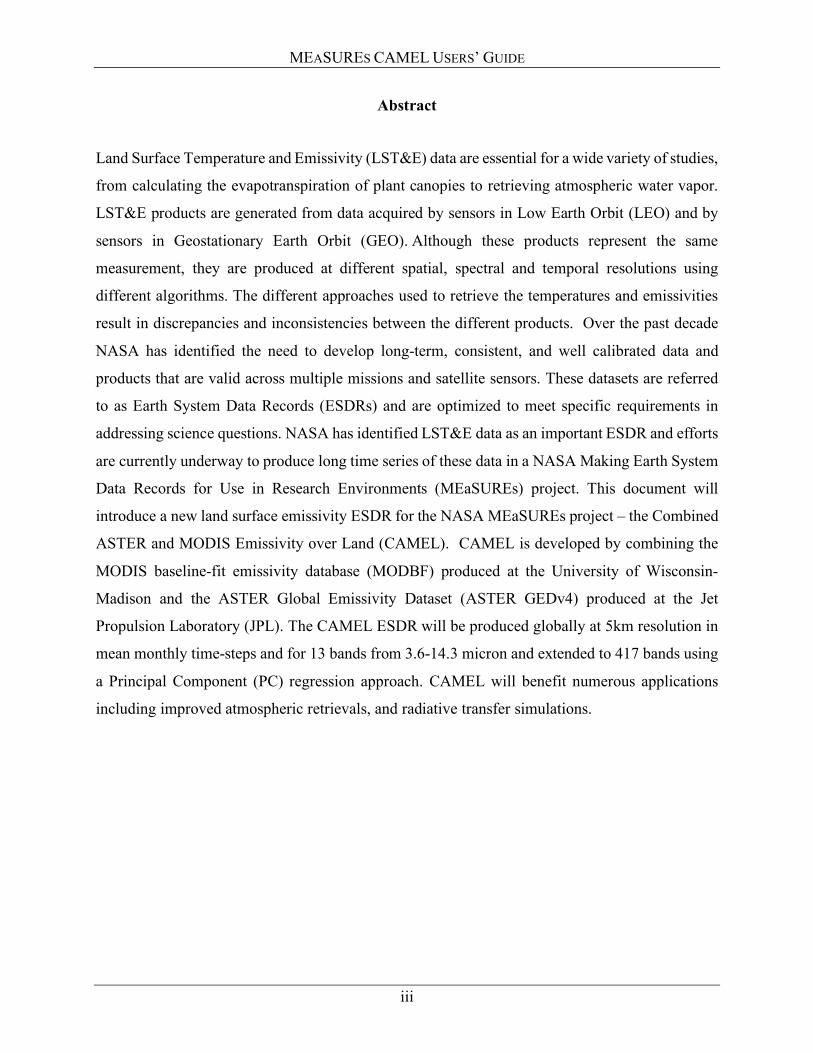
Abstract
Land Surface Temperature and Emissivity (LST&E) data are essential for a wide variety of studies,
from calculating the evapotranspiration of plant canopies to retrieving atmospheric water vapor.
LST&E products are generated from data acquired by sensors in Low Earth Orbit (LEO) and by
sensors in Geostationary Earth Orbit (GEO). Although these products represent the same
measurement, they are produced at different spatial, spectral and temporal resolutions using
different algorithms. The different approaches used to retrieve the temperatures and emissivities
result in discrepancies and inconsistencies between the different products. Over the past decade
NASA has identified the need to develop long-term, consistent, and well calibrated data and
products that are valid across multiple missions and satellite sensors. These datasets are referred
to as Earth System Data Records (ESDRs) and are optimized to meet specific requirements in
addressing science questions. NASA has identified LST&E data as an important ESDR and efforts
are currently underway to produce long time series of these data in a NASA Making Earth System
Data Records for Use in Research Environments (MEaSUREs) project. This document will
introduce a new land surface emissivity ESDR for the NASA MEaSUREs project – the Combined
ASTER and MODIS Emissivity over Land (CAMEL). CAMEL is developed by combining the
MODIS baseline-fit emissivity database (MODBF) produced at the University of Wisconsin-
Madison and the ASTER Global Emissivity Dataset (ASTER GEDv4) produced at the Jet
Propulsion Laboratory (JPL). The CAMEL ESDR will be produced globally at 5km resolution in
mean monthly time-steps and for 13 bands from 3.6-14.3 micron and extended to 417 bands using
a Principal Component (PC) regression approach. CAMEL will benefit numerous applications
including improved atmospheric retrievals, and radiative transfer simulations.
MEASURES CAMEL USERS’ GUIDE
iv
1. Table of Contents
Technical documentation iii
Revisions iii
Contacts ii
Abstract iii
Software version identification 5
2. Introduction 5
3. Emissivity Hinge-points Methodology 6
4. High Spectral Resolution Emissivity Methodology 9
5. MEaSUREs CAMEL Emissivity Uncertainty determination 10
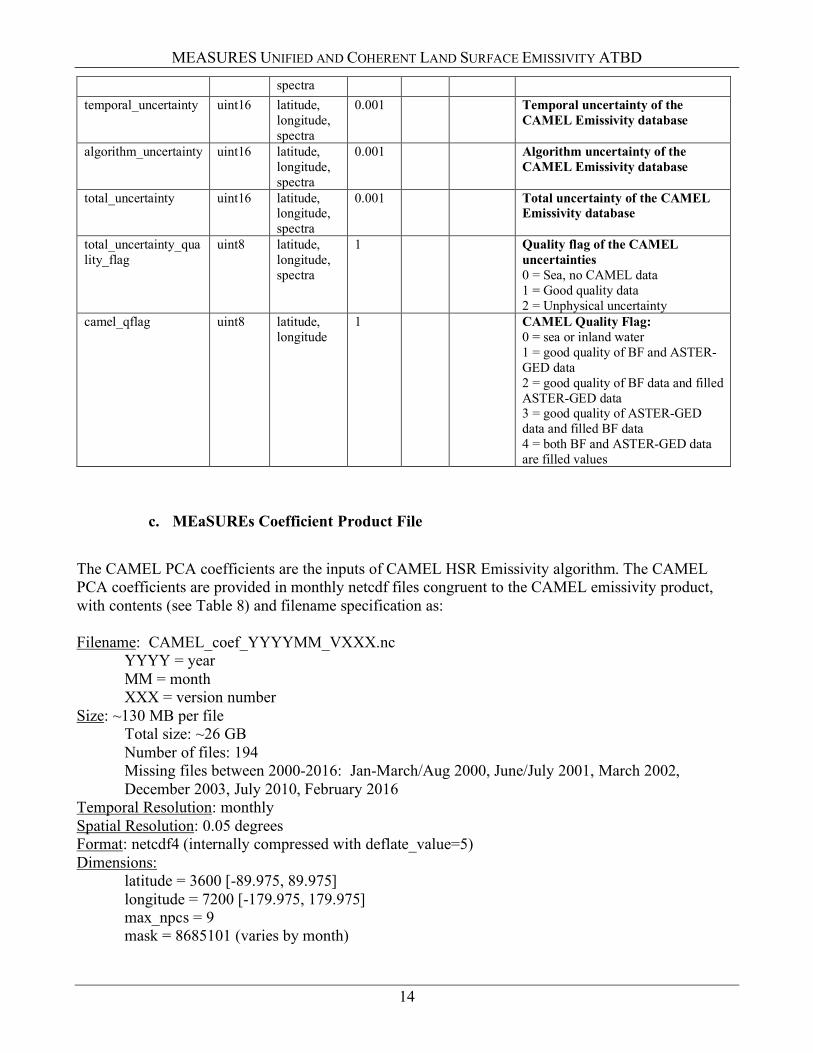
6. MEaSUREs CAMEL data product files 12 a. MEaSUREs CAMEL Emissivity Product File 12 b. MEaSUREs CAMEL Emissivity Uncertainty Product File 13 c. MEaSUREs Coefficient Product File 14
7. Description of the MEaSUREs CAMEL High Spectral Resolution Algorithm 16 a. Fortran version 16 b. Matlab version 19
8. References 21
Appendix 1: CAMEL Product CDL Files 23 a. CAMEL Coefficient Product 23 b. CAMEL Emissivity Product 25 c. CAMEL Uncertainty Product 27
Appendix 2: Contents of the CAMEL HSR algorithm Software package 29 a. Fortran version 29 b. Matlab version 29

MEASURES UNIFIED AND COHERENT LAND SURFACE EMISSIVITY ATBD
5
Software version identification
The current version of the software is 2.0
2. Introduction
Land Surface Temperature and Emissivity (LST&E) data are critical variables for studying a variety of Earth surface processes and surface-atmosphere interactions such as evapotranspiration, surface energy balance and water vapor retrievals. LST&E have been identified as an important Earth System Data Record (ESDR) by NASA and many other international organizations (NASA Strategic Roadmap Committee #9, 2005, Global Climate Observing System (GCOS), 2003; Climate Change Science Program (CCSP), 2006, and the recently established International Surface Temperature Initiative (Willett et al. 2011). Accurate knowledge of the LST&E at high spatial (1km) and temporal (hourly) scales is a key requirement for many energy balance models to estimate important surface biophysical variables such as evapotranspiration and plant-available soil moisture (Anderson et al. 2007b; Moran 2003). Currently no single satellite exists that is capable of providing global LST&E products at both high spatial and temporal resolution. LST&E data are also essential for balancing the Earth's surface radiation budget, for example an error of 0.1 in the emissivity will result in climate models having errors of up to 7 Wm-
2 in their upward longwave radiation estimates –a much larger term than the surface radiative forcing (~2-3 Wm-2) due to an increase in greenhouse gases (Zhou et al. 2003). LST&E are also utilized in monitoring land-cover / land-use changes (French et al. 2008), and in atmospheric retrieval schemes (Seemann et al. 2003). LST&E products are currently generated from sensors in Low Earth Orbit (LEO) such as the NASA Moderate Resolution Imaging Spectroradiometer (MODIS) instruments on the Terra and Aqua satellites as well as from sensors in Geostationary Earth Orbit (GEO) such as the Geostationary Operational Environmental Satellites (GOES). Sensors in LEO orbits provide global coverage at moderate spatial resolutions (~1km) but more limited temporal coverage (twice-daily), while sensors in GEO orbits provide more frequent measurements (hourly) at lower spatial resolutions (~3-4 km) over a geographically restricted area. For example the GOES sensors produce data over North America every 15 minutes and South America every 3 hours. LST&E products are generated with varying accuracies depending on the input data, including ancillary data such as atmospheric water vapor, as well as algorithmic approaches. For example, certain MODIS products (MOD11) use a split window algorithm applied to two or more bands in conjunction with an emissivity estimate obtained from a land classification to produce the LST. Conversely, other MODIS products (MOD21) use a physics based approach involving a radiative transfer model to first correct the data to a surface radiance and then use a model to extract the temperature and emissivities in the spectral bands. This physics based approach is also used with the Advanced Spaceborne Thermal Emission and Reflection Radiometer (ASTER). Validation of these approaches has shown that they are complementary, with the split-window approach working better over heavily vegetated regions and the physics based approach working better in semi-arid and arid regions. NASA has recognized this general problem and identified the need to develop long-term, consistent, and calibrated data and products that are valid across multiple missions and satellite sensors. In this project we address this problem for LST&E by generating a set of Earth System Data
MEASURES UNIFIED AND COHERENT LAND SURFACE EMISSIVITY ATBD
6
Records (ESDRs) that capitalizes on the type of observation (LEO or GEO) and retrieval type (physical-based or split-window). Three ESDRs will be produced; 1) a unified global 1 km resolution land surface temperature (LST) ESDR resampled to daily, 8-day and monthly; 2) a unified N. and S. America 5 km resolution LST-ESDR resampled to hourly spatial resolution for N. America and 3-hourly for S. America and; 3) a unified global 5 km resolution average land surface emissivity (LSE) at monthly temporal resolution (Table 1)). In this document, the LSE ESDR will be described in detail including methodologies, uncertainties and all the technical aspects.
Table 1. Planned LST&E Earth System Data Records (ESDRs)
ESDR Spatial Resolution
Coverage Temporal Resolution Time Period
LEO LST-ESDR 1 km Global Daily, 8-day and monthly 2000-2017 GEO LST-ESDR 5 km N. and S. America N. America-hourly,
S. America-3 hourly 2000-2017
LEO LSE (CAMEL)
5 km Global Monthly 2000-2017*
• Revised time period: 2000-2016 due to the lack of 2017 MODIS MOD11C3 Col4.1 input data Under the MEaSUREs project, a monthly mean unified LEO LSE-ESDR at 5km has been produced by merging two current state-of-the-art emissivity databases, the UW-Madison MODIS Baseline Fit emissivity database (UWBF) (Seemann et al. 2008), and the JPL ASTER Global Emissivity Dataset (GEDv4) (Hulley and Hook 2009) and termed the Combined ASTER and MODIS Emissivity over Land (CAMEL) (Hook et al., 2018; Borbas et al., 2018, 2019; Feltz et al. 2018a,b). The CAMEL LSE-ESDR has been further extended to hyperspectral resolution using a PC regression approach. For the emissivity ESDR products a full set of uncertainty statistics has also been provided.
3.Emissivity Hinge-points Methodology
CAMEL has been produced by combining the UW-Madison MODIS Baseline Fit database (UWBF) and the JPL ASTER Global Emissivity Dataset (GEDv4). A limitation of the UWBF database is that emissivity in the thermal infrared region (TIR) region (8-12 µm) is not well defined because MODIS only has 3 bands in this region (bands 29, 31, 32). This results in imperfect TIR spectral shape in the two quartz doublet regions at 8.5 and 12 µm. The advantages are its moderate spatial resolution (5km), uniform temporal coverage (monthly), and emissivities, which span the entire IR region (3.6-12 µm). A disadvantage of the ASTER-GED database is that although there are more bands to more accurately define the spectral shape in the TIR region (5 bands, 8-12 µm), there are no bands in the mid-wave infrared (MIR) region around 3.8-4.1 µm, which limits its use in models and other atmospheric retrieval schemes. The advantages are its high spatial resolution (~100m) and high accuracy over arid regions. The two databases have been integrated together to capitalize on the unique strengths of each product's characteristics. This involved four steps: 1) ASTER GED v3 emissivities have been adjusted for vegetation and snow cover variations over heterogeneous regions to product ASTER GED v4, 2) ASTER-GED v4 emissivities have been aggregated from 100m resolution to the UWBF 5km resolution, 3) the spectral emissivities have been merged together to generate the CAMEL product at 13 points from 3.6-12 µm, and 4) the 13 hinge-points have been further extended to hyperspectral resolution using a PC-regression approach. We will discuss step 3 and 4 in more details.
MEASURES UNIFIED AND COHERENT LAND SURFACE EMISSIVITY ATBD
7
The third step involves merging the spectral emissivities from the 5 ASTER bands with the 10 hinge-point bands from the UWBF database. The determination of the CAMEL emissivity by hinge-points are summarized in Table 2 and described below. CAMEL hinge points from 3.6 till 7.6 µm In the ASTER band gap of the short and mid-wave IR region, the CAMEL emissivity from 3.6 till 7.6 µm have been determined by the UWBF values only, also keeping the location of the hinge points. CAMEL hinge points 10.6 and 11.3 µm The 10.6 and 11.3 µm hinge points have been added based on the additional observations from ASTER band 10.6 and 11.3 µm. CAMEL values at these hinge points were determined from the ASTER GED observations only. CAMEL hinge point 8.6 µm Since the spectral response of MODIS band 29 (8.55 µm) – also UWBF 8.3 and 9.1 µm (see below) - matches closely with ASTER band 11 (8.6 µm), we used a weighting rule based on uncertainties using a 'combination of states of information' approach (e.g. Tarantola (2005)). In this approach two pieces of information (e.g. two spectral emissivities 𝜀(1, 𝜈) and 𝜀(2, 𝜈)) can be merged in a probabilistic manner by weighting each input based on its relative uncertainty, i.e. 𝜀(𝜈) = [1/(𝑤1+ 𝑤2)][𝑤1 ∙𝜀(1, 𝜈) + 𝑤2 ∙ 𝜀(2, 𝜈)], where 𝑤 is a weighting factor based on an uncertainty, 𝜎, as follows: 𝑤 =1/𝜎. To apply this method we used 90% and 10% weights as the corresponding uncertainties for ASTER GED and UWBF on a pixel-by-pixel basis. ASTER band 11 (8.6 µm) gets the 90% weight for arid and semi-arid regions, while for all the other cases the UWBF hinge-point 6 (8.3 µm) is weighted by the 90%. To determine the arid, semi-arid region, the ASTER NDVI (<0.2) and ASTER 9.1 µm band (<=0.85) is used. Additionally, over the tropical rainforest region, the MODIS MOD11 emissivity suffers from cloud contamination resulting in the emissivity value at the Restrahen band to be low. To avoid this artifact over that region (+-20 degree latitude band where ASTER NDVI is larger than 0.7 and UWBF emissivity at 8.6 µm is less than 0.96) the ASTER 11 (8.6 µm) is weighted by 90%. CAMEL hinge point 8.3 and 9.3 µm The baseline-fit procedure used in generating UWBF product extends emissivity from MODIS band 29 (8.6 µm) to inflection points at 8.3 µm and 9.3 µm. The location of these inflection points were maintained, but the UWBF emissivities are improved by replacing the interpolated inflection points with retrieved ASTER emissivities from corresponding bands 10 (8.3 µm) and 12 (9.1 µm) and adjusting them by the emissivity difference between the new CAMEL 8.6 µm and ASTER 8.6 µm band. This significantly improved spectral shape in the Si-O stretching region (8-12 µm) (Figure 1). CAMEL hinge point 10. 8 µm The CAMEL emissivity at the 10.8 µm hinge point has been determined as the linear combination of the ASTER band 10.6 µm and 11.3 µm emissivity. CAMEL hinge points 12.1 and 14.3 µm The UWBF at 12.1 and 14.3 µm has been adjusted by the difference between the UWBF 12.1 µm and ASTER 11.3 µm emissivity to be consistent with the 10.6-11.3 µm region (mostly ASTER based observation) and to improve the spectral shape in this longwave spectral region.

MEASURES UNIFIED AND COHERENT LAND SURFACE EMISSIVITY ATBD
8
Table 2: Determination of the CAMEL hinge points
CAMEL Hinge Points Method 3.6 µm = UWBF 3.6 4.3 µm = UWBF 4.3 5.0 µm = UWBF 5.0 5.8 µm = UWBF 5.8 7.6 µm = UWBF 7.6 8.3 µm = Adjusted ASTER8.3 by CAMEL8.6 - ASTER8.6 8.6 µm =Weighted combination of UWBF8.3 and ASTER8.6 9.1 µm = Adjusted ASTER9.1 by CAMEL8.6 - ASTER8.6 10.6 µm = ASTER 10.6 10.8 µm = linear interpolation between ASTER10.6 and ASTER11.3 11.3 µm = ASTER 11.3 12.1 µm = Adjusted UWBF12.1 based on UWBF12.1 – ASTER11.3 14.3 µm = Adjusted UWBF14.3 based on UWBF12.1 – ASTER11.3
Figure 1: The advantages of combining the ASTER GED and MODIS UW Baseline Fit databases are evident here showing emissivity spectra over the Namib Desert, Namibia. UWBF v4.1 emissivity for Jan 2004 (crosses) and hyperspectral fit (red line), the CAMEL 13 hinge-point emissivity (blue dots) and hyperspectral fit (blue line), and lab spectra (black) of sand samples collected over the Namib Desert. Note improved spectral shape in CAMEL HSR (blue) in the quartz doublet regions from 8-10 micron, and 12-13 microns.
CAMEL HSR ESDR
UWIREMIS CAMEL ESDR UWIREMIS HSR CAMEL HSR ESDR LAB
MEASURES UNIFIED AND COHERENT LAND SURFACE EMISSIVITY ATBD
9
4.High Spectral Resolution Emissivity Methodology
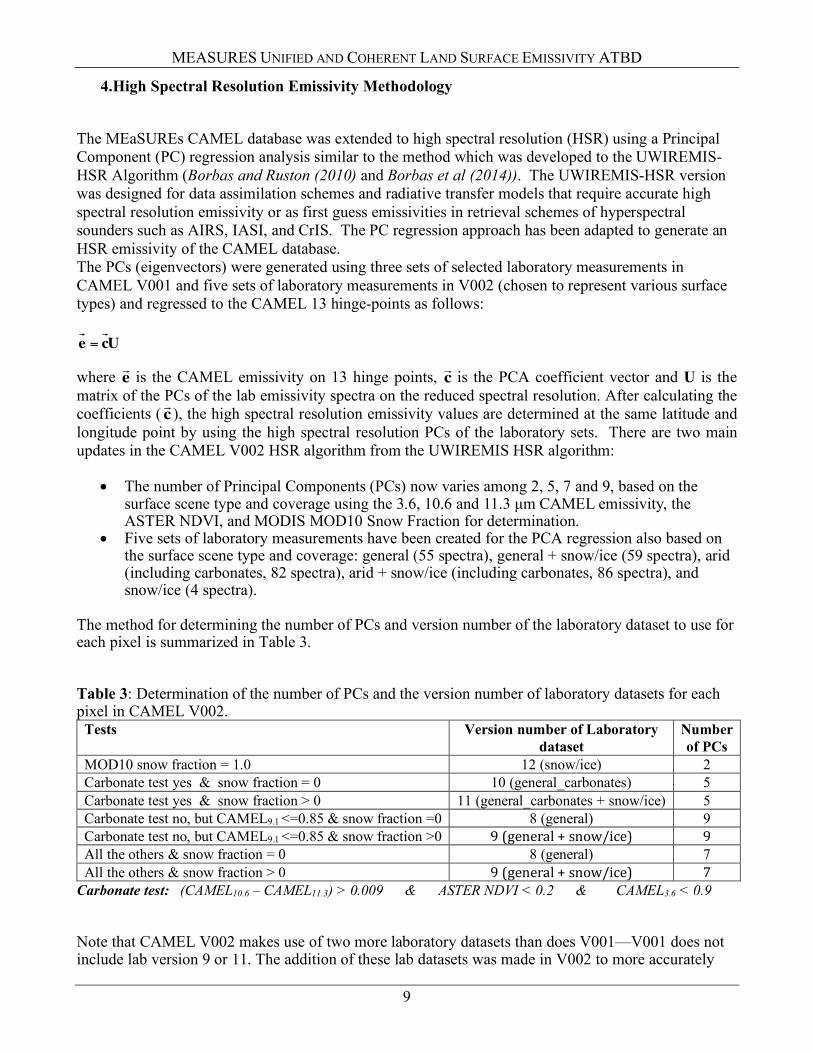
The MEaSUREs CAMEL database was extended to high spectral resolution (HSR) using a Principal Component (PC) regression analysis similar to the method which was developed to the UWIREMIS-HSR Algorithm (Borbas and Ruston (2010) and Borbas et al (2014)). The UWIREMIS-HSR version was designed for data assimilation schemes and radiative transfer models that require accurate high spectral resolution emissivity or as first guess emissivities in retrieval schemes of hyperspectral sounders such as AIRS, IASI, and CrIS. The PC regression approach has been adapted to generate an HSR emissivity of the CAMEL database. The PCs (eigenvectors) were generated using three sets of selected laboratory measurements in CAMEL V001 and five sets of laboratory measurements in V002 (chosen to represent various surface types) and regressed to the CAMEL 13 hinge-points as follows:
where is the CAMEL emissivity on 13 hinge points, is the PCA coefficient vector and U is the matrix of the PCs of the lab emissivity spectra on the reduced spectral resolution. After calculating the coefficients ( ), the high spectral resolution emissivity values are determined at the same latitude and longitude point by using the high spectral resolution PCs of the laboratory sets. There are two main updates in the CAMEL V002 HSR algorithm from the UWIREMIS HSR algorithm:
• The number of Principal Components (PCs) now varies among 2, 5, 7 and 9, based on the surface scene type and coverage using the 3.6, 10.6 and 11.3 µm CAMEL emissivity, the ASTER NDVI, and MODIS MOD10 Snow Fraction for determination.
• Five sets of laboratory measurements have been created for the PCA regression also based on the surface scene type and coverage: general (55 spectra), general + snow/ice (59 spectra), arid (including carbonates, 82 spectra), arid + snow/ice (including carbonates, 86 spectra), and snow/ice (4 spectra).
The method for determining the number of PCs and version number of the laboratory dataset to use for each pixel is summarized in Table 3. Table 3: Determination of the number of PCs and the version number of laboratory datasets for each pixel in CAMEL V002.
Tests Version number of Laboratory dataset
Number of PCs
MOD10 snow fraction = 1.0 12 (snow/ice) 2Carbonate test yes & snow fraction = 0 10 (general_carbonates) 5 Carbonate test yes & snow fraction > 0 11 (general_carbonates + snow/ice) 5 Carbonate test no, but CAMEL9.1 <=0.85 & snow fraction =0 8 (general) 9 Carbonate test no, but CAMEL9.1 <=0.85 & snow fraction >0 9(general+snow/ice) 9All the others & snow fraction = 0 8 (general) 7 All the others & snow fraction > 0 9(general+snow/ice) 7
Carbonate test: (CAMEL10.6 – CAMEL11.3) > 0.009 & ASTER NDVI < 0.2 & CAMEL3.6 < 0.9 Note that CAMEL V002 makes use of two more laboratory datasets than does V001—V001 does not include lab version 9 or 11. The addition of these lab datasets was made in V002 to more accurately
€
e = cU
€
e
€
c
€
c
MEASURES UNIFIED AND COHERENT LAND SURFACE EMISSIVITY ATBD
10
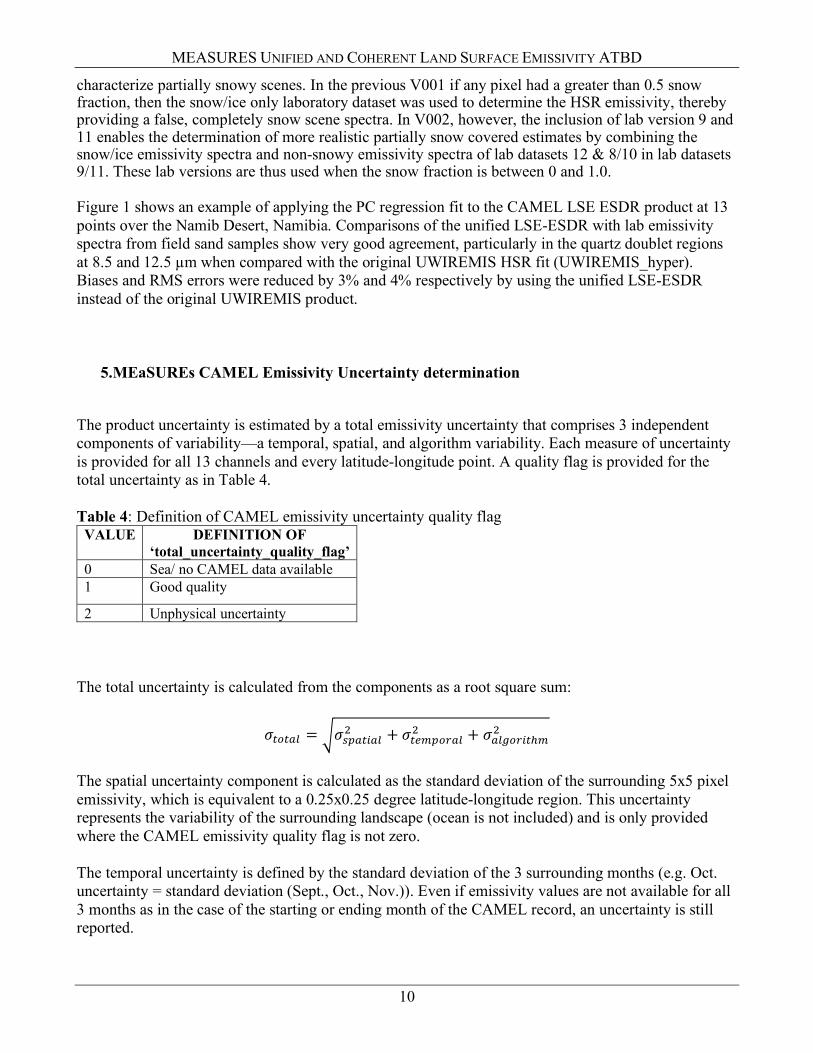
characterize partially snowy scenes. In the previous V001 if any pixel had a greater than 0.5 snow fraction, then the snow/ice only laboratory dataset was used to determine the HSR emissivity, thereby providing a false, completely snow scene spectra. In V002, however, the inclusion of lab version 9 and 11 enables the determination of more realistic partially snow covered estimates by combining the snow/ice emissivity spectra and non-snowy emissivity spectra of lab datasets 12 & 8/10 in lab datasets 9/11. These lab versions are thus used when the snow fraction is between 0 and 1.0. Figure 1 shows an example of applying the PC regression fit to the CAMEL LSE ESDR product at 13 points over the Namib Desert, Namibia. Comparisons of the unified LSE-ESDR with lab emissivity spectra from field sand samples show very good agreement, particularly in the quartz doublet regions at 8.5 and 12.5 µm when compared with the original UWIREMIS HSR fit (UWIREMIS_hyper). Biases and RMS errors were reduced by 3% and 4% respectively by using the unified LSE-ESDR instead of the original UWIREMIS product.
5.MEaSUREs CAMEL Emissivity Uncertainty determination
The product uncertainty is estimated by a total emissivity uncertainty that comprises 3 independent components of variability—a temporal, spatial, and algorithm variability. Each measure of uncertainty is provided for all 13 channels and every latitude-longitude point. A quality flag is provided for the total uncertainty as in Table 4. Table 4: Definition of CAMEL emissivity uncertainty quality flag
VALUE DEFINITION OF ‘total_uncertainty_quality_flag’
0 Sea/ no CAMEL data available 1 Good quality
2 Unphysical uncertainty The total uncertainty is calculated from the components as a root square sum:
𝜎12134 = 5𝜎67318349 + 𝜎1:;72<349 + 𝜎34=2<81>;9
The spatial uncertainty component is calculated as the standard deviation of the surrounding 5x5 pixel emissivity, which is equivalent to a 0.25x0.25 degree latitude-longitude region. This uncertainty represents the variability of the surrounding landscape (ocean is not included) and is only provided where the CAMEL emissivity quality flag is not zero. The temporal uncertainty is defined by the standard deviation of the 3 surrounding months (e.g. Oct. uncertainty = standard deviation (Sept., Oct., Nov.)). Even if emissivity values are not available for all 3 months as in the case of the starting or ending month of the CAMEL record, an uncertainty is still reported.
MEASURES UNIFIED AND COHERENT LAND SURFACE EMISSIVITY ATBD
11
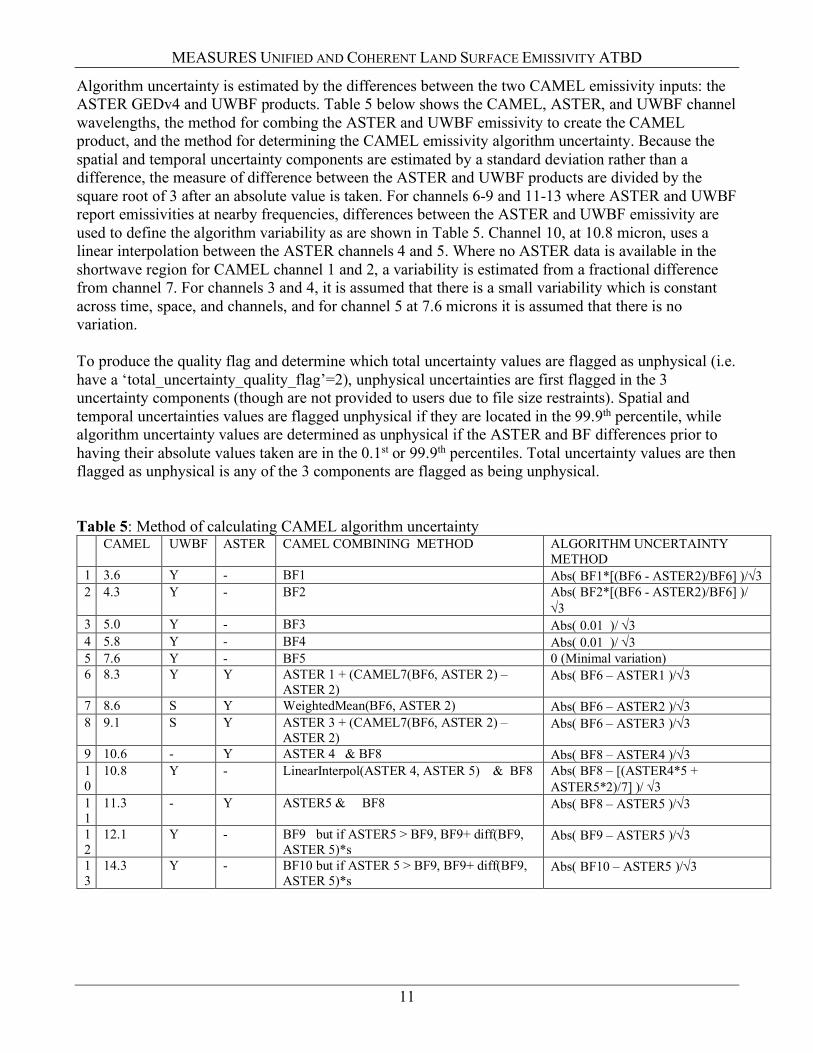
Algorithm uncertainty is estimated by the differences between the two CAMEL emissivity inputs: the ASTER GEDv4 and UWBF products. Table 5 below shows the CAMEL, ASTER, and UWBF channel wavelengths, the method for combing the ASTER and UWBF emissivity to create the CAMEL product, and the method for determining the CAMEL emissivity algorithm uncertainty. Because the spatial and temporal uncertainty components are estimated by a standard deviation rather than a difference, the measure of difference between the ASTER and UWBF products are divided by the square root of 3 after an absolute value is taken. For channels 6-9 and 11-13 where ASTER and UWBF report emissivities at nearby frequencies, differences between the ASTER and UWBF emissivity are used to define the algorithm variability as are shown in Table 5. Channel 10, at 10.8 micron, uses a linear interpolation between the ASTER channels 4 and 5. Where no ASTER data is available in the shortwave region for CAMEL channel 1 and 2, a variability is estimated from a fractional difference from channel 7. For channels 3 and 4, it is assumed that there is a small variability which is constant across time, space, and channels, and for channel 5 at 7.6 microns it is assumed that there is no variation. To produce the quality flag and determine which total uncertainty values are flagged as unphysical (i.e. have a ‘total_uncertainty_quality_flag’=2), unphysical uncertainties are first flagged in the 3 uncertainty components (though are not provided to users due to file size restraints). Spatial and temporal uncertainties values are flagged unphysical if they are located in the 99.9th percentile, while algorithm uncertainty values are determined as unphysical if the ASTER and BF differences prior to having their absolute values taken are in the 0.1st or 99.9th percentiles. Total uncertainty values are then flagged as unphysical is any of the 3 components are flagged as being unphysical. Table 5: Method of calculating CAMEL algorithm uncertainty
CAMEL UWBF ASTER CAMEL COMBINING METHOD ALGORITHM UNCERTAINTY METHOD
1 3.6 Y - BF1 Abs( BF1*[(BF6 - ASTER2)/BF6] )/Ö3 2 4.3 Y - BF2 Abs( BF2*[(BF6 - ASTER2)/BF6] )/
Ö3 3 5.0 Y - BF3 Abs( 0.01 )/ Ö3 4 5.8 Y - BF4 Abs( 0.01 )/ Ö3 5 7.6 Y - BF5 0 (Minimal variation) 6 8.3 Y Y ASTER 1 + (CAMEL7(BF6, ASTER 2) –
ASTER 2) Abs( BF6 – ASTER1 )/Ö3
7 8.6 S Y WeightedMean(BF6, ASTER 2) Abs( BF6 – ASTER2 )/Ö3 8 9.1 S Y ASTER 3 + (CAMEL7(BF6, ASTER 2) –
ASTER 2) Abs( BF6 – ASTER3 )/Ö3
9 10.6 - Y ASTER 4 & BF8 Abs( BF8 – ASTER4 )/Ö3 10
10.8 Y - LinearInterpol(ASTER 4, ASTER 5) & BF8 Abs( BF8 – [(ASTER4*5 + ASTER5*2)/7] )/ Ö3
11
11.3 - Y ASTER5 & BF8 Abs( BF8 – ASTER5 )/Ö3
12
12.1 Y - BF9 but if ASTER5 > BF9, BF9+ diff(BF9, ASTER 5)*s
Abs( BF9 – ASTER5 )/Ö3
13
14.3 Y - BF10 but if ASTER 5 > BF9, BF9+ diff(BF9, ASTER 5)*s
Abs( BF10 – ASTER5 )/Ö3
MEASURES UNIFIED AND COHERENT LAND SURFACE EMISSIVITY ATBD
12
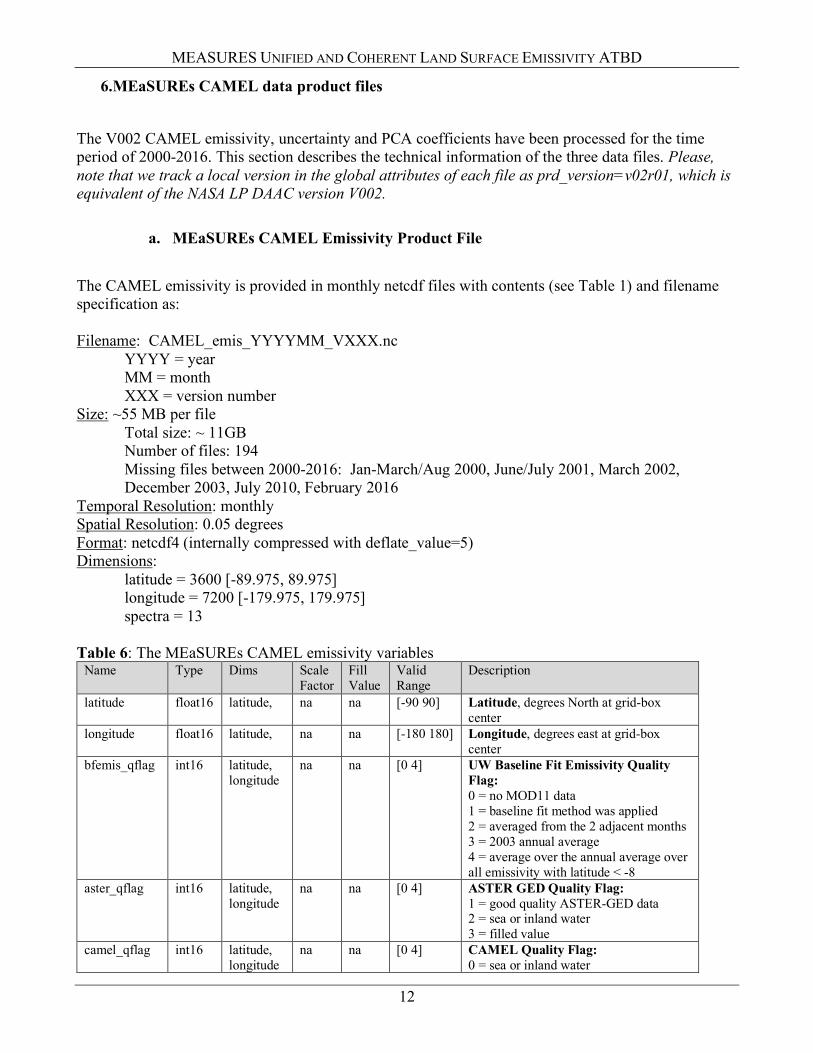
6.MEaSUREs CAMEL data product files
The V002 CAMEL emissivity, uncertainty and PCA coefficients have been processed for the time period of 2000-2016. This section describes the technical information of the three data files. Please, note that we track a local version in the global attributes of each file as prd_version=v02r01, which is equivalent of the NASA LP DAAC version V002.
a. MEaSUREs CAMEL Emissivity Product File The CAMEL emissivity is provided in monthly netcdf files with contents (see Table 1) and filename specification as: Filename: CAMEL_emis_YYYYMM_VXXX.nc YYYY = year MM = month XXX = version number Size: ~55 MB per file
Total size: ~ 11GB Number of files: 194 Missing files between 2000-2016: Jan-March/Aug 2000, June/July 2001, March 2002, December 2003, July 2010, February 2016
Temporal Resolution: monthly Spatial Resolution: 0.05 degrees Format: netcdf4 (internally compressed with deflate_value=5) Dimensions: latitude = 3600 [-89.975, 89.975] longitude = 7200 [-179.975, 179.975] spectra = 13 Table 6: The MEaSUREs CAMEL emissivity variables
Name Type Dims Scale Factor
Fill Value
Valid Range
Description
latitude float16 latitude, na na [-90 90] Latitude, degrees North at grid-box center
longitude float16 latitude, na na [-180 180] Longitude, degrees east at grid-box center
bfemis_qflag int16 latitude, longitude
na na [0 4] UW Baseline Fit Emissivity Quality Flag: 0 = no MOD11 data 1 = baseline fit method was applied 2 = averaged from the 2 adjacent months 3 = 2003 annual average 4 = average over the annual average over all emissivity with latitude < -8
aster_qflag int16 latitude, longitude
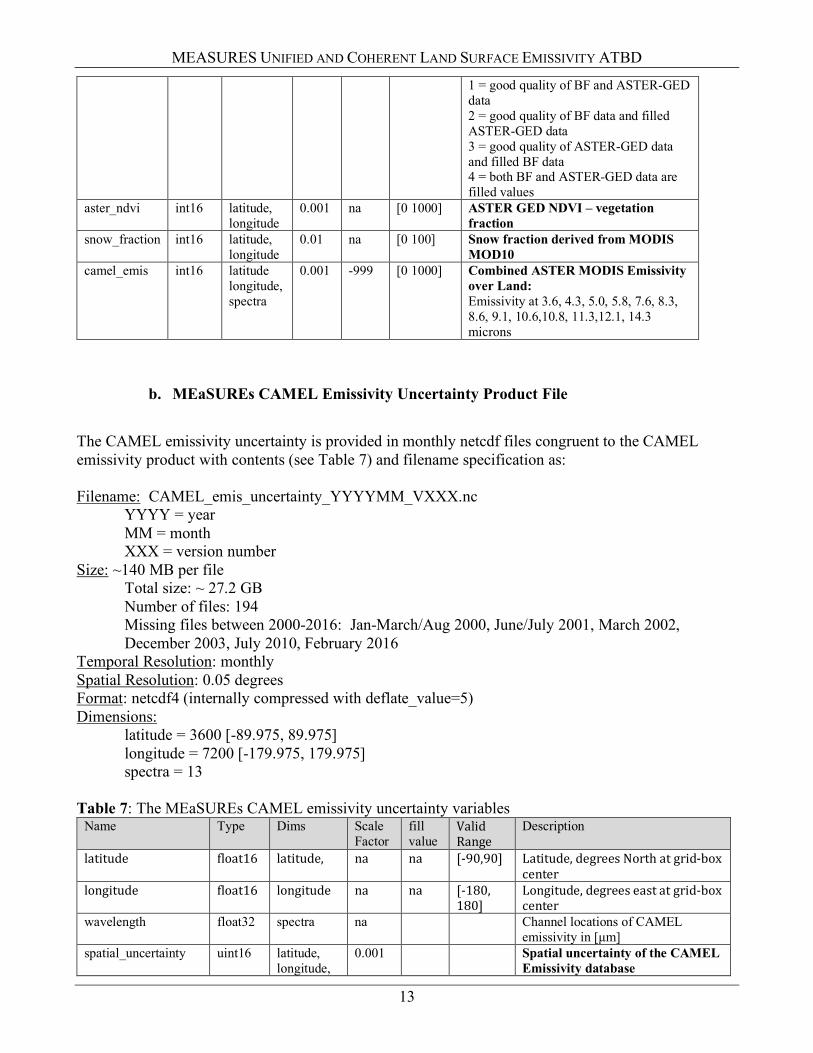
na na [0 4] ASTER GED Quality Flag: 1 = good quality ASTER-GED data 2 = sea or inland water 3 = filled value
camel_qflag int16 latitude, longitude
na na [0 4] CAMEL Quality Flag: 0 = sea or inland water
MEASURES UNIFIED AND COHERENT LAND SURFACE EMISSIVITY ATBD
13
1 = good quality of BF and ASTER-GED data 2 = good quality of BF data and filled ASTER-GED data 3 = good quality of ASTER-GED data and filled BF data 4 = both BF and ASTER-GED data are filled values
aster_ndvi int16 latitude, longitude
0.001 na [0 1000] ASTER GED NDVI – vegetation fraction
snow_fraction int16 latitude, longitude
0.01 na [0 100] Snow fraction derived from MODIS MOD10
camel_emis int16 latitude longitude, spectra
0.001 -999 [0 1000] Combined ASTER MODIS Emissivity over Land: Emissivity at 3.6, 4.3, 5.0, 5.8, 7.6, 8.3, 8.6, 9.1, 10.6,10.8, 11.3,12.1, 14.3 microns
b. MEaSUREs CAMEL Emissivity Uncertainty Product File The CAMEL emissivity uncertainty is provided in monthly netcdf files congruent to the CAMEL emissivity product with contents (see Table 7) and filename specification as: Filename: CAMEL_emis_uncertainty_YYYYMM_VXXX.nc YYYY = year MM = month XXX = version number Size: ~140 MB per file
Total size: ~ 27.2 GB Number of files: 194 Missing files between 2000-2016: Jan-March/Aug 2000, June/July 2001, March 2002, December 2003, July 2010, February 2016
Temporal Resolution: monthly Spatial Resolution: 0.05 degrees Format: netcdf4 (internally compressed with deflate_value=5) Dimensions: latitude = 3600 [-89.975, 89.975] longitude = 7200 [-179.975, 179.975] spectra = 13 Table 7: The MEaSUREs CAMEL emissivity uncertainty variables
Name Type Dims Scale Factor
fill value
ValidRange
Description
latitude float16 latitude, na na [-90,90] Latitude,degreesNorthatgrid-boxcenter
longitude float16 longitude na na [-180,180]
Longitude,degreeseastatgrid-boxcenter
wavelength float32 spectra na Channel locations of CAMEL emissivity in [µm]
spatial_uncertainty uint16 latitude, longitude,
0.001 Spatial uncertainty of the CAMEL Emissivity database
MEASURES UNIFIED AND COHERENT LAND SURFACE EMISSIVITY ATBD
14
spectra temporal_uncertainty uint16 latitude,
longitude, spectra
0.001 Temporal uncertainty of the CAMEL Emissivity database
algorithm_uncertainty uint16 latitude, longitude, spectra
0.001 Algorithm uncertainty of the CAMEL Emissivity database
total_uncertainty uint16 latitude, longitude, spectra
0.001 Total uncertainty of the CAMEL Emissivity database
total_uncertainty_quality_flag
uint8 latitude, longitude, spectra
1 Quality flag of the CAMEL uncertainties 0 = Sea, no CAMEL data 1 = Good quality data 2 = Unphysical uncertainty
camel_qflag uint8 latitude, longitude
1 CAMEL Quality Flag: 0 = sea or inland water 1 = good quality of BF and ASTER-GED data 2 = good quality of BF data and filled ASTER-GED data 3 = good quality of ASTER-GED data and filled BF data 4 = both BF and ASTER-GED data are filled values
c. MEaSUREs Coefficient Product File The CAMEL PCA coefficients are the inputs of CAMEL HSR Emissivity algorithm. The CAMEL PCA coefficients are provided in monthly netcdf files congruent to the CAMEL emissivity product, with contents (see Table 8) and filename specification as: Filename: CAMEL_coef_YYYYMM_VXXX.nc
YYYY = year MM = month XXX = version number
Size: ~130 MB per file Total size: ~26 GB Number of files: 194 Missing files between 2000-2016: Jan-March/Aug 2000, June/July 2001, March 2002, December 2003, July 2010, February 2016
Temporal Resolution: monthly Spatial Resolution: 0.05 degrees Format: netcdf4 (internally compressed with deflate_value=5) Dimensions: latitude = 3600 [-89.975, 89.975] longitude = 7200 [-179.975, 179.975] max_npcs = 9 mask = 8685101 (varies by month)
MEASURES UNIFIED AND COHERENT LAND SURFACE EMISSIVITY ATBD
15
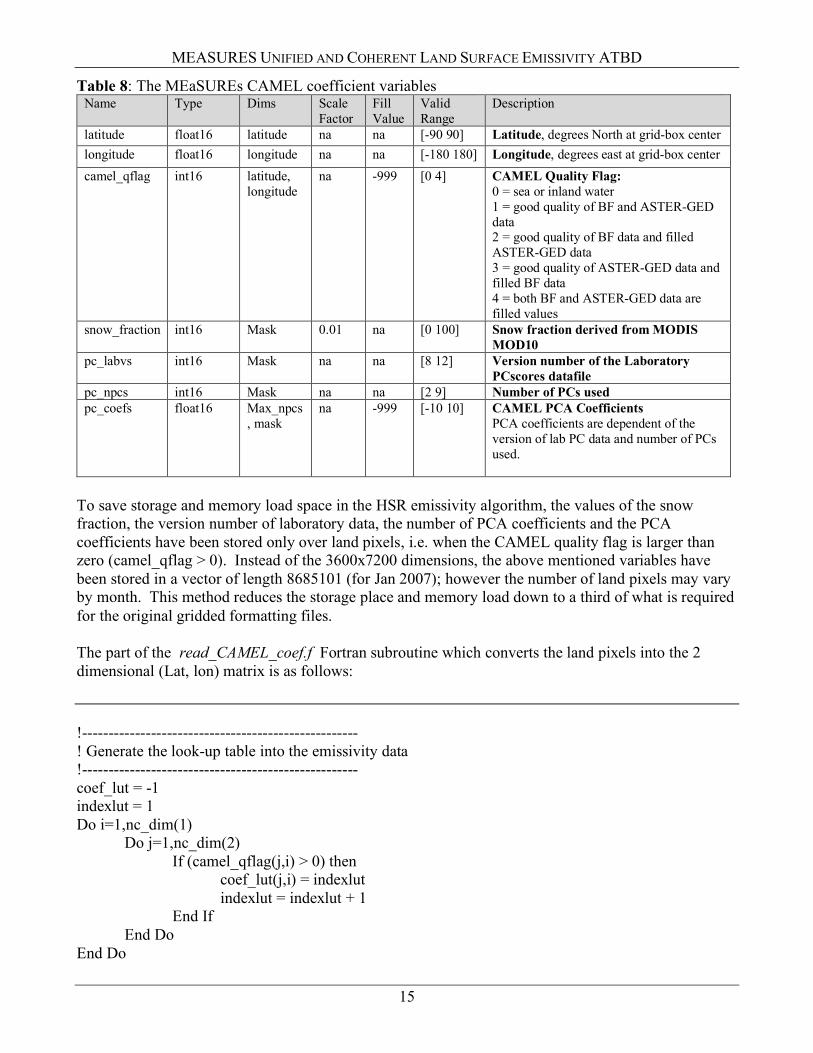
Table 8: The MEaSUREs CAMEL coefficient variables Name Type Dims Scale
Factor Fill Value
Valid Range
Description
latitude float16 latitude na na [-90 90] Latitude, degrees North at grid-box center longitude float16 longitude na na [-180 180] Longitude, degrees east at grid-box center camel_qflag int16 latitude,
longitude na -999 [0 4] CAMEL Quality Flag:
0 = sea or inland water 1 = good quality of BF and ASTER-GED data 2 = good quality of BF data and filled ASTER-GED data 3 = good quality of ASTER-GED data and filled BF data 4 = both BF and ASTER-GED data are filled values
snow_fraction int16 Mask 0.01 na [0 100] Snow fraction derived from MODIS MOD10
pc_labvs int16 Mask na na [8 12] Version number of the Laboratory PCscores datafile
pc_npcs int16 Mask na na [2 9] Number of PCs used pc_coefs float16 Max_npcs
, mask na -999 [-10 10] CAMEL PCA Coefficients
PCA coefficients are dependent of the version of lab PC data and number of PCs used.
To save storage and memory load space in the HSR emissivity algorithm, the values of the snow fraction, the version number of laboratory data, the number of PCA coefficients and the PCA coefficients have been stored only over land pixels, i.e. when the CAMEL quality flag is larger than zero (camel_qflag > 0). Instead of the 3600x7200 dimensions, the above mentioned variables have been stored in a vector of length 8685101 (for Jan 2007); however the number of land pixels may vary by month. This method reduces the storage place and memory load down to a third of what is required for the original gridded formatting files.
The part of the read_CAMEL_coef.f Fortran subroutine which converts the land pixels into the 2 dimensional (Lat, lon) matrix is as follows:
!---------------------------------------------------- ! Generate the look-up table into the emissivity data !---------------------------------------------------- coef_lut = -1 indexlut = 1 Do i=1,nc_dim(1)
Do j=1,nc_dim(2) If (camel_qflag(j,i) > 0) then
coef_lut(j,i) = indexlut indexlut = indexlut + 1
End If End Do
End Do

MEASURES UNIFIED AND COHERENT LAND SURFACE EMISSIVITY ATBD
16
! extract coef for a pixel (gridx,gridy): If (coef_lut(gridx,gridy) > 0) Then coeff(:) = pcacoefs(1:npcs,coef_lut(gridx,gridy))*pca_sfac + pca_offs ! where npcs is between 1 and 13, pca_sfac is the scale factor and pca_offs is the offset.
The part of the read_CAMEL_coef_V002.m Matlab subroutine which converts the land pixels into the 2 dimensional (Lat, lon) matrix is as follows:
for i=1:max_npcs clear coef coef=double(squeeze(pc_coefs(i,:))); indexlut=1; for j=1:Xmax for k=1:Ymax if camel.camel_qflag(k,j) > 0 camel.coef(i,k,j) = coef(indexlut); if i == 1 camel.pcnpcs(k,j) = double(pc_npcs(indexlut)); camel.pclabvs(k,j) =double(pc_labvs(indexlut)); camel.snowf(k,j) =double( snow_fraction(indexlut)); end indexlut = indexlut + 1; end end end end
7.Description of the MEaSUREs CAMEL High Spectral Resolution Algorithm
The standalone version of the HSR emissivity Algorithm has been developed in MATLAB and Fortran. In this section, you can find technical details about these software packages.
a. Fortran version This package contains software to create a Fortran library to calculate the CAMEL High Spectral Resolution emissivity as well as a sample program for users to understand how to run the algorithm. The software runs on version 2.0 (NSA LPDAAC V002/PGE v02r01) CAMEL emissivity coefficients data. Output of the software can be (1) a 5 wavenumber resolution emissivity at 417 wavenumbers (between 698 and 2778) and/or (2) an instrument specific emissivity. Requirements: Software requirement: netcdf4 library (gcc) Software package contains:
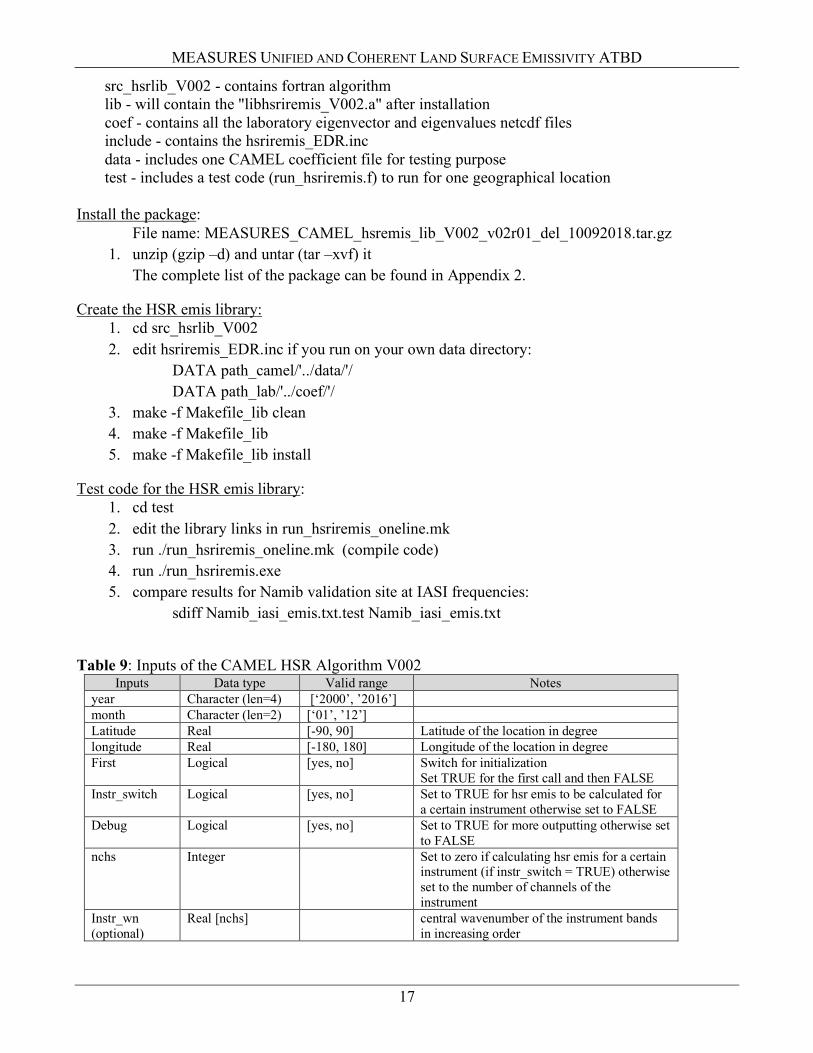
MEASURES UNIFIED AND COHERENT LAND SURFACE EMISSIVITY ATBD
17
src_hsrlib_V002 - contains fortran algorithm lib - will contain the "libhsriremis_V002.a" after installation coef - contains all the laboratory eigenvector and eigenvalues netcdf files include - contains the hsriremis_EDR.inc data - includes one CAMEL coefficient file for testing purpose test - includes a test code (run_hsriremis.f) to run for one geographical location Install the package:
File name: MEASURES_CAMEL_hsremis_lib_V002_v02r01_del_10092018.tar.gz 1. unzip (gzip –d) and untar (tar –xvf) it
The complete list of the package can be found in Appendix 2.
Create the HSR emis library: 1. cd src_hsrlib_V002 2. edit hsriremis_EDR.inc if you run on your own data directory:
DATA path_camel/'../data/'/ DATA path_lab/'../coef/'/
3. make -f Makefile_lib clean 4. make -f Makefile_lib 5. make -f Makefile_lib install
Test code for the HSR emis library: 1. cd test 2. edit the library links in run_hsriremis_oneline.mk 3. run ./run_hsriremis_oneline.mk (compile code) 4. run ./run_hsriremis.exe 5. compare results for Namib validation site at IASI frequencies:
sdiff Namib_iasi_emis.txt.test Namib_iasi_emis.txt
Table 9: Inputs of the CAMEL HSR Algorithm V002
Inputs Data type Valid range Notes year Character (len=4) [‘2000’, ’2016’] month Character (len=2) [‘01’, ’12’] Latitude Real [-90, 90] Latitude of the location in degree longitude Real [-180, 180] Longitude of the location in degree First Logical [yes, no] Switch for initialization
Set TRUE for the first call and then FALSE Instr_switch Logical [yes, no] Set to TRUE for hsr emis to be calculated for
a certain instrument otherwise set to FALSE Debug Logical [yes, no] Set to TRUE for more outputting otherwise set
to FALSE nchs Integer Set to zero if calculating hsr emis for a certain
instrument (if instr_switch = TRUE) otherwise set to the number of channels of the instrument
Instr_wn (optional)
Real [nchs] central wavenumber of the instrument bands in increasing order
MEASURES UNIFIED AND COHERENT LAND SURFACE EMISSIVITY ATBD
18
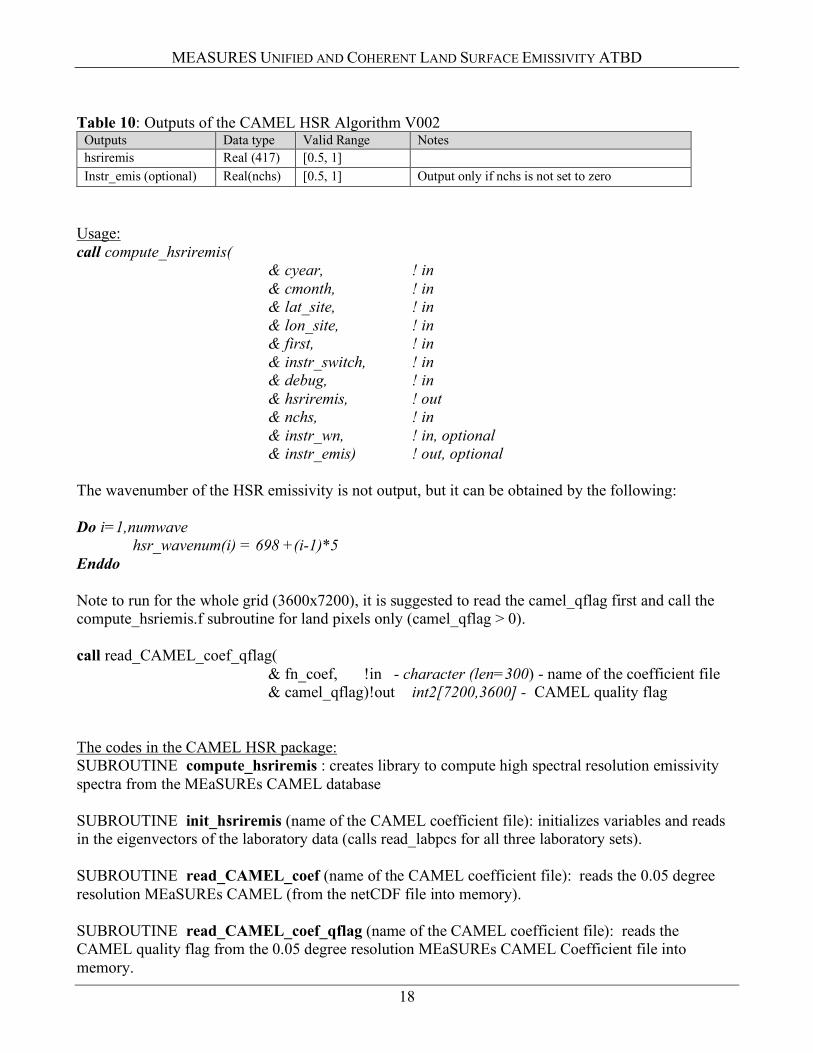
Table 10: Outputs of the CAMEL HSR Algorithm V002
Outputs Data type Valid Range Notes hsriremis Real (417) [0.5, 1] Instr_emis (optional) Real(nchs) [0.5, 1] Output only if nchs is not set to zero
Usage: call compute_hsriremis( & cyear, ! in & cmonth, ! in & lat_site, ! in
& lon_site, ! in & first, ! in & instr_switch, ! in & debug, ! in & hsriremis, ! out & nchs, ! in & instr_wn, ! in, optional & instr_emis) ! out, optional
The wavenumber of the HSR emissivity is not output, but it can be obtained by the following: Do i=1,numwave hsr_wavenum(i) = 698 +(i-1)*5 Enddo Note to run for the whole grid (3600x7200), it is suggested to read the camel_qflag first and call the compute_hsriemis.f subroutine for land pixels only (camel_qflag > 0). call read_CAMEL_coef_qflag(
& fn_coef, !in - character (len=300) - name of the coefficient file & camel_qflag)!out int2[7200,3600] - CAMEL quality flag
The codes in the CAMEL HSR package: SUBROUTINE compute_hsriremis : creates library to compute high spectral resolution emissivity spectra from the MEaSUREs CAMEL database SUBROUTINE init_hsriremis (name of the CAMEL coefficient file): initializes variables and reads in the eigenvectors of the laboratory data (calls read_labpcs for all three laboratory sets). SUBROUTINE read_CAMEL_coef (name of the CAMEL coefficient file): reads the 0.05 degree resolution MEaSUREs CAMEL (from the netCDF file into memory). SUBROUTINE read_CAMEL_coef_qflag (name of the CAMEL coefficient file): reads the CAMEL quality flag from the 0.05 degree resolution MEaSUREs CAMEL Coefficient file into memory.

MEASURES UNIFIED AND COHERENT LAND SURFACE EMISSIVITY ATBD
19
SUBROUTINE read_labpcs (laboratory data version): read the eigenvectors and eigenvalues of the selected laboratory measurements. SUBROUTINE recon_hsriremis (number of PCs to use, version number of laboratory set, coefficients(output), hsriremis (output)): creates high spectra resolution emissivities at 417 wavenumbers from the MEaSUREs CAMEL emissivity database (at 13 hinge points) and laboratory measurements using principal component analyses. SUBROUTINE select_wavenum hsremis (number of channels, instr_wavenum, instr_emis (output)): is called if instr_switch is set to TRUE. The subroutine finds the closest wavenumber from the MEaSUREs CAMEL HSR emissivity spectra for the instrument frequency and assigns the instrument emissivity by either choosing the closest spectral point value or bilinear interpolating between the two closest spectral point values. Compute_hsriremis
Calls init_hsriremis
(If first) Calls read_labpcs
Calls read_CAMEL_coef Calls recon_hsriremis (If CAMEL_qflag > 0 ) Calls select_wavenum (if instr_switch)
Figure 2: Structure of the MEaSUREs CAMEL HSR Algorithm
b. Matlab version
The package contains software to calculate the CAMEL High Spectral Resolution emissivity as well as a sample program for users to understand how to run the algorithm. The software runs on the version 2.0 (V002) CAMEL emissivity coefficients data. The HSR emissivity can be calculated using the CAMEL 13 hinge points emissivity values or the CAMEL Principal Component Analyses coefficients as input. Install the package:
File name: MEASURES_CAMEL_hsremis matlab_V002_v02r01_del_10092018.tar.gz 1. unzip (gzip -d) and untar (tar -xvf) it

MEASURES UNIFIED AND COHERENT LAND SURFACE EMISSIVITY ATBD
20
Software package contains: coef - contains files of laboratory eigenvectors and eigenvalues (Matlab format) data - contains MEaSUREs emissivity and coefficients files for a test month (2007 January) outdir -contains an image and a mat-file of the test case result for sanity check mfiles -contains the MEaSUREs HSR algorithm
file structure: main code: run_MEASUREs_hsremis_test_V002.m calls: -read_CAMEL_coef_V002.m
-read_CAMEL_emis_V002.m -create_HSRemis_fromCAMELcoef_V002.m
-create_HSRemis_fromCAMELemis_V002.m Test run: 1. go to the mfiles directory 2. start matlab 3. run: run_MEASUREs_hsremis_test_V002.m 4. compare the resulting image and mat-file in the output directory with the *orig.png and *orig.mat file
MEASURES UNIFIED AND COHERENT LAND SURFACE EMISSIVITY ATBD
21
2. References
Anderson, M.C., Norman, J.M., Mecikalski, J.R., Otkin, J.A., & Kustas, W.P. (2007). A climatological study of evapotranspiration and moisture stress across the continental United States based on thermal remote sensing: 2. Surface moisture climatology. Journal of Geophysical Research-Atmospheres, 112.
Borbas, E. E., and B. C. Ruston (2010), The RTTOV UWiremis IR land surface emissivity module, Mission Report NWPSAF-MO-VS-042, EUMETSAT Numerical Weather Prediction. Satellite Applications Facility, Met Office, Exeter, U.K. URL: http://research.metoffice.gov.uk/research/interproj/nwpsaf/vs_reports/nwpsaf-mo-vs-042.pdf
Borbas, E (2014): Investigation into the angular dependence of IR surface emissivity. Mission Report. EUMETSAT NWPSAF-MO-VS-050. https://nwpsaf.eu/vs_reports/nwpsaf-mo-vs-050.pdf
Borbas, E., Hulley G., Feltz M., Knuteson, R., Hook, S. J. (2018): The Combined ASTER MODIS Emissivity Over Land (CAMEL) Part 1: Methodology and High Spectral Resolution Application, Remote Sensing, Special Issue “Advancing Earth Surface representation via Enhanced Use of Earth Observations in Monitoring and Forecasting Applications”, 10, 643, doi:10.3390/rs10040643.
Borbas, E. & Feltz, M. (2019) Updating the CAMEL surface emissivity atlas for RTTOV. Mission Report. EUMETSAT NWPSAF-MO-VS-058, https://www.nwpsaf.eu/publications/vs_reports/nwpsaf-mo-vs-058.pdf
Feltz M., Borbas, E., Knuteson, R., Hulley G. Hook, S. J. (2018a): The Combined ASTER MODIS Emissivity Over Land (CAMEL) Part 2: Uncertainty and Validation, Remote Sensing, Special Issue “Advancing Earth Surface representation via Enhanced Use of Earth Observations in Monitoring and Forecasting Applications”, 10, 664, doi:10.3390/rs10050664.
Feltz M., Borbas, E., Knuteson, R., Hulley G. Hook, S. J. (2018b): The Combined ASTER MODIS Emissivity Over Land (CAMEL) Global Broadband Infrared Emissivity Product, Remote Sensing, Special Issue “Advancing Earth Surface representation via Enhanced Use of Earth Observations in Monitoring and Forecasting Applications”, 10, 1027, doi:10.3390/rs10071027.
French, A.N., Schmugge, T.J., Ritchie, J.C., Hsu, A., Jacob, F., & Ogawa, K. (2008). Detecting land cover change at the Jornada Experimental Range, New Mexico with ASTER emissivities. Remote Sensing of Environment, 112, 1730-1748.
Hook, S. (2017) Combined ASTER and MODIS Emissivity database over Land (CAMEL) Emissivity Monthly Global 0.05Deg V001 [Data set]. NASA EOSDIS Land Processed DAAC, doi:10.5067/MEaSUREs/LSTE/CAM5K30EM.001.
Hulley, G.C., & Hook, S.J. (2009). The North American ASTER Land Surface Emissivity Database (NAALSED) Version 2.0. Remote Sensing of Environment, 1967-1975.
Hulley, G., Hook S.J, Abbott, E., Malakar, N., Islam, T., Abrams, M., (2015), The ASTER Global Emissivity Dataset (ASTER GED): Mapping Earth’s emissivity at 100 meter spatial resolution, Geophysical Research Letters, 42, doi:10.1002/2015GL065564.
Moran, M.S. (2003). Thermal infrared measurement as an indicator of plant ecosystem health, in: Thermal Remote Sensing in Land Surface Processes, edited: Quattrochi, D. A. and Luvall, J., Taylor and Francis, 257-282.
Seemann, S.W., Li, J., Menzel, W.P., & Gumley, L.E. (2003). Operational retrieval of atmospheric temperature, moisture, and ozone from MODIS infrared radiances. Journal of Applied Meteorology, 42, 1072-1091.
MEASURES UNIFIED AND COHERENT LAND SURFACE EMISSIVITY ATBD
22
Seemann, S.W., Borbas, E.E., Knuteson, R.O., Stephenson, G.R., & Huang, H.L. (2008). Development of a global infrared land surface emissivity database for application to clear sky sounding retrievals from multispectral satellite radiance measurements. Journal of Applied Meteorology and Climatology, 47, 108-123.
Tarantola, A., 2005. Inverse Problem Theory and Methods for Model Parameter Estimation. Society of Industrial and Applied Mathematics (SIAM), and Springer-Verlag.
Willett, K., P. Thorne and the ISTI Steering Committee, 2011. Progress Report for the International Surface Temperature Initiative. http://www.wmo.int/pages/prog/gcos/SC-XIX/12%20Intl%20Surface%20Temp%20Initiative--Willett.pdf.
Zhou, L., Dickinson, R.E., Tian, Y., Jin, M., Ogawa, K., Yu, H., & Schmugge, T. (2003). A sensitivity study of climate and energy balance simulations with use of satellite-derived emissivity data over Northern Africa and the Arabian Peninsula. Journal of Geophysical Research-Atmospheres, 108, 4795.
MEASURES UNIFIED AND COHERENT LAND SURFACE EMISSIVITY ATBD
23
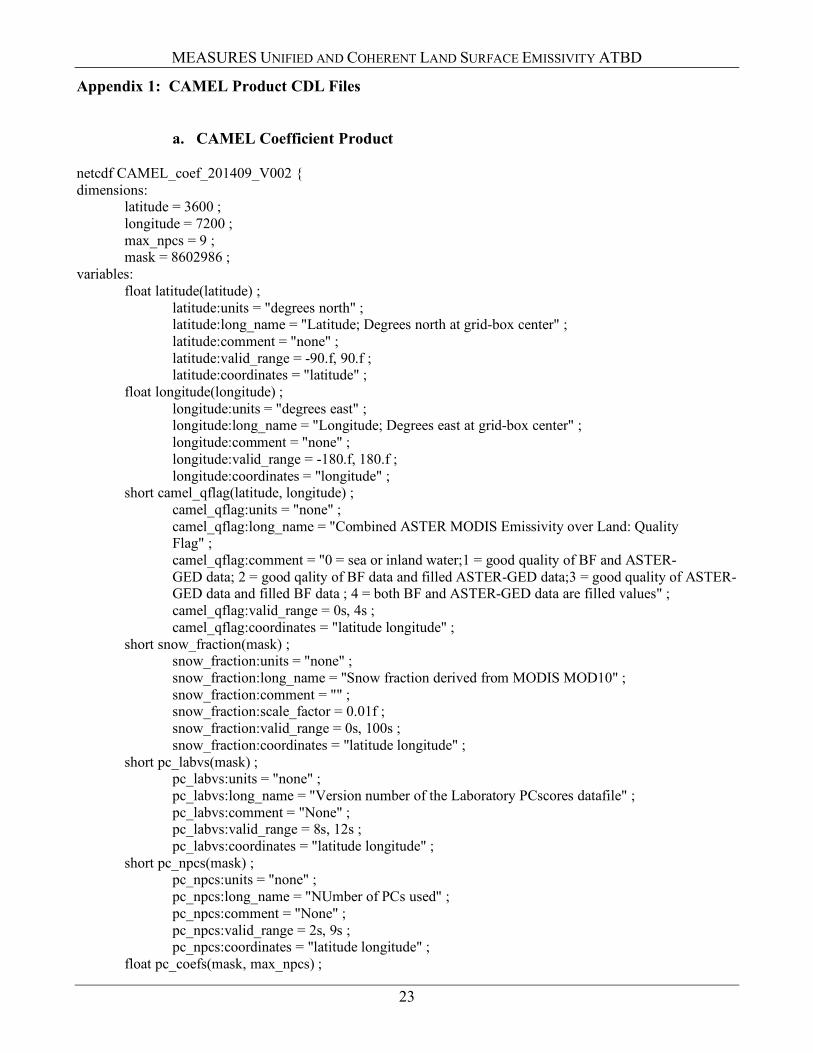
Appendix 1: CAMEL Product CDL Files
a. CAMEL Coefficient Product netcdf CAMEL_coef_201409_V002 { dimensions: latitude = 3600 ; longitude = 7200 ; max_npcs = 9 ; mask = 8602986 ; variables: float latitude(latitude) ; latitude:units = "degrees north" ; latitude:long_name = "Latitude; Degrees north at grid-box center" ; latitude:comment = "none" ; latitude:valid_range = -90.f, 90.f ; latitude:coordinates = "latitude" ; float longitude(longitude) ; longitude:units = "degrees east" ; longitude:long_name = "Longitude; Degrees east at grid-box center" ; longitude:comment = "none" ; longitude:valid_range = -180.f, 180.f ; longitude:coordinates = "longitude" ; short camel_qflag(latitude, longitude) ; camel_qflag:units = "none" ; camel_qflag:long_name = "Combined ASTER MODIS Emissivity over Land: Quality
Flag" ; camel_qflag:comment = "0 = sea or inland water;1 = good quality of BF and ASTER-
GED data; 2 = good qality of BF data and filled ASTER-GED data;3 = good quality of ASTER-GED data and filled BF data ; 4 = both BF and ASTER-GED data are filled values" ;
camel_qflag:valid_range = 0s, 4s ; camel_qflag:coordinates = "latitude longitude" ; short snow_fraction(mask) ; snow_fraction:units = "none" ; snow_fraction:long_name = "Snow fraction derived from MODIS MOD10" ; snow_fraction:comment = "" ; snow_fraction:scale_factor = 0.01f ; snow_fraction:valid_range = 0s, 100s ; snow_fraction:coordinates = "latitude longitude" ; short pc_labvs(mask) ; pc_labvs:units = "none" ; pc_labvs:long_name = "Version number of the Laboratory PCscores datafile" ; pc_labvs:comment = "None" ; pc_labvs:valid_range = 8s, 12s ; pc_labvs:coordinates = "latitude longitude" ; short pc_npcs(mask) ; pc_npcs:units = "none" ; pc_npcs:long_name = "NUmber of PCs used" ; pc_npcs:comment = "None" ; pc_npcs:valid_range = 2s, 9s ; pc_npcs:coordinates = "latitude longitude" ; float pc_coefs(mask, max_npcs) ;
MEASURES UNIFIED AND COHERENT LAND SURFACE EMISSIVITY ATBD
24
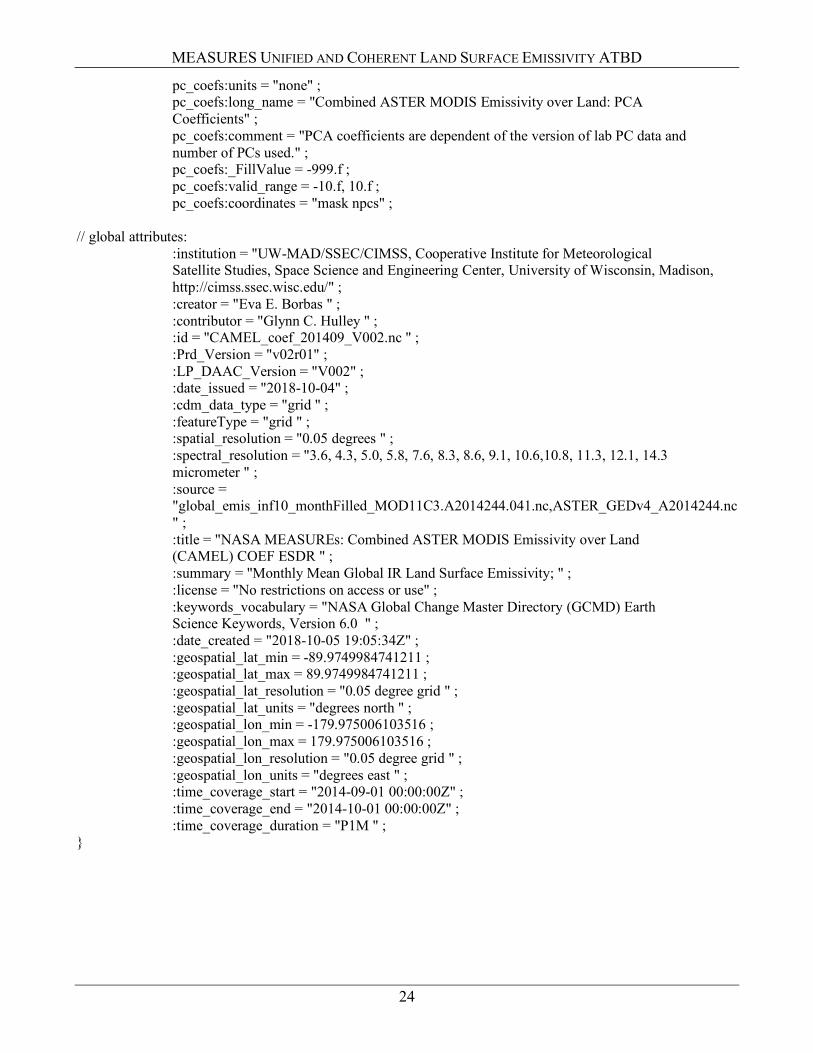
pc_coefs:units = "none" ; pc_coefs:long_name = "Combined ASTER MODIS Emissivity over Land: PCA
Coefficients" ; pc_coefs:comment = "PCA coefficients are dependent of the version of lab PC data and
number of PCs used." ; pc_coefs:_FillValue = -999.f ; pc_coefs:valid_range = -10.f, 10.f ; pc_coefs:coordinates = "mask npcs" ; // global attributes: :institution = "UW-MAD/SSEC/CIMSS, Cooperative Institute for Meteorological
Satellite Studies, Space Science and Engineering Center, University of Wisconsin, Madison, http://cimss.ssec.wisc.edu/" ;
:creator = "Eva E. Borbas " ; :contributor = "Glynn C. Hulley " ; :id = "CAMEL_coef_201409_V002.nc " ; :Prd_Version = "v02r01" ; :LP_DAAC_Version = "V002" ; :date_issued = "2018-10-04" ; :cdm_data_type = "grid " ; :featureType = "grid " ; :spatial_resolution = "0.05 degrees " ; :spectral_resolution = "3.6, 4.3, 5.0, 5.8, 7.6, 8.3, 8.6, 9.1, 10.6,10.8, 11.3, 12.1, 14.3
micrometer " ; :source =
"global_emis_inf10_monthFilled_MOD11C3.A2014244.041.nc,ASTER_GEDv4_A2014244.nc" ;
:title = "NASA MEASUREs: Combined ASTER MODIS Emissivity over Land (CAMEL) COEF ESDR " ;
:summary = "Monthly Mean Global IR Land Surface Emissivity; " ; :license = "No restrictions on access or use" ; :keywords_vocabulary = "NASA Global Change Master Directory (GCMD) Earth
Science Keywords, Version 6.0 " ; :date_created = "2018-10-05 19:05:34Z" ; :geospatial_lat_min = -89.9749984741211 ; :geospatial_lat_max = 89.9749984741211 ; :geospatial_lat_resolution = "0.05 degree grid " ; :geospatial_lat_units = "degrees north " ; :geospatial_lon_min = -179.975006103516 ; :geospatial_lon_max = 179.975006103516 ; :geospatial_lon_resolution = "0.05 degree grid " ; :geospatial_lon_units = "degrees east " ; :time_coverage_start = "2014-09-01 00:00:00Z" ; :time_coverage_end = "2014-10-01 00:00:00Z" ; :time_coverage_duration = "P1M " ; }
MEASURES UNIFIED AND COHERENT LAND SURFACE EMISSIVITY ATBD
25
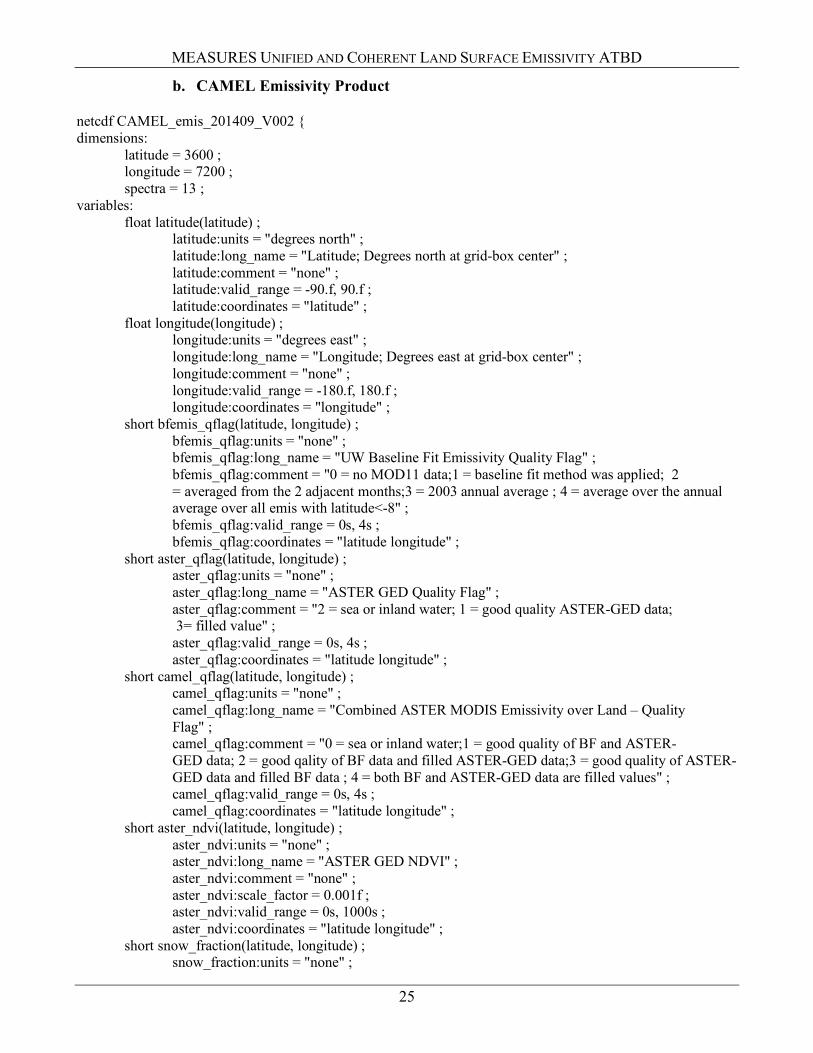
b. CAMEL Emissivity Product netcdf CAMEL_emis_201409_V002 { dimensions: latitude = 3600 ; longitude = 7200 ; spectra = 13 ; variables: float latitude(latitude) ; latitude:units = "degrees north" ; latitude:long_name = "Latitude; Degrees north at grid-box center" ; latitude:comment = "none" ; latitude:valid_range = -90.f, 90.f ; latitude:coordinates = "latitude" ; float longitude(longitude) ; longitude:units = "degrees east" ; longitude:long_name = "Longitude; Degrees east at grid-box center" ; longitude:comment = "none" ; longitude:valid_range = -180.f, 180.f ; longitude:coordinates = "longitude" ; short bfemis_qflag(latitude, longitude) ; bfemis_qflag:units = "none" ; bfemis_qflag:long_name = "UW Baseline Fit Emissivity Quality Flag" ; bfemis_qflag:comment = "0 = no MOD11 data;1 = baseline fit method was applied; 2
= averaged from the 2 adjacent months;3 = 2003 annual average ; 4 = average over the annual average over all emis with latitude<-8" ;
bfemis_qflag:valid_range = 0s, 4s ; bfemis_qflag:coordinates = "latitude longitude" ; short aster_qflag(latitude, longitude) ; aster_qflag:units = "none" ; aster_qflag:long_name = "ASTER GED Quality Flag" ; aster_qflag:comment = "2 = sea or inland water; 1 = good quality ASTER-GED data;
3= filled value" ; aster_qflag:valid_range = 0s, 4s ; aster_qflag:coordinates = "latitude longitude" ; short camel_qflag(latitude, longitude) ; camel_qflag:units = "none" ; camel_qflag:long_name = "Combined ASTER MODIS Emissivity over Land – Quality
Flag" ; camel_qflag:comment = "0 = sea or inland water;1 = good quality of BF and ASTER-
GED data; 2 = good qality of BF data and filled ASTER-GED data;3 = good quality of ASTER-GED data and filled BF data ; 4 = both BF and ASTER-GED data are filled values" ;
camel_qflag:valid_range = 0s, 4s ; camel_qflag:coordinates = "latitude longitude" ; short aster_ndvi(latitude, longitude) ; aster_ndvi:units = "none" ; aster_ndvi:long_name = "ASTER GED NDVI" ; aster_ndvi:comment = "none" ; aster_ndvi:scale_factor = 0.001f ; aster_ndvi:valid_range = 0s, 1000s ; aster_ndvi:coordinates = "latitude longitude" ; short snow_fraction(latitude, longitude) ; snow_fraction:units = "none" ;
MEASURES UNIFIED AND COHERENT LAND SURFACE EMISSIVITY ATBD
26
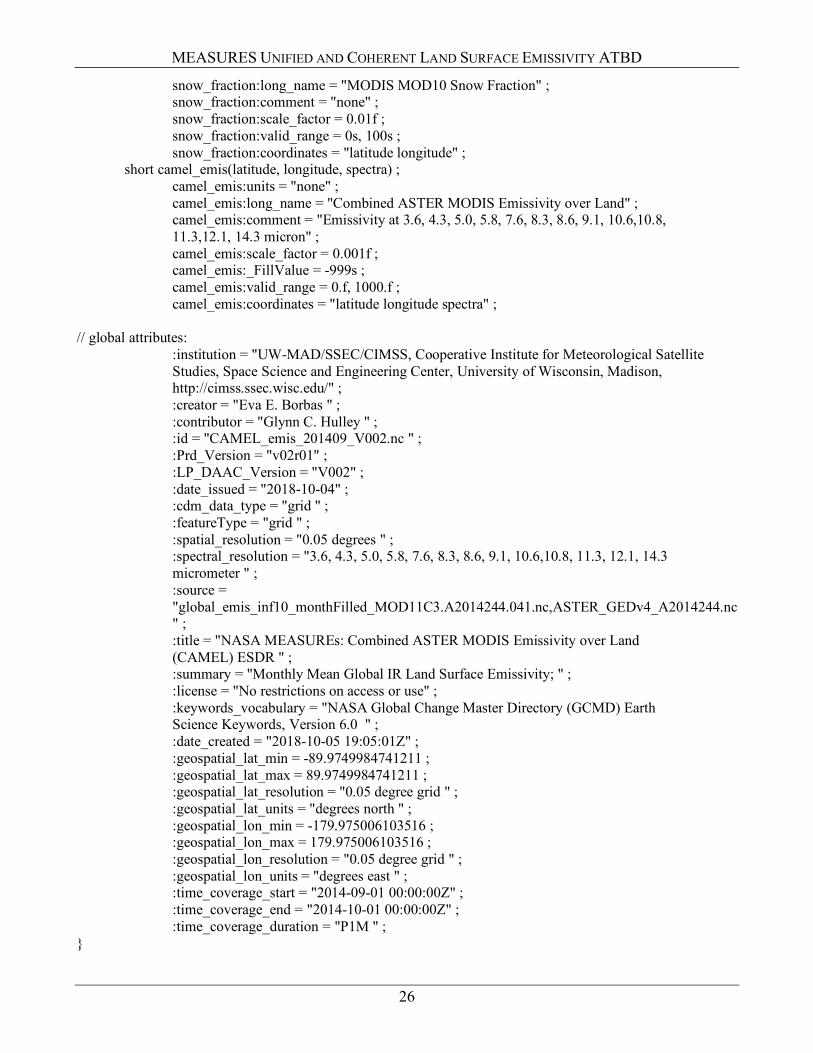
snow_fraction:long_name = "MODIS MOD10 Snow Fraction" ; snow_fraction:comment = "none" ; snow_fraction:scale_factor = 0.01f ; snow_fraction:valid_range = 0s, 100s ; snow_fraction:coordinates = "latitude longitude" ; short camel_emis(latitude, longitude, spectra) ; camel_emis:units = "none" ; camel_emis:long_name = "Combined ASTER MODIS Emissivity over Land" ; camel_emis:comment = "Emissivity at 3.6, 4.3, 5.0, 5.8, 7.6, 8.3, 8.6, 9.1, 10.6,10.8,
11.3,12.1, 14.3 micron" ; camel_emis:scale_factor = 0.001f ; camel_emis:_FillValue = -999s ; camel_emis:valid_range = 0.f, 1000.f ; camel_emis:coordinates = "latitude longitude spectra" ; // global attributes: :institution = "UW-MAD/SSEC/CIMSS, Cooperative Institute for Meteorological Satellite
Studies, Space Science and Engineering Center, University of Wisconsin, Madison, http://cimss.ssec.wisc.edu/" ;
:creator = "Eva E. Borbas " ; :contributor = "Glynn C. Hulley " ; :id = "CAMEL_emis_201409_V002.nc " ; :Prd_Version = "v02r01" ; :LP_DAAC_Version = "V002" ; :date_issued = "2018-10-04" ; :cdm_data_type = "grid " ; :featureType = "grid " ; :spatial_resolution = "0.05 degrees " ; :spectral_resolution = "3.6, 4.3, 5.0, 5.8, 7.6, 8.3, 8.6, 9.1, 10.6,10.8, 11.3, 12.1, 14.3
micrometer " ; :source = "global_emis_inf10_monthFilled_MOD11C3.A2014244.041.nc,ASTER_GEDv4_A2014244.nc" ;
:title = "NASA MEASUREs: Combined ASTER MODIS Emissivity over Land (CAMEL) ESDR " ;
:summary = "Monthly Mean Global IR Land Surface Emissivity; " ; :license = "No restrictions on access or use" ; :keywords_vocabulary = "NASA Global Change Master Directory (GCMD) Earth
Science Keywords, Version 6.0 " ; :date_created = "2018-10-05 19:05:01Z" ; :geospatial_lat_min = -89.9749984741211 ; :geospatial_lat_max = 89.9749984741211 ; :geospatial_lat_resolution = "0.05 degree grid " ; :geospatial_lat_units = "degrees north " ; :geospatial_lon_min = -179.975006103516 ; :geospatial_lon_max = 179.975006103516 ; :geospatial_lon_resolution = "0.05 degree grid " ; :geospatial_lon_units = "degrees east " ; :time_coverage_start = "2014-09-01 00:00:00Z" ; :time_coverage_end = "2014-10-01 00:00:00Z" ; :time_coverage_duration = "P1M " ; }
MEASURES UNIFIED AND COHERENT LAND SURFACE EMISSIVITY ATBD
27
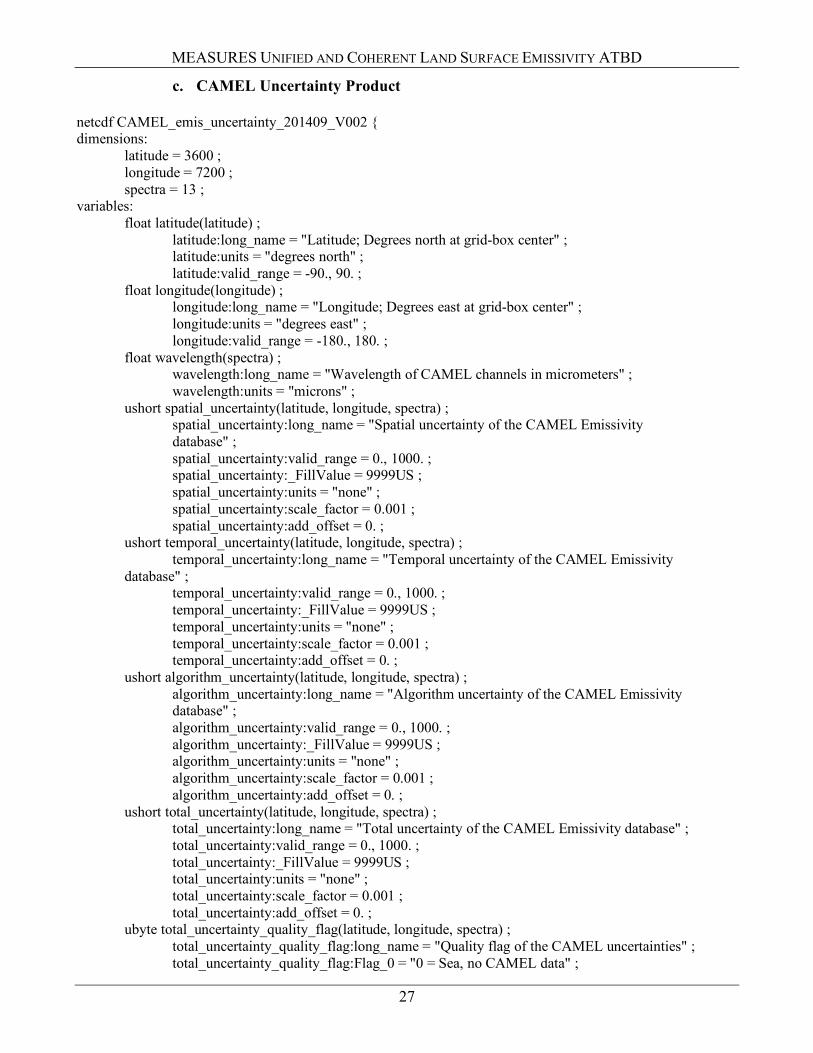
c. CAMEL Uncertainty Product netcdf CAMEL_emis_uncertainty_201409_V002 { dimensions: latitude = 3600 ; longitude = 7200 ; spectra = 13 ; variables: float latitude(latitude) ; latitude:long_name = "Latitude; Degrees north at grid-box center" ; latitude:units = "degrees north" ; latitude:valid_range = -90., 90. ; float longitude(longitude) ; longitude:long_name = "Longitude; Degrees east at grid-box center" ; longitude:units = "degrees east" ; longitude:valid_range = -180., 180. ; float wavelength(spectra) ; wavelength:long_name = "Wavelength of CAMEL channels in micrometers" ; wavelength:units = "microns" ; ushort spatial_uncertainty(latitude, longitude, spectra) ; spatial_uncertainty:long_name = "Spatial uncertainty of the CAMEL Emissivity
database" ; spatial_uncertainty:valid_range = 0., 1000. ; spatial_uncertainty:_FillValue = 9999US ; spatial_uncertainty:units = "none" ; spatial_uncertainty:scale_factor = 0.001 ; spatial_uncertainty:add_offset = 0. ; ushort temporal_uncertainty(latitude, longitude, spectra) ; temporal_uncertainty:long_name = "Temporal uncertainty of the CAMEL Emissivity database" ; temporal_uncertainty:valid_range = 0., 1000. ; temporal_uncertainty:_FillValue = 9999US ; temporal_uncertainty:units = "none" ; temporal_uncertainty:scale_factor = 0.001 ; temporal_uncertainty:add_offset = 0. ; ushort algorithm_uncertainty(latitude, longitude, spectra) ; algorithm_uncertainty:long_name = "Algorithm uncertainty of the CAMEL Emissivity
database" ; algorithm_uncertainty:valid_range = 0., 1000. ; algorithm_uncertainty:_FillValue = 9999US ; algorithm_uncertainty:units = "none" ; algorithm_uncertainty:scale_factor = 0.001 ; algorithm_uncertainty:add_offset = 0. ; ushort total_uncertainty(latitude, longitude, spectra) ; total_uncertainty:long_name = "Total uncertainty of the CAMEL Emissivity database" ; total_uncertainty:valid_range = 0., 1000. ; total_uncertainty:_FillValue = 9999US ; total_uncertainty:units = "none" ; total_uncertainty:scale_factor = 0.001 ; total_uncertainty:add_offset = 0. ; ubyte total_uncertainty_quality_flag(latitude, longitude, spectra) ; total_uncertainty_quality_flag:long_name = "Quality flag of the CAMEL uncertainties" ; total_uncertainty_quality_flag:Flag_0 = "0 = Sea, no CAMEL data" ;
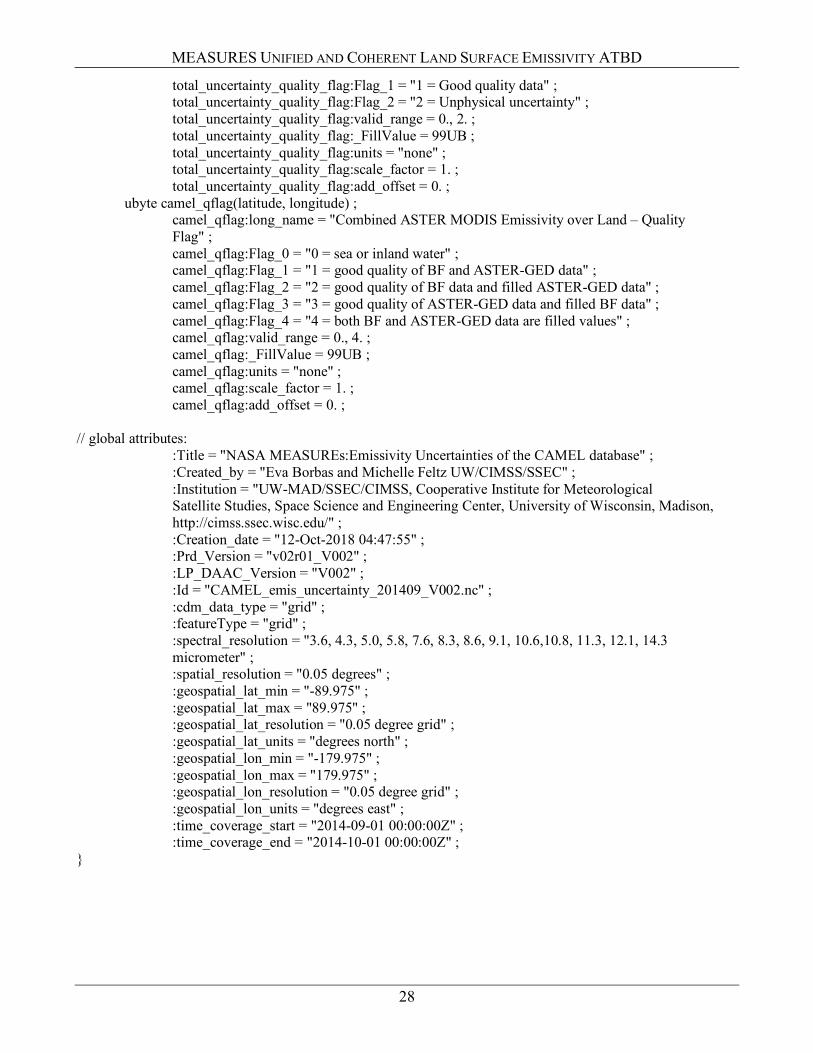
MEASURES UNIFIED AND COHERENT LAND SURFACE EMISSIVITY ATBD
28
total_uncertainty_quality_flag:Flag_1 = "1 = Good quality data" ; total_uncertainty_quality_flag:Flag_2 = "2 = Unphysical uncertainty" ; total_uncertainty_quality_flag:valid_range = 0., 2. ; total_uncertainty_quality_flag:_FillValue = 99UB ; total_uncertainty_quality_flag:units = "none" ; total_uncertainty_quality_flag:scale_factor = 1. ; total_uncertainty_quality_flag:add_offset = 0. ; ubyte camel_qflag(latitude, longitude) ; camel_qflag:long_name = "Combined ASTER MODIS Emissivity over Land – Quality
Flag" ; camel_qflag:Flag_0 = "0 = sea or inland water" ; camel_qflag:Flag_1 = "1 = good quality of BF and ASTER-GED data" ; camel_qflag:Flag_2 = "2 = good quality of BF data and filled ASTER-GED data" ; camel_qflag:Flag_3 = "3 = good quality of ASTER-GED data and filled BF data" ; camel_qflag:Flag_4 = "4 = both BF and ASTER-GED data are filled values" ; camel_qflag:valid_range = 0., 4. ; camel_qflag:_FillValue = 99UB ; camel_qflag:units = "none" ; camel_qflag:scale_factor = 1. ; camel_qflag:add_offset = 0. ; // global attributes: :Title = "NASA MEASUREs:Emissivity Uncertainties of the CAMEL database" ; :Created_by = "Eva Borbas and Michelle Feltz UW/CIMSS/SSEC" ; :Institution = "UW-MAD/SSEC/CIMSS, Cooperative Institute for Meteorological
Satellite Studies, Space Science and Engineering Center, University of Wisconsin, Madison, http://cimss.ssec.wisc.edu/" ;
:Creation_date = "12-Oct-2018 04:47:55" ; :Prd_Version = "v02r01_V002" ; :LP_DAAC_Version = "V002" ; :Id = "CAMEL_emis_uncertainty_201409_V002.nc" ; :cdm_data_type = "grid" ; :featureType = "grid" ; :spectral_resolution = "3.6, 4.3, 5.0, 5.8, 7.6, 8.3, 8.6, 9.1, 10.6,10.8, 11.3, 12.1, 14.3 micrometer" ; :spatial_resolution = "0.05 degrees" ; :geospatial_lat_min = "-89.975" ; :geospatial_lat_max = "89.975" ; :geospatial_lat_resolution = "0.05 degree grid" ; :geospatial_lat_units = "degrees north" ; :geospatial_lon_min = "-179.975" ; :geospatial_lon_max = "179.975" ; :geospatial_lon_resolution = "0.05 degree grid" ; :geospatial_lon_units = "degrees east" ; :time_coverage_start = "2014-09-01 00:00:00Z" ; :time_coverage_end = "2014-10-01 00:00:00Z" ; }
MEASURES UNIFIED AND COHERENT LAND SURFACE EMISSIVITY ATBD
29
Appendix 2: Contents of the CAMEL HSR algorithm Software package
a. Fortran version MEASURES_CAMEL_hsremis_lib_V002_v02r01_del_10092018.tar.gz package contains: src_hsrlib_V002:
Makefile_lib compute_hsriremis.f hsriremis_EDR.inc init_hsriremis.f read_CAMEL_coef.f read_CAMEL_coef_qflag.f read_labpcs.f recon_hsriremis.f
test: iasi_chans616.txt Namib_hsriremis.txt.test
Namib_iasi_emis.txt.test run_hsriremis.f run_hsriremis_oneline.mk coef:
pchsr_v10.2.nc pchsr_v11.2.nc pchsr_v12.2.nc pchsr_v8.2.nc pchsr_v9.2.nc
data: CAMEL_coef_200701_V002.nc lib: empty dir include: empty dir
b. Matlab version MEASURES_CAMEL_hsremis_matlab_V002_v02r01_del_10092018.tar.gz package contains: coef:
pchsr_v10.2.mat pchsr_v11.2.mat pchsr_v12.2.mat pchsr_v8.2.mat pchsr_v9.2.mat pcmodast_v10.2.mat pcmodast_v11.2.mat pcmodast_v12.2.mat pcmodast_v8.2.mat pcmodast_v9.2.mat
data: CAMEL_coef_200701_V002.nc CAMEL_emis_200701_V002.nc
MEASURES UNIFIED AND COHERENT LAND SURFACE EMISSIVITY ATBD
30
mfiles: create_HSRemis_fromCAMELcoef_V002.m create_HSRemis_fromCAMELemis_V002.m read_CAMEL_coef_V002.m read_CAMEL_emis_V002.m run_CAMEL_hsremis_test_V002.m
output: orig:
MadisonW_CAMEL_HSRemis_200701_V002.mat MadisonW_CAMEL_HSRemissivity_200701_V002_v02r01.png Namib_CAMEL_HSRemis_200701_V002.mat Namib_CAMEL_HSRemissivity_200701_V002_v02r01.png Yemen_CAMEL_HSRemis_200701_V002.mat Yemen_CAMEL_HSRemissivity_200701_V002_v02r01.png