measures of relative position
DESCRIPTION
Section 3.3. Measures of Relative Position. Objectives. Identify the position of a data value in a data set, using various measures of position such as percentiles, deciles, and quartiles. Measures of Position (or Location or Relative Standing). - PowerPoint PPT PresentationTRANSCRIPT

Section 3.3

Identify the position of a data value in a data set, using various measures of position such as percentiles, deciles, and quartiles

Are used to locate the relative position of a data value in a data set
Can be used to compare data values from different data sets
Can be used to compare data values within the same data set
Can be used to help determine outliers within a data set
Includes z-(standard) score, percentiles, quartiles, and deciles

Can be used to compare data values from different data sets by “converting” raw data to a standardized scale
Calculation involves the mean and standard deviation of the data set
Represents the number of standard deviations that a data value is from the mean for a specific distribution
We will use extensively in Chapter 6

Is obtained by subtracting the mean from the given data value and dividing the result by the standard deviation.
Symbol of BOTH population and sample is z
Can be positive, negative or zero
Formula Population
Sample
x
z
s
xxz
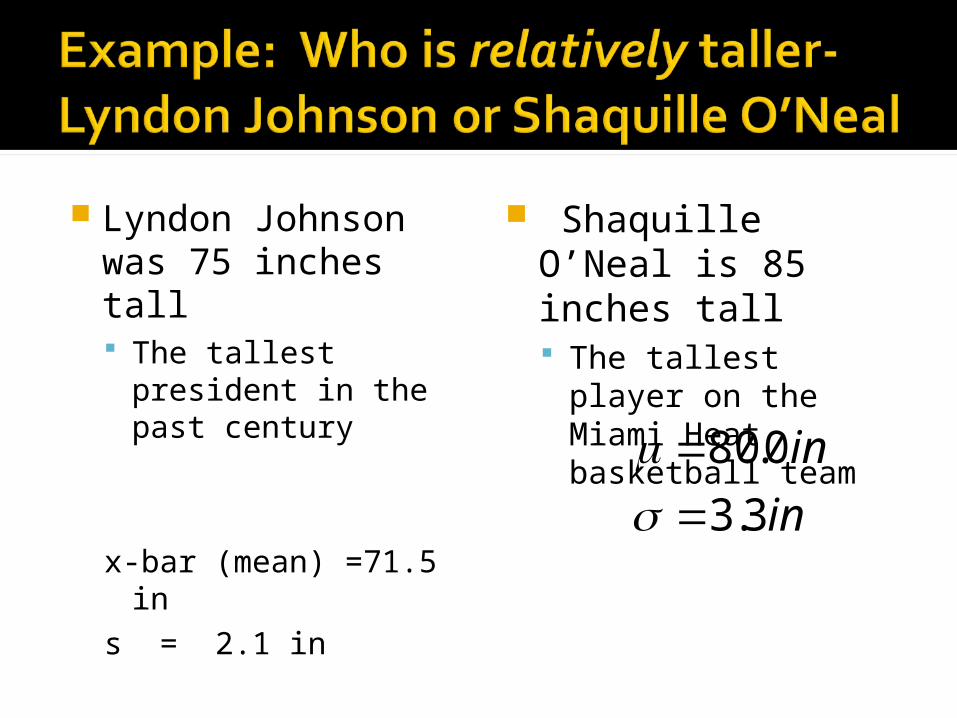
Lyndon Johnson was 75 inches tall The tallest
president in the past century
x-bar (mean) =71.5 in
s = 2.1 in
Shaquille O’Neal is 85 inches tall The tallest player on
the Miami Heat basketball team
in
in
3.3
0.80

Are position measures used in educational and health-related fields to indicate the position of an individual in a group
Divides the data set in 100 (“per cent”) equal groups
Used to compare an individual data value with the national “norm”
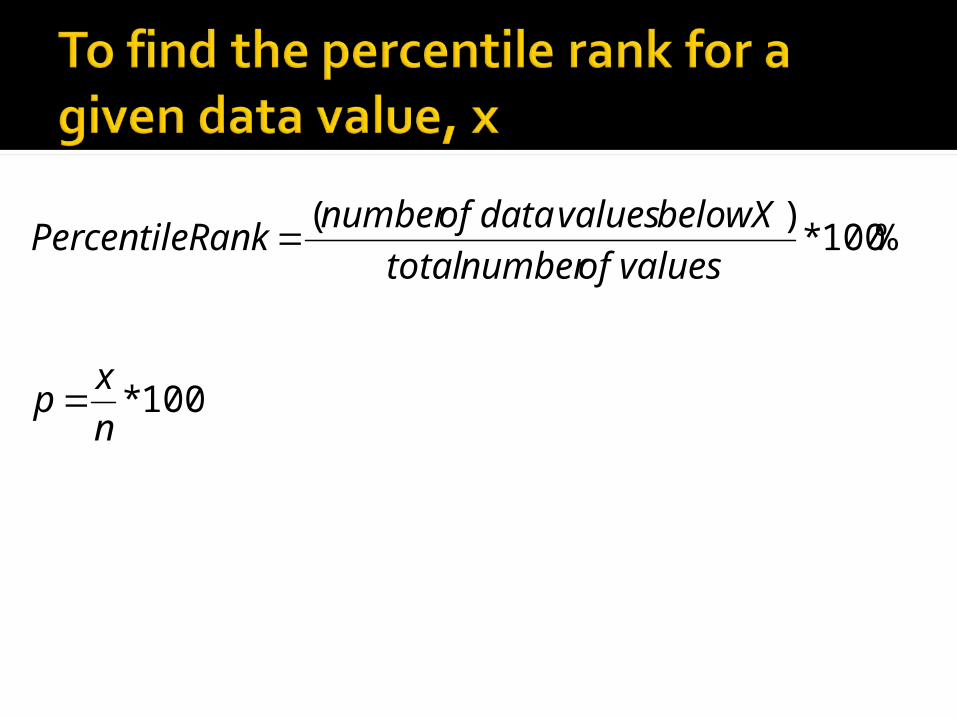
Symbolized by P1, P2 ,….. Percentile rank indicates the percentage
of data values that fall below the specified rank
100*
%100*)(
n
xp
valuesofnumbertotal
XbelowvaluesdataofnumberRankPercentile

American College Test (ACT) Scores attained by 25 members of a local high school graduating class (Data is ranked)
14 16 17 17 17
18 19 19 19 19
20 20 20 21 21
21 23 23 24 25
25 25 28 28 31
1) Thad scored 22 on the ACT. What is his percentile rank?
2) Ansley scored 20 on the ACT. What is her percentile rank?
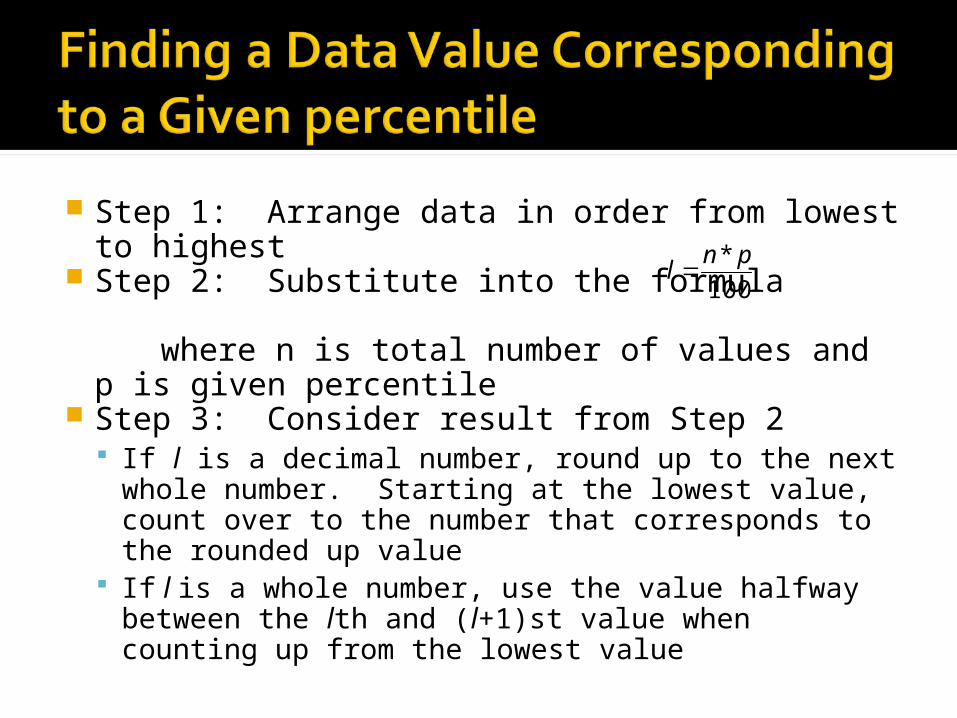
Step 1: Arrange data in order from lowest to highest
Step 2: Substitute into the formula
where n is total number of values and p is given percentile
Step 3: Consider result from Step 2 If l is a decimal number, round up to the next whole
number. Starting at the lowest value, count over to the number that corresponds to the rounded up value
If l is a whole number, use the value halfway between the lth and (l+1)st value when counting up from the lowest value
100
* pnl

American College Test (ACT) Scores attained by 25 members of a local high school graduating class (Data is ranked)
14 16 17 17 17
18 19 19 19 19
20 20 20 21 21
21 23 23 24 25
25 25 28 28 31
To be in the 90th percentile, what would you have to score on the ACT?
Find P85
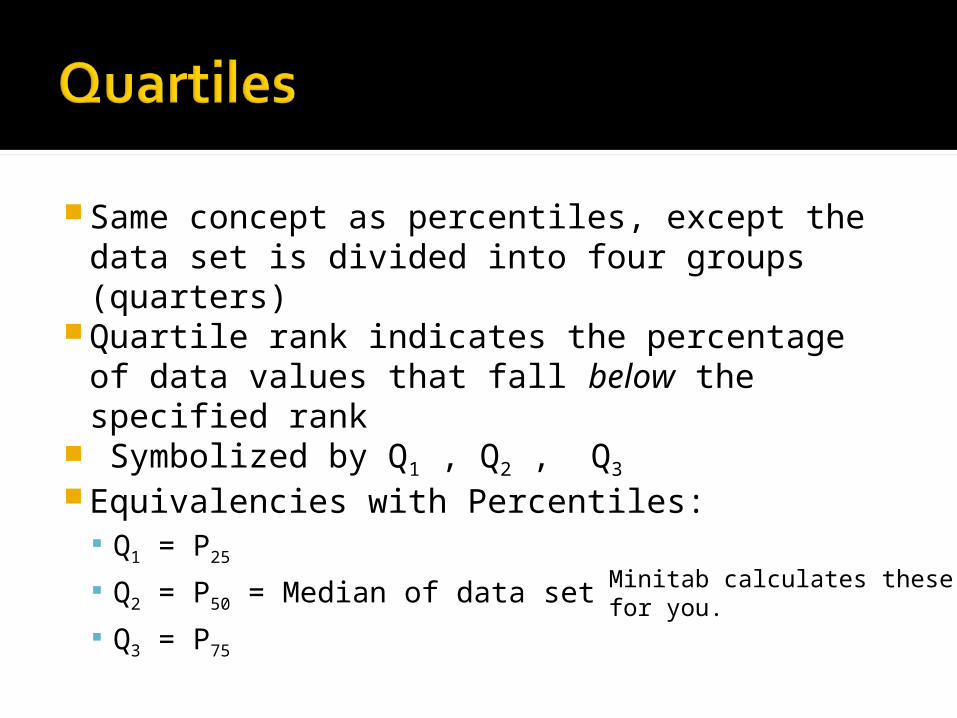
Same concept as percentiles, except the data set is divided into four groups (quarters)
Quartile rank indicates the percentage of data values that fall below the specified rank
Symbolized by Q1 , Q2 , Q3
Equivalencies with Percentiles: Q1 = P25
Q2 = P50 = Median of data set
Q3 = P75
Minitab calculates these for you.

Same concept as percentiles, except divides data set into 10 groups
Symbolized by D1 , D2 , D3 , … D10
Equivalencies with percentiles D1 = P10 D2 = P20 ……..
D5 = P50 =Q2 =Median of Data Set

“Rough” measurement of variability Used to identify outliers Used as a measure of variability in
Exploratory Data Analysis Defined as the difference between Q1
and Q3
Is range of the middle 50% (“average”) of the data set
IQR = Q3 – Q1

Outlier is an extremely high or an extremely low data value when compared with the rest of the data values
A data set should be checked for “outliers” since “outliers” can influence the measures of central tendency and variation (mean and standard deviation)

Step 1: Arrange data in orderStep 2: Find Q1 and Q3
Step 3: Find the IQRStep 4: Check the data set for any
data value that is smaller than Q1 -1.5IQR or larger than Q3 + 1.5IQR

American College Test (ACT) Scores attained by 25 members of a local high school graduating class (Data is ranked)
14 16 17 17 17
18 19 19 19 19
20 20 20 21 21
21 23 23 24 25
25 25 28 28 31
1) Emily scored 11 on the ACT. Would her score be considered an outlier?
2) Danielle scored 38 on the ACT. Would her score be considered an outlier?

Data value may have resulted from a measurement or observational error
Data value may have resulted from a recording error
Data value may have been obtained from a subject that is not in the defined population
Data value might be a legitimate value that occurred by chance (although the probability is extremely small)

Page 137 #9-23 odd
You are now able to FINISH Technology Assignment #5.
TA #5 is due on Monday, April 4th at the beginning of class.