measures of academic progress (map) curt nath director of curriculum ocean city school district
TRANSCRIPT

Measures of Academic Progress (MAP)
Curt Nath Director of Curriculum
Ocean City School District
MAP Overview
HOW is the MAP test being implemented? WHAT is a MAP test? WHY is the Ocean City School District using
the MAP test? WHICH resources are being utilized? (Test
Reports & Instructional Resources) WHERE do I go for more information?
2

Grade Level Fall MAP & Spring MAP
1st Grade
Reading: Reading Primary Grades Common Core (FoundSkills,Lang/Writing, Lit/Info, Vocab)Math: Math Primary Grades Common Core (Algebra, Num/Operations, Meas/Data. Geometry)
2nd-5th Reading: Reading 2-5 Common Core V4Math: Math 2-5 Common Core V4
6th-8th
Reading: Reading 6+ Common CoreMath: Math 6+ Common Core V4 **End of Course: Algebra I
3
District MAP Planning

4
WHAT is the MAP Test?
Measures of Academic Progress
State-aligned computerized adaptive tests that accurately reflect the instructional level
of each student and measure growth over time.
This test provides the instructional level of the student.
This test provides the instructional level of the student.

5
QUALITY FEATURES OF MAP TEST
• ADAPTIVE
• INDICATE INSTRUCTIONAL LEVEL
• ENCOURAGES GROWTH & ESTABLISHED GROWTH TARGETS
• PROVIDES USEFUL DATA WITH QUICK AND MEANINGFUL FEEDBACK

6
The RIT Scale
An EQUAL Interval Scale
NOT Grade Level Dependant
Measures Academic Growth
Enables teachers to recognize where to focus attention and how to provide instruction

7
Use More than One Point of Data
Local -Classroom
State
Periodic(MAP)
Triangulation

8
MAP Resources Reports & Instructional Resources for Teachers
Teacher Report (Alpha & RIT) Class Breakdown by RIT Lexile Report Student Focused Goal Setting Worksheets
Grade-Level, School, & District Reports Summary Reports by Cluster Student Growth Summary Reports Achievement Status & Growth Report (Pre & Post)
Reports for Parents Individual Student Progress Report

9
Normative Data: Bringing Context to the Data
Grade-level norms Typical
performance Fall and spring New norms every
3-5 years

10
Interpreting the Class Breakdown by Overall RIT Report

11
Interpreting the Class Breakdown by Goal Report
Kayana (225)
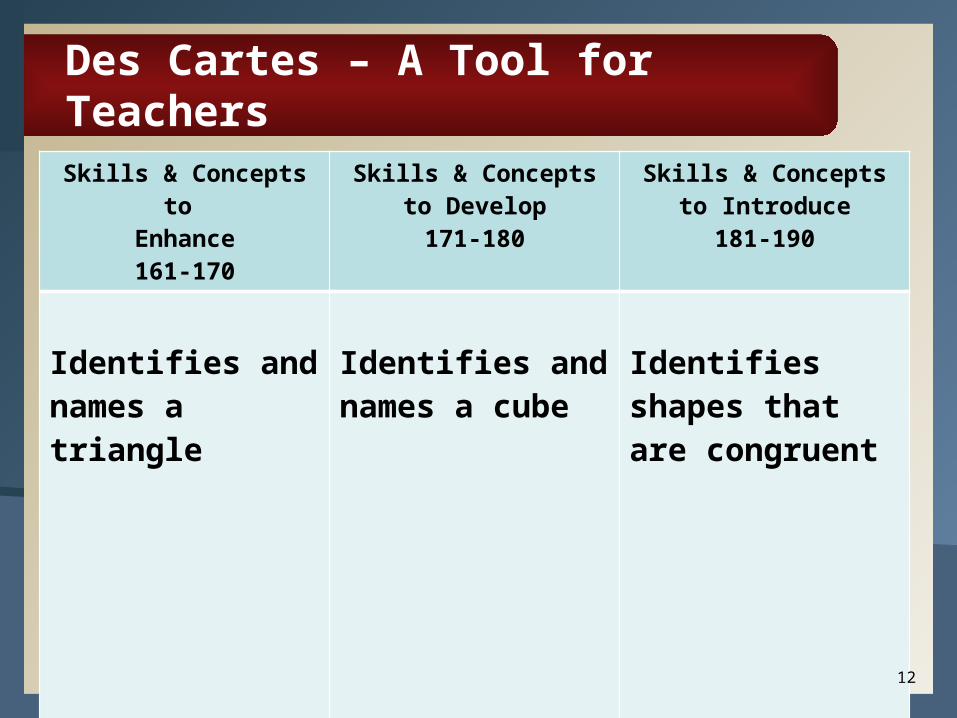
Des Cartes – A Tool for TeachersSkills & Concepts to
Enhance161-170
Skills & Concepts to Develop171-180
Skills & Concepts to Introduce181-190
Identifies and names a triangle
Identifies and names a cube
Identifies shapes that are congruent
12

13
Individual Student Progress Report
District Average Norm Group Average Student Growth Typical Growth Descriptors

14
A Lexile (www.lexile.com)
A unit for measuring text difficulty Semantic difficulty (Word Frequency) Syntactic complexity (Sentence Length)
Linked to the RIT score Doesn’t evaluate:
Genre Theme Content Interest Quality

15
Dynamic Reporting Suite: Lexile Report
Workbook p. 47M

16
WHAT should I expect from my child?
Student Goal Setting Set growth goals Monitor Progress

{District Summary Report}
Strengths and areas of concern comparing the performance of this group of students to their own mean/median
219.7
177.5 173.6
201.1189.9
207.1
200.9
183.0
210.2
212.4205.9
213.9206.9
219.6
216.7213.6
198.1189.1
211.1
220.4
197.1187.3
204.6
222.3

18
Student Growth Summary Report

19
Achievement Status and Growth (ASG) Summary Class Report

20
Growth Index Percent of Students Meeting Target Percent of Target Met
Screen shot of summary info
Achievement Status and Growth (ASG) Summary Class Report

21
MAP was founded over 40 years ago as a not-for-profit formed by researchers and educators from school districts in the Pacific Northwest.
NWEA provides MAP to more than 5,200 school districts across the United States.
MAP is a computer-based adaptive assessment that provides precise and immediate feedback so teachers can pinpoint current student learning needs, personalize instructional planning and promote student engagement.
FACTS ABOUT MAP TESTING

22
MAP is a trusted resource for measuring individual student achievement, calculating student growth, projecting proficiency on high-stakes assessments, and comparing a student’s growth to that of students in Ocean City and across the country.
MAP is an interim test to measure academic status, irrespective of the grade level at which a student is performing.
NJASK is a summative test, designed to measure the culmination of a student’s learning within grade level administered at the end of the school year for accountability purposes.
FACTS ABOUT MAP TESTING

23
MAP is just another high-stakes test. Map provides an immediate snapshot of where a student
is performing today, irrespective of grade level, as opposed to the state summative test (NJASK/HPSA and PARCC) that only provides an annual grade level view.
Teachers don’t know what content MAP covers. MAP is aligned to the Common Core State Standards
and measures progress to the standards.
Administration of MAP takes too much time. The typical MAP assessment is 42-50 questions long
and is completed by most students in about an hour.
MYTHS ABOUT MAP TESTING

24
Computerized adaptive testing is unfair to students. MAP adaptive assessments provide a balanced
approach for measuring a student’s academic status and growth. MAP generates precise estimates of achievement regardless of whether a student is performing at grade level, far above or far below.
High performers will be challenged and given an accurate result of their achievement level.
MAP draws from a test question pool of over 32,000 questions aligned to state standards. Every student receives a different assessment that is appropriately adjusted to their performance level.
MYTHS ABOUT MAP TESTING

25
MAP is not a valid test. MAP is a valid test for measuring a student’s
achievement status to state standards, academic growth, and projecting proficiency to state standards. The numerical (RIT) value assigned to a student represents the most difficult question that he or she is capable of answering correctly about 50% of the time. Students taking the MAP test receive a statistically derived RIT score.
MYTHS ABOUT MAP TESTING

26
WWW.NWEA.ORG
Parent Toolkit
Sample Parent Letters