measurements!of!liquid!scintillator!light! … 2013...abstract(!...
TRANSCRIPT

Measurements of Liquid Scintillator Light Yield for Future Neutrino Experiments
Athena Ierokomos
University of California, Berkeley 2013 University of California, Los Angeles REU Program

Abstract Neutrinoless double-‐beta decay, though a rare process, could be used to determine if the neutrino is a Majorana or Dirac particle. In searching for very rare processes, it is often useful to build very large detectors, which are frequently filled with liquid scintillator materials. In order to decide which liquid scintillator would be the most useful, there are multiple characteristics that should be compared, including light yield, attenuation length, and cost. In this paper, liquid scintillators for future use in these detectors are compared to determine which have the highest light yield. Diisopropylnaphthalene has been shown to be the most efficient scintillator. Introduction A Majorana particle is a fermion which is its own antiparticle. One of the leading possibilities for a Majorana particle is a neutrino. The neutrino is a very weakly interacting particle with almost zero mass. In recent years, a lot of progress has been made towards understanding the characteristics of these particles, but the question of the exact nature of the particle remains. There is only one major method of determining if the neutrino is a Majorana or Dirac particle: neutrinoless double-‐beta decay. A Dirac neutrino would be limited to the two neutrino double-‐beta decay. In this process, the antineutrino partner of the electrons is emitted from the system, carrying away some of the energy of the decay. Since neutrinos are not directly detectable, this results in a spectrum of total energy for the two electrons. A Majorana neutrino would also undergo this process, but is also allowed to undergo neutrinoless double-‐beta decay. Here, instead of being emitted away from the system, the neutrino undergoes light Majorana neutrino exchange. If the neutrino is not emitted, the electrons carry the full energy of the decay away from the system, resulting in a peak in counts at the end of the two neutrino double-‐beta decay energy spectrum. This peak makes it, in principle, very easy for an experimentalist to look for the signal arising from Majorana neutrinos. However, the decay we are looking for is very rare, with a half-‐life several orders of magnitude longer than the age of the universe. In this case, we need a large enough detector that the events will occur with sufficient frequency to produce a measurable signal. One of the best techniques for building large detectors is using liquid scintillators. These detectors should have 1-‐10 tons of isotope, which would be dissolved in the scintillator to a concentration on the order of 1 g/L. In this case, a kiloton-‐scale detector is needed, which corresponds to a sphere with a radius greater than 10 m. A scintillator is a compound that fluoresces when exposed to charged particles. Some organic molecules have their carbon molecules arranged in rings in such a way that

they alternate one double bond and one single bond. In this case, a moving charged particle, such as an electron, can deposit some energy into the system by colliding with it. This excites the electrons in the pi bond, allowing them to resonate. When these electrons relax again, they can emit a photon within a certain range of frequencies, which are at lower energies in general than that which excites them. In detector systems, these photons are collected by photomultiplier tubes (PMTs) to produce a measurable signal. There are several characteristics that must be taken into consideration when choosing an efficient liquid scintillator. These include safety and cost, but the most important characteristics are light yield and attenuation length. In particular for a large scale detector, the attenuation length is a crucial measurement. The attenuation length of a liquid scintillator is related to the transparency of the liquid to light. Any molecule has characteristic absorption and emission spectra. These frequently overlap to a certain extent. If a photon is emitted on the high energy end of the emission spectrum, it could fall into the low energy end of the absorption spectrum. If this is the case, it would not get all the way across the detector without being reabsorbed. For experiments at the kiloton scale, attenuation lengths on the order of 10 m are crucial for reliably getting a signal out of the detector. These lengths can be achieved by increasing what is known as the Stokes' shift, or the spacing between the emission and absorption peaks. In our experiment, this is achieved using a compound known as diphenyloxazole (PPO), which serves as a wavelength shifter. PPO will tend to shift the emission spectrum of the pure solvent lower in energy, which allows more light to traverse the detector without being reabsorbed. Another important characteristic is the light yield. The light yield of a scintillator is the amount of light emitted by a molecule per deposited energy. Since neutrinoless double-‐beta decay is such a rare process, when it occurs we want to be able to get enough light out of the scintillator that it is detectable, and that the energy resolution is good enough. Thus we would like to have a high light yield for our scintillator. PPO can also be helpful for this purpose. The structure of PPO is three rings, two of which are aromatic. This makes it very likely for PPO, once excited, to deexcite through emission of a photon rather than by mechanical energy loss or any other process. By transferring energy to PPO from the solvent it is dissolved in, PPO can increase the light yield of the solvent. Experimental Setup This summer, the purpose of my experiment was to find the optimal concentration of PPO for light yield in a variety of scintillators, given in the table below.
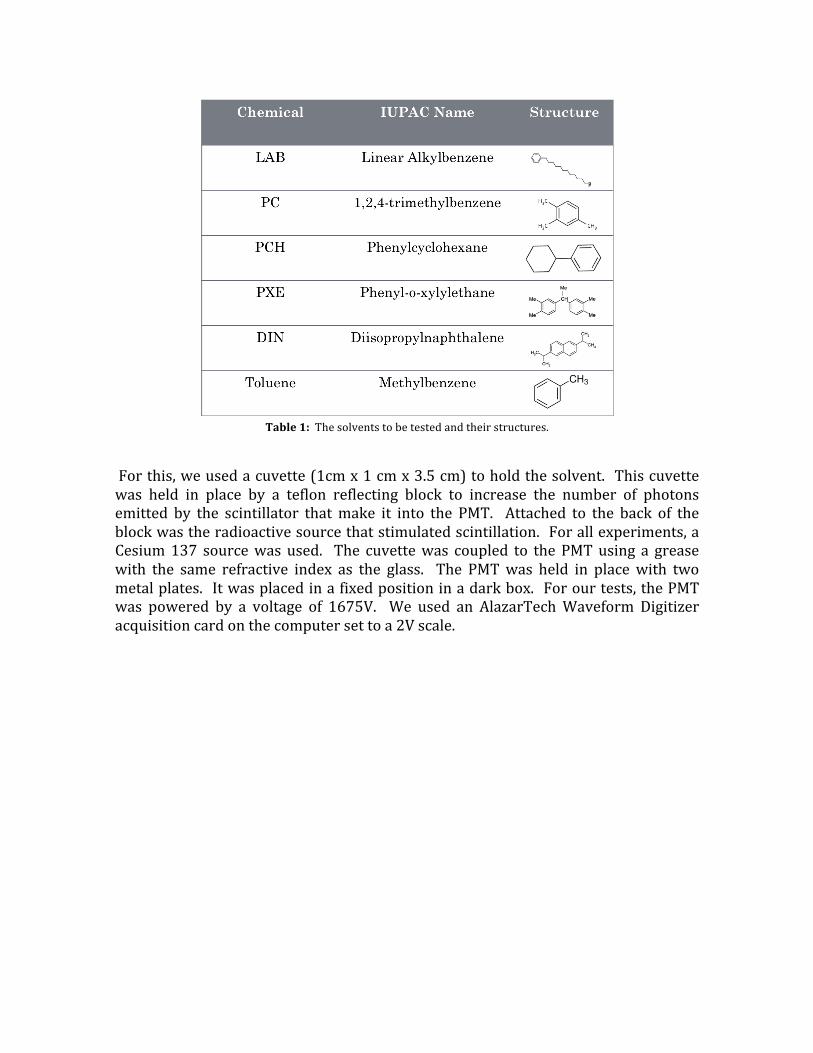
Table 1: The solvents to be tested and their structures.
For this, we used a cuvette (1cm x 1 cm x 3.5 cm) to hold the solvent. This cuvette was held in place by a teflon reflecting block to increase the number of photons emitted by the scintillator that make it into the PMT. Attached to the back of the block was the radioactive source that stimulated scintillation. For all experiments, a Cesium 137 source was used. The cuvette was coupled to the PMT using a grease with the same refractive index as the glass. The PMT was held in place with two metal plates. It was placed in a fixed position in a dark box. For our tests, the PMT was powered by a voltage of 1675V. We used an AlazarTech Waveform Digitizer acquisition card on the computer set to a 2V scale.

Figure 1: The inside of the dark box contains the sample and the PMT, along with other structures to hold them in
place consistently from test to test.
The data acquisition card reads a voltage to the computer, which is converted to a charge by integrating under the voltage-‐time output. The scintillator emits light according to a Compton spectrum. Light from the source will scatter off electrons in the solution with sufficient energy to ionize the molecules, allowing a free electron to propagate into the system. The lower the scattering angle, the higher the energy imparted to the electron from the incident light. So, there is a maximum energy that can be imparted, which occurs at a scattering angle of 0 degrees. Thus, this charge spectrum is distributed around a distinct Compton edge corresponding to the maximum energy electron from the average energy radiation emitted by the source. By finding this maximum charge, we can determine the light yield of the sample by retracing the conversion of energy through the sample and PMT. The energy from the source comes into the sample, and stimulates scintillation. A certain percentage of the scintillation light hits the PMT photocathode, which converts light to electrons with a given efficiency related to its quantum and collection efficiencies. The number of electrons is then magnified by the gain of the PMT, and the current is collected by an anode at the end. The area under the voltage vs. time graph gives charge with a factor of resistance. So, all other things in the experiment being carefully controlled, we can simply compare the charge numbers to determine which scintillators have the highest light yield.

Initially, there were a few problems that needed to be addressed in the setup. First, any oxygen in the system will reduce the light yield of the scintillator. Oxygen reduces the efficiency with which energy is transferred between the scintillator solvent and the PPO, which encourages deexcitation by mechanical modes rather than scintillation. Leaving a sample of high purity DIN open to oxygen, even in a cuvette with a small exposed surface area, for just 15 minutes decreases the light yield of the sample by 2%, and for 3 hours reduces the light yield nearly 7%. Since there is no way to determine how much oxygen is dissolved in the solvent, it is very important to set procedures in place that minimize oxygen contamination. In our tests, nitrogen is bubbled through the sample for ten minutes after placing it in the cuvette. The nitrogen will displace the oxygen dissolved in the sample. Additionally, all samples are stored under a nitrogen blanket to minimize any new oxygen dissolving into the solvent. After fixing the oxygen control procedure, there was still large variation in the results. These variations were present even when the cuvette was simply removed from the PMT and replaced, indicating that there was some variation in the coupling process. Due to the deposition process that places the photocathode on the glass of the PMT, the photocathode itself is not uniformly distributed. Thus the reflective block holding the cuvette in the same place relative to the position of the PMT was not sufficient to ensure that the exact position of the sample relative to the dynodes within the PMT was the same every test. Additionally, the PMT is no longer in the same position with respect to the magnetic field in the room. Since dynodes themselves are also not cylindrically symmetric, this was determined to be the cause of the variation. Fixing the orientation of the PMT between tests resulted in differences between measurements being reduced to around 0.5% (RMS) if the coupling was done newly after each measurement but the cuvette was kept closed. Results Each solvent was tested at six concentrations of PPO: 0.5, 1, 2, 5, 10, and 50 g/L, the exception being LAB, for which the highest tested concentration was 40 g/L. The resulting Compton spectra are represented below by histograms. The figure below is a set of the six concentrations for a single solvent, namely PXE.

Figure 2: A sample of six PXE spectra, one at each concentration. The x-‐axis is an adjusted charge of the event, with 800 corresponding to a charge of 250 pC. The y-‐axis is counts of events with that charge.
The maximum charge was taken to be at the midpoint of the falling edge. The maximum charge is plotted in Figure 3 below. The maximum charge clearly increases with PPO concentration until around 5 g/L as the rate of energy transfer rate between the solvent and PPO increases. However, at high concentrations of PPO, the molecules of PPO interact between themselves, increasing the likelihood that energy will be lost through processes other than fluorescence. So, at concentrations above 5 g/L, the light yield drops off slowly. This pattern is repeated for all of the solvents, with the slight exception of PC, which peaks around 10 g/L and drops off quickly after that.

Figure 3: A plot of the maximum charge of PXE at each of the six concentrations. The x-‐axis is PPO concentration on a logarithmic scale, and the y-‐axis is again an adjusted charge, with 800 corresponding to 250 pC.
The charge numbers for the various solvents at all concentrations are listed in the table below.
Charge (10-11 C)
Conc. (g/L)
PC PCH DIN (high purity)
DIN (low purity)
Toluene PXE LAB
0.5 4.19 13.06 15.19 17.94 12.78 14.59 9.81 1 9.19 15.94 22.59 20.13 17.59 18.22 13.59 2 13.41 20.00 23.16 22.84 19.69 20.78 16.97
5 16.78 20.03 22.72 22.44 20.13 22.03 17.34
10 20.00 17.81 22.28 21.97 19.44 21.09 16.38
50 15.81 14.19 19.16 18.16 14.31 16.72 12.72*
Table 2: The maximum charge of each solvent at each concentration.
*Measured charge at a concentration of 39.4 g/L, not 50 g/L.
PPO Concentration (g/L)1 10
Char
ge
450
500
550
600
650
700
PXE: Charge vs Concentration

Conclusion Examining table 2, it is easy to compare the light yield efficiency of the different solvents. In general, it is clear that the two DIN purities have the highest light yield. Additionally, they have very similar numbers at almost every concentration of PPO, except for the lowest. This may be a result of PPO having a greater affect on the scintillation rate in a higher purity substance than in a lower purity substance. More tests may be done to verify these numbers. PC clearly has the lowest overall light yield at the lowest concentrations. However, at its peak number at 10 g/L PPO and above, PC actually has a higher light yield than LAB, which is in general the second lowest. This is because PC peaks at a higher PPO concentration than any of the other solvents. Most solvents peak between 2 g/L and 5 g/L, but PC peaks around 10 g/L, so it would make sense that at this point it could have a higher light yield than LAB. Acknowledgements I would like to thank Professor Lindley Winslow for taking me into her lab and being a wonderful mentor all summer. Also, I would like to think Dr. Christoph Aberle and Timothée De Guillebon for helping me get started and providing guidance throughout the project. Finally, this was only possible because of Francoise Quéval organizing the REU program and the NSF providing funding.