measurements with pressure time method by using different ... · 1 measurements with pressure time...
TRANSCRIPT
1
Measurements with Pressure Time method by using different sections along the penstock
for measuring the pressure for the flow calculation
Fabio Fausto Muciaccia, Stefano Pasinato, Gianalberto Grego,
Abstract:
A plant equipped with a Pelton turbine with vertical axis has been subject to efficiency testing
by using Pressure Time method, according to the contract . For the measurement two sections,
about 20 diameters distance between them, were implemented; the sections were positioned
about half of the length of the new straight penstock and the pressure taps were fitted with
differential transducers . During the commissioning has highlighted the difficulty in using the
previously planned closing times of the servomotor . A new measurement section downstream
of the valve at the penstock entrance was also installed. This pressure was measured with absolute
transducers and was compared with the absolute pressures measured in the downstream section
of the two previously provided. The differential pressure was obtained with digital subtraction
process. A third flow measurement was also obtained by integrating the transient absolute
pressure measured at the spiral case entrance considering the whole penstock between the inlet
section and the measuring section . Each of the measurements was associated with a calculation
of the random and systematic uncertainty that partially explains the not negligible differences
obtained .
Description of the power plant
In a hydroelectric power station located in the Western Alps were carried out important repair
work to fully exploit the new hydrogeological conditions. In addition, a new Pelton Unit with
vertical axis and six jets was built, having the following design features.
Turbine type: Pelton vertical axis
N. jets : 6
Diameter: 1310 mm
PD² runner: 2 820 kgm²
Turbine elevation: 440.0 m.a.s.l.
Nominal hydraulic data:
Net head (m): 260
Discharge (m3/s): 6.05
Mechanical power (kW): 14 000
Rotation speed (rpm): 500
Generator type: Synchronous salient poles
Vertical axis
Nr. poles: 12
PD² rotor : 68 000 kgm²
Nominal electric data:
Electric Power (kVA): 15 300
Generator Voltage (V): 5 200
Generator Current (A): 1 700
Power factor: 0.85
Rotation speed (rpm): 500
Runaway speed (rpm): 950
The project also changed the old piping system with a new penstock with a diameter of 1.8 m.
Significant interventions have also affected the intake and the water release to the river.
The contract had foreseen to verify the efficiency of the unit through primary measurements. The
presence of heat exchangers in the turbine outlet did not allow the use of the thermodynamic
method: the customer did not agree to intervene in the cooling water circuit.
2
The practical impossibility to mount current meters without dewatering have therefore made the
choice in favor of the pressure/time methodology.
Test methodology
The pressure/time method is recognized within IEC 60041 as a primary method and is based on
Newton's law and the laws derived from fluid mechanics. From those laws comes the
relationship between the force due to the variation of the pressure difference between two
penstock sections and the acceleration or deceleration of the mass of the column of water between
these sections as consequence of the movement of a regulating gate.
The following simplifying hypotheses give rise to the analytical relations on which this method
is based:
The effects of the water compressibility and of the penstock elasticity, as well as those of the
compressibility and elasticity of the connections to the transducers, are negligible.
The penstock load losses are almost quadratic with respect to the water velocity.
The fluid motion inside the testing section should be considered as mono-dimensional (the
velocity vectors in one section perpendicular to the penstock axis are simplified with a direct
vector according to the penstock axis and with a modulus equal to the mean velocity).
According to the code the main requirements of the method are:
a) There must be no free surface between the two sections of pressure measurement.
b) The loss through the gate closed shall not exceed 5% of the measured discharge and must be
measured with an accuracy of no more than 0.2% of that magnitude.
c) The recordings of the pressure-time signals shall be simultaneous and independent; a suitable
data logger or acquisition device shall be used.
d) In the measuring portion, the penstock must be straight and have a constant cross section
and must not show any significant irregularities.
e) The distance between the two measuring sections should not be less than 10 m. Moreover,
the product of the distance between the two sections of pressure measurement and the average
velocity in the pipe, when the group operates at full load, must not be less than 50 m2/s.
f) The cross-section of the pipe and the length of the measurement portion between the two
cross sections, must be measured on site with sufficient care to determine the “penstock factor”
F of the pipe with a precision of at least 0.2%.
g) The sum of the pressure loss between the two sections and measurement of the dynamic
pressure, the maximum flow to be measured, must not exceed 20% of the average variation of
the differential pressure measured during the closing of the intercepting gate.
h) The differential pressure transducers should be positioned so that the tubes connecting them
to the suitable taps upstream and downstream are of nearly equal length.
Test Preparation
Since the conduct had been completely renewed all the arrangements were made in order to
adhere to the requirements of the codes.
Two suitable sections were chosen and equipped with four pressure taps positioned at 45 ° with
respect to the horizontal plane with an internal hole 6 mm diameter. The two sections are in a
straight portion of the duct to approximately 10 penstock diameters upstream of the entrance of
3
the power house and about 25 penstock diameters downstream of a 25°bend. The two sections
spaced 20 m are regular and specifically measured before watering up.
The distance of 20 m was chosen in order to satisfy the lower limit provided by the codes of 50
m2/s for the product between the distance between the sections and the water velocity in full load
conditions.
The closing times are rather slow in the case of Pelton turbines, and then it was considered
feasible to reduce the maneuver times during the tests to optimize the differential pressure signal
since the new pipe was designed to withstand overpressures above 15% compared to the static
maximum storage level.
The choice of the operating timing and sequence of the needles stroke has to be done in order to
satisfy two conflicting requirements. From one side, the transient should be quick enough to
determine quite high over-pressures able to improve the signal/noise ratio (in first
approximation we can assume that
∆𝑃𝑚𝑎𝑥 (𝑘𝑃𝑎) = (2 𝐿 𝑄 𝜌) ⁄ (𝑡 𝑆)
on the other side the frequencies involved in the phenomenon should be far enough from any
possible resonance with the measuring system. Moreover, it is worthwhile to remember that
particular transients can determine the passage through unsteady and backflow conditions
that can affect the reliability of the measurements.
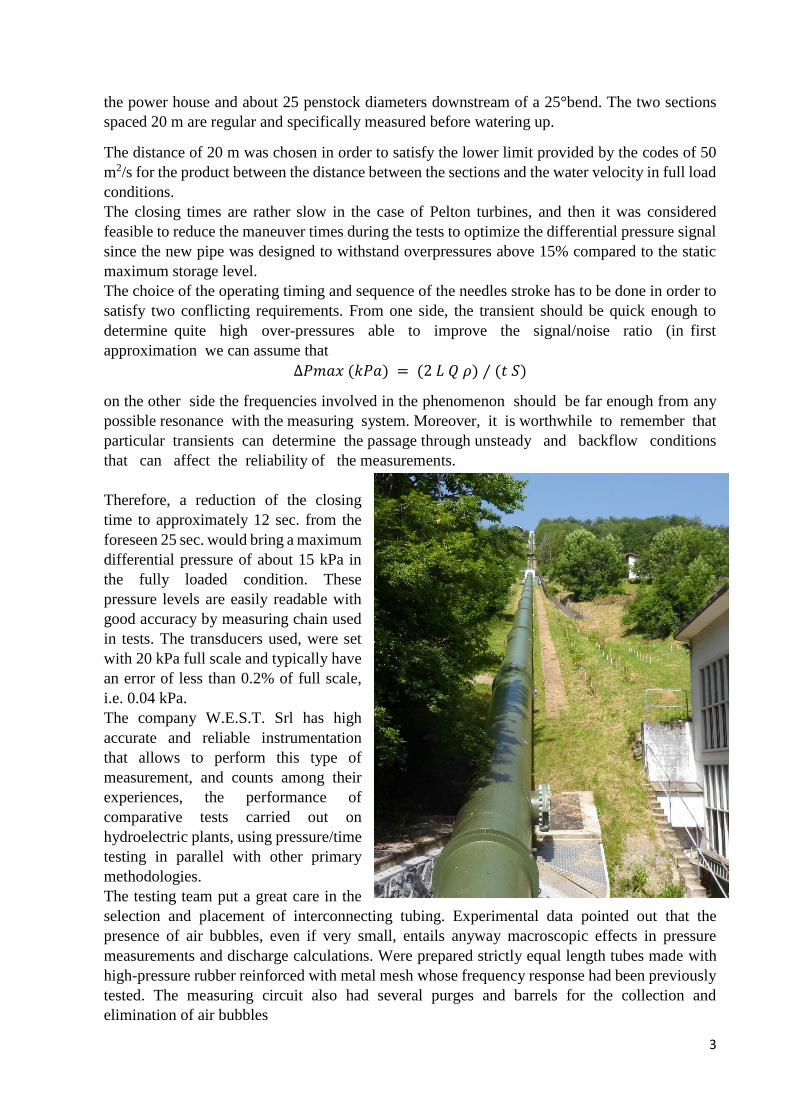
Therefore, a reduction of the closing
time to approximately 12 sec. from the
foreseen 25 sec. would bring a maximum
differential pressure of about 15 kPa in
the fully loaded condition. These
pressure levels are easily readable with
good accuracy by measuring chain used
in tests. The transducers used, were set
with 20 kPa full scale and typically have
an error of less than 0.2% of full scale,
i.e. 0.04 kPa.
The company W.E.S.T. Srl has high
accurate and reliable instrumentation
that allows to perform this type of
measurement, and counts among their
experiences, the performance of
comparative tests carried out on
hydroelectric plants, using pressure/time
testing in parallel with other primary
methodologies.
The testing team put a great care in the
selection and placement of interconnecting tubing. Experimental data pointed out that the
presence of air bubbles, even if very small, entails anyway macroscopic effects in pressure
measurements and discharge calculations. Were prepared strictly equal length tubes made with
high-pressure rubber reinforced with metal mesh whose frequency response had been previously
tested. The measuring circuit also had several purges and barrels for the collection and
elimination of air bubbles
4
Unexpected issues and changes to measurement procedures
At the time of the tests, however, the planned reduction of the needles closing time was found
not feasible.
In fact, the end portion of the penstock, downstream of the bifurcation of the new unit, had been
left as original with riveted pipe; there was no evidence that the old penstock could withstand the
overpressure and this issue required the closing time of the needles to be further increased to
approx. 30 sec.
Following this setback (situation reported at the end of the installation of the test equipment), it
was considered appropriate to keep the test configuration previously agreed between the parties
incorporating the measurement with other two signals (also measured with different transducers).
The test team added the absolute pressures in the section (1v) downstream of the portion foreseen
for pressure/time measurement and the absolute pressures measured at two additional taps
available downstream of the intake butterfly valve (1m).
This arrangement made it possible to simultaneously acquire differential signals and make
different flow calculation method with a "classic" pressure/time and to implement measures with
the so-called method of separate pressures.
In this variant of pressure-time method, the pressure changes in two cross-sections of
measurement of the penstock are recorded separately. According to the codes, it is also possible
to use only one measuring section and refer it to the free surface of the water at the outlet.
This method can only be used when the plant is not provided with a surge tank and the length of
the penstock, in which it is difficult to perform the calculation of the “penstock factor” (as
convergent entry, etc..), does not exceed 2% of the entire length. Obviously, it is essential to
synchronize the acquisition systems of the different sections.
For each test, three different flow values are obtained : one obtained by the “classic” method with
PT differential pressure, one by the method of separate pressures and finally a third using the
single section at the penstock base with respect to the free surface of the upstream reservoir.
These values were also compared with the discharge coefficient deduced from the needle strokes
and also with flow values provided by a one beam external ultrasound device (not calibrated),
installed for the continuous control of the penstock leaks.
Discharge measurements
All the measuring system was verified in the field and provided with the appropriate calibrations.
In the sections 1m (located 700 mm downstream of the intake valve) and 1v, ( located 12 m
upstream of the bend at the entrance of the plant) absolute pressure transducers were positioned,
using for each of the sections, the two pressure traps ½ "Gas, arranged at 180 ° between them.
The measurement of the pressure in the 1m comes from Honeywell transducers STG 130, range
set at -10/+ 30 kPa, connected to the taps manifold on the penstock at the altitude of 700 m a.s.l.
The measurement of the pressure in the 1v comes from Honeywell transducers STG 140, range
set at 0/330 kPa, connected to the taps manifold on the penstock at the altitude of 440 m a.s.l.
At the same time it was acquired the differential pressure measured between taps 1v and 1v'
positioned at 20 m distance between them (section 1v' is located 20 m upstream of the section
1v) using two transducers Honeywell YSTD 130 range set at 0/20 kPa.
5
The fast acquisition system samples the different signals (the pressures mentioned and the
openings of the plugs) to 450 Hz (200 Hz after anti-aliasing filtering) with 18 bits of resolution
and with a S / H system that allows the simultaneity of the acquisitions. The recording starts
about 2 minutes before the temporary closure and ends about 4 minutes after the complete closure
of the needles. The unit is dragged to the rated rotation speed in power absorption.
The penstock oscillates at a period of about 3.5 s for which the choice of the final zero level, is
selected in order to include an appropriate integer number of periods.
Net Head measurements
All pressure transducers were calibrated using primary gauges as a reference and verified at site.
The measurement of the pressure sensors was also checked by comparing the measured pressures
in static conditions with the level of the upstream reservoir. This measurement is made measuring
the pressure at the penstock base (with spherical valve open and closed needles) by using two
different transducers necessary for a proper and accurate measurement and comparison.
One pressure measurement comes from a transducer Honeywell STG 140, range set at 0/330 kPa,
connected to the taps manifold on the penstock located upstream the spherical valve. The second
pressure measurement comes from a transducer Honeywell STG 140, range set at 0/330 kPa,
connected to the taps manifold on the penstock located downstream the spherical valve at the
spiral case entrance.
The differential pressure measurement on the cone Venturi, converging from the diameter of
1800 mm to 1000 mm diameter, provides a fairly reliable indication of the flow rate and has been
used to assess the reliability of measurements. This measurement comes from a transducer
Honeywell YSTD 130 range set at 0/20 kPa. The measures provided by the transducers were
acquired by the acquisition system HP 3852 A with five readings per second and 24 bits of
resolution.
Measurement of electric power
The measurement of electrical power has been carried out at the generator terminals downstream
of the PT and CT class 0.25 transformers.
As required by the codes, there has been a three-phase measuring method with continous
recording, of the values of active power, the values of current and voltage of the generator and
power factor.
The instrument for measuring these electrical quantities used is a Digital Power Analyzer Norma
D 5255 S King. B 270 775 HE, complete with digital display and six analog outputs in class 0.1.
The instrument acquisition system was connected to the computer and HP 3852 A; the
measurements were therefore obtained with five samples per second and 24 bits of resolution.
6
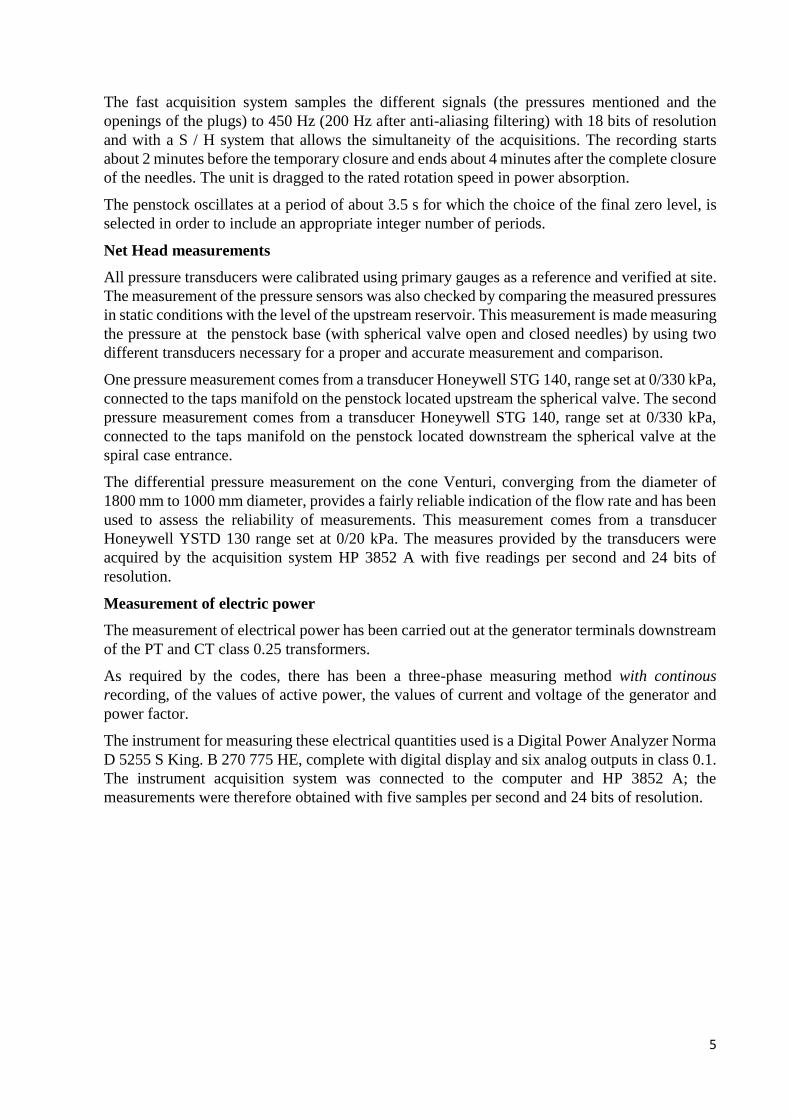
Analysis of results
The analysis of the recording showed nothing unexpected as can be seen from the charts of the
separate pressures. At the base of the penstock (section 1v) there are the fluctuations at penstock
frequency that keep going after of the full closure of the needles. This phenomenon shows a very
reduced damping being the penstock new with very low roughness. At the entrance of the
penstock downstream of the
butterfly the graphs
highlight the high
frequencies that may be
attributable to the vorticity
induced by the lens of the
butterfly.
In the graphs that represent
the integral calculation of
pressure for the
determination of the flow
there are also the losses of
the penstock in the section
considered and the trend of
the flow rate during the
transient of the closure of
needles. Although these graphs put evidence over the oscillation of the pressure at the end of the
closure, the fluctuations in flow resulting derived from those the oscillation are very modest. The
tests then showed a substantial reliability and excellent repeatability. Special care has been taken
in the choice of the integration and in particular the end point of integration.
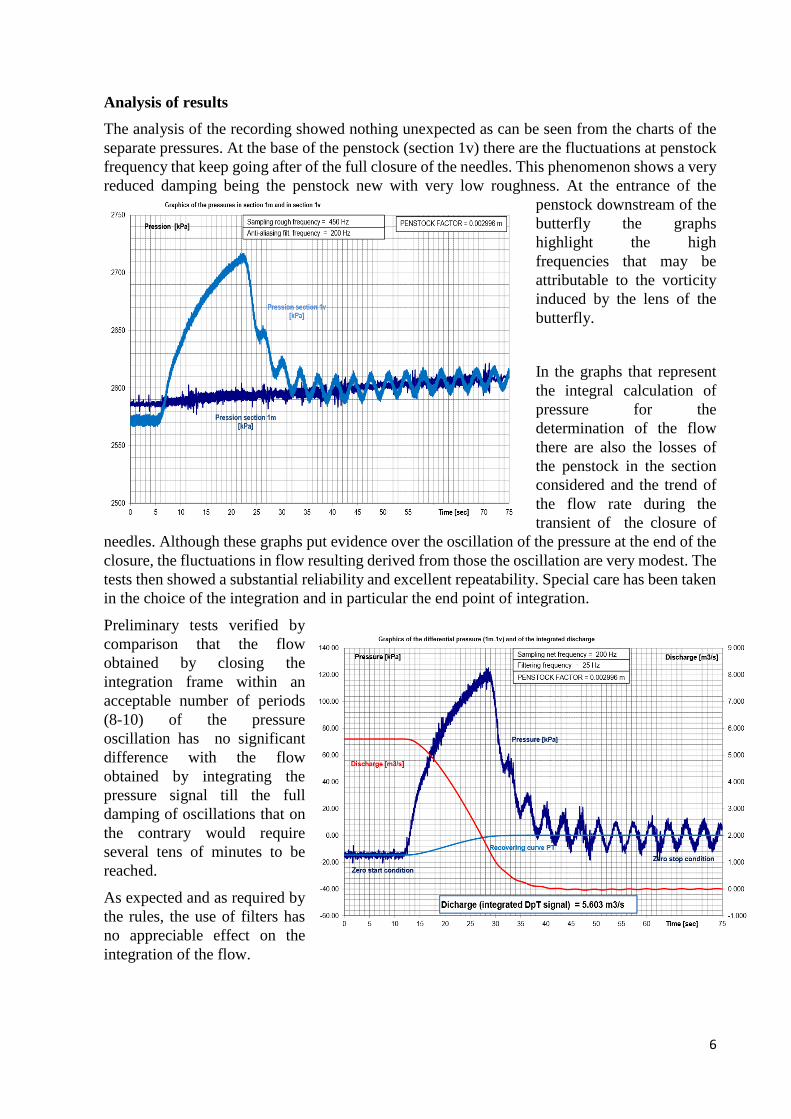
Preliminary tests verified by
comparison that the flow
obtained by closing the
integration frame within an
acceptable number of periods
(8-10) of the pressure
oscillation has no significant
difference with the flow
obtained by integrating the
pressure signal till the full
damping of oscillations that on
the contrary would require
several tens of minutes to be
reached.
As expected and as required by
the rules, the use of filters has
no appreciable effect on the
integration of the flow.
7
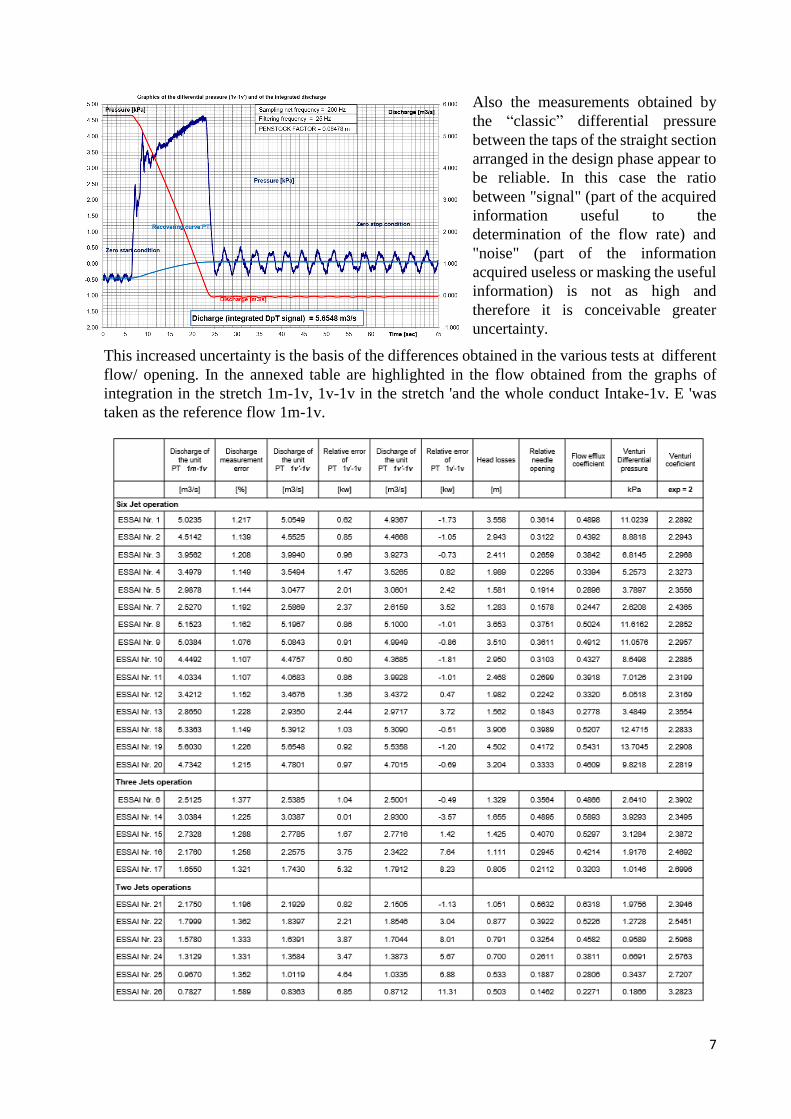
Also the measurements obtained by
the “classic” differential pressure
between the taps of the straight section
arranged in the design phase appear to
be reliable. In this case the ratio
between "signal" (part of the acquired
information useful to the
determination of the flow rate) and
"noise" (part of the information
acquired useless or masking the useful
information) is not as high and
therefore it is conceivable greater
uncertainty.
This increased uncertainty is the basis of the differences obtained in the various tests at different
flow/ opening. In the annexed table are highlighted in the flow obtained from the graphs of
integration in the stretch 1m-1v, 1v-1v in the stretch 'and the whole conduct Intake-1v. E 'was
taken as the reference flow 1m-1v.
8
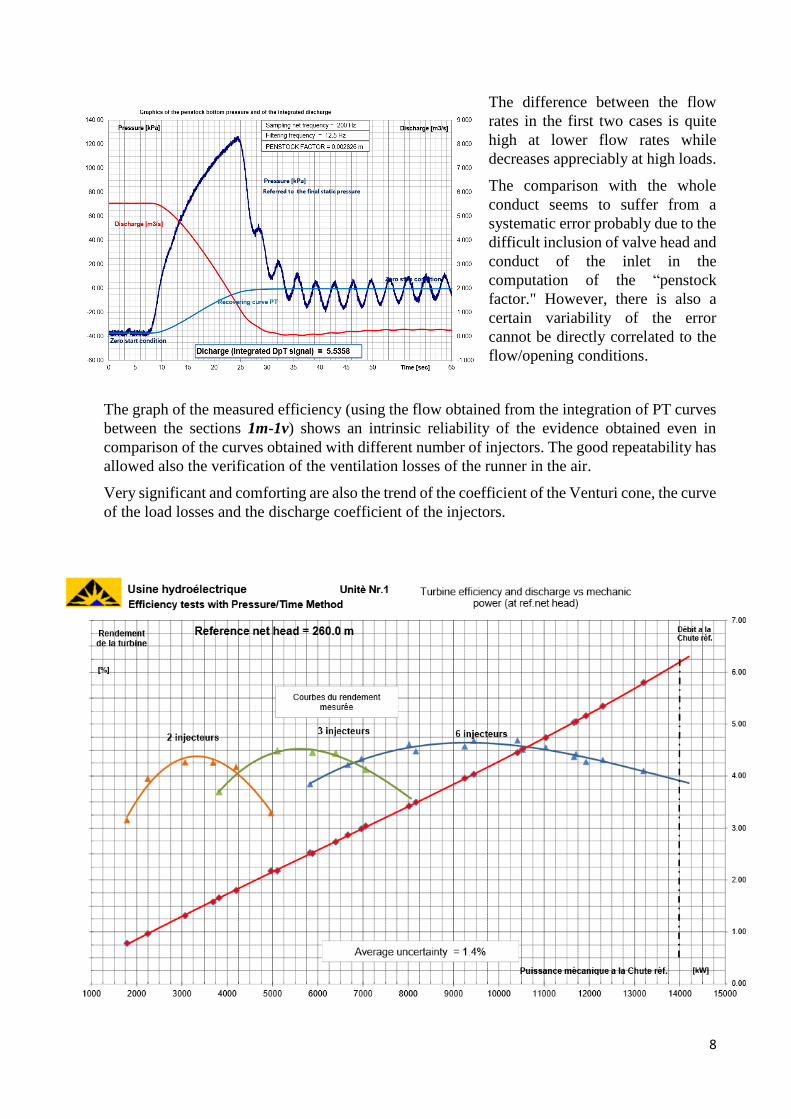
The difference between the flow
rates in the first two cases is quite
high at lower flow rates while
decreases appreciably at high loads.
The comparison with the whole
conduct seems to suffer from a
systematic error probably due to the
difficult inclusion of valve head and
conduct of the inlet in the
computation of the “penstock
factor." However, there is also a
certain variability of the error
cannot be directly correlated to the
flow/opening conditions.
The graph of the measured efficiency (using the flow obtained from the integration of PT curves
between the sections 1m-1v) shows an intrinsic reliability of the evidence obtained even in
comparison of the curves obtained with different number of injectors. The good repeatability has
allowed also the verification of the ventilation losses of the runner in the air.
Very significant and comforting are also the trend of the coefficient of the Venturi cone, the curve
of the load losses and the discharge coefficient of the injectors.
9
Conclusions
The tests performed with the methodology of the separate measurements of the upstream (1m)
and downstream (1v) pressures in the penstock good reliability and consistency. As expected the
measurements made with the differential pressure in the downstream stretch between sections
(1v ') and (1v) are less reliable.
The relationship
∆𝑃𝑚𝑎𝑥 (𝑘𝑃𝑎) = (2 𝐿 𝑄 𝜌) ⁄ (𝑡 𝑆)
although not rigorous, is an extremely effective tool to frame the range of pressure and see if the
transducers are adequate for the planned measure. An effective tool to define the band of
uncertainty of the flow measurement is the analysis of the signal / noise ratio. This evaluation
shall be tuned as a function of the specific purpose of the measure (for example, the pressure
pulsation in the duct to effect of disturbances in the exhaust of a Francis although physically
congruent with hydraulic phenomena are to be considered as noise for a measurement of jump).
The use of only one measuring section (1v) referred to the intake level has proved problematic
and unreliable especially for the uncertainty in the determination of the “penstock factor" in the
presence of perturbing organs such as the butterfly valve at the penstock entrance or grids .