measurements of the normal cervical spinal cord on mr … · measurements of the normal cervical...
TRANSCRIPT

John L. Sherman 1 ·2
Patrie Y. Nassaux2
Charles M. Citrin 1 ·2
Received May 5, 1989; revision requested July 11 , 1989; revision received August 1, 1989; accepted August 2, 1989.
Presented at the annual meeting of the American Society of Neuroradiology, Orlando, March 1989.
' Wheaton Magnetic Imaging, Washington Imaging Center, 2801 University Blvd ., Kensington , MD 20895. Address reprint requests to J. L. Sherman.
2 Department of Radiology, Uniformed Services University of the Health Sciences, Bethesda, MD 20814.
0195-6108/90/1102-0369 © American Society of Neuroradiology
Measurements of the Normal Cervical Spinal Cord on MR Imaging
369
The purpose of this study was to determine normal measurements of the C1-T3 spinal cord in anteroposterior and transverse planes from MR images and to compare these with previously published data. Seven hundred and fifty-six measurements were made from 66 randomly selected MR studies of the cervical spine. We measured the anteroposterior and transverse diameters of the cord at each vertebral level and computed the simple product of these diameters to provide a single useful numerical value, termed the approximate cord area (ACA). The cord varies in average anteroposterior and transverse diameters from 8.8 mm x 12.4 mm at C2 to 8.7 mm x 14 mm at C4 to 7.4 mm x 11.4 mm at C7. The cervical enlargement was found from C4 to C6 and was most evident by comparing the ACA values. At C2 the average ACA was 110 mm2
,
at C4 it was 121.9 mm2, and at C7 the average ACA was 84.6 mm2
• Comparison of our data with the literature reveals disparate measurements that vary up to 6 mm from our mean values. However, our results correlated well with the postmortem studies of Nordquist (1964).
A single number cannot be used as the basis for evaluating spinal cord size. Each level should be compared with the normal range specific for that level.
AJNR 11:369-372, March/ April 1990
Anatomic measurements of the spinal cord were made at autopsy as early as 1875 [1-3]. Subsequent studies were performed with pneumomyelography [4] , oily contrast myelography [5-7] , postmortem myelography, and CT-assisted myelography [8 , 9].
Previous studies of the morphology and diameters of the spinal cord were each affected by technique-dependent errors and thus could not be relied upon in the MR evaluation of cord size. The purpose of this study was to provide MR-specific standards for cervical spinal cord size and to compare the measurements with previous morphologic studies.
Materials and Methods
Seven hundred and fifty-si x measurements were made from 66 MR studies of the cervical spine that were randomly selected from our film library. Patients' ages ranged from 19 to 74 years (average, 41 years). An MR examination was accepted into the study if it was interpreted as normal by a neuroradiologist or if the abnormality was of a minor diskogenic type; for example, a slight indentation of the thecal sac that did not affect the spinal cord. An MR study was rejected if the clinical history indicated possible intrinsic spinal cord disease or a degenerative process. The study was also rejected if image quality was subjectively determined to be below our average standards.
All examinations were performed on a 1.5-T imager. The imaging sequence and associated parameters were identical in all patients and were as follows: thickness = 5 mm , averages= 2, field of view = 20 em, TE = 20, TR = 1000, gap between sections= 2 mm or more, matrix = 256 x 256. Each image was magnified x 2 and photographed by using window widths and levels that provided optimal image quality for evaluation of disks and spinal cord (window
370 SHERMAN ET AL. AJNR:11 , March/April1990
width , 190- 230; window level, 950-1150). The 15-imagejfilm format was used.
Not all patients had sections at all levels ; thus . the number of measurements at each level was not uniform. Each level was defined as including all sections through the associated vertebral body. Disk sections were assigned to the vertebra closest to the disk or to the superior level if the section was equidistant from adjacent vertebrae. Thus , multiple measurements were frequently made for each level (Fig. 1 ). All measurements were obtained from axial MR sections placed at right angles to the spinal cord . In most cases measurements of the spinal cord diameters could not be directly obtained by using the image display computer because the measurement utility does not function on oblique images. Derived measurements were therefore obtained according to the following technique: The measured distance of the diameter of the cord was taken directly from the film by means of a calipers and a metric ruler measured in millimeters to the nearest 0.1 mm. This number was converted to the actual diameter by using the following equation:
AD FOV
MD (WF) (MAG) (1)
where AD = actual diameter, MD = measured diameter, FOV = field of view, WF =frame width , and MAG= magnification factor. When there were 15 images per film, the frame width was 8 em. Solving for AD where MD= 10 mm, FOV = 20 em, WF = 15, and MAG= 2 yielded:
(20 em) (1 .0 em) AD = = AD = 0.66 em = 6.6 mm
(15 em) (2 .0) (2)
The measurements derived in this manner were validated by making random spot measurements on the computer-generated scale in those cases in which a nonoblique technique was employed. We found no diHerence in values after rounding the direct measurements and the calculated measurements to the nearest millimeter.
The true cord area was not calculated , since the calculation involves variable ellipse shapes. However, a number termed the approximate cord area (ACA) was obtained as the simple product of the anteroposterior and transverse diameters rounded to the nearest millimeter. The standard deviation was calculated for all measurements. The coeHicient of correlation for the relationship of cord size to weight and age was calculated by using linear regression analysis .
Results
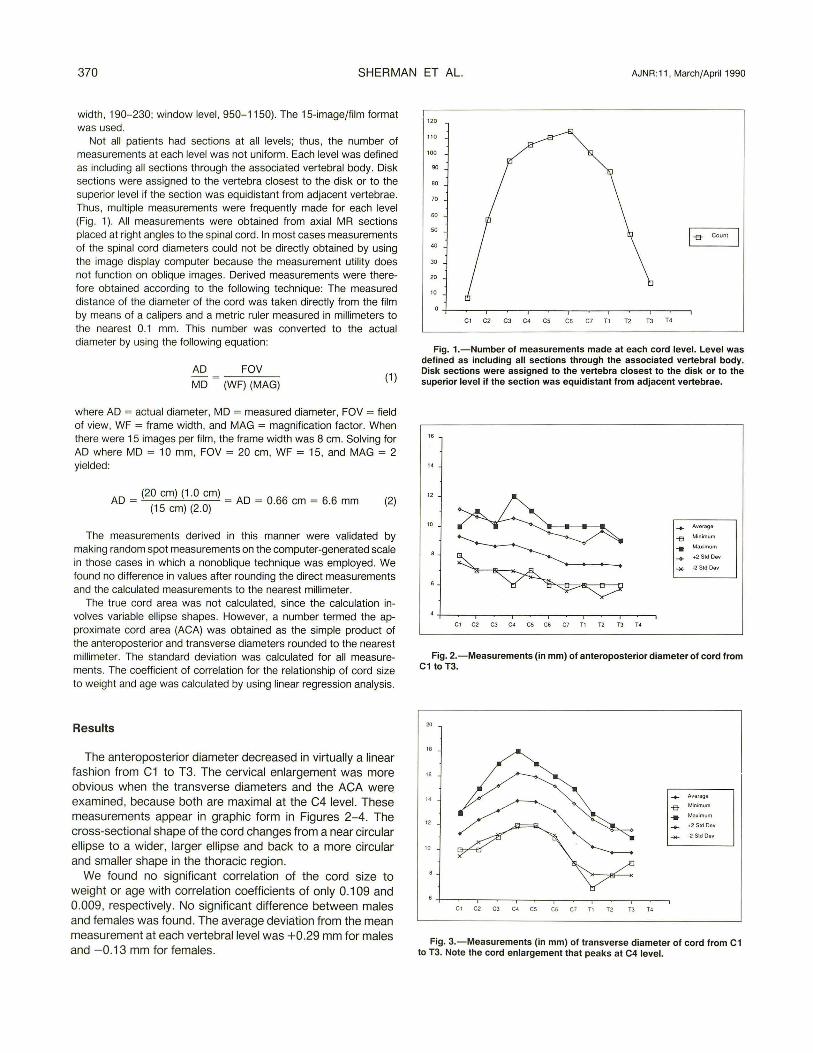
The anteroposterior diameter decreased in virtually a linear fashion from C1 to T3. The cervical enlargement was more obvious when the transverse diameters and the ACA wen'l examined, because both are maximal at the C4 level. These measurements appear in graphic form in Figures 2-4. The cross-sectional shape of the cord changes from a near circular ellipse to a wider, larger ellipse and back to a more circular and smaller shape in the thoracic region .
We found no significant correlation of the cord size to weight or age with correlation coefficients of only 0.109 and 0.009 , respectively . No significant difference between males and females was found. The average deviation from the mean measurement at each vertebral level was +0.29 mm for males and - 0.13 mm for females .
120
110
100
90
80
70
60
50
I~ Count
40
30
20
10
Cl C2 C3 C4 CS C6 C7 Tl T2 TJ T4
Fig. 1.-Number of measurements made at each cord level. Level was defined as including all sections through the associated vertebral body. Disk sections were assigned to the vertebra closest to the disk or to the superior level if the section was equidistant from adjacent vertebrae.
Average
-e Minimum .. Max1mum ... +2 Std Dev
.... -2 Std Oov
Fig. 2.-Measurements (in mm) of anteroposterior diameter of cord from C1 to T3.
20
18
" .... Average
-a Minimum .. Ma•imum 12
-+ +2 Std OGII
-2 Std Dov
10
C l C2 C3 C4 CS C6 C7 T1 T2 T3 T4
Fig. 3.-Measurements (in mm) of transverse diameter of cord from C1 to T3. Note the cord enlargement that peaks at C4 level.

AJNR :11 , March/April1990 MR MEASUREMENTS OF SPINAL CORD 371
200
Aver ago
100 -e Mrnrmum
-- Ma:umum
+ ~2 Std Oev
·2 Std Oo11
Cl C2 CJ C.: CS C6 C7 Tl T2 TJ T4
Fig. 4.-Graph of approximate cord area (ACA) values (in square mm) from C1 to T3. These numbers are obtained by multiplying anteroposterior diameter by transverse diameter, and do not represent true area measurements of the spinal cord.
To provide information that would directly apply to the clinical setting, we also analyzed the data after all measurements were rounded off to the nearest millimeter. These data are presented in Table 1, including the calculated ACA. The standard deviations were 0.1-0.2 mm higher among the rounded data than among the nonrounded data.
Discussion
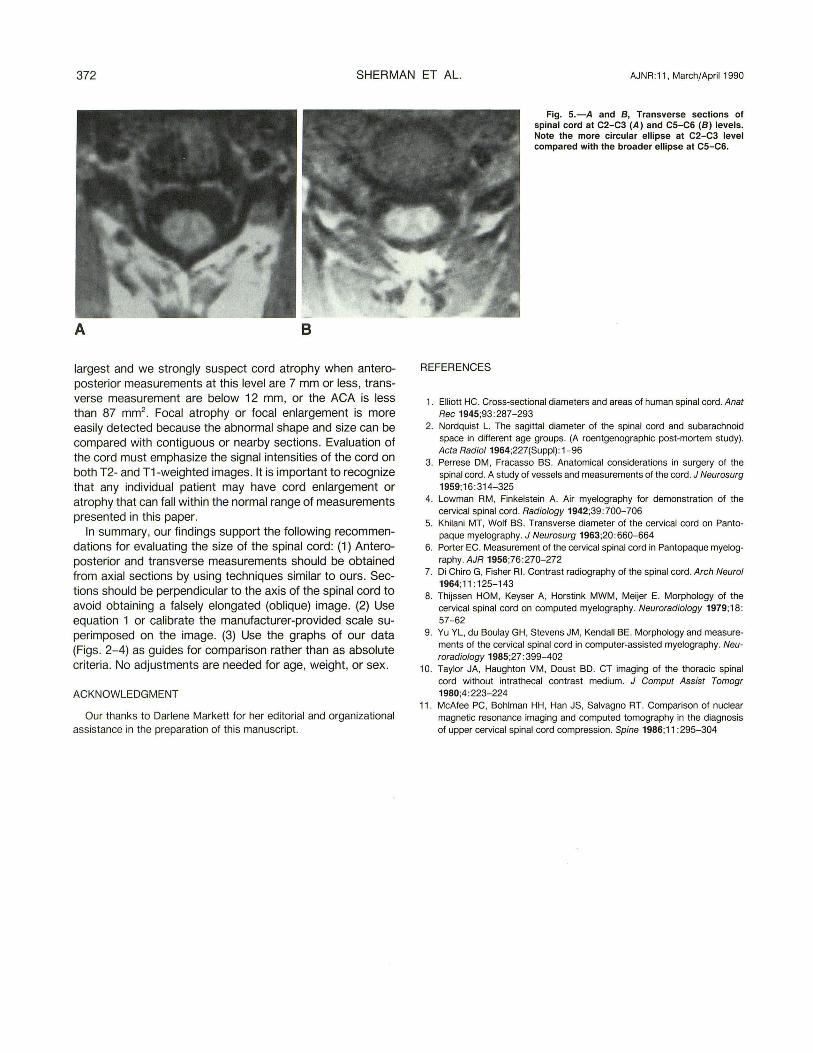
The spinal cord in cross section has the shape of an ellipse that varies with the level of section. The spinal cord has two enlargements, the cervical and lumbar. These enlargements occur because of the increased neural tissue required for the brachial and lumbar plexuses. At the highest cord levels the cord is a near circular ellipse. It gradually enlarges in both transverse and anteroposterior planes to its maximum area at C4 or C5 and then decreases (Fig . 5). The change in cord diameter defining the cervical enlargement is most obvious by comparing the ACA calculated numbers, which are a rough approximation of the relative cord area of each section (Fig.
4). These data can be used to help determine cord atrophy or enlargement, but areas of enlargement are usually more obvious because of associated signal abnormalities or abnormal enhancement on gadolinium studies .
Sagittal, coronal , and oblique axial images are routinely obtained on all patients. The cervical enlargement is usually not visualized on the sagittal images because it is present mainly in the axial plane, but it may therefore be seen on coronal images. The cervical enlargement is usually recognized by comparing consecutive oblique axial images. Sagittal and coronal images are not recommended for measurements because partial volume effects due to oblique sectioning of the cord are more difficult to recognize (and thus to control) on these studies than they are on axial oblique images.
There have been many studies of the anatomy of the spinal cord [1-6, 8-11], and when they were available, we compared the data from these studies with our data. Our measurements fell in between the measurements of other reports . CT myelography measurements [8 , 9] were 1-2 mm lower than our data but we confirmed the observations of Yu et al. [9] concerning the lack of correlation between cord size and patient weight , age, and sex. The average myelographic measurements of Di Chiro and Fisher [7] were approximately 2 mm greater than our average measurements in both planes. The most similar measurements were between our data on transverse diameter and the transverse measurements made by Nordquist [2] on autopsy specimens (corrected for postfixation swelling of 2-4%).
The complex changes in cord shape and size prompted us to calculate an approximate area measurement, which we have termed the approximate cord area (ACA) from the anteroposterior and transverse diameters . We realize that this number is not a true measurement of the cord area, but we believe it can be used as a rough comparison value to supplement the subjective estimate that radiologists usually use. The graph of the ACA provides a quick reference guide (Fig . 4). Cervical ACA values of 80-90 (particularly in the midcervical area) should alert the radiologist to the possibility of spinal cord atrophy. Each spinal cord level is slightly different and the measurements are only valid in the absence of stenosis or cord compression . The C4 level is usually the
TABLE 1: Calculated Average Spinal Cord Measurements and Standard Deviations*
Cord Level Average AP Average Transverse Average ACA
Diameter (SO) Diameter (SO) (SO)
C1 9.3 mm (0.9) 11 .3 mm (0 .9) 105.1 mm2 (13.8) C2 8.8 mm (0.9) 12.4 mm (0 .9) 1 09.1 mm2 (15 .0) C3 8.6 mm (0.8) 13.2 mm (1.0) 113.5 mm2 (16.0) C4 8.7 mm (0.9) 14.0mm (1.1) 121.8 mm2 (17.5) C5 8.3 mm (0.9) 13.9 mm (1.0) 115.4 mm2 (15.7) C6 7.9 mm (0.8) 13.2 mm (1.0) 1 04.3 mm2 (15.0) C7 7.4 mm (0.9) 11 .4 mm (1 .2) 84.4 mm" (15.7) T1 7.4 mm (0.7) 10.3 mm (1.1) 76.2 mm2 (12.7) T2 7.4 mm (1.1) 9.8 mm (0 .9) 72.5 mm2 (15.4) T3 7.3 mm (0 .8) 9.8 mm (0 .9) 71.5 mm2 (1 0.8)
• These average measurements and the corresponding standard deviations were calculated from original data that were rounded to the nearest millimeter.
Note.- AP = anteroposterior, SO = standard deviation, ACA = approximate cord area.
372 SHERMAN ET AL. AJNR :11 , March/April 1990
A B
largest and we strongly suspect cord atrophy when anteroposterior measurements at this level are 7 mm or less, transverse measurement are below 12 mm, or the ACA is less than 87 mm2
. Focal atrophy or focal enlargement is more easily detected because the abnormal shape and size can be compared with contiguous or nearby sections. Evaluation of the cord must emphasize the signal intensities of the cord on both T2- and T1-weighted images. It is important to recognize that any individual patient may have cord enlargement or atrophy that can fall within the normal range of measurements presented in this paper.
In summary, our findings support the following recommendations for evaluating the size of the spinal cord: (1) Anteroposterior and transverse measurements should be obtained from axial sections by using techniques similar to ours. Sections should be perpendicular to the axis of the spinal cord to avoid obtaining a falsely elongated (oblique) image. (2) Use equation 1 or calibrate the manufacturer-provided scale superimposed on the image. (3) Use the graphs of our data (Figs. 2-4) as guides for comparison rather than as absolute criteria. No adjustments are needed for age, weight, or sex.
ACKNOWLEDGMENT
Our thanks to Darlene Markett for her editorial and organizational assistance in the preparation of this manuscript.
REFERENCES
Fig. 5.-A and 8, Transverse sections of spinal cord at C2-C3 (A) and C5-C6 (8) levels. Note the more circular ellipse at C2-C3 level compared with the broader ellipse at C5-C6.
1. Elliott HC. Cross-sectional diameters and areas of human spinal cord. Anal Rec 1945;93:287-293
2. Nordquist L. The sagittal diameter of the spinal cord and subarachnoid space in different age groups. (A roentgenographic post-mortem study). Acta Radioi1964;227(Suppl) : 1-96
3. Perrese DM, Fracasso BS. Anatomical considerations in surgery of the spinal cord. A study of vessels and measurements of the cord. J Neurosurg 1959;16:314-325
4. Lowman RM , Finkelstein A. Air myelography for demonstration of the cervical spinal cord. Radiology 1942;39:700-706
5. Khilani MT, Wolf BS. Transverse diameter of the cervical cord on Pantopaque myelography. J Neurosurg 1963;20:660-664
6. Porter EC. Measurement of the cervical spinal cord in Pantopaque myelography. AJR 1956;76:270-272
7. Di Chiro G, Fisher Rl. Contrast radiography of the spinal cord. Arch Neural 1964;11: 125-143
8. Thijssen HOM, Keyser A, Horstink MWM, Meijer E. Morphology of the cervical spinal cord on computed myelography. Neuroradiology 1979;18: 57-62
9. Yu YL, du Boulay GH, Stevens JM, Kendall BE. Morphology and measurements of the cervical spinal cord in computer-assisted myelography. Neuroradiology 1985;27:399-402
10. Taylor JA, Haughton VM , Doust BD. CT imaging of the thoracic spinal cord without intrathecal contrast medium. J Comput Assist Tomogr 1980;4:223-224
11. McAfee PC, Bohlman HH, Han JS, Salvagno RT. Comparison of nuclear magnetic resonance imaging and computed tomography in the diagnosis of upper cervical spinal cord compression. Spine 1986;11 :295-304