measurements of steady flow through a bileaflet … of toronto 5 king’s college rd. toronto,...
TRANSCRIPT

Author Generated Proof Final Version appears in - Medical & Biological Engineering & Computing.
Measurements of Steady Flow through a Bileaflet Mechanical Heart Valve using Stereoscopic PIV DOI: 10.1007/s11517-010-0705-z
1
The final publication is available at www.springerlink.com
Measurements of Steady Flow through a Bileaflet Mechanical Heart Valve using Stereoscopic PIV
Chris Hutchison
Dept. of Mechanical and Industrial Engineering
University of Toronto
5 King’s College Rd.
Toronto, Ontario, Canada M5S 3G8 [email protected]
Pierre Sullivan
Dept. of Mechanical and Industrial Engineering
University of Toronto
5 King’s College Rd.
Toronto, Ontario, Canada M5S 3G8 [email protected]
C. Ross Ethier
Dept. of Bioengineering
Imperial College, London
South Kensington Campus, London, UK SW7 2AZ [email protected]
Abstract
Computational modeling of bileaflet heart valve
(BiMHV) flow requires experimentally validated
datasets and improved knowledge of BiMHV fluid
mechanics. In this study, flow was studied
downstream of a model BiMHV in an
axisymmetric aortic sinus using stereoscopic
particle image velocimetry. The inlet flow was
steady and the Reynolds number based on the
aortic diameter was 7600. Results showed the out-
of-plane velocity was of similar magnitude as the
transverse velocity. Although additional studies
are needed for confirmation, analysis of the out-of-
plane velocity showed the possible presence of a
four-cell streamwise vortex structure in the mean
velocity field. Spatial data for all six Reynolds
stress components were obtained. Reynolds
normal stress profiles revealed similarities between
the central jet and free jets. These findings are
important to BiMHV flow modeling, though
clinical relevance is limited due to the idealized
conditions chosen. To this end, the dataset is
publicly available for CFD validation purposes.
Keywords: bileaflet mechanical heart
valve, stereoscopic particle image
velocimetry, CFD validation, 3D vortex
structure, Reynolds stress
1 Introduction
The most recent mechanical valve
prosthesis in widespread use is the
bileaflet mechanical heart valve (BiMHV)
[24]. Computational fluid dynamics
(CFD) modeling of BiMHV flow has
enormous potential in future device
improvement because of the ability to
perform inexpensive parametric studies.
Recently, advanced codes have been
developed to model the complex,
turbulent, and three-dimensional flow
downstream of a BiMHV throughout the
entire cardiac cycle [3,5,6,11,13,26]. For
accurate CFD simulations of BiMHV
flow, rigorous code validation is required.
Numerical studies of BiMHV flow have
found that large scale flow structures break
down to smaller scale turbulence near peak

Author Generated Proof Final Version appears in - Medical & Biological Engineering & Computing.
Measurements of Steady Flow through a Bileaflet Mechanical Heart Valve using Stereoscopic PIV DOI: 10.1007/s11517-010-0705-z
2
The final publication is available at www.springerlink.com
systole [5]. These small-scale structures
have proved difficult to experimentally
validate in a pulsatile flow regime due to
cycle-to-cycle variability thought to be
caused by asynchronous valve leaflet
opening, and valve geometry
imperfections in-vitro [4,5]. Because of
these issues in validation, in initial stages
of code development, it is advantageous to
validate CFD code at a peak systolic
Reynolds number with steady inflow
conditions The primary goal of the current
study was to facilitate further CFD code
development by obtaining an experimental
dataset of BiMHV flow with steady inlet
conditions, and making it publicly
available for validation purposes. The
results of the current study were thus
limited to the steady inflow condition,
where the effects of pulsatile flow
acceleration and deceleration, and
resulting vortex interaction, were not
present. While this limits the clinical
relevance of the study, it is well suited for
CFD validation purposes.
Yoganathan et al. [31,32] used laser
Doppler anemometry (LDA) for steady
inlet flow at mid- and peak systolic flow
rates to first describe the flow. The typical
triple jet formation was described with two
lateral orifice jets on either side of the
leaflets, and a central jet between the
leaflets [31]. Three-dimensionality of the
flow was confirmed by Hanle et al. [14] as
evidence of a four-cell streamwise vortex
system in the proximal aorta was observed
for steady inlet flow.
Two-component PIV (2C-PIV) has been
useful in validating numerical simulations
[5,6,13], while providing spatial
characterization of the flow. Dasi et al. [5]
used 2C-PIV with pulsatile inlet
conditions to describe BiMHV flow during
systolic acceleration and deceleration. Ge
et al. [12] analyzed data from [5] and
found that cycle-to-cycle variations largely
contaminated Reynolds stress calculations
when ensemble averaging was used. Liu
et al. [21] noted similar cycle-to-cycle
variations from 2C-LDA data and
hypothesized that turbulence in the sinus
may be affected by energy supplied from
the previous cycle. Li et al. [20] used 2C-
PIV data together with a large eddy
simulation model to obtain estimates of
turbulent energy dissipation and length
scales.
Marassi et al. [22] first used stereoscopic
particle image velocimetry (SPIV) to study
flow behind a bioprosthetic valve. More
recently, measurements in BiMHV flow
have been obtained by Kaminsky et al.
[16,17] using high-speed SPIV, though
data was limited to a few pulsatile flow
cycles due to data storage limitations.
Examination of the sinus cross sectional
planes in [17] showed secondary flow
structures. In [16] the out-of-plane
velocity was seen to reach elevated values
near the sinus regions, and highlighted the
importance of resolving the out-of-plane
velocity component.
Unless single sample errors are extremely
low, high statistical error in Reynolds
stresses can result from using small
datasets in turbulent flow [27]. This is
discussed further in Section 3.1. To
accurately record turbulent quantities in
BiMHV flow, we therefore wished to
obtain a large sample size SPIV dataset.
To accomplish this we used an idealized
valve and aortic root geometry and
restricted the study to steady inlet flow.
These idealized conditions limit the
clinical relevance of the study, but are very
well suited for CFD validation purposes.

Author Generated Proof Final Version appears in - Medical & Biological Engineering & Computing.
Measurements of Steady Flow through a Bileaflet Mechanical Heart Valve using Stereoscopic PIV DOI: 10.1007/s11517-010-0705-z
3
The final publication is available at www.springerlink.com
2 Methods
2.1 Flow Loop and Test Section
A recirculating flow loop was constructed
for the experiment, as described fully in
[15]. A centrifugal pump provided steady
flow to an axisymmetric flow conditioning
chamber upstream of the test section. The
chamber housed a honeycomb flow
straightener and two turbulence reduction
screens. An axisymmetric contraction was
attached downstream of the chamber and
used a 5th
degree polynomial profile to
minimize boundary layer separation at the
contraction exit [2]. Downstream of the
contraction, inflow piping of length
400mm preceded the test section.
The use of steady flow and flow
conditioning devices upstream of the test
section provided controlled and well-
defined inlet flow to the BiMHV,
necessary for CFD validation.
Specifically, this arrangement eliminated
cycle-to-cycle variations that are
problematic in evaluating pulsatile flow.
The inlet flow, however, differed from the
in-vivo condition where pulsatile flow
enters the aorta from the left ventricle.
Furthermore, complex vortex development
during systolic acceleration was not
reflected in the current study [5].
Downstream of the contraction, inflow
piping of length 400mm preceded the test
section. Downstream of the test section,
outflow piping of length 270mm ran to a
flow control valve and air separator prior
to entering a filling tank. The air separator
was necessary to eliminate recirculating air
bubbles that interfered with PIV
measurements. A turbine impeller
flowmeter was used for flow rate
monitoring.
An axisymmetric aortic sinus design was
adopted for this study. Similar
axisymmetric designs have been used in
previous studies and have been shown to
reproduce primary flow structures of
interest such as strong jet shear layers, and
sinus flow recirculation relevant in the
clinical setting [5,9,10]. The design,
however, does not account for flow
complexities associated with flow in three
sinuses of Valsalva, or distensible aortic
walls. Because of the controlled inlet flow
conditions and axisymmetric aortic sinus
design, the flow downstream of the
BiMHV was expected to be more
symmetric than the physiological case at a
peak systolic Reynolds number [1].
Compared to the current design, it could
also be argued that more physiological
(enlarged) sinus dimensions would
produce larger scale recirculation flow
similar to that shown in [6].
The test section shown in Fig. 1 was
similar to that used by [9] and consisted of
two sections machined from cast acrylic,
which enabled BiMHV insertion and
removal during the PIV image calibration
process. The exterior surfaces of the test
section were flat to minimize optical
distortions. The axisymmetric aortic sinus
dimensions are shown in Fig. 1 where inlet
piping of diameter 26.8 mm was located
upstream of the valve. Downstream of the
valve the sinus diameter, ds = 32.0 mm
contracted to the aortic diameter, d = 26.8
mm. To eliminate reflections and laser
sheet blockage during the experiments, a
transparent model of a Carbomedics No.
25 aortic BiMHV was used. In this study,
the leaflets were fixed to eliminate fluid-
structure interaction effects and also
facilitate CFD validation studies with
stationary meshes. The valve ring was
machined from cast acrylic, and
polycarbonate leaflets were fixed in the

Author Generated Proof Final Version appears in - Medical & Biological Engineering & Computing.
Measurements of Steady Flow through a Bileaflet Mechanical Heart Valve using Stereoscopic PIV DOI: 10.1007/s11517-010-0705-z
4
The final publication is available at www.springerlink.com
fully opened position. Hinge insets were
not incorporated into the valve model.
Detailed valve drawings are given in [15].
For the PIV experiments, the fluid used
was a 61% w/w aqueous sodium iodide,
NaI(aq), solution that matched the index of
refraction, n = 1.49, of the acrylic test
section. The flow rate was adjusted and
kept steady for every 1oC increase in fluid
temperature caused by pump heat. This
maintained a constant Reynolds number to
preserve dynamic similarity because a
blood analog was not used. The Reynolds
number was 7600, roughly corresponding
to peak systole in a human aorta. For the
current geometry the Reynolds number
was defined as
d
QdU 4Re 0 (1)
where U0 was the bulk inlet velocity based
on the steady inflow rate Q, d was the
aortic diameter, and was the fluid
kinematic viscosity. U0, was calculated
for each sample and used to normalize the
recorded velocities. The sample average
of U0 was 0.41 m/s, and the sample
average density and kinematic viscosity
were 1796 kg/m3 and 1.57x10
-6 m
2/s
respectively.
The flow was seeded with silver coated
hollow glass spheres (Potters Industries,
Malvern, PA) having density 1650 kg/m3
and diameter 15 m, ensuring that the
particles responded to the flow with high
fidelity [15]. Flow visualization
experiments were also performed at a
range of Reynolds numbers, and the
images are found in [15].
2.2 SPIV System
Measurements were performed with an in-
house SPIV system (Fig. 1) that used a
New Wave SOLO PIV 120 dual head Q-
switched Nd:YAG laser emitting 532 nm
wavelength light. The laser sheet was
approximately 1 mm thick, and images
were acquired by two 1008 x 1018 pixel
Pulnix TM-1010 cameras (camera 0 and
camera 1 in Fig. 1) at a sampling rate of 3
Hz. The cameras were positioned on
either side of the laser sheet such that the
lens planes and laser sheet plane
intersected at an angle of = 30o. The
camera planes were aligned with
Scheimpflug optics at an angle of = 5o,
and data were reconstructed by positioning
the cameras for angular displacement [23].
Computar TEC-M55 telecentric lenses
were used to ensure paraxial recording.
Video Savant 3.0 was used for image
acquisition. The setup used for 2C-PIV
inlet conditions measurements was the
same as for SPIV, except a single camera
was used, where the lens plane was
positioned parallel to the laser sheet plane.
Three PIV datasets were obtained:
1. Inlet Conditions Dataset (2C-PIV)
2. Full Aortic Sinus Dataset (SPIV)
3. Near-Wall Dataset (SPIV)
The measurement locations and the
coordinate system used for the three
datasets are shown in Fig. 1. For all three
datasets, the laser sheet was positioned at
the XY plane approximately on the piping
centerline, perpendicular to the leaflet
pivot axes. The measurement system
origin was located at the leaflet tips on the
aortic centerline.
Laser pulse time separation was optimized
to take advantage of the system dynamic
range of 16 pixels for all three datasets
obtained [15]. The laser pulse time
separation for the SPIV measurements in
the Full Aortic Sinus Dataset was 400 s.
The measurement area spanned the entire
length and width of the aortic sinus,
specifically, 0.05 < X/d < 0.80, and -0.57
< Y/d < 0.57 (see Fig. 1). A total of N =
1105 samples were obtained for the Full
Aortic Sinus Dataset.

Author Generated Proof Final Version appears in - Medical & Biological Engineering & Computing.
Measurements of Steady Flow through a Bileaflet Mechanical Heart Valve using Stereoscopic PIV DOI: 10.1007/s11517-010-0705-z
5
The final publication is available at www.springerlink.com
The purpose of the Near-Wall Dataset was
to record low velocities near the sinus
walls with higher accuracy. This took
advantage of the full system dynamic
range, but restricted the usable
measurement area to only the upper and
lower sinus regions. The laser pulse time
separation was therefore doubled to 800
s. N = 718 samples were collected. The
Near-Wall Dataset extended from 0.05 <
X/d < 0.50. The measurement region in
the upper sinus spanned from 0.45 < Y/d <
0.57, and for the lower sinus region it
spanned from -0.57 < Y/d < -0.45 as shown
in Fig. 1.
The Inlet Conditions Dataset recorded the
inlet flow conditions and N = 1080
samples were obtained with a laser pulse
time separation of 400 s. The
measurement location for the Inlet
Conditions Dataset extended from -3.34 <
X/d < -2.95, and spanned -0.48 < Y/d <
0.48 as shown in Fig. 1.
2.3 Image Calibration
In SPIV, two cameras record distorted
mirror images of the same plane, which
requires that the images be projected onto
a common plane prior to calculating
particle displacements. The SPIV
calibration method employed image
dewarping which mapped pixel locations
to their back-projected locations. The
SPIV images exhibited two types of image
distortion:
1. Projective distortion from
Scheimpflug angle tilt of the CCD
image plane
2. Non-linear distortions from
viewing the measurement plane
through the curved aortic sinus (see
Fig. 1)
During image calibration, a calibration
grid with 1x1 mm uniformly spaced grid
nodes was placed in the test section and
imaged. The resulting image of distorted
grid node locations was dewarped back to
uniform grid node locations.
Two different dewarping algorithms were
tested and their errors compared. Error
analysis between a conventional 2nd
order
polynomial method and an unconventional
local weighted mean (LWM) method is
discussed extensively in [15]. It was
found that the non-linear image distortions
present in the images resulted in
unacceptable errors (maximum 5.5 pixels,
average 0.9 pixels) using the 2nd
order
polynomial transformation. However, the
low dewarping error using the LWM
method was acceptable (maximum 0.8
pixels, average 0.1 pixels) for accurate
SPIV measurements (where 1 pixel = 33
m). This is the first time that a LWM
dewarping method has been used in SPIV
work, and it is likely that SPIV studies
with similar non-linear optical distortions
can be dewarped in a similar way.
2.4 Image Processing
Particle images were processed with an
adaptive cross correlation PIV algorithm
[28], with a first pass 64 x 64 pixel
interrogation area and a second pass 32 x
32 pixel interrogation area. For the Full
Aortic Sinus Dataset and Near-Wall
Dataset, the spatial resolution was X =
0.59 mm and Y = 0.53 mm with a 50%
interrogation area overlap. Equations from
[30] were used to reconstruct the 3C
velocity vectors. For the Inlet Conditions
Dataset the spatial resolution was X = Y
= 0.47 mm with a 50% interrogation area
overlap.

Author Generated Proof Final Version appears in - Medical & Biological Engineering & Computing.
Measurements of Steady Flow through a Bileaflet Mechanical Heart Valve using Stereoscopic PIV DOI: 10.1007/s11517-010-0705-z
6
The final publication is available at www.springerlink.com
3 Results
Total velocities, u, v, w, ensemble
averaged mean velocities U, V, W, and
turbulence velocities u’, v’, w’
corresponded to the X, Y and Z directions
respectively. Reynolds stress components
were averaged and are presented as
<ui’uj’>. All mean velocities have been
normalized by the bulk inlet velocity, U0,
and all Reynolds stress components by
U02. All distances have been normalized
by aortic diameter, d.
3.1 Error Analysis
Errors for the two SPIV datasets were
calculated based on uncertainty estimates
in the experimental setup and on measured
turbulence intensity. The errors in mean
velocity and Reynolds stress are given as
[29]
IAmeaninstTI
mean eN
22
(2)
IARSinstTI
RS eN
)(2 44
(3)
where mean is error in mean velocity, inst
is error in a single sample, and TI is the
turbulence intensity pertaining to each of
the u, v and w velocities. The variable RS
is error in Reynolds stress for each of the
six stress components. This analysis
pertains to homogeneous turbulence,
which was most closely represented in the
lateral orifice jet cores where an average of
TI-u = TI-v = 20% was recorded for u and
v component velocities. For the current
study, additional systematic errors were
attributed to interrogation area overlap,
emean-IA and eRS-IA [15]. Values of emean-IA =
3% and eRS-IA = 6% were found for the in-
plane mean velocities (U and V) and
Reynolds stresses <u’u’>, <v’v’>, <u’v’>
respectively. Values of
emean-IA-W = 5% and eRS-IA-w’ = 10% were
found for the out-of-plane velocity, W, and
Reynolds stresses <w’w’>, <u’w’>,
<v’w’> respectively [15].
Errors with respect to correlation peak
locking and signal-to-noise ratio were
minimized. In addition, image
registration, camera angle, and cross-
correlation algorithm accuracy were
accounted in the error calculation. Errors
in a single sample were determined to be
inst-u = inst-v = 13% for the in-plane
component velocities. In general, single
sample errors inst-w in w were expected to
be at least a factor of 1/tan() = 1.73 larger
than that of u and v [23]. With additional
errors in image registration affecting w, a
value of inst-w = 24% was calculated [15].
Flow unsteadiness and thus symmetry
breaking (see Section 3.2) about the XY
plane contributed to an overestimation of
out-of-plane turbulence intensity. This
was similar to the problem encountered
when making turbulence measurements in
a flapping shear layer. The effect was
further exaggerated due to higher error of
the out-of-plane component and low
magnitude in W, and was most prevalent in
regions external to the lateral orifice jets,
at roughly |Y/d| > 0.40. Thus for Fig. 7,
the plots of Reynolds stresses containing
w’, only data for -0.40 < Y/d < 0.40 were
considered valid. To estimate the error in
quantities containing out-of-plane data, the
out-of-plane turbulence intensity was
assumed equal to that of the in-plane
values, thus a value of TI-w = 20% was
used.
Using these values with sample size N for
the datasets, the overall error estimates are
given in Table 1. Spatial variation of
turbulence intensity meant that error was

Author Generated Proof Final Version appears in - Medical & Biological Engineering & Computing.
Measurements of Steady Flow through a Bileaflet Mechanical Heart Valve using Stereoscopic PIV DOI: 10.1007/s11517-010-0705-z
7
The final publication is available at www.springerlink.com
also dependant on measurement location.
Values in Table 1 are therefore considered
only to be an approximation of the error.
Lastly, relative to the rest of the velocity
field, velocities for X/d > 0.60 had slightly
higher errors due to a small amount of
image blurring from viewing through the
aortic sinus contraction region (see Fig. 1).
This effect was noticeable in out-of-plane
velocity and therefore Fig. 5 and Fig. 7,
span only 0.05 < X/d < 0.60, instead of
0.05 < X/d < 0.80 as shown in figures
giving in-plane velocities.
3.2 Inlet Conditions
The average value of U/U0 across the inlet
cross-section was expected to be
approximately unity, which was confirmed
by calculation of U0 from flow meter
readings. Specifically, an average value of
U/U0 = 1.03 was found for all inlet
condition axial locations. The 3% higher
measured value was within uncertainty
estimates (see Table 1).
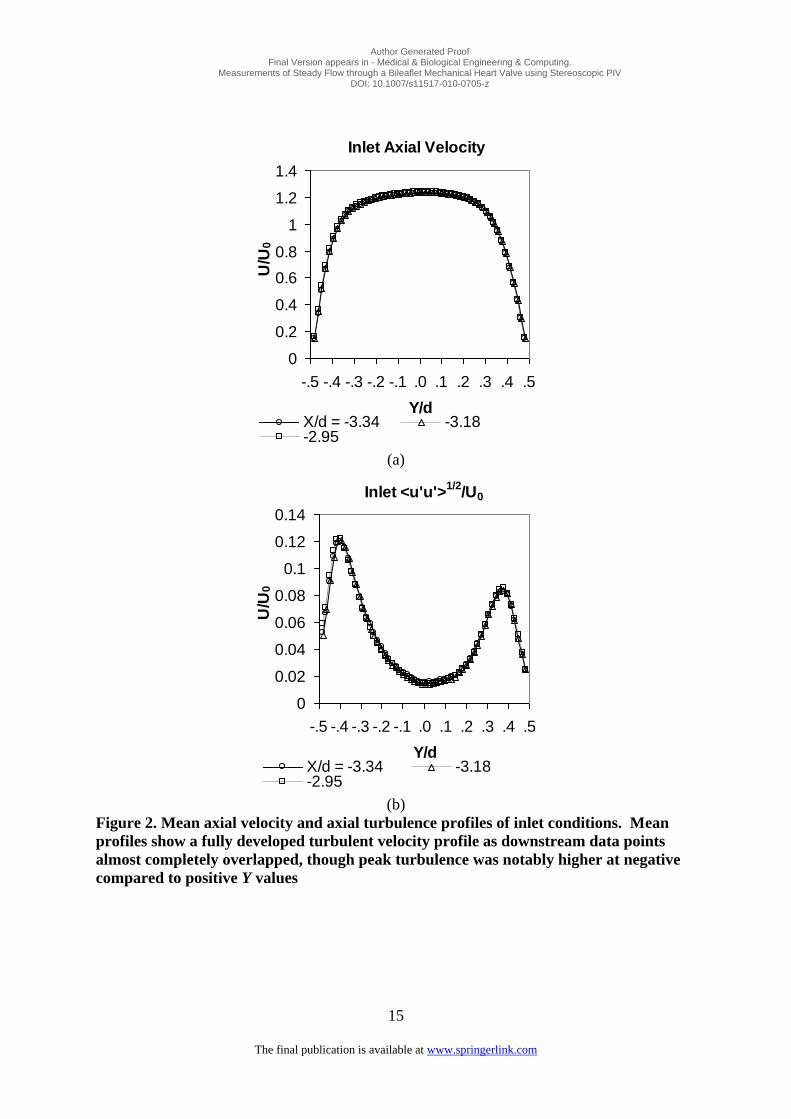
Fig. 2 shows mean axial velocity, U/U0,
and axial rms velocity, <u'u'>1/2
/U0 ,
profiles at three axial locations. In Fig. 2,
a typical turbulent pipe flow profile was
observed, and profiles at all axial locations
almost completely overlapped indicating
that the inlet flow could be considered
fully developed. A small asymmetry in
mean velocity about the pipe centerline (X
axis) can be seen in Fig. 2. Profile
asymmetry was quantified as the percent
difference between velocity vectors at the
same distance from each wall. The
majority of the profile, for -0.34 < Y/d <
0.34, was symmetric with a less than 3%
velocity difference, which was within
measurement accuracy (see Table 1).
However, from 0.34 < |Y/d| < 0.45, the
asymmetry increased from 5% at Y/d =
0.34 to 17% at Y/d = 0.45. Within this
region, velocity on the lower piping side
(Y < 0) was higher than on the upper
piping side (Y > 0). Inlet turbulence had a
peak value of <u'u'>1/2
/U0 on the lower
piping side (Y < 0) 33% higher than that
on the upper side (Y > 0). We hypothesize
that the asymmetry in mean velocity near
the pipe walls was due to uneven particle
coating of the inlet piping walls which
resulted from running a large number of
experiments with the flow loop. The
differing surface roughness on one side of
the piping compared to the other likely
caused the asymmetry in mean velocity
and thus led to the asymmetry in inlet
turbulence.
3.3 SPIV Results
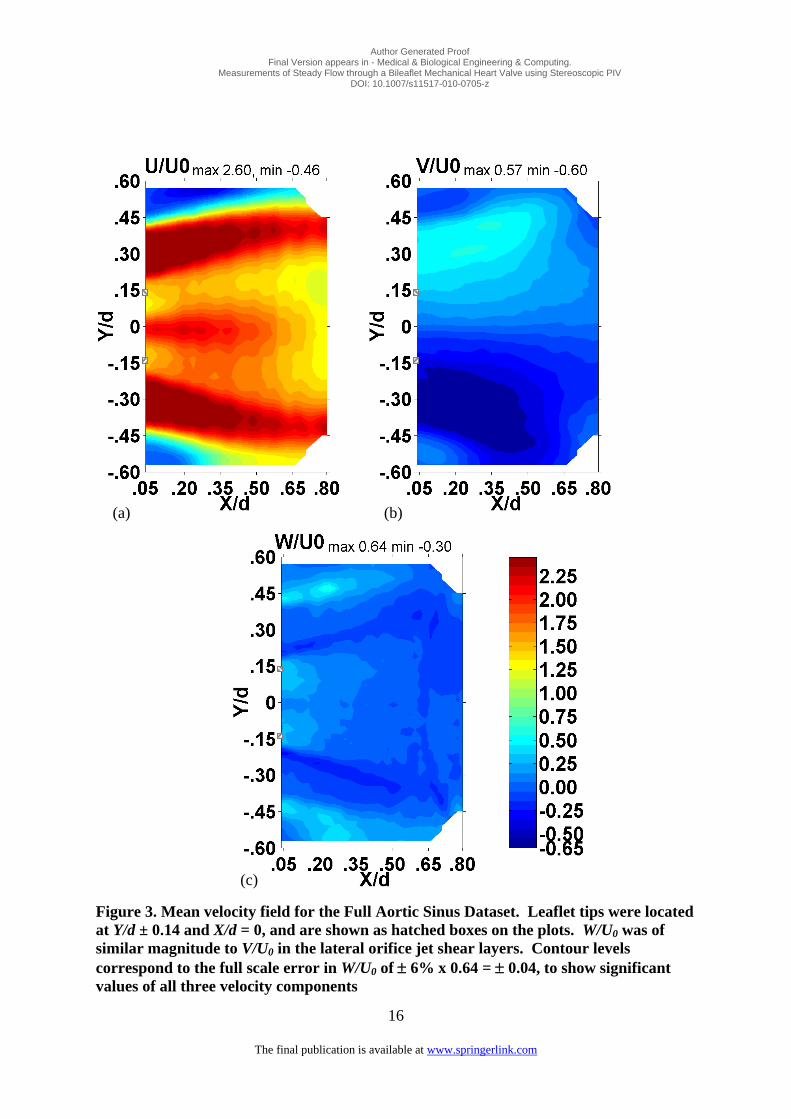
General Flow Characteristics Contour plots of the ensemble-averaged
velocity field of the Full Aortic Sinus
Dataset for U/U0, V/U0, and W/U0 are
shown in Fig. 3a, b, and c respectively. In
all figures, flow is from left to right, and
the leaflet tips are shown as boxes on the
Y-axis at Y/d = ±0.14. Contour levels have
been adjusted to be within uncertainty
estimates.
As expected, axial velocity in the lateral
orifice jets (at roughly 0.20 < |Y/d| < 0.40)
was clearly dominant in the flow. The
highest axial velocities in the flow were
recorded in the lateral orifice jets of
roughly U/U0 = 2.60 for X/d < 0.21. The
central orifice jet (at -0.14 < Y/d < 0.14)
had a peak velocity of roughly U/U0 =
2.20 for X/d < 0.21. In Fig. 3a, regions of
high shear are indicated by high ∂(U/U0)/
∂Y. This was the dominant gradient of the
flow, and peak gradient values occurred
near the upper and lower lateral orifice jet
shear layers around 0.40 < |Y/d| < 0.45.
The lateral orifice jet shear layers were

Author Generated Proof Final Version appears in - Medical & Biological Engineering & Computing.
Measurements of Steady Flow through a Bileaflet Mechanical Heart Valve using Stereoscopic PIV DOI: 10.1007/s11517-010-0705-z
8
The final publication is available at www.springerlink.com
thus sites of intense mixing, which has
also been noted by [19,33] and others.
The plot of V/U0 , in Fig. 3b shows that the
flow was relatively symmetric about the X
axis. The out-of-plane velocity, W/U0,
(shown in Fig. 3c) and transverse velocity,
V/U0, were of similar magnitude indicating
that the out-of-plane component
contributed significantly to the flow,
which has been also observed by
Kaminsky et al. [16].
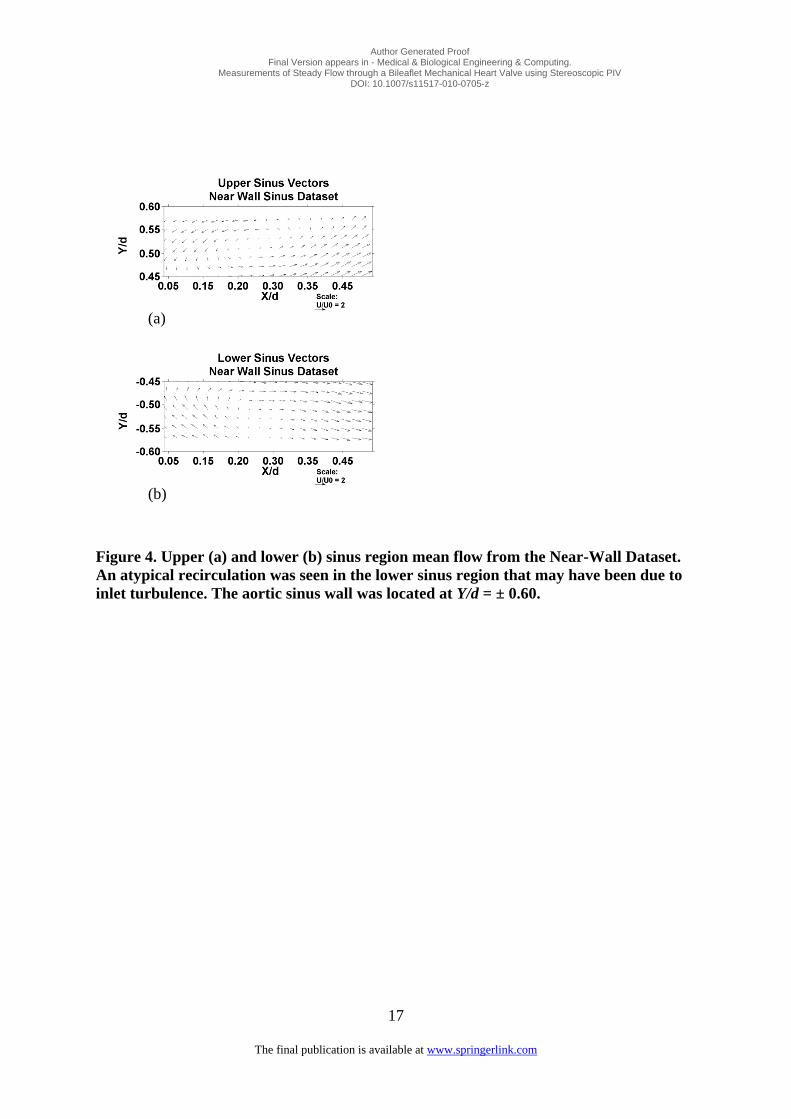
The Near-Wall Dataset had good
resolution of the low velocities observed
near the sinus walls (Fig. 4). In the upper
sinus region (Fig. 4a), typical flow reversal
and well-defined recirculation was
apparent. The type of flow was similar to
that seen in flow over a backward facing
step, as flow separation occurred at the
step edge (in this case, the valve ring at
X/d = -0.16 and Y/d = ±0.38). A similar
flow pattern was seen in the lower sinus
region (Fig. 4b) but the recirculation
bubble differed slightly in both size and
shape compared to that in the upper sinus
region. A relatively small asymmetry in
inlet mean velocity and inlet turbulence
was observed in the current study (see
Section 3.1), and thus likely affected the
upper and lower sinus region flow [19].
Tests were performed with varied valve
position to check for valve geometry
effects. The tests showed no noticeable
change in flow structure; however, a valve
geometrical imperfection such as a small
error in leaflet angle or leaflet trailing edge
profile could not be fully ruled out as a
contributing factor to the small sinus
region asymmetry.
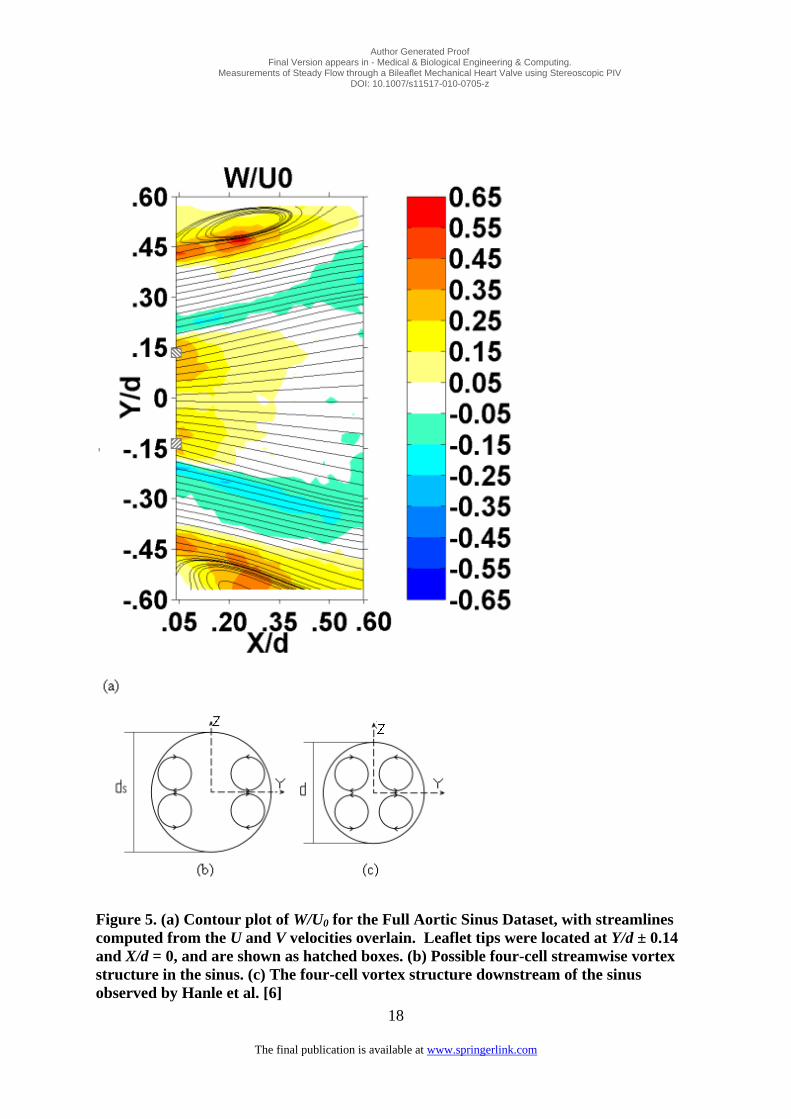
3D Flow Structure Fig. 5a shows a contour plot of W/U0
exhibiting the three dimensional nature of
the flow also noted in other experiments
[1,14,16]. Contour levels correspond to
error estimates and thus Fig. 5a shows
significant out-of-plane motion.
Discussion of possible 3D structures in the
flow is found in Section 4.
In a low Reynolds number CFD
simulation, Ge et al. [10] found symmetry
breaking about the XY plane at Re = 750.
It is therefore likely that there was some
degree of asymmetry about the XY plane in
the current study (where Re = 7600).
Given that the measurement plane was
aligned with the XY plane, even a slight
flow asymmetry about this plane would
cause a net flow through the measurement
plane. Fig. 5a shows that a net through-
plane flow was present as larger regions of
positive W/U0 velocity can be seen relative
to regions of negative W/U0.
Reynolds Stresses Due to the idealized conditions used in the
present study, applicability to in-vivo
blood element damage based on Reynolds
stress results is limited. Furthermore,
Reynolds stresses have been shown to be
only one factor in many, including eddy
decay time and viscous stresses, that affect
element damage [7,12]. The Reynolds
stress profiles are however useful
references in CFD validation and aid in the
study of BiMHV jet structure and shear
layer mixing.
Fig. 6 shows the average Reynolds
stresses, <u’u’>/U02, <v’v’>/U0
2,
<u’v’>/U02, and Fig. 7 shows average
Reynolds stresses, <w’w’>/U02,
<u’w’>/U02, <v’w’>/U0
2. For the first
time, average Reynolds stress fields are
shown for all six components. In the
figures, apparent discontinuities between
neighboring contour levels were due only
to contour level choice, based on error
estimates. Because of the relatively high
error estimates of average Reynolds stress
(see Table 1), this discussion focuses on
qualitative interpretation.
Relatively low Reynolds stress was seen in
the lateral orifice jets (at roughly 0.20 <

Author Generated Proof Final Version appears in - Medical & Biological Engineering & Computing.
Measurements of Steady Flow through a Bileaflet Mechanical Heart Valve using Stereoscopic PIV DOI: 10.1007/s11517-010-0705-z
9
The final publication is available at www.springerlink.com
|Y/d| < 0.40), in contrast to the higher
magnitudes in the central jet (roughly
-0.14 < Y/d < 0.14). In the central jet,
regions of elevated Reynolds normal stress
(Fig. 6a and b, and less pronounced in Fig
7c) are shown on either side of the
X- axis. These off-axis peaks are
commonly observed in free jets [25],
which demonstrate a somewhat surprising
similarity between the central jet and a free
jet given the presence of leaflets and the
effect of confinement. Central jet self-
similarity and a decay rate similar to a free
rectangular jet have also been observed
[18] and is discussed further in [15].
Fig. 7 shows plots of the Reynolds stresses
containing the out-of-plane turbulence
velocity, (<u'w'>/U02, <v’w’>/U0
2 and
<w'w'>/U02
), and illustrates high
Reynolds stresses in the central jet region
as well. Also, off-axis peaks in Reynolds
shear stress were seen in the leaflet wakes
(roughly Y/d = 0.10) which are most
apparent in the plots of <u’v’>/U02 and
<v'w'>/U02. This type of behavior has
also been observed previously in confined
multiple jets where similar wakes were
present [8].
In regions of high mean shear such as the
lateral orifice jet shear layers, increased
Reynolds stresses were expected [25], and
indeed high values of <u'u'>/U02,
<v'v'>/U02, and <u’v’>/U0
2 are seen in
Fig. 6 for |Y/d| > 0.4. Because of error
considerations (see Section 3.1), the
regions exterior to the lateral orifice jet
shear layers (|Y/d| > 0.4) are not shown for
plots of <w'w'>/U02, <u’w’>/U0
2 and
<v'w'>/U02
in Fig. 7, though a similar
behavior was expected.
4 Discussion
In previous BiMHV studies, three
dimensionality of the flow has been
observed. Kaminsky et al. [16] found
significant out-of-plane motion in the sinus
regions and leaflet wakes during systole
acceleration. Similarly, the two lobed
regions of elevated W/U0 (see dashed box
region in Fig. 5a) resulted from leaflet
wake disturbance. In addition, 3D
structures have been identified in BiMHV
flow with steady inflow conditions by
Hanle et al. [14]. They found evidence of
four large streamwise vortices in the
proximal aorta (just downstream of the
aortic sinus), two above and two below the
XY plane, as shown in Fig. 5c. In the
current study, the finite measurement
plane thickness and likelihood of
symmetry breaking about the XY plane
enabled the visualization of similar
structures. Examination of the contour
plot in Fig. 5a shows evidence of counter-
rotating streamwise (i.e. x) vortices that
extended longitudinally along the aortic
sinus. Positive W/U0 velocity occurred
near the sinus walls at Y/d = 0.60 which
appeared to correspond to the regions of
negative W/U0 velocity closer to the aortic
centerline. Although data from
measurement planes above and below the
XY plane are needed for confirmation, it
was possible that the vortices comprised a
four-cell streamwise vortex structure in the
aortic sinus as shown in Fig. 5b.
It is unclear if similar 3D structures are
formed in-vivo, where pulsatile inlet flow
and three sinuses of Valsalva are present.
Therefore we feel it is not appropriate to
comment on the clinical relevance of the
four-cell streamwise vortex pattern until
further, more physiological data is
collected.
In regards to the plots of Reynolds stress
in Fig. 6 and 7, the data suggests that
downstream of the valve, the central jet,
lateral orifice jet shear layers, and leaflet
wakes were the most turbulent regions in

Author Generated Proof Final Version appears in - Medical & Biological Engineering & Computing.
Measurements of Steady Flow through a Bileaflet Mechanical Heart Valve using Stereoscopic PIV DOI: 10.1007/s11517-010-0705-z
10
The final publication is available at www.springerlink.com
the flow, which is in agreement with
[1,21,32 and others]. In the current study,
obtaining turbulence data for the out-of-
plane velocity using SPIV enabled spatial
visualization of all six Reynolds stress
components, information that had
previously been unavailable.
BiMHV flow was seen to be sensitive to
inlet conditions, as a relatively small
asymmetry in inlet mean velocity and inlet
turbulence likely caused differing flow
patterns in the sinus regions. This
emphasizes the need for well defined inlet
conditions in BiMHV studies, especially
when CFD validation is required.
The above illustrates the highly complex
nature of BiMHV flow as it combines the
unsteady flow of three confined jets,
leaflet wakes, and sinus recirculation
regions. Because of the idealized aortic
geometry, fixed valve leaflets, absence of
hinge insets, and steady flow regime used
in the current study, one should not make
direct comparison to in-vivo
hemodynamics from the current
discussion. The data does, however,
provide a basis for future experimental
studies using SPIV. Using high-speed
SPIV with large data storage capability,
one could collect enough samples for
mean flow and Reynolds stress mapping
throughout the full cardiac cycle [5,16].
Due to the 3D nature of BiMHV flow it is
recommended that future experimental
studies use SPIV. In addition, the 3D data
currently available from advanced CFD
simulations reinforces the need for
validation datasets with three velocity
components. The Full Aortic Sinus
Dataset is posted
(https://tspace.library.utoronto.ca/) and is
well-suited for initial steady inflow
validation as it has well defined inlet
conditions and a relatively low error in
mean velocity. The dataset can be used as
a starting point for CFD validation with a
steady flowrate prior to pulsatile flow
simulation. It consists of 1982 velocity
vectors in 1105 realizations. Instantaneous
and mean velocities, and average Reynolds
stress values are given.
Acknowledgement
This work was supported by NSERC (C.R.E.,
P.S.). C.H. was supported by NSERC PGS-M
funding. In addition, the Canada Research Chairs
Program (C.R.E.) is gratefully acknowledged.
Author Generated Proof Final Version appears in - Medical & Biological Engineering & Computing.
Measurements of Steady Flow through a Bileaflet Mechanical Heart Valve using Stereoscopic PIV DOI: 10.1007/s11517-010-0705-z
11
The final publication is available at www.springerlink.com
References 1) Balducci, A., Grigioni, M., Querzoli, G.,
Romano, G. P., Daniele, C., D'Avenio, G.,
et al., 2004, “Investigation of the Flow
Field Downstream of an Artificial Heart
Valve by Means of PIV and PTV”.
Experiments in Fluids, 36(1), pp. 204-213.
2) Bell, J. H., & Mehta, R. D., 1988,
“Contraction Design for Small Low-Speed
Wind Tunnels. Technical Report No.
177488, NASA.
3) Borazjani, I., Ge L., Sotiropoulos F., 2010,
“High-Resolution Fluid Structure
Interaction Simulations of Flow Through a
Bileaflet Mechanical Heart Valve in an
Anatomic Aorta”. Annals of Biomedical
Engineering, 38(2), pp. 326-344.
4) Brucker, C., 1997, “Dual-camera DPIV
for Flow Studies Past Artificial Heart
Valves”. Experiments in Fluids, 22(6), pp.
496-506.
5) Dasi, L. P., Ge, L., Simon, H. A.,
Sotiropoulos, F., & Yoganathan, P. A.,
2007, “Vorticity Dynamics of a Bileaflet
Mechanical Heart Valve in an
Axisymmetric Aorta”. Physics of Fluids,
19(6).
6) De Tullio, M. D., Cristallo, A., Balaras,
E., Verzicco, R., 2009, “Direct Numerical
Simulation of the Pulsatile Flow Through
an Aortic Bileaflet Mechanical Heart
Valve”. Journal of Fluid Mechanics, 622,
pp. 259-290.
7) Dooley, P., Quinlan, N., 2009, “Effect of
Eddy Length on Mechanical Loading of
Blood Cells in Turbulent Flow”. Annals
of Biomedical Engineering, 37(12), pp.
2449-2458.
8) Fabris, G., & Fejer, A. A., 1974,
“Confined Mixing of Multiple Jets”.
Transactions of the ASME, 96, Series 2(2).
9) Fontaine, A. A., Ellis, J. T., Healy, T. M.,
Hopmeyer, J., & Yoganathan, A. P., 1996,
“Identification of Peak Stresses in Cardiac
Prostheses: A Comparison of Two-
dimensional Versus Three-dimensional
Principal Stress Analyses”. ASAIO
Journal, 42(3), pp. 154-163.
10) Ge, L., Jones, S. C., Sotiropoulos, F.,
Healy, T. M., & Yoganathan, A. P., 2003,
“Numerical Simulation of Flow in
Mechanical Heart Valves: Grid Resolution
and the Assumption of Flow Symmetry.
Journal of Biomechanical Engineering,
125(5), pp. 709-718.
11) Ge, L., Leo, H., Sotiropoulos, F., &
Yoganathan, A. P., 2005, “Flow in a
Mechanical Bileaflet Heart Valve at
Laminar and Near-Peak Systole Flow
Rates: CFD Simulations and
Experiments”. Journal of Biomechanical
Engineering, 127(5), pp. 782-797.
12) Ge, L., Dasi, L. P., Sotiropoulos, F., &
Yoganathan, A. P., 2008,
“Characterization of Hemodynamic
Forces Induced by Mechanical Heart
Valves: Reynolds vs. Viscous Stresses”.
Annals of Biomedical Engineering, 36(2),
pp. 276-297.
13) Guivier-Curien C., Deplano V., Bertrand
E., “Validation of a Numerical 3D Fluid-
Structure Interaction model for a
Prosthetic Valve Based on Experimental
PIV Measurements”. Medical
Engineering and Physics, 31, pp. 986-993.
14) \Hanle, D. D., Harrison, E. C.,
Yoganathan, A. P., & Corcoran, W. H.,
1988, “In Vitro Fluid Dynamics of the St.
Jude Valve Prosthesis in Steady and
Pulsatile Flow”. Engineering in Medicine,
17(4), pp. 181-187.
15) Hutchison, C., 2009, “Stereoscopic PIV in
Steady Flow Through a Bileaflet
Mechanical Heart Valve”. M.A.Sc thesis,
University of Toronto.
16) Kaminsky, R., Kallweit, S., Weber, H. -.,
Claessens, T., Jozwik, K., & Verdonck, P.,
2007, “Flow Visualization Through Two
Types of Aortic Prosthetic Heart Valves
Using Stereoscopic High-speed Particle
Image Velocimetry”. Artificial Organs,
31(12), pp. 869-879.
17) Kaminsky, R., Kallweit, S., Rossi, M.,
Morbiducci, U., Scalise, L., Verdonck, P.,
et al., 2008, “PIV measurements of flows
in artificial heart valves”. Particle Image
Velocimetry: New Developments and
Recent Applications, Schroeder, A., &
Willert, C., eds., Springer-Verlag, Berlin.
18) Krothapalli, A., Baganoff, D., &
Karamcheti, K., 1981, “On the Mixing of
a Rectangular Jet”. Journal of Fluid
Mechanics, 107, pp. 201-220.
19) Le, H., Moin, P., & Kim, J., 1997, “Direct
Numerical Simulation of Turbulent Flow
Over a Backward-facing Step. Journal of
Fluid Mechanics”, 330, pp. 349-374.
20) Li, C., Lo, C., Lu, P., 2010, “Estimation of
Viscous Dissipative Stresses Induced by a
Mechanical Heart Valve Using PIV Data”.
Annals of Biomedical Engineering, 38(3),
pp. 903-916.
21) Liu, J. S., Lu, P. C. 1., & Chu, S. H., 2000,
“Turbulence Characteristics Downstream

Author Generated Proof Final Version appears in - Medical & Biological Engineering & Computing.
Measurements of Steady Flow through a Bileaflet Mechanical Heart Valve using Stereoscopic PIV DOI: 10.1007/s11517-010-0705-z
12
The final publication is available at www.springerlink.com
of Bileaflet Aortic Valve Prostheses”.
Journal of Biomechanical Engineering,
122(2), pp. 118-24.
22) Marassi, M., Castellini, P., Pinotti, M., &
Scalise, L., 2004. “Cardiac Valve
Prosthesis Flow Performances Measured
by 2D and 3D-Stereo Particle Image
Velocimetry”. Experiments in Fluids,
36(1), pp. 176-186.
23) [23] Prasad, A. K., 2000,
“Stereoscopic Particle Image
Velocimetry”. Experiments in Fluids,
29(2), pp. 103-116.
24) Sotiropoulos, F., Borazjani, I., 2009, “A
Review of State-of-the-Art Numerical
Methods for Simulating Flow Through
Mechanical Heart Valves”. Medical and
Biological Engineering and Computing,
47, pp. 245-256.
25) Tennekes, H. & Lumley, J. L., 1972, A
First Course in Turbulence. MIT Press,
Cambridge, Mass.
26) Shahbazi, K., 2007, “A Parallel High-
order Discontinuous Galerkin Solver for
the Unsteady Incompressible Navier-
Stokes Equations in Complex
Geometries”. PhD thesis, University of
Toronto.
27) Ullum, U., Schmidt, J. J., Larsen, P. S., &
McCluskey, D. R., 1998, “Statistical
Analysis and Accuracy of PIV Data.
Journal of Visualization, 1(2), pp. 205-
216.
28) Usera, G., 1999, “Adaptive Algorithms for
PIV Image Analyzing”. Technical report,
Institute of Fluid Mechanics and
Environmental Engineering (IMFIA),
University of the Republic, Montevideo,
Uruguay.
29) Wernet, M. P., Subramanian, A., Mu, H.,
& Kadambi, J. R., 2000, “Comparison of
Particle Image Velocimetry and Laser
Doppler Anemometry Measurements in
Turbulent Fluid Flow”. Annals of
Biomedical Engineering, 28(11), pp.
1393-1394.
30) Willert, C., 1997, “Stereoscopic Digital
Particle Image Velocimetry for
Application in Wind Tunnel Flows”.
Measurement Science and Technology,
8(12), pp. 1465-1479.
31) Yoganathan, A. P., Chaux, A., & Gray, R.
J., 1984, “Bileaflet, Tilting Disc and
Porcine Aortic Valve Substitutes: In Vitro
Hydrodynamic Characteristics”. Journal of
the American College of Cardiology, 3(2
I), pp. 313-320.
32) Yoganathan, A. P., Yi-Ren Woo, &
Hsing-Wen Sung, 1986, “Turbulent Shear
Stress Measurements in the Vicinity of
Aortic Heart Valve Prostheses”. Journal of
Biomechanics, 19(6), pp. 433-442.
Author Generated Proof Final Version appears in - Medical & Biological Engineering & Computing.
Measurements of Steady Flow through a Bileaflet Mechanical Heart Valve using Stereoscopic PIV DOI: 10.1007/s11517-010-0705-z
13
The final publication is available at www.springerlink.com
Error in:
Dataset Name N U, V W <u’u’>
<v’v’>
<u’v’>
<w’w’>
<u’w’>
<v’w’>
Inlet Condtions 1080 ±3% N/A ±14% N/A
Full Aortic Sinus 1105 ±4% ±6% ±24% ±40%
Near-Wall Sinus 718 ±4% ±7% ±29% ±47%
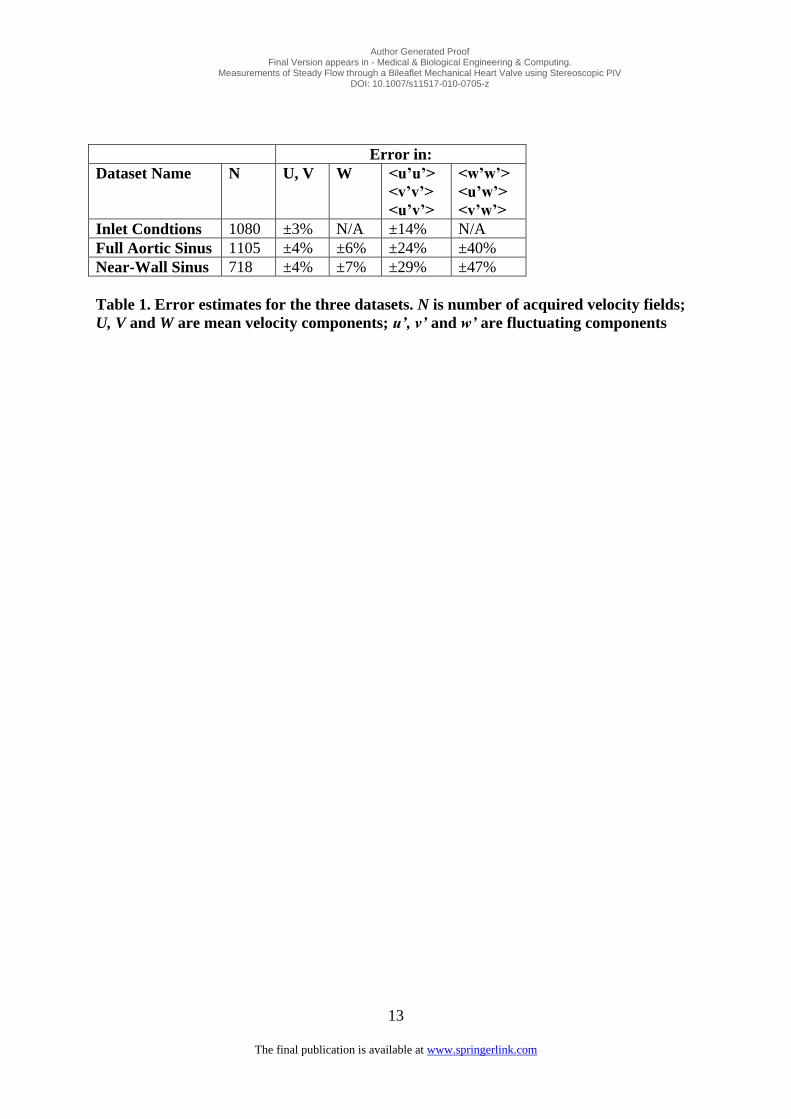
Table 1. Error estimates for the three datasets. N is number of acquired velocity fields;
U, V and W are mean velocity components; u’, v’ and w’ are fluctuating components

Author Generated Proof Final Version appears in - Medical & Biological Engineering & Computing.
Measurements of Steady Flow through a Bileaflet Mechanical Heart Valve using Stereoscopic PIV DOI: 10.1007/s11517-010-0705-z
14
The final publication is available at www.springerlink.com
(a)
(b)
(c)
Figure 1. (a) Plan view of axisymmetric aortic sinus geometry (not to scale). Dashed
lines show the measurement locations of the 2C-PIV Inlet Conditions Dataset (- . -),
SPIV Full Aortic Sinus Dataset (- - -) and SPIV Near Wall Dataset (. . .). (b) Side view of
test section (not to scale) showing bulk inlet flow velocity U0 and laser sheet positioning.
(c) In-house SPIV setup. The PC was used to relay signals from the cameras to the
delay generator which was used to trigger the laser pulses
camera 0
camera 1
test section
laser head
laser sheet
function generator sync. box
laser power supply
delay generator
PC
Author Generated Proof Final Version appears in - Medical & Biological Engineering & Computing.
Measurements of Steady Flow through a Bileaflet Mechanical Heart Valve using Stereoscopic PIV DOI: 10.1007/s11517-010-0705-z
15
The final publication is available at www.springerlink.com
Inlet Axial Velocity
0
0.2
0.4
0.6
0.8
1
1.2
1.4
-.5 -.4 -.3 -.2 -.1 .0 .1 .2 .3 .4 .5
Y/d
U/U
0
X/d = -3.34 -3.18-2.95
(a)
Inlet <u'u'>1/2
/U0
0
0.02
0.04
0.06
0.08
0.1
0.12
0.14
-.5 -.4 -.3 -.2 -.1 .0 .1 .2 .3 .4 .5
Y/d
U/U
0
X/d = -3.34 -3.18-2.95
(b)
Figure 2. Mean axial velocity and axial turbulence profiles of inlet conditions. Mean
profiles show a fully developed turbulent velocity profile as downstream data points
almost completely overlapped, though peak turbulence was notably higher at negative
compared to positive Y values
Author Generated Proof Final Version appears in - Medical & Biological Engineering & Computing.
Measurements of Steady Flow through a Bileaflet Mechanical Heart Valve using Stereoscopic PIV DOI: 10.1007/s11517-010-0705-z
16
The final publication is available at www.springerlink.com
Figure 3. Mean velocity field for the Full Aortic Sinus Dataset. Leaflet tips were located
at Y/d ± 0.14 and X/d = 0, and are shown as hatched boxes on the plots. W/U0 was of
similar magnitude to V/U0 in the lateral orifice jet shear layers. Contour levels
correspond to the full scale error in W/U0 of 6% x 0.64 = 0.04, to show significant
values of all three velocity components
(a) (b)
(c)
Author Generated Proof Final Version appears in - Medical & Biological Engineering & Computing.
Measurements of Steady Flow through a Bileaflet Mechanical Heart Valve using Stereoscopic PIV DOI: 10.1007/s11517-010-0705-z
17
The final publication is available at www.springerlink.com
Figure 4. Upper (a) and lower (b) sinus region mean flow from the Near-Wall Dataset.
An atypical recirculation was seen in the lower sinus region that may have been due to
inlet turbulence. The aortic sinus wall was located at Y/d = ± 0.60.
(a)
(b)
Author Generated Proof Final Version appears in - Medical & Biological Engineering & Computing.
Measurements of Steady Flow through a Bileaflet Mechanical Heart Valve using Stereoscopic PIV DOI: 10.1007/s11517-010-0705-z
18
The final publication is available at www.springerlink.com
Figure 5. (a) Contour plot of W/U0 for the Full Aortic Sinus Dataset, with streamlines
computed from the U and V velocities overlain. Leaflet tips were located at Y/d ± 0.14
and X/d = 0, and are shown as hatched boxes. (b) Possible four-cell streamwise vortex
structure in the sinus. (c) The four-cell vortex structure downstream of the sinus
observed by Hanle et al. [6]

Author Generated Proof Final Version appears in - Medical & Biological Engineering & Computing.
Measurements of Steady Flow through a Bileaflet Mechanical Heart Valve using Stereoscopic PIV DOI: 10.1007/s11517-010-0705-z
19
The final publication is available at www.springerlink.com
Figure 6. Contour plots of Reynolds stresses (a) <u'u'>/U0
2, (b) <v'v'>/U0
2, and
<u’v’>/U02. Leaflet tips were located at Y/d ± 0.14 and X/d = 0, and are shown as
hatched boxes on the plots
(a)
(c)
(b)

Author Generated Proof Final Version appears in - Medical & Biological Engineering & Computing.
Measurements of Steady Flow through a Bileaflet Mechanical Heart Valve using Stereoscopic PIV DOI: 10.1007/s11517-010-0705-z
20
The final publication is available at www.springerlink.com
Figure 7. Contour plots of Reynolds stresses containing the out-of-plane turbulent
velocity, w’, (a) <u'w'>/U02, (b) <v'w'>/U0
2, and (c) <w’w’>/U0
2. Leaflet tips were located
at Y/d ± 0.14 and X/d = 0, and are shown as hatched boxes on the plots
(a) (b)
(c)