measurements of aerosol chemistry during new particle formation
TRANSCRIPT

rXXXX American Chemical Society A dx.doi.org/10.1021/es103692f | Environ. Sci. Technol. XXXX, XXX, 000–000
ARTICLE
pubs.acs.org/est
Measurements of Aerosol Chemistry during New Particle FormationEvents at a Remote Rural Mountain SiteJessie M. Creamean,† Andrew P. Ault,†,^ John E. Ten Hoeve,‡Mark Z. Jacobson,‡Gregory C. Roberts,§,|| andKimberly A. Prather†,§,*†Department of Chemistry and Biochemistry, University of California, San Diego, La Jolla, California 92093-0314, United States‡Department of Civil & Environmental Engineering, Stanford University, Stanford, California 94305, United States§Scripps Institution of Oceanography, University of California, San Diego, La Jolla, California 92093, United States
)Centre National de Recherches M�et�eorologiques�Groupe d'�etude de l0Atmosph�ere M�et�eorologique (GAME), Toulouse, France
bS Supporting Information
1. INTRODUCTION
Aerosols are ubiquitous in the troposphere and profoundlyimpact climate.1 They scatter and absorb incoming short waveand outgoing long wave radiation, and act as cloud condensationnuclei (CCN) affecting cloud radiative and physical properties.Under supersaturated conditions, CCN compete for availablewater vapor, creating large populations of small-sized clouddroplets increasing the reflectivity of clouds.2,3 Smaller, morenumerous cloud droplets often cannot grow to large enough sizesto precipitate.2
The impact of aerosols on clouds, referred to as the indirecteffect, represents arguably the largest single source of uncertaintyout of all contributors to global radiative forcing estimates,1 andtherefore a better understanding of the sources of the aerosolsthat determine the magnitude of this effect is needed. In situformation of ultrafine particles (e100 nm) through gas-to-particle conversion of low volatility vapors represents a signifi-cant source of tropospheric aerosols, especially in remoteenvironments. The initial critical clusters must grow into largersizes to activate as CCN, and thus become relevant for cloudformation.4 Determining the magnitude and mechanistic driversof the nucleation and growth processes of newly formed particles
that ultimately become effective CCN will improve regional andglobal climate models.5
New particle formation (NPF) involves two important steps.6
The first step involves homogeneous or ion-induced nucleationof neutral or ion clusters and the second step involves the growthof these clusters into larger particles.7�9 In most cases, pristineambient conditions with lower relative humidity representfavorable conditions for particle nucleation,10 whereas higherrelative humidities11 and lower temperatures9 provide favorableconditions for the subsequent growth of newly formed particles,depending on the species involved. Formation of new particles isaffected by the production of condensable vapor precursors, suchas H2SO4, formed from oxidation of SO2.
12 Originally, it washypothesized that the initial step involved cluster formation byH2SO4 and water vapor and that H2SO4 was also responsible forthe subsequent growth of the clusters, however, the involvementof H2SO4 alone cannot explain the formation and growth rates of
Received: November 1, 2010Accepted: August 2, 2011Revised: June 21, 2011
ABSTRACT: Determining the major sources of particles that act as cloud condensationnuclei (CCN) represents a critical step in the development of a more fundamental under-standing of aerosol impacts on cloud formation and climate. Reported herein are directmeasurements of the CCN activity of newly formed ambient particles, measured at a remoterural site in the Sierra Nevada Mountains of Northern California. Nucleation events in thewinter of 2009 occurred during two pristine periods following precipitation, with higher gas-phase SO2 concentrations during the second period, when faster particle growth occurred(7�8 nm/h). Amines, as opposed to ammonia, and sulfate were detected in the particle phasethroughout new particle formation (NPF) events, increasing in number as the particles grewto larger sizes. Interestingly, long-range transport of SO2 from Asia appeared to potentiallyplay a role in NPF during faster particle growth. Understanding the propensity of newlyformed particles to act as CCN is critical for predicting the effects of NPF on orographic cloudformation during winter storms along the Sierra Nevada Mountain range. The potentialimpact of newly formed particles in remote regions needs to be compared with that oftransported urban aerosols when evaluating the impact of aerosols on clouds and climate.

B dx.doi.org/10.1021/es103692f |Environ. Sci. Technol. XXXX, XXX, 000–000
Environmental Science & Technology ARTICLE
observed particle formation.13 Therefore, other species in addi-tion to H2SO4 must contribute to the growth of new particles viacondensation and/or heterogeneous reactions.14 Species thathave sufficiently low volatility so as to be involved with nuclea-tion are also capable of participating in the subsequent growth,and as particle size increases, so too do the number of possiblecondensable species and mechanisms. More is known about thespecies that contribute to particle growth, such as NH3
15 or asshown more recently semivolatile organic species5,11 than aboutthe species involved with the nucleation process. More specifi-cally, formation of aminium salts has been modeled16 and thesespecies have been detected in newly formed particles.17,18
Amines form salts with organic and inorganic acids duringparticle growth,14,19 supporting the hypothesis that amines/nitrogen-containing organics and H2SO4 play a role in thegrowth of new particles.
Because of instrumental challenges involved in measuring thechemistry of 1�3 nm particles, the molecular identities of thespecies involved have eluded scientists formany years. As a result,chemical composition is typically inferred for newly formedparticles by utilizing multiple measurements. M€akel€a et al.(2001) detected dimethylammonium ((CH3)2NH4
+) using2-stage cascade impactors and ion chromatography duringNPF events.17 Although they were able to identify species downto 5 nm, the time resolution was low and aminium sulfate((HNR3)2SO4) was inferred from the correlation of bulk particlemeasurements of (CH3)NH2
+ and sulfate. Smith et al. (2004)measured nitrogen-containing organics and sulfate using aThermal Desorption Chemical Ionization Mass Spectrometer(TDCIMS). They detected particles from 10 to 30 nm with5�10 min time resolution and found that nitrogen-containingorganics played a significant role in the growth of nanoparticles.20
Chemical measurements at these small sizes represent a signifi-cant advancement in the characterization of newly formedparticles. However, the TDCIMS cannot measure amines andsulfate simultaneously in the same particle and therefore ques-tions remain about the associations between amines and sulfateat the single particle level during NPF events.
The challenge with using bulk measurements to determine theprimary species involved in particle formation is that themeasured mass concentrations represent the average chemicalcomposition of many particles. For instance, when amines andsulfate are detected in particles collected on filters, the detectedspecies can actually occur in separate particles. Single-particlemixing state measurements show whether two species are pres-ent within a single particle, a level of detail that is critical forunderstanding the key species involved in particle formation andgrowth processes. In the current work, aerosol time-of-flightmass spectrometry (ATOFMS) was used to provide dual polar-ity, single-particle analysis during NPF events in real-time at aremote rural region in the Sierra Nevada Mountains in NorthernCalifornia. We report the first observations of nitrogen-contain-ing organic species and sulfate within the same particles aftersignificant particle growth during NPF events. Understandingthe sources of the species involved in new particle formation iscritical as this could be an important local source of CCN in theSierra Nevada. Previous studies have suggested that CCN weretransported directly from California’s Central Valley (CV),21
however, in situ NPF between amines from the CV andlong-range transported SO2 from Asia could also contribute asa CCN source in the Sierra Nevada as described herein.
2. EXPERIMENTAL SECTION
Ground-based aerosol measurements were made during theCalWater Early Start field campaign during the late winter at theSugar Pine Reservoir in Foresthill, CA, a remote rural site in theSierra Nevada Mountains (39� 070 42.8000 N, 120� 480 04.9000 W;elevation ∼1064 m ASL). Particle size distributions were mea-sured between 11 and 604 nm using a scanning mobility particlesizer (SMPS) (Model 3936 L, TSI Inc.). Meteorological mea-surements including temperature, relative humidity, wind direc-tion, solar radiation, and precipitation were acquired fromcolocated instruments operated by the National Oceanic andAtmospheric Administration (NOAA). Gas-phase O3 and SO2
concentrations were measured using an O3 analyzer (Model49C, Thermo Environmental Instruments, Inc.) and a SO2
analyzer (43C, Thermo Environmental Instruments, Inc.), re-spectively. Due to calibration problems with the SO2 analyzer,SO2 is presented as relative concentrations. Black carbon massconcentrations were measured using a seven wavelength aethalo-meter (Model AE31, Magee Scientific). CCN concentrationswere measured at 0.3% supersaturation using a compact stream-wise thermal-gradient diffusion chamber.22 Only periods withreliable CCN data are presented. A condensation particlecounter (CPC) (Model 3010, TSI Inc.) was used to determinecondensation nuclei (CN) concentrations, which were com-pared to the number concentration of CCN0.3 to determinethe activated fractions.
An ultrafine (UF)-ATOFMS, a modified version of thestandard ATOFMS,23 was utilized for individual aerosol aero-dynamic sizing and chemical composition. The UF system isdescribed in detail in Su et al. (2004).24 The UF-ATOFMSmeasures the vacuum aerodynamic size (100e Dvae 1000 nm)and chemical composition of particles by laser desorption/ionization which allows us to obtain dual polarity massspectra.23,24 Dva is related to the electric mobility diameter(Dme) measured by the SMPS through effective density and isdiscussed in detail elsewhere.25 During the study, 1 146 366particles were chemically analyzed from 2/21/09 to 3/10/09(PST). Single-particle mass spectra were imported into YAA-DA (www.yaada.org), a software toolkit in Matlab (The Math-works, Inc.), for detailed analysis of particle size and chemistry.ART-2a, an adaptive resonance theory-based clustering algo-rithm,26 was then used to group single-particle mass spectrawith a vigilance factor of 0.80. ART-2a classifies particles intoseparate clusters depending on the presence and intensity of ionpeaks in the respective mass spectra. The most populated 70clusters account for > 90% of the total ART-2a classifiedparticles. Peak identifications in this work correspond to themost probable ions for a given m/z ratio based on previous laband field studies.
3. RESULTS AND DISCUSSION
3.1. Ambient Conditions for NPF. Figure 1a shows SMPS,temperature, and relative humidity (RH) data obtained duringthe study. One polluted period impacted by transport from theCV occurred from 2/21�2/23. NPF events occurred duringcleaner periods following precipitation between the dates of2/24�2/28 (denoted as P1) and 3/6�3/8 (denoted as P2) asshown by high number concentrations in white. Particularly,NPF events had high number concentrations starting at smallsizes (∼11�15 nm) followed by subsequent growth to larger

C dx.doi.org/10.1021/es103692f |Environ. Sci. Technol. XXXX, XXX, 000–000
Environmental Science & Technology ARTICLE
sizes (∼70�100 nm). All NPF events started in the late after-noon between∼14:00�16:00 during low RH, high temperature,and increased solar radiation, followed by particle growth as RHincreased and temperature and solar radiation decreased. M€akel€aet al. (2001) previously observed NPF events during the after-noons in boreal forest locations.17 Particle nucleation occurswhen there is a reduction in total particle surface area, whichoften occurs immediately following precipitation events.27 Pre-cipitation removes the atmospheric “seed” particles that lowvolatility gases would normally condense upon. When elevatedgas-phase concentrations are produced by increased solar radia-tion after precipitation, these species undergo oxidation pro-cesses and then homogeneously nucleate to form new particles.This series of events is shown in Figure 1a,b, when both NPFperiods occurred after periods of precipitation. Clean conditionsat the start of the NPF periods are typified by overall low massconcentrations (<185 ng/m3) of black carbon (BC). BC or soot,formed from combustion sources, serves as an excellent tracer forthe presence anthropogenic aerosols.28 Figure 1c shows BCconcentrations over the course of the study, which were low(average( standard deviation =142.2( 97.8 ng/m3 duringNPFperiods) compared to urban environments (on the order of 1�5μg/m3).29 The Supporting Information contains an additionaldiscussion of BC concentrations.
The precipitation periods showed fairly steady decreases in O3
(ppm) and relative SO2 concentrations (Figure 1c). O3 concen-trations were higher during P1 compared to P2, whereas SO2
concentrations were higher during P2 compared to P1. Thissuggests that different chemical processes and species wereinvolved during the twoNPF periods, as discussed below. DuringP1, SO2 varied diurnally, first increasing from ∼11:00 theprevious day to ∼1:00 the day of the NPF events while duringP2, SO2 started increasing at∼20:00 the days previous to both ofthe NPF events. However, O3 was consistent during both NPFperiods, peaking ∼10:00�13:00 on the day of the events.Interestingly, the O3 maxima occurred 2�5 h before the NPFevents, and then decreased to aminimum, 4�9 h after the start ofthe NPF events. Lunden et al. (2006) observed a similar trendwith O3 peaking ∼4 h before NPF at Blodgett Forest ResearchStation, a site with similar conditions ∼16 miles southeast ofSugar Pine.9 In the current work, SO2 decreased from higher,steady concentrations as O3 and solar radiation increased andbefore new particles started to form. Observed trends of SO2 andO3 in relation to NPF events suggest their involvement innew particle formation and growth processes, as suggested byBerndt et al. (2010) who previously observed NPF from reactionof OH (formed from O3) and SO2 in a laboratory setting.30
3.2. Growth of New Particles into CCN.Heavy precipitationperiods resulting in clean conditions in conjunction with the
Figure 1. (a) 5-min temporally resolved SMPS size distributions (nm) with superimposed 2-min relative humidity (%) and temperature (�C), (b)hourly precipitation (mm/h) and 2-min solar radiation (W/m2), and (c) hourly gas-phase relative SO2 and O3 (ppm) concentrations and black carbonconcentrations (ng/m3).

D dx.doi.org/10.1021/es103692f |Environ. Sci. Technol. XXXX, XXX, 000–000
Environmental Science & Technology ARTICLE
presence of necessary gas-phase species that induced NPFproduced periods typified by the fast growth of newly formedparticles. Frequent observations of the nucleation of particlesonly a few nanometers in diameter followed by subsequentgrowth to∼100 nm have been shown to occur within 1�2 daysin the continental boundary layer.31 However, during the currentwork, we calculated the upper limit of growth to 100 nm to occurin as rapidly as 15 h. Having a measure of the time it takes aparticle to grow up to 100 nm provides a relevant link betweennewly formed particles and those particles that can activate asCCN. Inferred growth rates (GRs) in Figure 2 and Table S1 ofthe were determined using the method discussed by Kulmalaet al. (2004)31 and are described in the Supporting Information.Briefly, lines were fit to the increasing mean particle sizes duringNPF events. The GRs were calculated from the slopes of thesefitted lines. According to Kulmala et al. (2004), uncertaintiessuch as distinguishing between new and pre-existing particles andthe exact start and end times of these events can lead touncertainties in the GRs,31 however, the times and sizes werechosen to limit contributions from these uncertainties as much aspossible.As shown in Figure 2, new particles grew faster on average
during P2 compared to P1: inferred GRs during P1 and P2 were4 ( 3 nm/h and 7 ( 1 nm/h, respectively. The difference ininferred GRs between P1 and P2 was most likely due to theinvolvement of different species as suggested by the air masstrajectories and different concentrations of key gas-phase species,namely O3 and SO2, during the two periods. In addition,higher concentrations of organic species due to higher averagetemperatures32 could have contributed to the faster growth rates,on average, observed during P2 (as discussed in the SupportingInformation). Because amines are basic compounds, they havethe potential to undergo rapid acid�base reactions to form saltsin/on particles in the presence of sulfuric acid, depending ontemperature, the identity of the amine, and the concentrationsand identities of acidic species present.19Higher SO2 concentrationsduring P2 potentially led to more sulfuric acid in the newlyformed particles making them more acidic, which can inducefaster growth through acid�base reactions. Overall, inferred GRs
from both periods (2�8 nm/h), particularly during P2, occur onthe higher end of previously reported GR ranges for remote ruralareas presented by Kulmala et al. (2004) and referencestherein.31 Notably, GRs during the closely located Blodgettstudy (1�7 nm/h) were comparable to these measurements atSugar Pine.9
One of the primary goals of the CalWater field campaigninvolved developing a better understanding of the sources ofCCN that ultimately impact orographic clouds and precipitationin the Sierra Nevada. It has been hypothesized that the majorityof CCN are transported from the polluted CV near Fresno andBakersfield, a region with high agricultural activity.21 However, itis possible that local NPF events such as the ones described herecan produce large numbers of ultrafine particles that can ulti-mately grow and become CCN, especially in regions with a lowanthropogenic influence at higher elevations.33 Figure 2 showsthe size distribution from Figure 1a along with the ratio ofCCN0.3 to all CN (fCCN[0.3]). Importantly, increases in fCCN[0.3]coinciding with the NPF events during particle growth suggestthese newly formed particles can effectively serve as CCN. Thesefindings are consistent with recent studies which have alsosuggested that newly formed particles evolve into CCN throughmodeling34�36 and observations in remote regions with similarconditions during NPF.37,38
3.3. Single-Particle Chemical Composition during NPFEvents.To better understand the chemistry of the newly formedCCN, a more detailed look at particles in the typical CCN sizerange is merited. Data showing real-time changes in the chemicalcomposition of larger, detectable sizes (>100 nm) have recentlybeen used to provide insight into the chemistry of newly formedparticles.39 Since the UF-ATOFMS measures particles withDva g 100 nm, we can only state that the detected species werelikely involved in the initial formation and/or growth processes,which is why this term “NPF” is used throughout the work.However, it is likely that the chemical composition of particlesfrom 100 e Dva e 1000 nm is a product of condensation,heterogeneous reactions, and coagulation processes occurringduring NPF events. To look at the chemistry in detail, P1 wasfurther divided into shorter time periods based on the SMPS
Figure 2. SMPS plotted with fCCN[0.3]. The inset is the strongest correlation of fCCN[0.3] with an NPF event (3/7�3/8). The markers superimposedover each NPF event are the estimated GRs for the event on that day. Blue and red markers represent GRs during P1 and P2, respectively.

E dx.doi.org/10.1021/es103692f |Environ. Sci. Technol. XXXX, XXX, 000–000
Environmental Science & Technology ARTICLE
data, including before events (non-NPF), growth subperiods G1(e20 nm), G2 (20�25 nm), G3 (25�30 nm), G4 (g30 nm athigher number concentrations), and end of events (g30 nm atlower number concentrations). Limited chemical data wereobtained during P2 due to instrumental issues; therefore, thisperiod was excluded when looking at chemistry during subper-iods. However, a comparison of chemical species between P1 andspecies from the limited data collected during P2 is provided inthe Supporting Information. The initial growth, or the G1 andG2 subperiods, typically corresponded to the smallest mean sizesand highest number concentrations compared to before and afterthe events, which is typical of NPF bursts.40 Figure 3 shows theoverall particle chemistry from 100 e Dva e 1000 nm frombefore the events, growth subperiods, and the end of events,along with the average number concentrations and mean sizesfrom the SMPS data. The major types observed at Sugar Pineincluded amine-containing organic carbon (amine-OC), agedorganic carbon (aged OC), elemental carbon (EC), EC mixedwith OC (ECOC), biomass, salts, and other minor particle typesthat consisted of < 1% of the total number of particles presentduring NPF. EC, ECOC, biomass, and salts were transportedfrom other regions and clearly not formed during NPF events.Mass spectra and details of these other particle types are includedin the Supporting Information.As shown in Figure 3, the largest number fractions duringNPF
belonged to the amine-OC, biomass, and ECOC particle types,which represented 50%, 22%, and 16% of the total particlecounts, respectively. Amine-OC types were characterizedby markers at m/z 86 ((C2H5)2NCH2
+), 101 ((C2H5)3N+),
102 ((C2H5)3NH+), 118 ((C2H5)3NOH
+), and other carbonac-eous ions.41,42 Not only was the amine-OC type the largestfraction, it increased as the newly formed particles grew intolarger sizes, then decreased toward the end of the events. Beforethe events, amine-OC types comprised on average 44% of thetotal particle counts then increased to 48% during G1, 59%during G2, 62% during G3, then decreased to 38% during G4 and
37% during the end of events. Amine-OC particles also increasedat the smallest sizes observable by the UF-ATOFMS (Dva =100�300 nm) during the initial growth subperiods as shown/discussed in the Supporting Information. This trend suggests thepresence of background amine-containing particles; the largeincrease in small-sized amine-OC particles during the initialgrowth subperiods suggests semivolatile amine species played arole in the growth of new particles. The amine-OC fraction did notincrease as much as one might expect during G1 because the UF-ATOFMS sees larger sizes (Dva g 100 nm) and thus does notdirectly measure the chemistry of the smallest particles during theinitial growth periods of NPF. The decrease toward the end ofevents when particle number concentrations decreased suggeststhe amine-OC particles coagulated with other types of particles.Increases of amine species were observed from the beginning tothe end of NPF events on aged OC, biomass, and ECOC particletypes. By using digital color histograms of single particles we wereable to monitor the evolution of the UF-ATOFMS particles types,which showed increases in the overall number of particles withamine species (m/z 86), and showed themajor particle types, agedOC, biomass, and ECOC, coagulatedwith the small, newly formedamine-containing particles (see Supporting Information).The increase in average number fraction as well as the absolute
amine peak areas (Supporting Information) suggests aminespecies were involved in the growth of new particles. Aspreviously mentioned, sulfate is also believed to play a role inNPF. Figure 3 shows the number of particles within all particle typescontaining the sulfate ion marker (m/z �97, HSO4
�) per 5-mininterval. The average number of particles containing m/z �97followed a similar trend to the SMPS number concentration: lowernumbers before events followed by higher numbers during initialgrowth subperiods, ending with lower numbers toward the end.Both the number of particles containing sulfate and the
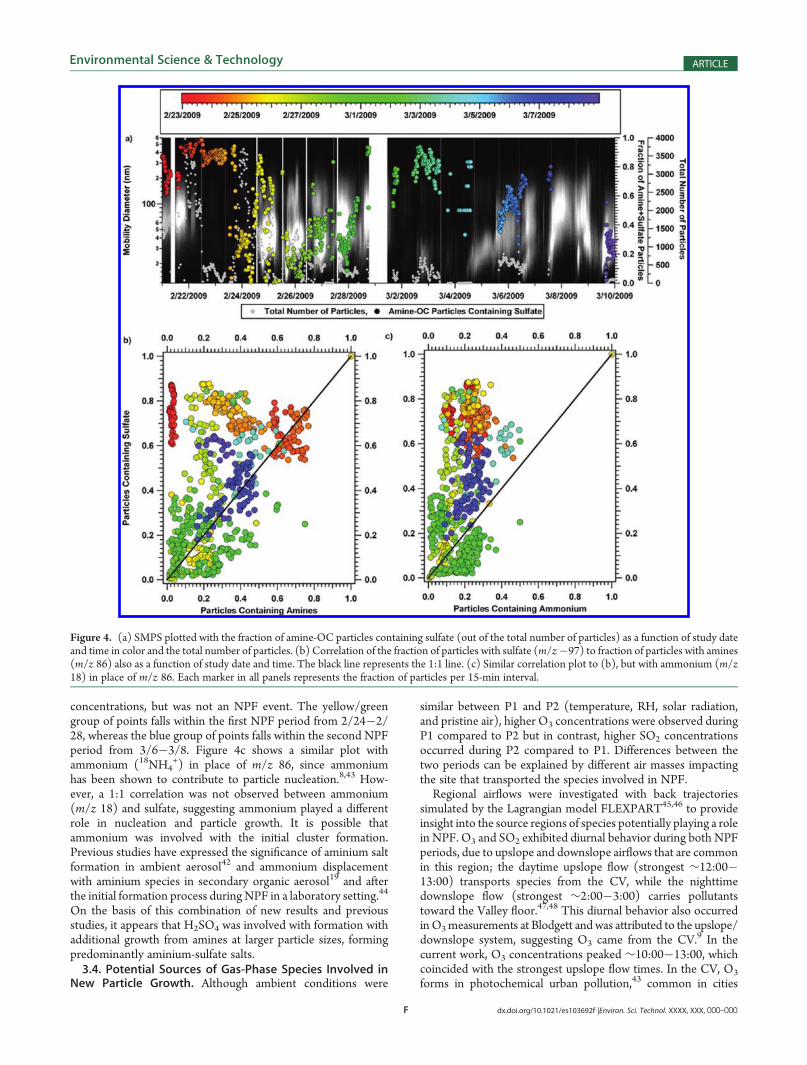
number and overall fraction of amine-OC particles increasedduring the initial growth subperiods compared to before theevents and decreased at the end of the events, suggesting thatthese species played a role in the growth of new particles.Figure 4a shows the SMPS data with the fraction of amine-OCparticles containing sulfate and total number of particles per15-min interval. Panel (a) in Figure S3 of the SupportingInformation corresponds to the mass spectra for amine-OCparticles containing sulfate. Increases in the fraction of amine-OC particles containing sulfate were observed during NPFevents, providing clear evidence that amines and sulfate wereindeed present in the same, single particles. In addition, thefractions of amine-OC particles containing sulfate were highestmainly during the beginning on NPF events, likely due to thelarge number concentrations of aminium sulfate particles formedduring the NPF bursts. The ability to measure both amine andsulfate species in the same single particles during NPF directlyconfirms these aminium salts formed, supporting previousinferences of their existence in newly formed particles.Figure 4b shows a correlation plot of the fraction of particles
with m/z 86 versus the fraction with m/z �97 as a function ofstudy date (in color), with the black line representing the 1:1 line.The color matches the respective date and time of markers inFigure 4a. Each marker represents the fraction of particlescontaining m/z 86 and/or m/z �97 in 15-min intervals. Threenotable groups of points exist with similar colors on the 1:1 line,meaning those points contain roughly equivalent numbers ofparticles with m/z 86 and m/z�97. The orange group of points(upper right) represents the period of high particle number
Figure 3. ATOFMS particle types in the 100�1000 nm size rangemeasured during P1. Also pictured are the SMPS total particle numberconcentrations (#/cm3), SMPS mean sizes (nm), and number ofATOFMS sulfate-containing (m/z�97) particles during each subperiod.All of these values are averaged over the four NPF events in P1.
F dx.doi.org/10.1021/es103692f |Environ. Sci. Technol. XXXX, XXX, 000–000
Environmental Science & Technology ARTICLE
concentrations, but was not an NPF event. The yellow/greengroup of points falls within the first NPF period from 2/24�2/28, whereas the blue group of points falls within the second NPFperiod from 3/6�3/8. Figure 4c shows a similar plot withammonium (18NH4
+) in place of m/z 86, since ammoniumhas been shown to contribute to particle nucleation.8,43 How-ever, a 1:1 correlation was not observed between ammonium(m/z 18) and sulfate, suggesting ammonium played a differentrole in nucleation and particle growth. It is possible thatammonium was involved with the initial cluster formation.Previous studies have expressed the significance of aminium saltformation in ambient aerosol42 and ammonium displacementwith aminium species in secondary organic aerosol19 and afterthe initial formation process duringNPF in a laboratory setting.44
On the basis of this combination of new results and previousstudies, it appears that H2SO4 was involved with formation withadditional growth from amines at larger particle sizes, formingpredominantly aminium-sulfate salts.3.4. Potential Sources of Gas-Phase Species Involved in
New Particle Growth. Although ambient conditions were
similar between P1 and P2 (temperature, RH, solar radiation,and pristine air), higher O3 concentrations were observed duringP1 compared to P2 but in contrast, higher SO2 concentrationsoccurred during P2 compared to P1. Differences between thetwo periods can be explained by different air masses impactingthe site that transported the species involved in NPF.Regional airflows were investigated with back trajectories
simulated by the Lagrangian model FLEXPART45,46 to provideinsight into the source regions of species potentially playing a rolein NPF. O3 and SO2 exhibited diurnal behavior during both NPFperiods, due to upslope and downslope airflows that are commonin this region; the daytime upslope flow (strongest ∼12:00�13:00) transports species from the CV, while the nighttimedownslope flow (strongest ∼2:00�3:00) carries pollutantstoward the Valley floor.47,48 This diurnal behavior also occurredinO3measurements at Blodgett and was attributed to the upslope/downslope system, suggesting O3 came from the CV.9 In thecurrent work, O3 concentrations peaked ∼10:00�13:00, whichcoincided with the strongest upslope flow times. In the CV, O3
forms in photochemical urban pollution,43 common in cities
Figure 4. (a) SMPS plotted with the fraction of amine-OC particles containing sulfate (out of the total number of particles) as a function of study dateand time in color and the total number of particles. (b) Correlation of the fraction of particles with sulfate (m/z�97) to fraction of particles with amines(m/z 86) also as a function of study date and time. The black line represents the 1:1 line. (c) Similar correlation plot to (b), but with ammonium (m/z18) in place of m/z 86. Each marker in all panels represents the fraction of particles per 15-min interval.

G dx.doi.org/10.1021/es103692f |Environ. Sci. Technol. XXXX, XXX, 000–000
Environmental Science & Technology ARTICLE
including Sacramento and Fresno. In contrast, during P2 SO2
peaked during the downslope flow, suggesting it was nottransported from the CV.During P2, long-range transport of SO2 at higher altitudes,
which could potentially become entrained from the free tropo-sphere during the day and descend into the stable nighttimeboundary layer,49 appears to be the difference between the twoperiods and led to higher SO2 at the site during P2. NASA’sOzone Monitoring Instrument (OMI) sensor onboard the Aurasatellite measures backscattered radiation which is used toestimate vertically integrated SO2 values. Images acquired forthe days before, during, and after NPF events for both periods areshown in the Supporting Information. Background levels of SO2
were observed in Northern California on 2/26. On the same day,an SO2 plume from the coast of Asia traveled across the PacificOcean from 2/26�3/5, arriving off the coast of Washington andultimately Northern California between 3/6�3/8, correspond-ing to the peak in SO2 concentrations. Levels of SO2 returned tobackground levels on 3/9, similar to those measured on 2/26.Back trajectories (also shown in the Supporting Information)further support trans-Pacific transport during P2, following ahigh pressure system that provided clear skies and dry conditionsknown to inhibit in-cloud conversion of SO2 to sulfate. Together,OMI data and back trajectory analysis suggest the high SO2
observed during P2 resulted from long-range transport fromAsia, which is likely from biomass burning emissions due to slashburn techniques in southeast Asian during this time of year.50
A number of sources exist for the amine precursors. The CV islargely inhabited by significant livestock populations whichrepresent large sources of ammonia as well as amines.51 Localsources of amines from vegetation52 are likely negligible incomparison to bovine sources in the CV, which can be trans-ported by the upslope/downslope system along with O3. Overall,amines and O3 likely came from agricultural emissions andphotochemical pollution in the CV, respectively. During P1,lower SO2 concentrations and correspondingly less sulfate (∼4times less in average sulfate peak area and number of particlescontaining sulfate as described in the Supporting Information)were observed compared to P2. In contrast, during P2 Asian-transported SO2 likely from biomass burning emissions andmore sulfate were observed, potentially leading to the fasteraverage particle growth compared to P1.NPF periods occurring after heavy precipitation periods began
each day during low RH, high temperature, and peak solarradiation, and during pristine, nonprecipitating periods, demon-strating the strong dependence of NPF on ambient conditions.Growth of newly formed particles occurred as RH increased andtemperature and solar radiation decreased, and was relatively fastcompared to previous observations, which can be attributed tothe extremely clean conditions as well as the availability of gas-phase SO2, O3, and amines. Using UF-ATOFMS, increases in theoverall fraction of amine-containing particles from 100 e Dva e1000 nm occurred over the course of the NPF events aftersubstantial particle growth from the smallest sizes. During NPF,amine and sulfate ion markers are observed in the same, single-particle mass spectra, and the number of particles containingsulfate correlated 1:1 to the number of amine-containing particlesbut not ammonium-containing particles. Although we cannotdetermine all of the sources of the species involved in theseprocesses, air mass trajectories suggest the amines and O3 camefrom animal husbandries and vehicle pollution in the CV, respec-tively, while SO2 was likely transported from Asia during P2.
It is important to understand and characterize such smallparticles that ultimately can activate as CCN and impact cloudformation and potentially precipitation over the Sierra Nevada.One of the new and more intriguing findings of this work is thekey role long-range transported SO2 from Asia played in CCNformation in the Sierra Nevada.We hypothesize that SO2 formedsulfate which reacted with amines to form aminium-sulfate salts,particularly during P2 when SO2 concentrations and particlescontaining sulfate were highest, ultimately leading to CCN-activeparticles upon growth to larger sizes. To further quantify theability of organic salts to activate as CCN, laboratory studies tomeasure the hygroscopicity parameter kappa (k) of variousaminium-sulfate salts will be performed.53 The range of k valuesat Sugar Pine (0.013�0.16) suggest the CCN-active particlescontained organic species.53 The presence of aminium salts,which are known to be water-soluble,41,42 could account for themore hygroscopic and CCN-active particles measured duringNPF events. A recently completed field study over Sugar Pineand the CV will allow comparisons between ground and mea-surements aloft to gain further insight into the regional impact ofnewly formed particles on orographic clouds and precipitation inthis region.
’ASSOCIATED CONTENT
bS Supporting Information. Details from SMPS data dur-ing NPF events, calculated GRs, mass spectra, descriptions of theparticles types, mass spectra peak areas, additional FLEXPARTanalysis, OMI images, and miscellaneous discussion. This ma-terial is available free of charge via the Internet at http://pubs.acs.org.
’AUTHOR INFORMATION
Corresponding Author*Phone: 858-822-5312; fax: 858-534-7042; e-mail: [email protected].
Present Addresses^Department of Chemistry, University of Iowa, Iowa City,IA, 52242
’ACKNOWLEDGMENT
The Forest Hill Power Utility District is acknowledgedfor hosting the sampling site. Joseph Mayer, Cassandra Gaston,Dr. Meagan Moore, and Melanie Zauscher are acknowledged forassisting in preparing instrumentation for the study and settingup the site. Also, Professor Joel Norris is acknowledged forassistance with species source determination.
’REFERENCES
(1) Solomon, S.; Qin, D.; Manning, M.; Chen, Z.; Marquis, M.;Averyt, K. B.; Tignor, M. “Climate Change 2007: The Physical ScienceBasis, Contribution of Working Group I to the Fourth AssessmentReport of the Intergovernmental Panel on Climate Change,”CambridgeUniv. Press: New York, 2007.
(2) Albrecht, B. A. Aerosols, cloud microphysics, and fractionalcloudiness. Science 1989, 245, 1227–1230.
(3) Twomey, S. Influence of pollution on shortwave albedo ofclouds. J. Atmos. Sci. 1977, 34, 1149–1152.

H dx.doi.org/10.1021/es103692f |Environ. Sci. Technol. XXXX, XXX, 000–000
Environmental Science & Technology ARTICLE
(4) Ziemba, L. D.; Dibb, J. E.; Griffin, R. J.; Huey, L. G.; Beckman, P.Observations of particle growth at a remote, Arctic site. Atmos. Environ.2010, 44, 1649–1657.(5) Ristovski, Z. D.; Suni, T.; Kulmala, M.; Boy, M.; Meyer, N. K.;
Duplissy, J.; Turnipseed, A.; Morawska, L.; Baltensperger, U. The role ofsulphates and organic vapours in growth of newly formed particles in aeucalyptus forest. Atmos. Chem. Phys. 2010, 10, 2919–2926.(6) Seinfeld, J. H.; Pandis, S. N. Atmospheric Chemistry and Physics,
2nd ed.; John Wiley & Sons, Inc.: New York, 2006.(7) Kulmala, M.; Pirjola, U.; Makela, J. M. Stable sulphate clusters as
a source of new atmospheric particles. Nature 2000, 404, 66–69.(8) Ortega, I. K.; Kurten, T.; Vehkamaki, H.; Kulmala,M. The role of
ammonia in sulfuric acid ion induced nucleation. Atmos. Chem. Phys.2008, 8, 2859–2867.(9) Lunden, M. M.; Black, D. R.; Mckay, M.; Revzan, K. L.; Gold-
stein, A. H.; Brown, N. J. Characteristics of fine particle growth eventsobserved above a forested ecosystem in the Sierra Nevada Mountains ofCalifornia. Aerosol Sci. Technol. 2006, 40, 373–388.(10) Fisher, J. A.; Jacob, D. J.; Purdy, M. T.; Kopacz, M.; Le Sager, P.;
Carouge, C.; Holmes, C. D.; Yantosca, R. M.; Batchelor, R. L.; Strong,K.; Diskin, G. S.; Fuelberg, H. E.; Holloway, J. S.; Hyer, E. J.; McMillan,W. W.; Warner, J.; Streets, D. G.; Zhang, Q.; Wang, Y.; Wu, S. Sourceattribution and interannual variability of Arctic pollution in springconstrained by aircraft (ARCTAS, ARCPAC) and satellite (AIRS)observations of carbon monoxide. Atmos Chem Phys 2010, 10, 977–996.(11) Wang, L.; Khalizov, A. F.; Zheng, J.; Xu, W.; Ma, Y.; Lal, V.;
Zhang, R. Atmospheric nanoparticles formed from heterogeneousreactions of organics. Nat. Geosci. 2010, 3, 238–242.(12) Kulmala, M.; Kerminen, V. M.; Laaksonen, A. Simulations on
the effect of sulphuric acid formation on atmospheric aerosol concen-trations. Atmos. Environ. 1995, 29, 377–382.(13) Wehner, B.; Petaja, T.; Boy, M.; Engler, C.; Birmili, W.; Tuch,
T.; Wiedensohler, A.; Kulmala, M. The contribution of sulfuric acid andnon-volatile compounds on the growth of freshly formed atmosphericaerosols. Geophys. Res. Lett. 2005, 32, L17810, doi:17810.11029/12005GL023827.(14) Smith, J. N.; Barsanti, K. C.; Friedli, H. R.; Ehn, M.; Kulmala,
M.; Collins, D. R.; Scheckman, J. H.; Williams, B. J.; McMurry, P. H.Observations of aminium salts in atmospheric nanoparticles and possi-ble climatic implications. Proc. Natl. Acad. Sci. U.S.A. 2009, 107, 6634–6639.(15) McMurry, P. H.; Fink, M.; Sakurai, H.; Stolzenburg, M. R.;
Mauldin, R. L.; Smith, J.; Eisele, F.; Moore, K.; Sjostedt, S.; Tanner, D.;Huey, L. G.; Nowak, J. B.; Edgerton, E.; Voisin, D. A criterion for newparticle formation in the sulfur-rich Atlanta atmosphere. J. Geophys. Res.2005, 110, D22S02, doi:10.1029/2005JD005901.(16) Barsanti, K. C.; McMurry, P. H.; Smith, J. N. The potential
contribution of organic salts to new particle growth. Atmos. Chem. Phys.Discuss. 2009, 9, 2949–2957.(17) M€akel€a, J. M.; Yli-Koivisto, S.; Hiltunen, V.; Seidl, W.; Swie-
tlicki, E.; Teinila, K.; Sillanpaa, M.; Koponen, I. K.; Paatero, J.; Rosman,K.; Hameri, K. Chemical composition of aerosol during particle forma-tion events in boreal forest. Tellus B 2001, 53, 380–393.(18) Wang, L.; Lal, V.; Khalizov, A. F.; Zhang, R. Heterogeneous
chemistry of alkylamines with sulfuric acid: Implications for atmosphericformation of alkylaminium sulfates. Environ. Sci. Technol. 2010, 44,2461–2465.(19) Murphy, S. M.; Sorooshian, A.; Kroll, J. H.; Ng, N. L.; Chhabra,
P.; Tong, C.; Surratt, J. D.; Knipping, E.; Flagan, R. C.; Seinfeld, J. H.Secondary aerosol formation from atmospheric reactions of aliphaticamines. Atmos. Chem. Phys. 2007, 7, 2313–2337.(20) Smith, J. N.; Moore, K. F.; McMurry, P. H.; Eisele, F. L.
Atmospheric measurements of sub-20 nm diameter particle chemicalcomposition by thermal desorption chemical ionization mass spectro-metry. Aerosol. Sci. Tech. 2004, 38, 100–110.(21) Rosenfeld, D.; Woodley, W. L.; Axisa, D.; Freud, E.; Hudson,
J. G.; Givati, A. Aircraft measurements of the impacts of pollution
aerosols on clouds and precipitation over the Sierra Nevada. J. Geophys.Res. 2008, 113, D15203, doi:15210.11029/12007JD00954.
(22) Roberts, G. C.; Nenes, A. A continuous-flow streamwisethermal-gradient CCN chamber for atmospheric measurements. AerosolSci. Technol. 2005, 39, 206–221.
(23) Gard, E.; Mayer, J. E.; Morrical, B. D.; Dienes, T.; Fergenson,D. P.; Prather, K. A. Real-time analysis of individual atmospheric aerosolparticles: Design and performance of a portable ATOFMS. Anal. Chem.1997, 69, 4083–4091.
(24) Su, Y. X.; Sipin, M. F.; Furutani, H.; Prather, K. A. Developmentand characterization of an aerosol time-of-flight mass spectrometer withincreased detection efficiency. Anal. Chem. 2004, 76, 712–719.
(25) Spencer, M. T.; Prather, K. A. Using ATOFMS to determineOC/EC mass fractions in particles. Aerosol Sci. Technol. 2006, 40, 585–594.
(26) Song, X. H.; Hopke, P. K.; Fergenson, D. P.; Prather, K. A.Classification of single particles analyzed by ATOFMS using an artificialneural network, ART-2A. Anal. Chem. 1999, 71, 860–865.
(27) Covert, D. S.; Kapustin, V. N.; Quinn, P. K.; Bates, T. S. Newparticle formation in the marine boundary-layer. J. Geophys. Res. 1992,97, 20581–20589.
(28) Hansen, A. D. A.; Rosen, H. Horizontal inhomogeneities in theparticulate carbon component of the Arctic haze. Atmos. Environ. 1985,19, 2175–2180.
(29) Hitzenberger, R.; Tohno, S. Comparison of black carbon (BC)aerosols in two urban areas - concentrations and size distributions.Atmos. Environ. 2001, 35, 2153–2167.
(30) Berndt, T.; Stratmann, F.; Sipila, M.; Vanhanen, J.; Petaja, T.;Mikkila, J.; Gruner, A.; Spindler, G.; Mauldin, R. L., III; Curtius, J.;Kulmala, M.; Heintzenberg, J. Laboratory study on new particle forma-tion from reaction OH + SO2: influence of experimental conditions,H2O vapour, NH3 and the amine tert-butylamine on the overall process.Atmos. Chem. Phys. 2010, 10, 6447–6484.
(31) Kulmala, M.; Vehkamaki, H.; Petaja, T.; Dal Maso, M.; Lauri,A.; Kerminen, V.M.; Birmili, W.;McMurry, P. H. Formation and growthrates of ultrafine atmospheric particles: a review of observations.J. Aerosol Sci. 2004, 35, 143–176.
(32) Sharkey, T. D.; Loreto, F. Water-stress, temperature, and lighteffects on the capacity for isoprene emission and photosynthesis ofKudzu leaves. Oecologia 1993, 95, 328–333.
(33) Merikanto, J.; Spracklen, D. V.; Mann, G. W.; Pickering, S. J.;Carslaw, K. S. Impact of nucleation on global CCN. Atmos. Chem. Phys.Discuss 2009, 9, 12999–13037.
(34) Kerminen, V. M.; Lihavainen, H.; Komppula, M.; Viisanen, Y.;Kulmala, M. Direct observational evidence linking atmospheric aerosolformation and cloud droplet activation. Geophys. Res. Lett. 2005, 32,L14803, doi:14810.11029/12005GL02313.
(35) Kuang, C.; McMurry, P. H.; McCormick, A. V. Determinationof cloud condensation nuclei production from measured new particleformation events. Geophys. Res. Lett. 2009, 36, L09822, doi:09810.01029/02009GL037584.
(36) Pierce, J. R.; Adams, P. J. Efficiency of cloud condensation nucleiformation from ultrafine particles. Atmos. Chem. Phys. 2007, 7, 1367–1379.
(37) Sihto, S.-L.; Mikkila, J.; Vanhansen, J.; Ehn, M.; Liao, L.;Lehtipalo, K.; Aalto, P. P.; Duplissy, J.; Petaja, T.; Kerminen, V. M.;Boy, M.; Kulmala, M. Seasonal variation of CCN concentrations andaerosol activation properties in boreal forest. Atmos. Chem. Phys. Discuss.2010, 10, 28231–28272.
(38) O’Halloran, T. L.; Fuentes, J. D.; Collins, D. R.; Cleveland,M. J.; Keene, W. C. Influence of air mass source region on nanoparticleevents and hygroscopicity in central Virginia, US. Atmos. Environ. 2009,43, 3586–3595.
(39) Friedman, B.; Herich, H.; Kammermann, L.; Gross, D. S.;Arneth, A.; Holst, T.; Cziczo, D. J. Subarctic atmospheric aerosolcomposition: 1. Ambient aerosol characterization. J. Geophys. Res.2009, 114, D13203, doi:13210.11029/12009JD011772.
(40) Chang, L. S.; Schwartz, S. E.; McGraw, R.; Lewis, E. R.Sensitivity of aerosol properties to new particle formation mechanism

I dx.doi.org/10.1021/es103692f |Environ. Sci. Technol. XXXX, XXX, 000–000
Environmental Science & Technology ARTICLE
and to primary emissions in a continental-scale chemical transport model.J. Geophys. Res. 2009, 114, D07203, doi:07210.01029/02008JD011019.(41) Angelino, S.; Suess, D. T.; Prather, K. A. Formation of aerosol
particles from reactions of secondary and tertiary alkylamines: Char-acterization by aerosol time-of-flight mass spectrometry. Environ. Sci.Technol. 2001, 35, 3130–3138.(42) Pratt, K. A.; Hatch, L. E.; Prather, K. A. Seasonal volatility
dependence of ambient particle phase amines. Environ. Sci. Technol.2009, 43, 5276–5281.(43) Finlayson-Pitts, B. J.; Pitts, J. N. Chemistry of the Upper and
Lower Atmosphere; Academic Press: San Diego, 2000.(44) Bzdek, B. R.; Ridge, D. P.; Johnston, M. V. Size-dependent
reactions of ammonium bisulphate clusters with dimethylamine. J. Phys.Chem. A 2010, 114, 11638–11644.(45) Stohl, A.; Hittenberger, M.; Wotawa, G. Validation of the
Lagrangian particle dispersion model FLEXPART against large-scaletracer experiment data. Atmos. Environ. 1998, 32, 4245–4264.(46) Stohl, A.; Forster, C.; Frank, A.; Seibert, P.; Wotawa, G.
Technical note: The Lagrangian particle dispersion model FLEXPARTversion 6.2. Atmos. Chem. Phys. 2005, 5, 2461–2474.(47) Collett, J. L.; Daube, B. C.; Gunz, D.; Hoffmann, M. R.
Intensive studies of Sierra-Nevada cloudwater chemistry and its relation-ship to precursor aerosol and gas concentrations. Atmos. Environ. A-Gen.1990, 24, 1741–1757.(48) Bao, J. W.; Michelson, S. A.; Persson, P. O. G.; Djalalova, I. V.;
Wilczak, J. M. Observed and WRF-simulated low-level winds in a high-ozone episode during the Central California Ozone Study. J. Appl.Meteorol. Clim. 2008, 47, 2372–2394.(49) Nilsson, E. D.; Rannik, U.; Kulmala, M.; Buzorius, G.; O’Dowd,
C. D. Effects of continental boundary layer evolution, convection,turbulence and entrainment, on aerosol formation. Tellus B 2001, 53,441–461.(50) Streets, D. G.; Yarber, K. F.; Woo, J. H.; Carmichael, G. R.
Biomass burning in Asia: Annual and seasonal estimates and atmo-spheric emissions. Global Biogeochem. Cycles 2003, 17.(51) Sorooshian, A.; Murphy, S. N.; Hersey, S.; Gates, H.; Padro,
L. T.; Nenes, A.; Brechtel, F. J.; Jonsson, H.; Flagan, R. C.; Seinfeld, J. H.Comprehensive airborne characterization of aerosol from a majorbovine source. Atmos. Chem. Phys. 2008, 8, 5489–5520.(52) Neff, J. C.; Holland, E. A.; Dentener, F. J.; McDowell, W. H.;
Russell, K. M. The origin, composition and rates of organic nitrogendeposition: A missing piece of the nitrogen cycle? Biogeochemistry 2002,57, 99–136(53) Petters, M. D.; Kreidenweis, S. M. A single parameter repre-
sentation of hygroscopic growth and cloud condensation nucleusactivity. Atmos. Chem. Phys. 2007, 7, 1961–1971.