measurement report: quantifying source contribution of
TRANSCRIPT
Atmos. Chem. Phys., 21, 973–987, 2021https://doi.org/10.5194/acp-21-973-2021© Author(s) 2021. This work is distributed underthe Creative Commons Attribution 4.0 License.
Measurement report: quantifying source contribution of fossil fuelsand biomass-burning black carbon aerosol in thesoutheastern margin of the Tibetan PlateauHuikun Liu1,2,3, Qiyuan Wang1,2,3,4, Li Xing5, Yong Zhang2, Ting Zhang2, Weikang Ran2, and Junji Cao1,2,3,4
1State Key Laboratory of Loess and Quaternary Geology, Institute of Earth Environment,Chinese Academy of Sciences, Xi’an, 710061, China2Key Laboratory of Aerosol Chemistry and Physics, Institute of Earth Environment,Chinese Academy of Sciences, Xi’an, 710061, China3University of Chinese Academy of Sciences, Beijing, 100049, China4CAS Center for Excellence in Quaternary Science and Global Change, Xi’an, 710061, China5School of Geography and Tourism, Shaanxi Normal University, Xi’an, 710119, China
Correspondence: Qiyuan Wang ([email protected]) and Junji Cao ([email protected])
Received: 25 April 2020 – Discussion started: 23 June 2020Revised: 5 November 2020 – Accepted: 7 December 2020 – Published: 26 January 2021
Abstract. Anthropogenic emissions of black carbon (BC)aerosol are transported from Southeast Asia to the south-western Tibetan Plateau (TP) during the pre-monsoon; how-ever, the quantities of BC from different anthropogenicsources and the transport mechanisms are still not well con-strained because there have been no high-time-resolutionBC source apportionments. Intensive measurements weretaken in a transport channel for pollutants from SoutheastAsia to the southeastern margin of the TP during the pre-monsoon to investigate the influences of fossil fuels andbiomass burning on BC. A receptor model that coupledmulti-wavelength absorption with aerosol species concen-trations was used to retrieve site-specific Ångström expo-nents (AAEs) and mass absorption cross sections (MACs)for BC. An “aethalometer model” that used those valuesshowed that biomass burning had a larger contribution to BCmass than fossil fuels (BCbiomass = 57 % versus BCfossil =
43 %). The potential source contribution function indicatedthat BCbiomass was transported to the site from northeasternIndia and northern Burma. The Weather Research and Fore-casting model coupled with chemistry (WRF-Chem) indi-cated that 40 % of BCbiomass originated from Southeast Asia,while the high BCfossil was transported from the southwestof the sampling site. A radiative transfer model indicatedthat the average atmospheric direct radiative effect (DRE)
of BC was +4.6± 2.4 W m−2, with +2.5± 1.8 W m−2 fromBCbiomass and +2.1± 0.9 W m−2 from BCfossil. The DRE ofBCbiomass and BCfossil produced heating rates of 0.07± 0.05and 0.06± 0.02 K d−1, respectively. This study provides in-sights into sources of BC over a transport channel to thesoutheastern TP and the influence of the cross-border trans-portation of biomass-burning emissions from Southeast Asiaduring the pre-monsoon.
1 Introduction
The Tibetan Plateau (TP) is an important regulator of climatechange in the Northern Hemisphere, and it plays a crucialrole in the functions of the global ecosystem and climate sta-bility (Liu et al., 2019, 2020a). The TP is covered by one ofthe largest ice masses on Earth, and it has been called thewater tower of Asia (Liu et al., 2020b). The glaciers on theTP are facing rapid retreat, however, and if unchecked, thiscould result in adverse effects on the Asian hydrological cy-cle and Asian monsoon (Luo et al., 2020; Hua et al., 2019). Inspring, the glaciers on the TP begin to melt as part of the nat-ural hydrological cycle, but the increasing quantities of blackcarbon (BC) aerosol transported to the TP have acceleratedthis process (Bond et al., 2013) by causing a warming effect
Published by Copernicus Publications on behalf of the European Geosciences Union.
974 H. Liu et al.: Source contribution of black carbon in the southeastern margin of the Tibetan Plateau
in atmosphere over the TP and enhancing the absorption ofradiation on the surface of the glaciers (Ming et al., 2009).
The southern part of the TP is bounded by South Asia,where air pollution often is severe (Chan et al., 2017).Several studies have shown that pollutants (including BC)from South Asia can be transported to the south of the TPalong mountain valleys, especially during the pre-monsoon(March–May), when southwesterly winds prevail (e.g., Caoet al., 2010; Xia et al., 2011; Zhu et al., 2017; Niu et al.,2017). For example, Xia et al. (2011) analyzed satellite dataand air mass trajectories and found that the TP, particularlythe southern TP, was affected by pollutants carried by south-westerly winds from nearby regions in South Asia. In ad-dition, numerous studies have shown that the high bulk BCmass loadings and the associated regional influences on theTP are related to transport from South Asia (Liu et al., 2015;Han et al., 2020; Cong et al., 2015; Wang et al., 2015).Nonetheless, assessments of regional transport of bulk BCaerosol have not fully revealed the impacts of different BCemission sources because the optical properties and radiativeeffects of BC can not only vary among sources in complexways but can also be affected by aging during transport (Tianet al., 2019; Zhang et al., 2019). Therefore, quantitative infor-mation on the contributions of different sources of BC overthe TP is lacking, but it is critically needed for a better un-derstanding of the influence of anthropogenic emissions onits environment and climate.
Several studies have assessed the contributions of differentBC sources through model simulations or isotopic methods.For example, Zhang et al. (2015) investigated BC sourcesfor different parts of the TP by using a chemical transportmodel and a source-tagging approach, and they found that thecontributions of BC sources varied among regions and withthe seasons. Li et al. (2016) used filter sampling and carbonisotopes (114C and δ13 C) to determine the BC from fossilfuels and biomass burning in several areas of the TP. A ma-jor disadvantage of filter-based measurements is that they areconstrained by low time resolution, which makes it challeng-ing to capture the detailed evolution of pollution events. Onthe other hand, the accuracy of model simulations is depen-dent on many factors, including uncertainties associated withinitial particle parameters, aging processes, the accuracy ofemission inventory, meteorological fields over the complexterrain, the modules for chemistry and planetary boundarylayer (PBL) dynamics, etc. (Koch et al., 2009; Madala et al.,2014; Vignati et al., 2010). Nonetheless, these studies havebeen helpful for understanding the sources of BC over theTP.
To make up for the deficiencies of filter-based analysis, BCsource apportionments based on high-time-resolution onlinedata have been conducted in many locations (e.g., Herichet al., 2011; Zhu et al., 2017; Rajesh and Ramachandran,2018) but for the TP are limited. An “aethalometer model”based on multi-wavelength absorption data is one efficientapproach for distinguishing between BC from fossil fuel and
biomass-burning sources (Sandradewi et al., 2008). The ac-curacy of the aethalometer model relies on the input parame-ters, including absorption Ångström exponent (AAE) and BCmass absorption cross section (MACBC) of different sources(Zotter et al., 2017). Limited information on site-specificÅngström exponents (AAEs) and MACBCs lead most studiesto rely on values taken from measurements made in other lo-cations (e.g., Healy et al., 2017; Zhu et al., 2017). This resultsin unquantified uncertainties because the AAE and MACBCscan vary with specific fuel subtypes and combustion condi-tions (Wang et al., 2018; Tian et al., 2019). Therefore site-dependent AAEs and MACBC are essential for improving thereliability of BC source apportionment by the aethalometermodel.
In this study, field measurements of BC were taken on thesoutheastern margin of the TP during the pre-monsoon. Thisregion connects the high-altitude TP with the low-altitudeYungui Plateau and forms a transport channel for pollutantsfrom Southeast Asia (Wang et al., 2019a), and it is an idealregion for investigating the impact of pollutant transport tothe southeastern TP. A receptor model combined with multi-wavelength absorption with aerosol species concentrationswas used to retrieve site-dependent AAEs and MACBCs. Thiswas done to improve the aethalometer model with the goalof obtaining a more accurate BC source apportionment. Theprimary objectives of this study were to (1) quantify themass concentrations of BC from fossil fuel and biomass-burning sources, (2) determine the impact of regional trans-port on source-specific BC, and (3) assess the radiative ef-fects caused by BC from different sources. This study pro-vides insights into the BC sources on the southeastern TPand an assessment of their radiative effects during the pre-monsoon.
2 Methodology
2.1 Sampling site
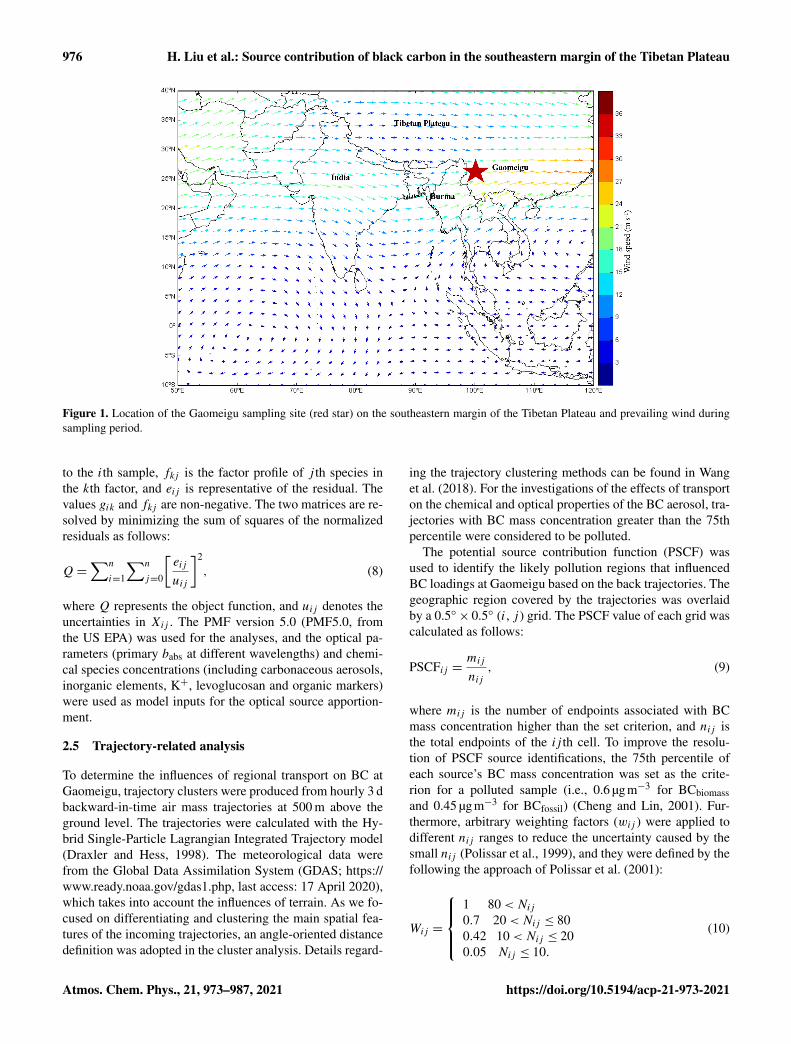
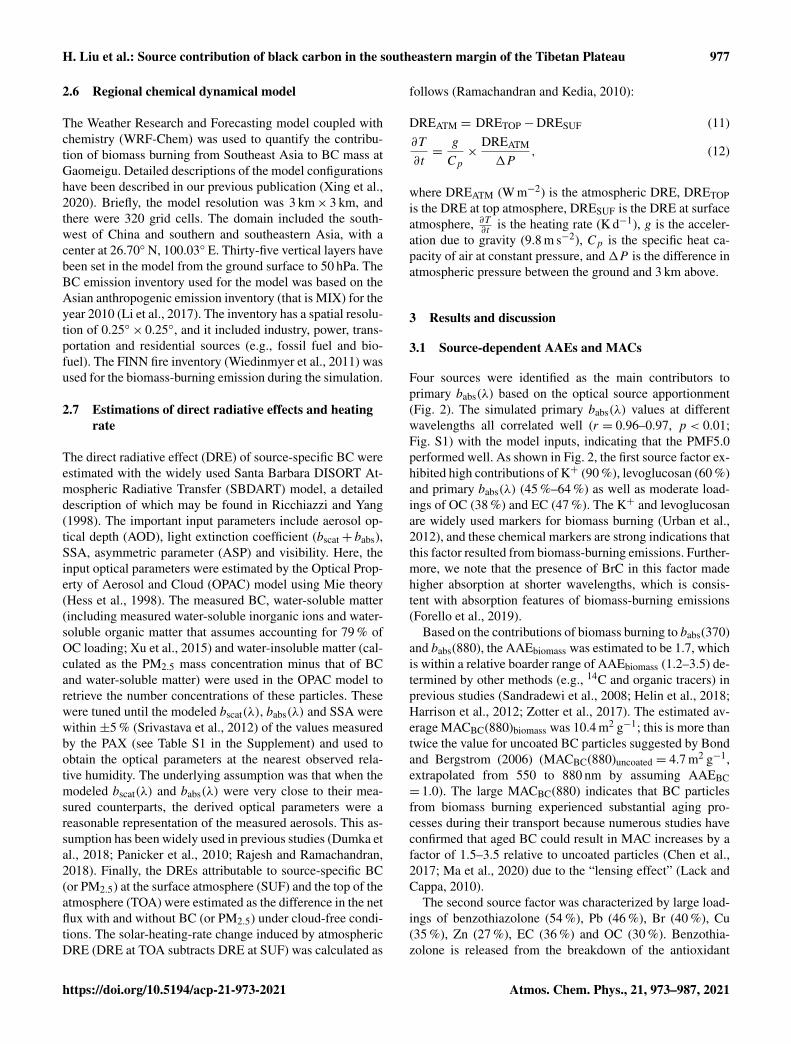
Intensive field measurements were made at the rooftop ofa building (∼ 10 m above the ground) at the Lijiang As-tronomical Station, Chinese Academy of Sciences (3260 mabove sea level; 26◦41′24′′ N, 100◦1′48′′ E), GaomeiguCounty, Yunnan Province, China (Fig. 1), from 14 March to13 May 2018. During the campaign, westerly winds createda potential pathway for cross-border transport from South-east Asia to southwestern China. During the study, the aver-age relative humidity and temperature were 80 %± 20 % and7.6± 3.2◦, respectively; the mean wind speed near the sur-face was 5.4± 2.1 m s−1, and the winds were mainly fromthe west and southwest. The sampling site is 3–5 km fromGaomeigu village, which has 27 households and 110 resi-dents. Villagers there rely on farming for their livelihoods,and biomass is the primary residential fuel (Li et al., 2016).There are no large industries near the village, and traffic is
Atmos. Chem. Phys., 21, 973–987, 2021 https://doi.org/10.5194/acp-21-973-2021
H. Liu et al.: Source contribution of black carbon in the southeastern margin of the Tibetan Plateau 975
light. However, two highways (Hangzhou–Ruili Expresswayand Dali–Nujiang Expressway) are located ∼ 5.5 km to thewest of the sampling site.
2.2 Online and offline measurements
Aerosol light absorption coefficients at multiple wavelengths(babs(λ), λ= 370, 470, 520, 590, 660, 880 and 950 nm) wereretrieved with the use of a model AE33 aethalometer (MageeScientific, Berkeley, CA, USA). The sampled particles wereselected by a PM2.5 cuff-off inlet (SCC 1.829, BGI Inc. USA)and dried with a Nafion® dryer (MD-700-24S-3, Perma Pure,Inc., Lakewood, NJ, USA), and the flow rate of the sam-pler is 5 L min−1. Detailed operating principles of the AE33aethalometer can be found in Drinovec et al. (2015). Briefly,light at wavelengths (λ) of 370, 470, 520, 590, 660, 880 and950 nm emitted from diodes is used to irradiate aerosol de-position spots on the filters. The light attenuation producedby the captured particles is measured with optical detec-tors. Non-linear loading and filter matrix scattering effectsare common issues for filter-based absorption measurements(Collaud Coen et al., 2010). A dual-spot technique for theaethalometer measurements was used to compensate for non-linearity, while a factor of 2.14 was used to correct the arti-facts caused by quartz filters (Drinovec et al., 2015).
A photoacoustic extinctiometer (PAX, Droplet Measure-ment Technology, Boulder, CO, USA) was used to deter-mine the aerosol light scattering and absorption coefficient(bscat(532) and babs(532), respectively), which were used tocalculate the single scattering albedo (SSA = bscat/(bscat+
babs)) at λ= 532 nm. The bscat was measured using a wide-angle (5–175◦) integrating reciprocal nephelometer in thescattering chamber. The babs(532) was measured simulta-neously with an intracavity photoacoustic technique in theacoustic chamber. A detailed description of the PAX can befound in Carrico et al. (2018). During the campaign, the se-lected concentrations of ammonium sulfate and freshly gen-erated propane soot were used to calibrate the bscat(532) andbabs(532) measurements, respectively. Details regarding thecalibration procedure are in Wang et al. (2018).
Daily PM2.5 filters were collected for the analysis of se-lected chemical species. Organic carbon (OC) and elemen-tal carbon (EC) were determined using a thermal and opti-cal carbon analyzer (Atmoslytic Inc., Calabasas, CA, USA).Water-soluble potassium ions (i.e., K+) and levoglucosanwere analyzed with the use of an ion chromatograph (DionexInc., Sunnyvale, CA, USA). The inorganic elements (i.e., S,Ca, Ti, Mn, Fe, Cu, As, Br, Pb, Zn) were measured usingan energy-dispersive X-ray fluorescence spectrometry (Ep-silon 5 ED-XRF, PANalytical B.V., Netherlands). Finally, anorganic marker of benzothiazolone was determined using ahigh-performance liquid chromatography (Series 1200, Agi-lent Technology, Santa Clara, CA). Detailed descriptions ofthe chemical analyses are given in Text S1 in the Supplement.
2.3 BC source apportionment
The aethalometer model proposed by Sandradewi etal. (2008) was optimized by excluding the babs(370)contributed by the secondary aerosols and soil dust(babs(370)secondary and babs(370)dust, respectively).
The formulae used for the aethalometer model were as fol-lows:
babs(370)fossil
babs(880)fossil=
(370880
)−AAEfossil
(1)
babs(370)biomass
babs(880)biomass=
(370880
)−AAEbiomass
(2)
babs (880)= babs(880)fossil+ babs(880)biomass (3)
babs (370)= babs(370)fossil+ babs(370)biomass
+ babs(370)secondary+ babs(370)dust, (4)
where AAEfossil and AAEbiomass are the AAEs for emis-sions of fossil fuel contribution and biomass burning. Thesewere retrieved through an optical source apportionment andare discussed in Sect. 3.1; babs(370) and babs(880) are themeasured babs at λ= 370 and 880 nm, respectively; the ab-sorption coefficients for fossil fuel are babs(370)fossil andbabs(880)fossil, while those for biomass-burning sources arebabs(370)biomass and babs(880)biomass. A source apportion-ment of the optical data was used to calculate babs(370)dustas discussed in Sect. 3.1, while babs(370)secondary was esti-mated using a BC-tracer method combined with a minimumR-squared approach as described by Wang et al. (2019a).
After obtaining babs(880)fossil and babs(880)biomass, themass concentrations of BC from fossil fuel combustion andbiomass burning (BCfossil and BCbiomass, respectively) wereestimated as follows:
BCfossil =babs(880)fossil
MACBC(880)fossil(5)
BCbiomass =babs(880)biomass
MACBC(880)biomass, (6)
where MACBC(880)fossil and MACBC(880)biomass are theMACBCs at λ= 880 nm generated from fossil fuel combus-tion and biomass burning, respectively. The MACBC(880)sfor the two sources were retrieved from a source apportion-ment of the optical data discussed in Sect. 3.1.
2.4 Optical source apportionment
Optical source apportionments were obtained using a posi-tive matrix factorization (PMF) model. The fundamental ob-jective of the PMF for applications such as ours is to resolvethe chemical mass balance by separating the data matrix intofactor contributions and factor profiles as follows:
Xij =∑p
k=1gikfkj + eij , (7)
whereXij represents the input matrix elements, p is the num-ber of sources, gik is the source contribution of the kth factor
https://doi.org/10.5194/acp-21-973-2021 Atmos. Chem. Phys., 21, 973–987, 2021
976 H. Liu et al.: Source contribution of black carbon in the southeastern margin of the Tibetan Plateau
Figure 1. Location of the Gaomeigu sampling site (red star) on the southeastern margin of the Tibetan Plateau and prevailing wind duringsampling period.
to the ith sample, fkj is the factor profile of j th species inthe kth factor, and eij is representative of the residual. Thevalues gik and fkj are non-negative. The two matrices are re-solved by minimizing the sum of squares of the normalizedresiduals as follows:
Q=∑n
i=1
∑n
j=0
[eij
uij
]2
, (8)
where Q represents the object function, and uij denotes theuncertainties in Xij . The PMF version 5.0 (PMF5.0, fromthe US EPA) was used for the analyses, and the optical pa-rameters (primary babs at different wavelengths) and chemi-cal species concentrations (including carbonaceous aerosols,inorganic elements, K+, levoglucosan and organic markers)were used as model inputs for the optical source apportion-ment.
2.5 Trajectory-related analysis
To determine the influences of regional transport on BC atGaomeigu, trajectory clusters were produced from hourly 3 dbackward-in-time air mass trajectories at 500 m above theground level. The trajectories were calculated with the Hy-brid Single-Particle Lagrangian Integrated Trajectory model(Draxler and Hess, 1998). The meteorological data werefrom the Global Data Assimilation System (GDAS; https://www.ready.noaa.gov/gdas1.php, last access: 17 April 2020),which takes into account the influences of terrain. As we fo-cused on differentiating and clustering the main spatial fea-tures of the incoming trajectories, an angle-oriented distancedefinition was adopted in the cluster analysis. Details regard-
ing the trajectory clustering methods can be found in Wanget al. (2018). For the investigations of the effects of transporton the chemical and optical properties of the BC aerosol, tra-jectories with BC mass concentration greater than the 75thpercentile were considered to be polluted.
The potential source contribution function (PSCF) wasused to identify the likely pollution regions that influencedBC loadings at Gaomeigu based on the back trajectories. Thegeographic region covered by the trajectories was overlaidby a 0.5◦× 0.5◦ (i, j ) grid. The PSCF value of each grid wascalculated as follows:
PSCFij =mij
nij, (9)
where mij is the number of endpoints associated with BCmass concentration higher than the set criterion, and nij isthe total endpoints of the ij th cell. To improve the resolu-tion of PSCF source identifications, the 75th percentile ofeach source’s BC mass concentration was set as the crite-rion for a polluted sample (i.e., 0.6 µgm−3 for BCbiomassand 0.45 µgm−3 for BCfossil) (Cheng and Lin, 2001). Fur-thermore, arbitrary weighting factors (wij ) were applied todifferent nij ranges to reduce the uncertainty caused by thesmall nij (Polissar et al., 1999), and they were defined by thefollowing the approach of Polissar et al. (2001):
Wij =
1 80<Nij0.7 20<Nij ≤ 800.42 10<Nij ≤ 200.05 Nij ≤ 10.
(10)
Atmos. Chem. Phys., 21, 973–987, 2021 https://doi.org/10.5194/acp-21-973-2021
H. Liu et al.: Source contribution of black carbon in the southeastern margin of the Tibetan Plateau 977
2.6 Regional chemical dynamical model
The Weather Research and Forecasting model coupled withchemistry (WRF-Chem) was used to quantify the contribu-tion of biomass burning from Southeast Asia to BC mass atGaomeigu. Detailed descriptions of the model configurationshave been described in our previous publication (Xing et al.,2020). Briefly, the model resolution was 3 km× 3 km, andthere were 320 grid cells. The domain included the south-west of China and southern and southeastern Asia, with acenter at 26.70◦ N, 100.03◦ E. Thirty-five vertical layers havebeen set in the model from the ground surface to 50 hPa. TheBC emission inventory used for the model was based on theAsian anthropogenic emission inventory (that is MIX) for theyear 2010 (Li et al., 2017). The inventory has a spatial resolu-tion of 0.25◦× 0.25◦, and it included industry, power, trans-portation and residential sources (e.g., fossil fuel and bio-fuel). The FINN fire inventory (Wiedinmyer et al., 2011) wasused for the biomass-burning emission during the simulation.
2.7 Estimations of direct radiative effects and heatingrate
The direct radiative effect (DRE) of source-specific BC wereestimated with the widely used Santa Barbara DISORT At-mospheric Radiative Transfer (SBDART) model, a detaileddescription of which may be found in Ricchiazzi and Yang(1998). The important input parameters include aerosol op-tical depth (AOD), light extinction coefficient (bscat+ babs),SSA, asymmetric parameter (ASP) and visibility. Here, theinput optical parameters were estimated by the Optical Prop-erty of Aerosol and Cloud (OPAC) model using Mie theory(Hess et al., 1998). The measured BC, water-soluble matter(including measured water-soluble inorganic ions and water-soluble organic matter that assumes accounting for 79 % ofOC loading; Xu et al., 2015) and water-insoluble matter (cal-culated as the PM2.5 mass concentration minus that of BCand water-soluble matter) were used in the OPAC model toretrieve the number concentrations of these particles. Thesewere tuned until the modeled bscat(λ), babs(λ) and SSA werewithin ±5 % (Srivastava et al., 2012) of the values measuredby the PAX (see Table S1 in the Supplement) and used toobtain the optical parameters at the nearest observed rela-tive humidity. The underlying assumption was that when themodeled bscat(λ) and babs(λ) were very close to their mea-sured counterparts, the derived optical parameters were areasonable representation of the measured aerosols. This as-sumption has been widely used in previous studies (Dumka etal., 2018; Panicker et al., 2010; Rajesh and Ramachandran,2018). Finally, the DREs attributable to source-specific BC(or PM2.5) at the surface atmosphere (SUF) and the top of theatmosphere (TOA) were estimated as the difference in the netflux with and without BC (or PM2.5) under cloud-free condi-tions. The solar-heating-rate change induced by atmosphericDRE (DRE at TOA subtracts DRE at SUF) was calculated as
follows (Ramachandran and Kedia, 2010):
DREATM = DRETOP−DRESUF (11)∂T
∂t=
g
Cp×
DREATM
1P, (12)
where DREATM (W m−2) is the atmospheric DRE, DRETOPis the DRE at top atmosphere, DRESUF is the DRE at surfaceatmosphere, ∂T
∂tis the heating rate (K d−1), g is the acceler-
ation due to gravity (9.8 m s−2), Cp is the specific heat ca-pacity of air at constant pressure, and1P is the difference inatmospheric pressure between the ground and 3 km above.
3 Results and discussion
3.1 Source-dependent AAEs and MACs
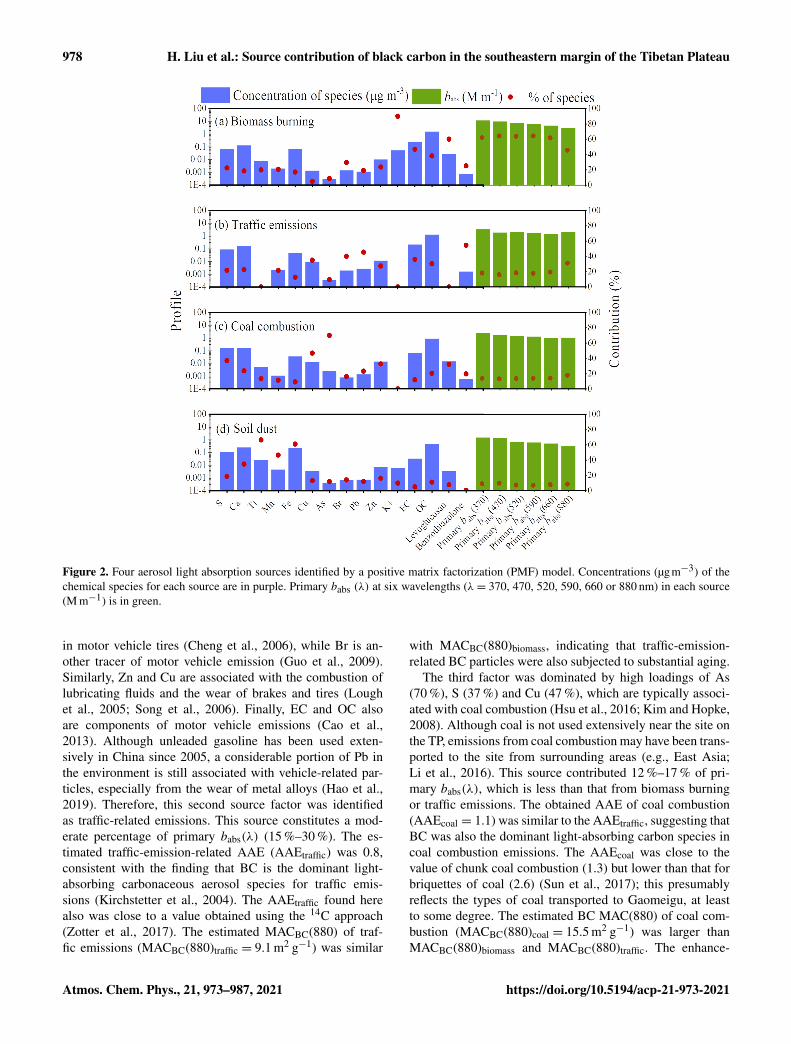
Four sources were identified as the main contributors toprimary babs(λ) based on the optical source apportionment(Fig. 2). The simulated primary babs(λ) values at differentwavelengths all correlated well (r = 0.96–0.97, p < 0.01;Fig. S1) with the model inputs, indicating that the PMF5.0performed well. As shown in Fig. 2, the first source factor ex-hibited high contributions of K+ (90 %), levoglucosan (60 %)and primary babs(λ) (45 %–64 %) as well as moderate load-ings of OC (38 %) and EC (47 %). The K+ and levoglucosanare widely used markers for biomass burning (Urban et al.,2012), and these chemical markers are strong indications thatthis factor resulted from biomass-burning emissions. Further-more, we note that the presence of BrC in this factor madehigher absorption at shorter wavelengths, which is consis-tent with absorption features of biomass-burning emissions(Forello et al., 2019).
Based on the contributions of biomass burning to babs(370)and babs(880), the AAEbiomass was estimated to be 1.7, whichis within a relative boarder range of AAEbiomass (1.2–3.5) de-termined by other methods (e.g., 14C and organic tracers) inprevious studies (Sandradewi et al., 2008; Helin et al., 2018;Harrison et al., 2012; Zotter et al., 2017). The estimated av-erage MACBC(880)biomass was 10.4 m2 g−1; this is more thantwice the value for uncoated BC particles suggested by Bondand Bergstrom (2006) (MACBC(880)uncoated = 4.7 m2 g−1,extrapolated from 550 to 880 nm by assuming AAEBC= 1.0). The large MACBC(880) indicates that BC particlesfrom biomass burning experienced substantial aging pro-cesses during their transport because numerous studies haveconfirmed that aged BC could result in MAC increases by afactor of 1.5–3.5 relative to uncoated particles (Chen et al.,2017; Ma et al., 2020) due to the “lensing effect” (Lack andCappa, 2010).
The second source factor was characterized by large load-ings of benzothiazolone (54 %), Pb (46 %), Br (40 %), Cu(35 %), Zn (27 %), EC (36 %) and OC (30 %). Benzothia-zolone is released from the breakdown of the antioxidant
https://doi.org/10.5194/acp-21-973-2021 Atmos. Chem. Phys., 21, 973–987, 2021
978 H. Liu et al.: Source contribution of black carbon in the southeastern margin of the Tibetan Plateau
Figure 2. Four aerosol light absorption sources identified by a positive matrix factorization (PMF) model. Concentrations (µgm−3) of thechemical species for each source are in purple. Primary babs (λ) at six wavelengths (λ= 370, 470, 520, 590, 660 or 880 nm) in each source(M m−1) is in green.
in motor vehicle tires (Cheng et al., 2006), while Br is an-other tracer of motor vehicle emission (Guo et al., 2009).Similarly, Zn and Cu are associated with the combustion oflubricating fluids and the wear of brakes and tires (Loughet al., 2005; Song et al., 2006). Finally, EC and OC alsoare components of motor vehicle emissions (Cao et al.,2013). Although unleaded gasoline has been used exten-sively in China since 2005, a considerable portion of Pb inthe environment is still associated with vehicle-related par-ticles, especially from the wear of metal alloys (Hao et al.,2019). Therefore, this second source factor was identifiedas traffic-related emissions. This source constitutes a mod-erate percentage of primary babs(λ) (15 %–30 %). The es-timated traffic-emission-related AAE (AAEtraffic) was 0.8,consistent with the finding that BC is the dominant light-absorbing carbonaceous aerosol species for traffic emis-sions (Kirchstetter et al., 2004). The AAEtraffic found herealso was close to a value obtained using the 14C approach(Zotter et al., 2017). The estimated MACBC(880) of traf-fic emissions (MACBC(880)traffic = 9.1 m2 g−1) was similar
with MACBC(880)biomass, indicating that traffic-emission-related BC particles were also subjected to substantial aging.
The third factor was dominated by high loadings of As(70 %), S (37 %) and Cu (47 %), which are typically associ-ated with coal combustion (Hsu et al., 2016; Kim and Hopke,2008). Although coal is not used extensively near the site onthe TP, emissions from coal combustion may have been trans-ported to the site from surrounding areas (e.g., East Asia;Li et al., 2016). This source contributed 12 %–17 % of pri-mary babs(λ), which is less than that from biomass burningor traffic emissions. The obtained AAE of coal combustion(AAEcoal = 1.1) was similar to the AAEtraffic, suggesting thatBC was also the dominant light-absorbing carbon species incoal combustion emissions. The AAEcoal was close to thevalue of chunk coal combustion (1.3) but lower than that forbriquettes of coal (2.6) (Sun et al., 2017); this presumablyreflects the types of coal transported to Gaomeigu, at leastto some degree. The estimated BC MAC(880) of coal com-bustion (MACBC(880)coal = 15.5 m2 g−1) was larger thanMACBC(880)biomass and MACBC(880)traffic. The enhance-
Atmos. Chem. Phys., 21, 973–987, 2021 https://doi.org/10.5194/acp-21-973-2021
H. Liu et al.: Source contribution of black carbon in the southeastern margin of the Tibetan Plateau 979
ment factor for MACBC(880)coal (3.3) falls near the up-per limit of this range noted above, and although this islikely related to the aging of BC particles during transportto Gaomeigu, more work is need to verify this contention infuture studies.
The fourth source factor had high loadings of Ca (35 %),Ti (66 %), Mn (47 %) and Fe (61 %), consistent with the char-acteristics of crustal elements (Guo et al., 2009); thus, it wasassigned to soil dust. The light absorption of soil dust ismainly due to the presence of iron oxides and varies with thetypes and relative concentrations of iron oxide species (Al-faro, 2004; Valenzuela et al., 2015). The mineral dust herecontributed a relatively small amount to the primary babs(λ)
(6 %–9 %), presumably due to the low levels of iron oxides,and this is consistent with the other results obtained on thesoutheastern TP (Zhao et al., 2019). The estimated AAE ofmineral dust (AAEdust) was 1.5, which is within the range of1.2–3.0 obtained from multiple non-oceanic sites (Duboviket al., 2002).
3.2 BC source apportionment
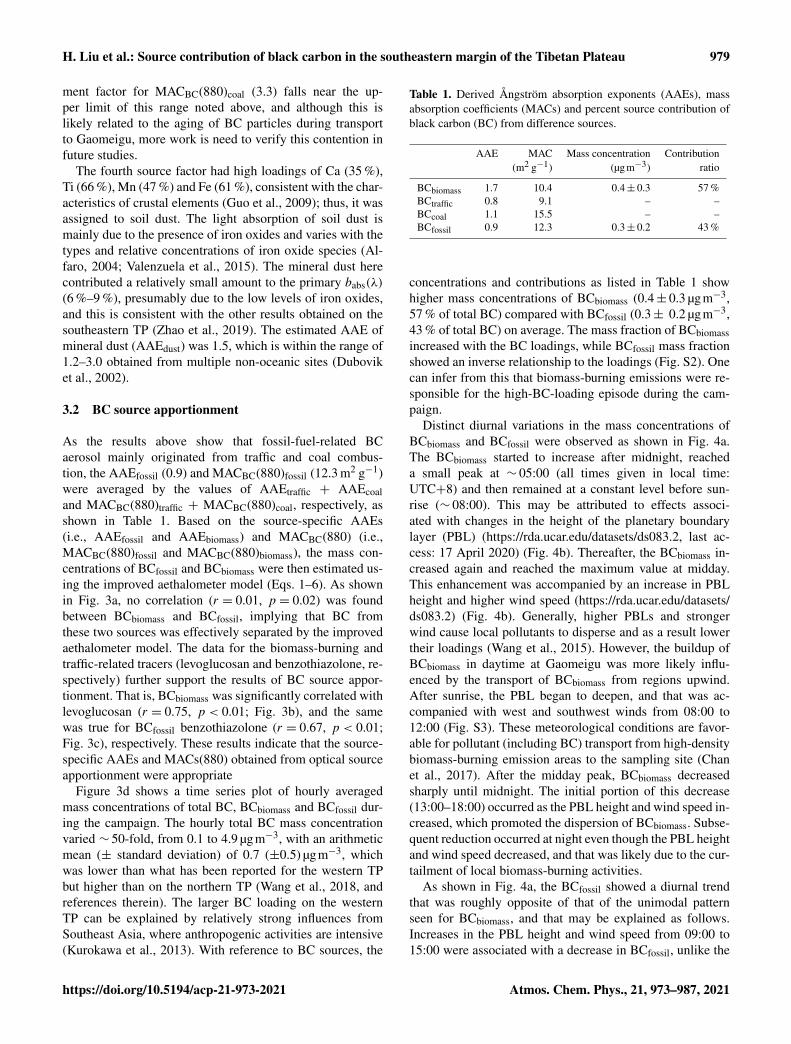
As the results above show that fossil-fuel-related BCaerosol mainly originated from traffic and coal combus-tion, the AAEfossil (0.9) and MACBC(880)fossil (12.3 m2 g−1)were averaged by the values of AAEtraffic + AAEcoaland MACBC(880)traffic + MACBC(880)coal, respectively, asshown in Table 1. Based on the source-specific AAEs(i.e., AAEfossil and AAEbiomass) and MACBC(880) (i.e.,MACBC(880)fossil and MACBC(880)biomass), the mass con-centrations of BCfossil and BCbiomass were then estimated us-ing the improved aethalometer model (Eqs. 1–6). As shownin Fig. 3a, no correlation (r = 0.01, p = 0.02) was foundbetween BCbiomass and BCfossil, implying that BC fromthese two sources was effectively separated by the improvedaethalometer model. The data for the biomass-burning andtraffic-related tracers (levoglucosan and benzothiazolone, re-spectively) further support the results of BC source appor-tionment. That is, BCbiomass was significantly correlated withlevoglucosan (r = 0.75, p < 0.01; Fig. 3b), and the samewas true for BCfossil benzothiazolone (r = 0.67, p < 0.01;Fig. 3c), respectively. These results indicate that the source-specific AAEs and MACs(880) obtained from optical sourceapportionment were appropriate
Figure 3d shows a time series plot of hourly averagedmass concentrations of total BC, BCbiomass and BCfossil dur-ing the campaign. The hourly total BC mass concentrationvaried ∼ 50-fold, from 0.1 to 4.9 µgm−3, with an arithmeticmean (± standard deviation) of 0.7 (±0.5) µgm−3, whichwas lower than what has been reported for the western TPbut higher than on the northern TP (Wang et al., 2018, andreferences therein). The larger BC loading on the westernTP can be explained by relatively strong influences fromSoutheast Asia, where anthropogenic activities are intensive(Kurokawa et al., 2013). With reference to BC sources, the
Table 1. Derived Ångström absorption exponents (AAEs), massabsorption coefficients (MACs) and percent source contribution ofblack carbon (BC) from difference sources.
AAE MAC Mass concentration Contribution(m2 g−1) (µgm−3) ratio
BCbiomass 1.7 10.4 0.4± 0.3 57 %BCtraffic 0.8 9.1 – –BCcoal 1.1 15.5 – –BCfossil 0.9 12.3 0.3± 0.2 43 %
concentrations and contributions as listed in Table 1 showhigher mass concentrations of BCbiomass (0.4± 0.3 µgm−3,57 % of total BC) compared with BCfossil (0.3± 0.2 µgm−3,43 % of total BC) on average. The mass fraction of BCbiomassincreased with the BC loadings, while BCfossil mass fractionshowed an inverse relationship to the loadings (Fig. S2). Onecan infer from this that biomass-burning emissions were re-sponsible for the high-BC-loading episode during the cam-paign.
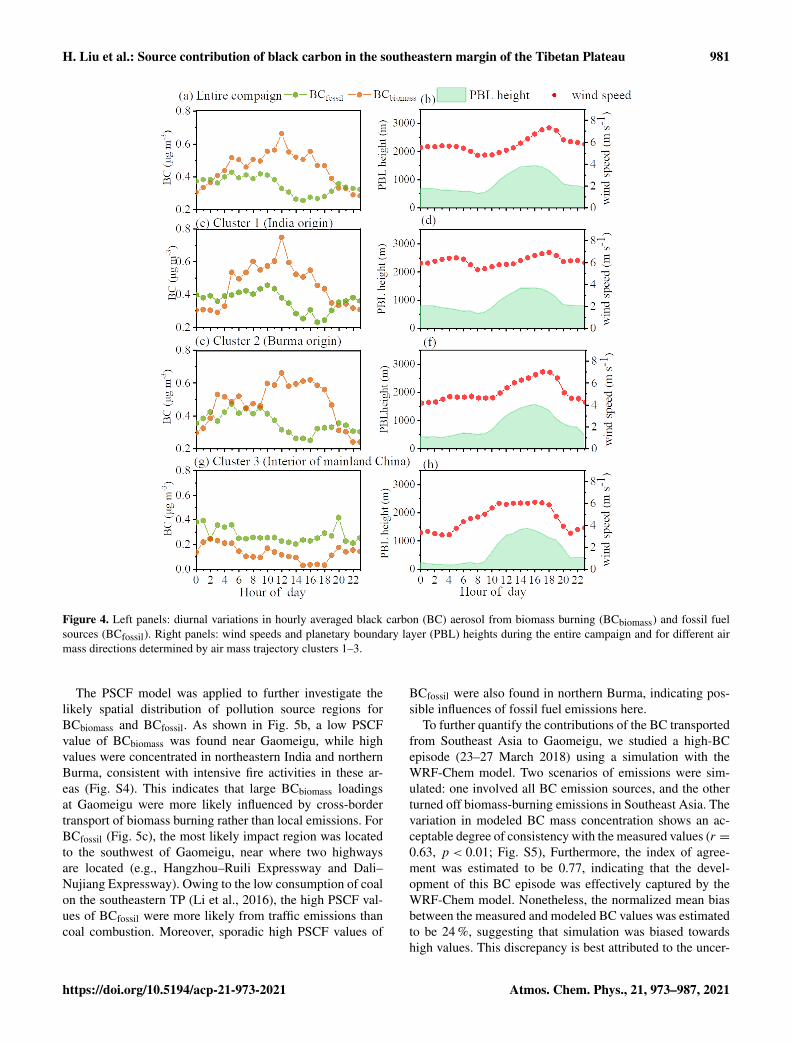
Distinct diurnal variations in the mass concentrations ofBCbiomass and BCfossil were observed as shown in Fig. 4a.The BCbiomass started to increase after midnight, reacheda small peak at ∼ 05:00 (all times given in local time:UTC+8) and then remained at a constant level before sun-rise (∼ 08:00). This may be attributed to effects associ-ated with changes in the height of the planetary boundarylayer (PBL) (https://rda.ucar.edu/datasets/ds083.2, last ac-cess: 17 April 2020) (Fig. 4b). Thereafter, the BCbiomass in-creased again and reached the maximum value at midday.This enhancement was accompanied by an increase in PBLheight and higher wind speed (https://rda.ucar.edu/datasets/ds083.2) (Fig. 4b). Generally, higher PBLs and strongerwind cause local pollutants to disperse and as a result lowertheir loadings (Wang et al., 2015). However, the buildup ofBCbiomass in daytime at Gaomeigu was more likely influ-enced by the transport of BCbiomass from regions upwind.After sunrise, the PBL began to deepen, and that was ac-companied with west and southwest winds from 08:00 to12:00 (Fig. S3). These meteorological conditions are favor-able for pollutant (including BC) transport from high-densitybiomass-burning emission areas to the sampling site (Chanet al., 2017). After the midday peak, BCbiomass decreasedsharply until midnight. The initial portion of this decrease(13:00–18:00) occurred as the PBL height and wind speed in-creased, which promoted the dispersion of BCbiomass. Subse-quent reduction occurred at night even though the PBL heightand wind speed decreased, and that was likely due to the cur-tailment of local biomass-burning activities.
As shown in Fig. 4a, the BCfossil showed a diurnal trendthat was roughly opposite of that of the unimodal patternseen for BCbiomass, and that may be explained as follows.Increases in the PBL height and wind speed from 09:00 to15:00 were associated with a decrease in BCfossil, unlike the
https://doi.org/10.5194/acp-21-973-2021 Atmos. Chem. Phys., 21, 973–987, 2021
980 H. Liu et al.: Source contribution of black carbon in the southeastern margin of the Tibetan Plateau
Figure 3. Scatterplots of (a) biomass-burning black carbon (BCbiomass) versus fossil fuel combustion BC (BCfossil), (b) BCbiomass versuslevoglucosan and (c) BCfossil versus benzothiazolone. (d) Time series of hourly averaged mass concentrations of BCbiomass and BCfossil.
increasing trend seen for BCbiomass; this presumably reflectsminor effects from the regional transport on BCfossil. Fur-ther, because of the small contribution of coal combustionto EC (12 %; Fig. 2c), the BCfossil was best explained bymotor vehicle emissions from areas upwind of the site. Thesubsequent increase in BCfossil from 17:00 to 20:00 was at-tributed to the reduction in PBL height and as a result thebuildup of pollutants in the near-surface air. As there wereminimal impacts from traffic at night, the BCfossil loadingsremained steady from 21:00 to 08:00. The stable nocturnalBCfossil may reflect the impact of fossil fuel emissions on BCin the southeastern margin of the TP due to the accumulationresulting from the low PBL heights.
3.3 Regional influences of BCbiomass and BCfossil
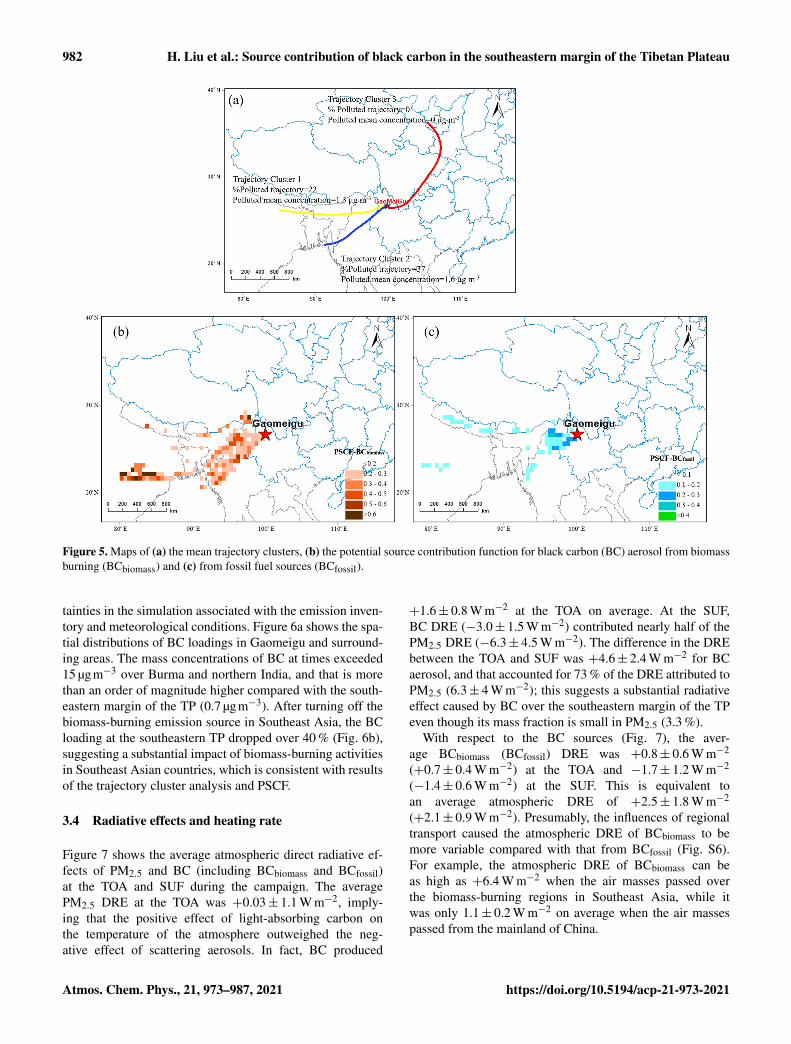
To investigate the regional impacts on BC, three groups ofair masses were identified based on their transport pathways(Fig. 5a). Cluster 1 originated from northeastern India andthen passed over Bangladesh before arriving at Gaomeigu.The average BC mass concentration of this cluster was thehighest (0.8± 0.4 µgm−3) of the three clusters. About 74 %of total trajectories were associated with Cluster 1, of which22 % were identified as polluted and had an average BC load-ing of 1.3± 0.5 µg m−3. Cluster 2 originated over Burma andhad an average BC loading of 0.7± 0.7 µgm−3. This clus-ter accounted for only 24 % of total trajectories, but amongthem, about 37 % referred to pollution with BC reachingas high as 1.6± 0.9 µgm−3. The air masses associated withCluster 3 originated from the interior of China, and this grouphad the lowest BC mass concentrations of the three clus-ters: 0.4± 0.1 µgm−3. This third cluster was composed ofa small fraction of total trajectories (2 %), and none of them
were identified as polluted, suggesting minor influences frommainland China during the campaign.
The diurnal patterns of BCbiomass and BCfossil mass load-ings from the three clusters were used to investigate the im-pacts of regional transport. As shown in Fig. 4c and e, sim-ilar diurnal variations in BCbiomass were found for Clusters1 and 2; they both had larger values during daytime (8:00–12:00) compared with night. This pattern of higher daytimeBCbiomass was associated with regional transport from north-eastern India (Cluster 1) and Burma (Cluster 2). For Clus-ter 3, BCbiomass decreased during the day and increased atnight (Fig. 4g), and that pattern tracked the daily variationsin PBL height. Unlike Clusters 1 and 2, the diurnal varia-tion in BCbiomass for Cluster 3 was more likely due to influ-ences of biomass-burning activities from areas surroundingthe sampling site than regional transport. However, it shouldbe noted that these cases were uncommon because only 2 %of air masses were associated with Cluster 3.
For BCfossil, similar diurnal patterns were found for Clus-ters 1 and 2 (Fig. 4c and e), most likely due to the influencesof traffic emissions from surrounding areas as well as dailycycles of PBL height as discussed in Sect. 3.2. The BCfossilloadings of Cluster 3 (Fig. 4g) were relatively stable, show-ing only sporadic fluctuations. Unlike the declining trend ofBCfossil during the daytime found for Clusters 1 and 2, therelatively stable BCfossil loadings in Cluster 3 indicate thatthere were emissions from fossil fuel sources that offset theeffect of the changes in PBL height. The transportation sec-tor has grown rapidly in mainland China (Liu, 2019), and theregional transport of motor vehicle emissions may have beenthe cause for the observed diurnal variations in BCfossil forCluster 3.
Atmos. Chem. Phys., 21, 973–987, 2021 https://doi.org/10.5194/acp-21-973-2021
H. Liu et al.: Source contribution of black carbon in the southeastern margin of the Tibetan Plateau 981
Figure 4. Left panels: diurnal variations in hourly averaged black carbon (BC) aerosol from biomass burning (BCbiomass) and fossil fuelsources (BCfossil). Right panels: wind speeds and planetary boundary layer (PBL) heights during the entire campaign and for different airmass directions determined by air mass trajectory clusters 1–3.
The PSCF model was applied to further investigate thelikely spatial distribution of pollution source regions forBCbiomass and BCfossil. As shown in Fig. 5b, a low PSCFvalue of BCbiomass was found near Gaomeigu, while highvalues were concentrated in northeastern India and northernBurma, consistent with intensive fire activities in these ar-eas (Fig. S4). This indicates that large BCbiomass loadingsat Gaomeigu were more likely influenced by cross-bordertransport of biomass burning rather than local emissions. ForBCfossil (Fig. 5c), the most likely impact region was locatedto the southwest of Gaomeigu, near where two highwaysare located (e.g., Hangzhou–Ruili Expressway and Dali–Nujiang Expressway). Owing to the low consumption of coalon the southeastern TP (Li et al., 2016), the high PSCF val-ues of BCfossil were more likely from traffic emissions thancoal combustion. Moreover, sporadic high PSCF values of
BCfossil were also found in northern Burma, indicating pos-sible influences of fossil fuel emissions here.
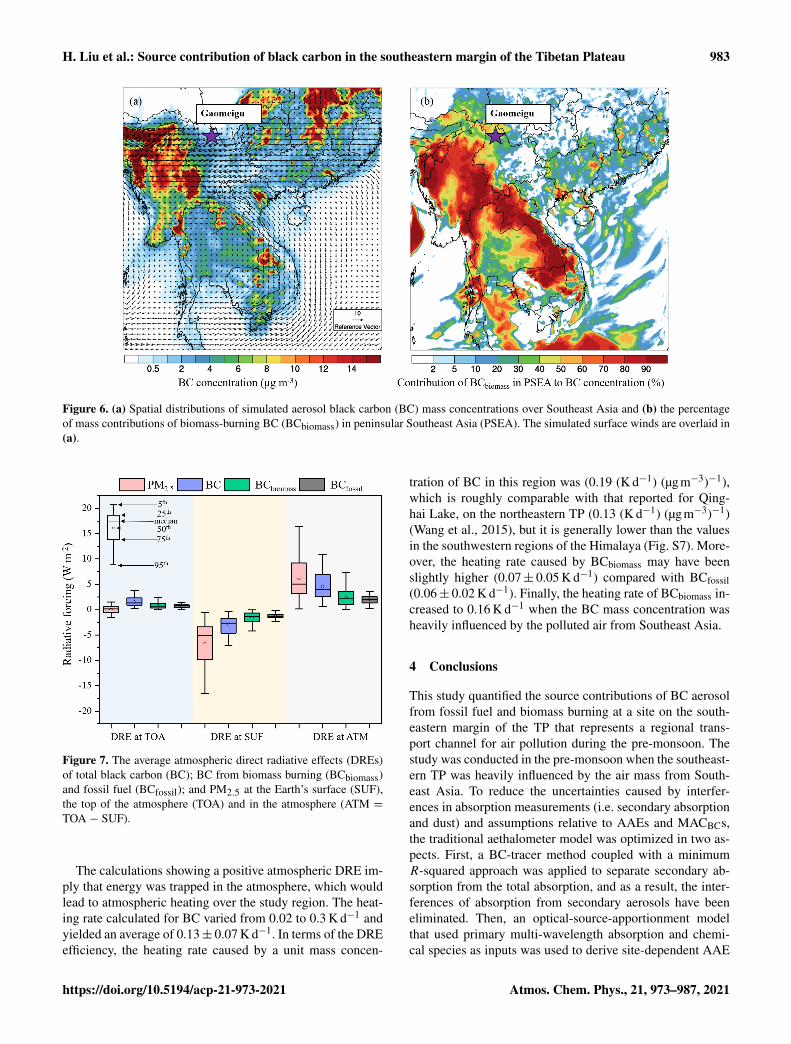
To further quantify the contributions of the BC transportedfrom Southeast Asia to Gaomeigu, we studied a high-BCepisode (23–27 March 2018) using a simulation with theWRF-Chem model. Two scenarios of emissions were sim-ulated: one involved all BC emission sources, and the otherturned off biomass-burning emissions in Southeast Asia. Thevariation in modeled BC mass concentration shows an ac-ceptable degree of consistency with the measured values (r =0.63, p < 0.01; Fig. S5), Furthermore, the index of agree-ment was estimated to be 0.77, indicating that the devel-opment of this BC episode was effectively captured by theWRF-Chem model. Nonetheless, the normalized mean biasbetween the measured and modeled BC values was estimatedto be 24 %, suggesting that simulation was biased towardshigh values. This discrepancy is best attributed to the uncer-
https://doi.org/10.5194/acp-21-973-2021 Atmos. Chem. Phys., 21, 973–987, 2021
982 H. Liu et al.: Source contribution of black carbon in the southeastern margin of the Tibetan Plateau
Figure 5. Maps of (a) the mean trajectory clusters, (b) the potential source contribution function for black carbon (BC) aerosol from biomassburning (BCbiomass) and (c) from fossil fuel sources (BCfossil).
tainties in the simulation associated with the emission inven-tory and meteorological conditions. Figure 6a shows the spa-tial distributions of BC loadings in Gaomeigu and surround-ing areas. The mass concentrations of BC at times exceeded15 µgm−3 over Burma and northern India, and that is morethan an order of magnitude higher compared with the south-eastern margin of the TP (0.7 µgm−3). After turning off thebiomass-burning emission source in Southeast Asia, the BCloading at the southeastern TP dropped over 40 % (Fig. 6b),suggesting a substantial impact of biomass-burning activitiesin Southeast Asian countries, which is consistent with resultsof the trajectory cluster analysis and PSCF.
3.4 Radiative effects and heating rate
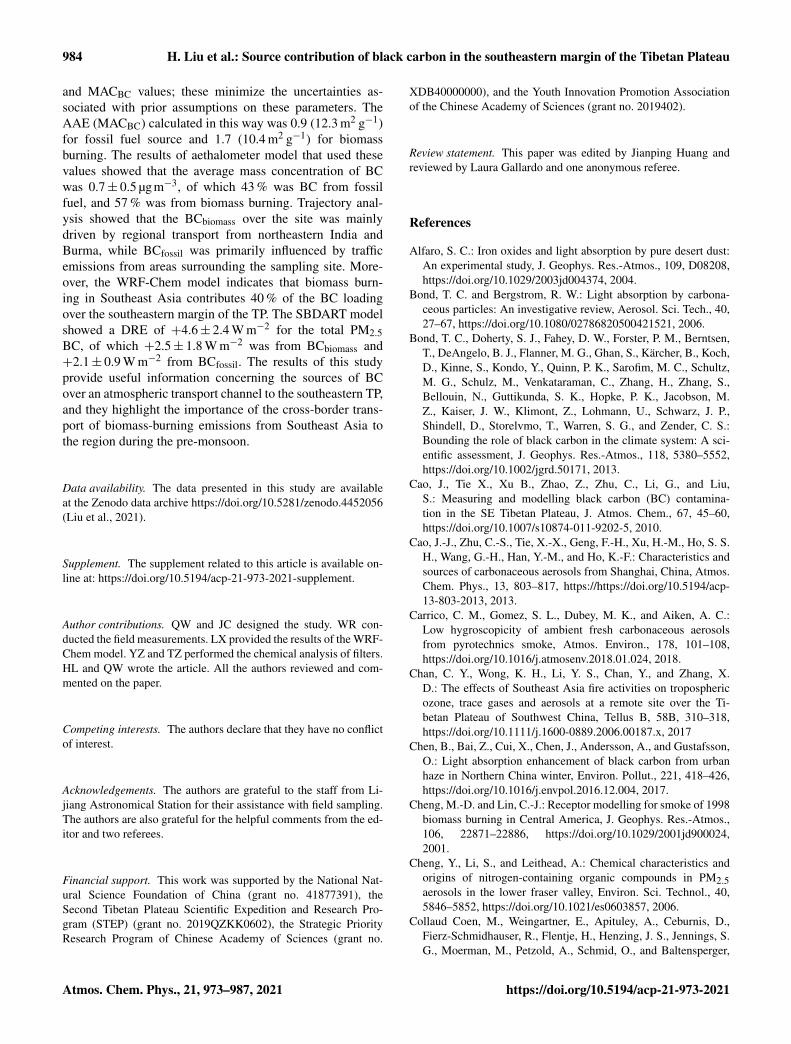
Figure 7 shows the average atmospheric direct radiative ef-fects of PM2.5 and BC (including BCbiomass and BCfossil)at the TOA and SUF during the campaign. The averagePM2.5 DRE at the TOA was +0.03± 1.1 W m−2, imply-ing that the positive effect of light-absorbing carbon onthe temperature of the atmosphere outweighed the neg-ative effect of scattering aerosols. In fact, BC produced
+1.6± 0.8 W m−2 at the TOA on average. At the SUF,BC DRE (−3.0± 1.5 W m−2) contributed nearly half of thePM2.5 DRE (−6.3± 4.5 W m−2). The difference in the DREbetween the TOA and SUF was +4.6± 2.4 W m−2 for BCaerosol, and that accounted for 73 % of the DRE attributed toPM2.5 (6.3± 4 W m−2); this suggests a substantial radiativeeffect caused by BC over the southeastern margin of the TPeven though its mass fraction is small in PM2.5 (3.3 %).
With respect to the BC sources (Fig. 7), the aver-age BCbiomass (BCfossil) DRE was +0.8± 0.6 W m−2
(+0.7± 0.4 W m−2) at the TOA and −1.7± 1.2 W m−2
(−1.4± 0.6 W m−2) at the SUF. This is equivalent toan average atmospheric DRE of +2.5± 1.8 W m−2
(+2.1± 0.9 W m−2). Presumably, the influences of regionaltransport caused the atmospheric DRE of BCbiomass to bemore variable compared with that from BCfossil (Fig. S6).For example, the atmospheric DRE of BCbiomass can beas high as +6.4 W m−2 when the air masses passed overthe biomass-burning regions in Southeast Asia, while itwas only 1.1± 0.2 W m−2 on average when the air massespassed from the mainland of China.
Atmos. Chem. Phys., 21, 973–987, 2021 https://doi.org/10.5194/acp-21-973-2021
H. Liu et al.: Source contribution of black carbon in the southeastern margin of the Tibetan Plateau 983
Figure 6. (a) Spatial distributions of simulated aerosol black carbon (BC) mass concentrations over Southeast Asia and (b) the percentageof mass contributions of biomass-burning BC (BCbiomass) in peninsular Southeast Asia (PSEA). The simulated surface winds are overlaid in(a).
Figure 7. The average atmospheric direct radiative effects (DREs)of total black carbon (BC); BC from biomass burning (BCbiomass)and fossil fuel (BCfossil); and PM2.5 at the Earth’s surface (SUF),the top of the atmosphere (TOA) and in the atmosphere (ATM =TOA − SUF).
The calculations showing a positive atmospheric DRE im-ply that energy was trapped in the atmosphere, which wouldlead to atmospheric heating over the study region. The heat-ing rate calculated for BC varied from 0.02 to 0.3 K d−1 andyielded an average of 0.13± 0.07 K d−1. In terms of the DREefficiency, the heating rate caused by a unit mass concen-
tration of BC in this region was (0.19 (K d−1) (µgm−3)−1),which is roughly comparable with that reported for Qing-hai Lake, on the northeastern TP (0.13 (K d−1) (µgm−3)−1)(Wang et al., 2015), but it is generally lower than the valuesin the southwestern regions of the Himalaya (Fig. S7). More-over, the heating rate caused by BCbiomass may have beenslightly higher (0.07± 0.05 K d−1) compared with BCfossil(0.06± 0.02 K d−1). Finally, the heating rate of BCbiomass in-creased to 0.16 K d−1 when the BC mass concentration washeavily influenced by the polluted air from Southeast Asia.
4 Conclusions
This study quantified the source contributions of BC aerosolfrom fossil fuel and biomass burning at a site on the south-eastern margin of the TP that represents a regional trans-port channel for air pollution during the pre-monsoon. Thestudy was conducted in the pre-monsoon when the southeast-ern TP was heavily influenced by the air mass from South-east Asia. To reduce the uncertainties caused by interfer-ences in absorption measurements (i.e. secondary absorptionand dust) and assumptions relative to AAEs and MACBCs,the traditional aethalometer model was optimized in two as-pects. First, a BC-tracer method coupled with a minimumR-squared approach was applied to separate secondary ab-sorption from the total absorption, and as a result, the inter-ferences of absorption from secondary aerosols have beeneliminated. Then, an optical-source-apportionment modelthat used primary multi-wavelength absorption and chemi-cal species as inputs was used to derive site-dependent AAE
https://doi.org/10.5194/acp-21-973-2021 Atmos. Chem. Phys., 21, 973–987, 2021
984 H. Liu et al.: Source contribution of black carbon in the southeastern margin of the Tibetan Plateau
and MACBC values; these minimize the uncertainties as-sociated with prior assumptions on these parameters. TheAAE (MACBC) calculated in this way was 0.9 (12.3 m2 g−1)for fossil fuel source and 1.7 (10.4 m2 g−1) for biomassburning. The results of aethalometer model that used thesevalues showed that the average mass concentration of BCwas 0.7± 0.5 µgm−3, of which 43 % was BC from fossilfuel, and 57 % was from biomass burning. Trajectory anal-ysis showed that the BCbiomass over the site was mainlydriven by regional transport from northeastern India andBurma, while BCfossil was primarily influenced by trafficemissions from areas surrounding the sampling site. More-over, the WRF-Chem model indicates that biomass burn-ing in Southeast Asia contributes 40 % of the BC loadingover the southeastern margin of the TP. The SBDART modelshowed a DRE of +4.6± 2.4 W m−2 for the total PM2.5BC, of which +2.5± 1.8 W m−2 was from BCbiomass and+2.1± 0.9 W m−2 from BCfossil. The results of this studyprovide useful information concerning the sources of BCover an atmospheric transport channel to the southeastern TP,and they highlight the importance of the cross-border trans-port of biomass-burning emissions from Southeast Asia tothe region during the pre-monsoon.
Data availability. The data presented in this study are availableat the Zenodo data archive https://doi.org/10.5281/zenodo.4452056(Liu et al., 2021).
Supplement. The supplement related to this article is available on-line at: https://doi.org/10.5194/acp-21-973-2021-supplement.
Author contributions. QW and JC designed the study. WR con-ducted the field measurements. LX provided the results of the WRF-Chem model. YZ and TZ performed the chemical analysis of filters.HL and QW wrote the article. All the authors reviewed and com-mented on the paper.
Competing interests. The authors declare that they have no conflictof interest.
Acknowledgements. The authors are grateful to the staff from Li-jiang Astronomical Station for their assistance with field sampling.The authors are also grateful for the helpful comments from the ed-itor and two referees.
Financial support. This work was supported by the National Nat-ural Science Foundation of China (grant no. 41877391), theSecond Tibetan Plateau Scientific Expedition and Research Pro-gram (STEP) (grant no. 2019QZKK0602), the Strategic PriorityResearch Program of Chinese Academy of Sciences (grant no.
XDB40000000), and the Youth Innovation Promotion Associationof the Chinese Academy of Sciences (grant no. 2019402).
Review statement. This paper was edited by Jianping Huang andreviewed by Laura Gallardo and one anonymous referee.
References
Alfaro, S. C.: Iron oxides and light absorption by pure desert dust:An experimental study, J. Geophys. Res.-Atmos., 109, D08208,https://doi.org/10.1029/2003jd004374, 2004.
Bond, T. C. and Bergstrom, R. W.: Light absorption by carbona-ceous particles: An investigative review, Aerosol. Sci. Tech., 40,27–67, https://doi.org/10.1080/02786820500421521, 2006.
Bond, T. C., Doherty, S. J., Fahey, D. W., Forster, P. M., Berntsen,T., DeAngelo, B. J., Flanner, M. G., Ghan, S., Kärcher, B., Koch,D., Kinne, S., Kondo, Y., Quinn, P. K., Sarofim, M. C., Schultz,M. G., Schulz, M., Venkataraman, C., Zhang, H., Zhang, S.,Bellouin, N., Guttikunda, S. K., Hopke, P. K., Jacobson, M.Z., Kaiser, J. W., Klimont, Z., Lohmann, U., Schwarz, J. P.,Shindell, D., Storelvmo, T., Warren, S. G., and Zender, C. S.:Bounding the role of black carbon in the climate system: A sci-entific assessment, J. Geophys. Res.-Atmos., 118, 5380–5552,https://doi.org/10.1002/jgrd.50171, 2013.
Cao, J., Tie X., Xu B., Zhao, Z., Zhu, C., Li, G., and Liu,S.: Measuring and modelling black carbon (BC) contamina-tion in the SE Tibetan Plateau, J. Atmos. Chem., 67, 45–60,https://doi.org/10.1007/s10874-011-9202-5, 2010.
Cao, J.-J., Zhu, C.-S., Tie, X.-X., Geng, F.-H., Xu, H.-M., Ho, S. S.H., Wang, G.-H., Han, Y.-M., and Ho, K.-F.: Characteristics andsources of carbonaceous aerosols from Shanghai, China, Atmos.Chem. Phys., 13, 803–817, https://https://doi.org/10.5194/acp-13-803-2013, 2013.
Carrico, C. M., Gomez, S. L., Dubey, M. K., and Aiken, A. C.:Low hygroscopicity of ambient fresh carbonaceous aerosolsfrom pyrotechnics smoke, Atmos. Environ., 178, 101–108,https://doi.org/10.1016/j.atmosenv.2018.01.024, 2018.
Chan, C. Y., Wong, K. H., Li, Y. S., Chan, Y., and Zhang, X.D.: The effects of Southeast Asia fire activities on troposphericozone, trace gases and aerosols at a remote site over the Ti-betan Plateau of Southwest China, Tellus B, 58B, 310–318,https://doi.org/10.1111/j.1600-0889.2006.00187.x, 2017
Chen, B., Bai, Z., Cui, X., Chen, J., Andersson, A., and Gustafsson,O.: Light absorption enhancement of black carbon from urbanhaze in Northern China winter, Environ. Pollut., 221, 418–426,https://doi.org/10.1016/j.envpol.2016.12.004, 2017.
Cheng, M.-D. and Lin, C.-J.: Receptor modelling for smoke of 1998biomass burning in Central America, J. Geophys. Res.-Atmos.,106, 22871–22886, https://doi.org/10.1029/2001jd900024,2001.
Cheng, Y., Li, S., and Leithead, A.: Chemical characteristics andorigins of nitrogen-containing organic compounds in PM2.5aerosols in the lower fraser valley, Environ. Sci. Technol., 40,5846–5852, https://doi.org/10.1021/es0603857, 2006.
Collaud Coen, M., Weingartner, E., Apituley, A., Ceburnis, D.,Fierz-Schmidhauser, R., Flentje, H., Henzing, J. S., Jennings, S.G., Moerman, M., Petzold, A., Schmid, O., and Baltensperger,
Atmos. Chem. Phys., 21, 973–987, 2021 https://doi.org/10.5194/acp-21-973-2021
H. Liu et al.: Source contribution of black carbon in the southeastern margin of the Tibetan Plateau 985
U.: Minimizing light absorption measurement artifacts of theAethalometer: evaluation of five correction algorithms, Atmos.Meas. Tech., 3, 457–474, https://https://doi.org/10.5194/amt-3-457-2010, 2010.
Cong, Z., Kang, S., Kawamura, K., Liu, B., Wan, X., Wang,Z., Gao, S., and Fu, P.: Carbonaceous aerosols on thesouth edge of the Tibetan Plateau: concentrations, season-ality and sources, Atmos. Chem. Phys., 15, 1573–1584,https://https://doi.org/10.5194/acp-15-1573-2015, 2015.
Draxler, R. and Hess, G.: An overview of the HYSPLIT_4 mod-elling system for trajectories, Aust. Meteorol. Mag., 47, 295–308, 1998.
Drinovec, L., Mocnik, G., Zotter, P., Prévôt, A. S. H., Ruck-stuhl, C., Coz, E., Rupakheti, M., Sciare, J., Müller, T., Wieden-sohler, A., and Hansen, A. D. A.: The “dual-spot” Aethalome-ter: an improved measurement of aerosol black carbon with real-time loading compensation, Atmos. Meas. Tech., 8, 1965–1979,https://https://doi.org/10.5194/amt-8-1965-2015, 2015.
Dubovik, O., Holben, B., Eck, T. F., Smirnov, A., Kauf-man, Y. J., King, M. D., Tanré, D., and Slutsker, I.:Variability of absorption and optical properties of keyaerosol types observed in worldwide locations, J. At-mos. Sci., 59, 590–608, https://doi.org/10.1175/1520-0469(2002)059<0590:VOAAOP>2.0.CO;2, 2002.
Dumka, U. C., Kaskaoutis, D. G., Tiwari, S., Safai, P. D., Attri, S.D., Soni, V. K., Singh, N., and Mihalopoulos, N.: Assessmentof biomass burning and fossil fuel contribution to black carbonconcentrations in Delhi during winter, Atmos. Environ., 194, 93–109, https://doi.org/10.1016/j.atmosenv.2018.09.033, 2018.
Forello, A. C., Bernardoni, V., Calzolai, G., Lucarelli, F., Massabò,D., Nava, S., Pileci, R. E., Prati, P., Valentini, S., Valli, G., andVecchi, R.: Exploiting multi-wavelength aerosol absorption coef-ficients in a multi-time resolution source apportionment study toretrieve source-dependent absorption parameters, Atmos. Chem.Phys., 19, 11235–11252, https://https://doi.org/10.5194/acp-19-11235-2019, 2019.
Guo, H., Ding, A. J., So, K. L., Ayoko, G., Li, Y. S.,and Hung, W. T.: Receptor modelling of source apportion-ment of Hong Kong aerosols and the implication of urbanand regional contribution, Atmos. Environ., 43, 1159–1169,https://doi.org/10.1016/j.atmosenv.2008.04.046, 2009.
Han, H., Wu, Y., Liu, J., Zhao, T., Zhuang, B., Wang, H., Li, Y.,Chen, H., Zhu, Y., Liu, H., Wang, Q., Li, S., Wang, T., Xie,M., and Li, M.: Impacts of atmospheric transport and biomassburning on the inter-annual variation in black carbon aerosolsover the Tibetan Plateau, Atmos. Chem. Phys., 20, 13591–13610,https://doi.org/10.5194/acp-20-13591-2020, 2020.
Hao, Y., Gao, C., Deng, S., Yuan, M., Song, W., Lu, Z.,and Qiu, Z.: Chemical characterisation of PM2.5 emittedfrom motor vehicles powered by diesel, gasoline, naturalgas and methanol fuel, Sci. Total Environ., 674, 128–139,https://doi.org/10.1016/j.scitotenv.2019.03.410, 2019.
Harrison, R. M., Beddows, D. C. S., Hu, L., and Yin, J.: Compar-ison of methods for evaluation of wood smoke and estimationof UK ambient concentrations, Atmos. Chem. Phys., 12, 8271–8283, https://doi.org/10.5194/acp-12-8271-2012, 2012.
Healy, R. M., Sofowote, U., Su, Y., Debosz, J., Noble, M.,Jeong, C. H., Wang, J. M., Hilker, N., Evans, G. J., Doerk-sen, G., Jones, K., and Munoz, A.: Ambient measurements
and source apportionment of fossil fuel and biomass burn-ing black carbon in Ontario, Atmos. Environ., 161, 34–47,https://doi.org/10.1016/j.atmosenv.2017.04.034, 2017.
Helin, A., Niemi, J. V., Virkkula, A., Pirjola, L., Teinilä,K., Backman, J., Aurela, M., Saarikoski, S., Rönkkö,T., Asmi, E., and Timonen, H.: Characteristics andsource apportionment of black carbon in the Helsinkimetropolitan area, Finland, Atmos. Environ., 190, 87–98,https://doi.org/10.1016/j.atmosenv.2018.07.022, 2018.
Herich, H., Hueglin, C., and Burchmann, B.: A 2.5 year’s source ap-portionment study of black carbon from wood burning and fossilfuel combustion at urban and rural sites in Switzerland, Atmos.Meas. Tech., 4, 1409–1420, https://doi.org/10.5194/amt-4-1409-2011, 2011.
Hess, M., Koepke, P., and Schult, I.: Optical properties ofaerosols and clouds: The software package OPAC, B. Am.Meteorol. Soc., 79, 831–844, https://doi.org/10.1175/1520-0477(1998)079<0831:Opoaac>2.0.Co;2, 1998.
Hsu, C.-Y., Chiang, H.-C., Lin, S.-L., Chen, M.-J., Lin, T.-Y., and Chen, Y.-C.: Elemental characterization and sourceapportionment of PM10 and PM2.5 in the western coastalarea of central Taiwan, Sci. Total Environ., 541, 1139–1150,https://doi.org/10.1016/j.scitotenv.2015.09.122, 2016.
Hua, S., Liu, Y., Luo, R., Shao, T., and Zhu, Q.: Inconsis-tent aerosol indirect effects on water clouds and ice cloudsover the Tibetan Plateau, Int. J. Climatol., 40, 3832–3848,https://doi.org/10.1002/joc.6430, 2019.
Kim, E. and Hopke, P. K.: Source characterization of ambient fineparticles at multiple sites in the Seattle area, Atmos. Environ.,42, 6047–6056, https://doi.org/10.1016/j.atmosenv.2008.03.032,2008.
Kirchstetter, T. W., Novakov, T., and Hobbs, P. V.: Evidence that thespectral dependence of light absorption by aerosols is affectedby organic carbon, J. Geophys. Res.-Atmos., 109, D21208,https://doi.org/10.1029/2004jd004999, 2004.
Koch, D., Schulz, M., Kinne, S., McNaughton, C., Spackman, J.R., Balkanski, Y., Bauer, S., Berntsen, T., Bond, T. C., Boucher,O., Chin, M., Clarke, A., De Luca, N., Dentener, F., Diehl, T.,Dubovik, O., Easter, R., Fahey, D. W., Feichter, J., Fillmore,D., Freitag, S., Ghan, S., Ginoux, P., Gong, S., Horowitz, L.,Iversen, T., Kirkevåg, A., Klimont, Z., Kondo, Y., Krol, M., Liu,X., Miller, R., Montanaro, V., Moteki, N., Myhre, G., Penner,J. E., Perlwitz, J., Pitari, G., Reddy, S., Sahu, L., Sakamoto, H.,Schuster, G., Schwarz, J. P., Seland, Ø., Stier, P., Takegawa, N.,Takemura, T., Textor, C., van Aardenne, J. A., and Zhao, Y.: Eval-uation of black carbon estimations in global aerosol models, At-mos. Chem. Phys., 9, 9001–9026, https://doi.org/10.5194/acp-9-9001-2009, 2009.
Kurokawa, J., Ohara, T., Morikawa, T., Hanayama, S., Janssens-Maenhout, G., Fukui, T., Kawashima, K., and Akimoto, H.:Emissions of air pollutants and greenhouse gases over Asian re-gions during 2000–2008: Regional Emission inventory in ASia(REAS) version 2, Atmos. Chem. Phys., 13, 11019–11058,https://doi.org/10.5194/acp-13-11019-2013, 2013.
Lack, D. A. and Cappa, C. D.: Impact of brown and clear car-bon on light absorption enhancement, single scatter albedoand absorption wavelength dependence of black carbon, At-mos. Chem. Phys., 10, 4207–4220, https://doi.org/10.5194/acp-10-4207-2010, 2010.
https://doi.org/10.5194/acp-21-973-2021 Atmos. Chem. Phys., 21, 973–987, 2021
986 H. Liu et al.: Source contribution of black carbon in the southeastern margin of the Tibetan Plateau
Li, C., Bosch, C., Kang, S., Andersson, A. Chen., P. Zhang, Q.,Cong., Z. Chen, B., and Gustafsson., Ö.: Sources of black car-bon to the Himalayan–Tibetan Plateau glaciers, Nat. Commun.,7, 12574, https://https://doi.org/10.1038/ncomms12574, 2016.
Li, M., Zhang, Q., Kurokawa, J.-I., Woo, J.-H., He, K., Lu, Z.,Ohara, T., Song, Y., Streets, D. G., Carmichael, G. R., Cheng,Y., Hong, C., Huo, H., Jiang, X., Kang, S., Liu, F., Su, H.,and Zheng, B.: MIX: a mosaic Asian anthropogenic emissioninventory under the international collaboration framework ofthe MICS-Asia and HTAP, Atmos. Chem. Phys., 17, 935–963,https://doi.org/10.5194/acp-17-935-2017, 2017.
Liu, T.-Y.: Spatial structure convergence of China’s trans-portation system, Res. Transp. Econ., 78, 100768,https://doi.org/10.1016/j.retrec.2019.100768, 2019.
Liu, Y., Sato, Y., Jia, R., Xie, Y., Huang, J., and Nakajima,T.: Modeling study on the transport of summer dust and an-thropogenic aerosols over the Tibetan Plateau, Atmos. Chem.Phys., 15, 12581–12594, https://doi.org/10.5194/acp-15-12581-2015, 2015.
Liu, Y., Zhu, Q., Huang, J., Hua, S., and Jia, R.: Impactof dust-polluted convective clouds over the Tibetan Plateauon downstream precipitation, Atmos. Environ., 209, 67–77,https://doi.org/10.1016/j.atmosenv.2019.04.001, 2019.
Liu, Y., Zhu, Q., Hua, S., Alam, K., and Cheng, Y.,:Tibetan Plateau driven impact of Taklimakan duston northern rainfall, Atmos. Environ., 234, 117583,https://doi.org/10.1016/j.atmosenv.2020.117583, 2020a.
Liu, Y., Li, Y., Huang, J., Zhu, Q., and Wang, S.: Attribution of theTibetan Plateau to Northern Drought, Natl. Sci. Rev., 7, 489–492,https://doi.org/10.1093/nsr/nwz191, 2020b.
Liu, H., Wang, Q., Xing, L., Zhang, Y., Zhang, T., Ran, W., andCao, J.: Measurement report: quantifying source contributionof fossil fuels and biomass-burning black carbon aerosol in thesoutheastern margin of the Tibetan Plateau [Data set], Zenodo,https://doi.org/10.5281/zenodo.4452056, 2021.
Luo, M., Liu, Y., Zhu, Q., Tang, Y., and Alam, K.: Role and mech-anisms of black carbon affecting water vapor transport to Ti-bet, Remote Sens., 12, 231, https://doi.org/10.3390/rs12020231,2020.
Lough, G. C., Schauer, J. J., Park, J. S., Shafer, M. M., andWeinstein, J. P.: Emissions of metals associated with mo-tor vehicle roadways, Environ. Sci. Technol., 39, 826–836,https://doi.org/10.1021/es048715f, 2005.
Ma, Y., Huang, C., Jabbour, H., Zheng, Z., Wang, Y., Jiang,Y., Zhu, W., Ge, X., Collier, S., and Zheng, J.: Mixing stateand light absorption enhancement of black carbon aerosols insummertime Nanjing, China, Atmos. Environ., 222, 117141,https://doi.org/10.1016/j.atmosenv.2019.117141, 2020.
Madala, S., Satyanarayana, A. N. V., and Rao, T. N.: Performanceevaluation of PBL and cumulus parameterization schemes ofWRF ARW model in simulating severe thunderstorm events overGadanki MST radar facility – Case study, Atmos. Res., 139, 1–17, https://doi.org/10.1016/j.atmosres.2013.12.017, 2014.
Ming, J., Xiao, C., Cachier, H., Qin, D., Qin, X., Li, Z., and Pu,J.: Black Carbon (BC) in the snow of glaciers in west Chinaand its potential effects on albedos, Atmos. Res., 92, 114–123,https://doi.org/10.1016/j.atmosres.2008.09.007, 2009.
Niu, H., Kang, S., and Zhang, Y.: Distribution of light-absorbing impurities in snow of glacier on Mt. Yulong,
southeastern Tibetan Plateau, Atmos. Res., 197, 474–484,https://doi.org/10.1016/j.atmosres.2017.07.004, 2017.
Panicker, A. S., Pandithurai, G., Safai, P. D., Dipu, S., and Lee, D.-I.: On the contribution of black carbon to the composite aerosolradiative forcing over an urban environment, Atmos. Environ.,44, 3066–3070, https://doi.org/10.1016/j.atmosenv.2010.04.047,2010.
Polissar, A. V., Hopke, P. K., Paatero, P., Kaufmann, Y. J., Hall,D. K., Bodhaine, B. A., Dutton, E. G., and Harris, J. M.: Theaerosol at Barrow, Alaska: long-term trends and source locations,Atmos. Environ., 33, 2441–2458, https://doi.org/10.1016/S1352-2310(98)00423-3, 1999.
Polissar, A. V., Hopke, P. K., and Harris, J. M.: Source regions foratmospheric aerosol measured at Barrow, Alaska, Environ. Sci.Technol., 35, 4214–4226, https://doi.org/10.1021/es0107529,2001.
Ramachandran, S. and Kedia, S.: Black carbon aerosols over an ur-ban region: Radiative forcing and climate impact, J. Geophys.Res., 115, D10202, https://doi.org/10.1029/2009jd013560, 2010.
Rajesh, T. A. and Ramachandran, S.: Black carbon aerosolsover urban and high altitude remote regions: Characteristicsand radiative implications, Atmos. Environ., 194, 110–122,https://doi.org/10.1016/j.atmosenv.2018.09.023, 2018.
Ricchiazzi, P., Yang, S., Gautier, C., and Sowle, D.: SBDART: Aresearch and teaching software tool for plane-parallel radiativetransfer in the earth’s atmosphere, B. Am. Meteorol. Soc., 79,2101–2114, 1998.
Sandradewi, J., Prévôt, A. S. H., Weingartner, E., Schmid-hauser, R., Gysel, M., and Baltensperger, U.: A study ofwood burning and traffic aerosols in an Alpine valley using amulti-wavelength Aethalometer, Atmos. Environ., 42, 101–112,https://doi.org/10.1016/j.atmosenv.2007.09.034, 2008.
Song, Y., Zhang, Y., Xie, S., Zeng, L., Zheng, M., Salmon, L.G., Shao, M., and Slanina, S.: Source apportionment of PM2.5in Beijing by positive matrix factorization, Atmos. Environ.,40, 1526–1537, https://doi.org/10.1016/j.atmosenv.2005.10.039,2006.
Srivastava, A. K., Ram, K., Pant, P., Hedge, P., and Hema, J.: Blackcarbon aerosols over Manora Peak in the Indian Himalayanfoothills: implications for climate forcing, Environ. Res. Lett.,7, 014002, https://doi.org/10.1088/1748-9326/7/1/014002, 2011.
Sun, J., Zhi, G., Hitzenberger, R., Chen, Y., Tian, C., Zhang, Y.,Feng, Y., Cheng, M., Zhang, Y., Cai, J., Chen, F., Qiu, Y.,Jiang, Z., Li, J., Zhang, G., and Mo, Y.: Emission factors andlight absorption properties of brown carbon from householdcoal combustion in China, Atmos. Chem. Phys., 17, 4769–4780,https://doi.org/10.5194/acp-17-4769-2017, 2017.
Tian, J., Wang, Q., Ni, H., Wang, M., Zhou, Y., Han, Y., Shen,Z., Pongpiachan, S., Zhang, N., Zhao, Z., Zhang, Q., Zhang, Y.,Long, X., and Cao, J.: Emission characteristics of primary browncarbon absorption from biomass and coal burning: Developmentof an optical emission inventory for China, J. Geophys. Res.-Atmos., 124, 1879–1893, https://doi.org/10.1029/2018jd029352,2019.
Urban, R. C., Lima-Souza, M., Caetano-Silva, L., Queiroz, M. E.C., Nogueira, R. F. P., Allen, A. G., Cardoso, A. A., Held,G., and Campos, M. L. A. M.: Use of levoglucosan, potas-sium, and water-soluble organic carbon to characterize the ori-
Atmos. Chem. Phys., 21, 973–987, 2021 https://doi.org/10.5194/acp-21-973-2021
H. Liu et al.: Source contribution of black carbon in the southeastern margin of the Tibetan Plateau 987
gins of biomass-burning aerosols, Atmos. Environ., 61, 562–569,https://doi.org/10.1016/j.atmosenv.2012.07.082, 2012.
Valenzuela, A., Olmo, F. J., Lyamani, H., Antón, M., Titos,G., Cazorla, A., and Alados-Arboledas, L.: Aerosol scatteringand absorption Angström exponents as indicators of dust anddust-free days over Granada (Spain), Atmos. Res., 154, 1–13,https://doi.org/10.1016/j.atmosres.2014.10.015, 2015.
Vignati, E., Karl, M., Krol, M., Wilson, J., Stier, P., and Cav-alli, F.: Sources of uncertainties in modelling black carbonat the global scale, Atmos. Chem. Phys., 10, 2595–2611,https://doi.org/10.5194/acp-10-2595-2010, 2010.
Wang, Q., Cao, J., Han, Y., Tian, J., Zhu, C., Zhang, Y., Zhang, N.,Shen, Z., Ni, H., Zhao, S., and Wu, J.: Sources and physicochem-ical characteristics of black carbon aerosol from the southeasternTibetan Plateau: internal mixing enhances light absorption, At-mos. Chem. Phys., 18, 4639–4656, https://doi.org/10.5194/acp-18-4639-2018, 2018.
Wang, Q., Han, Y., Ye, J., Liu, S., Pongpiachan, S., Zhang, N.,Han, Y., Tian, J., Wu, C., Long, X., Zhang, Q., Zhang, W.,Zhao, Z., and Cao, J.: High contribution of secondary browncarbon to aerosol light absorption in the southeastern mar-gin of Tibetan Plateau, Geophys. Res. Lett., 46, 4962–4970,https://doi.org/10.1029/2019gl082731, 2019a.
Wang, Q. Y., Huang, R.-J., Cao, J. J., Tie, X. X., Ni, H. Y.,Zhou, Y. Q., Han, Y. M., Hu, T. F., Zhu, C. S., Feng, T., Li,N., and Li, J. D.: Black carbon aerosol in winter northeast-ern Qinghai–Tibetan Plateau, China: the source, mixing stateand optical property, Atmos. Chem. Phys., 15, 13059–13069,https://doi.org/10.5194/acp-15-13059-2015, 2015.
Wiedinmyer, C., Akagi, S. K., Yokelson, R. J., Emmons, L. K., Al-Saadi, J. A., Orlando, J. J., and Soja, A. J.: The Fire INventoryfrom NCAR (FINN): a high resolution global model to estimatethe emissions from open burning, Geosci. Model Dev., 4, 625–641, https://doi.org/10.5194/gmd-4-625-2011, 2011.
Xing, L., Li, G., Pongpiachan, S., Wang, Q., Han, Y., Cao, J.,Tipmanee, D., Palakun, J., Aukkaravittayapun, S., Surapip-ith, V., and Poshyachinda, S.: Quantifying the contribu-tions of local emissions and regional transport to ele-mental carbon in Thailand, Environ. Pollut., 262, 114272,https://doi.org/10.1016/j.envpol.2020.114272, 2020.
Xia, X., Zong, X, Cong, Z., Chen, H., Kang, S., andWang, P.: Baseline continental aerosol over the cen-tral Tibetan plateau and a case study of aerosol trans-port from South Asia, Atmos. Environ., 45, 7370–7378,https://doi.org/10.1016/j.atmosenv.2011.07.067, 2011.
Xu, J. Z., Zhang, Q., Wang, Z. B., Yu, G. M., Ge, X. L., and Qin,X.: Chemical composition and size distribution of summertimePM2.5 at a high altitude remote location in the northeast of theQinghai–Xizang (Tibet) Plateau: insights into aerosol sourcesand processing in free troposphere, Atmos. Chem. Phys., 15,5069–5081, https://doi.org/10.5194/acp-15-5069-2015, 2015.
Zhang, R., Wang, H., Qian, Y., Rasch, P. J., Easter, R. C., Ma, P.-L., Singh, B., Huang, J., and Fu, Q.: Quantifying sources, trans-port, deposition, and radiative forcing of black carbon over theHimalayas and Tibetan Plateau, Atmos. Chem. Phys., 15, 6205–6223, https://doi.org/10.5194/acp-15-6205-2015, 2015.
Zhang, Y., Li, M., Cheng, Y., Geng, G., Hong, C., Li, H., Li, X.,Tong, D., Wu, N., Zhang, X., Zheng, B., Zheng, Y., Bo, Y.,Su, H., and Zhang, Q.: Modeling the aging process of blackcarbon during atmospheric transport using a new approach: acase study in Beijing, Atmos. Chem. Phys., 19, 9663–9680,https://doi.org/10.5194/acp-19-9663-2019, 2019.
Zhao, Z., Cao, J., Chow, J. C., Watson, J. G., Chen, A. L.W., Wang, X., Wang, Q., Tian, J., Shen, Z., Zhu, C., Liu,S., Tao, J., Ye, Z., Zhang, T., Zhou, J., and Tian, R.:Multi-wavelength light absorption of black and brown car-bon at a high-altitude site on the Southeastern margin ofthe Tibetan Plateau, China, Atmos. Environ., 212, 54–64,https://doi.org/10.1016/j.atmosenv.2019.05.035, 2019.
Zhu, C. S., Cao, J. J., Hu, T. F., Shen, Z. X., Tie, X. X.,Huang, H., Wang, Q. Y., Huang, R. J., Zhao, Z. Z., Moc-nik, G., and Hansen, A. D. A.: Spectral dependence ofaerosol light absorption at an urban and a remote site overthe Tibetan Plateau, Sci. Total Environ., 590-591, 14–21,https://doi.org/10.1016/j.scitotenv.2017.03.057, 2017.
Zotter, P., Herich, H., Gysel, M., El-Haddad, I., Zhang, Y., Mocnik,G., Hüglin, C., Baltensperger, U., Szidat, S., and Prévôt, A. S.H.: Evaluation of the absorption Ångström exponents for trafficand wood burning in the Aethalometer-based source apportion-ment using radiocarbon measurements of ambient aerosol, At-mos. Chem. Phys., 17, 4229–4249, https://doi.org/10.5194/acp-17-4229-2017, 2017.
https://doi.org/10.5194/acp-21-973-2021 Atmos. Chem. Phys., 21, 973–987, 2021