measurement of reverberation time (rt60) and absorption ... manual.pdf · first, we measure the...
TRANSCRIPT
1
www.dewesoft.com
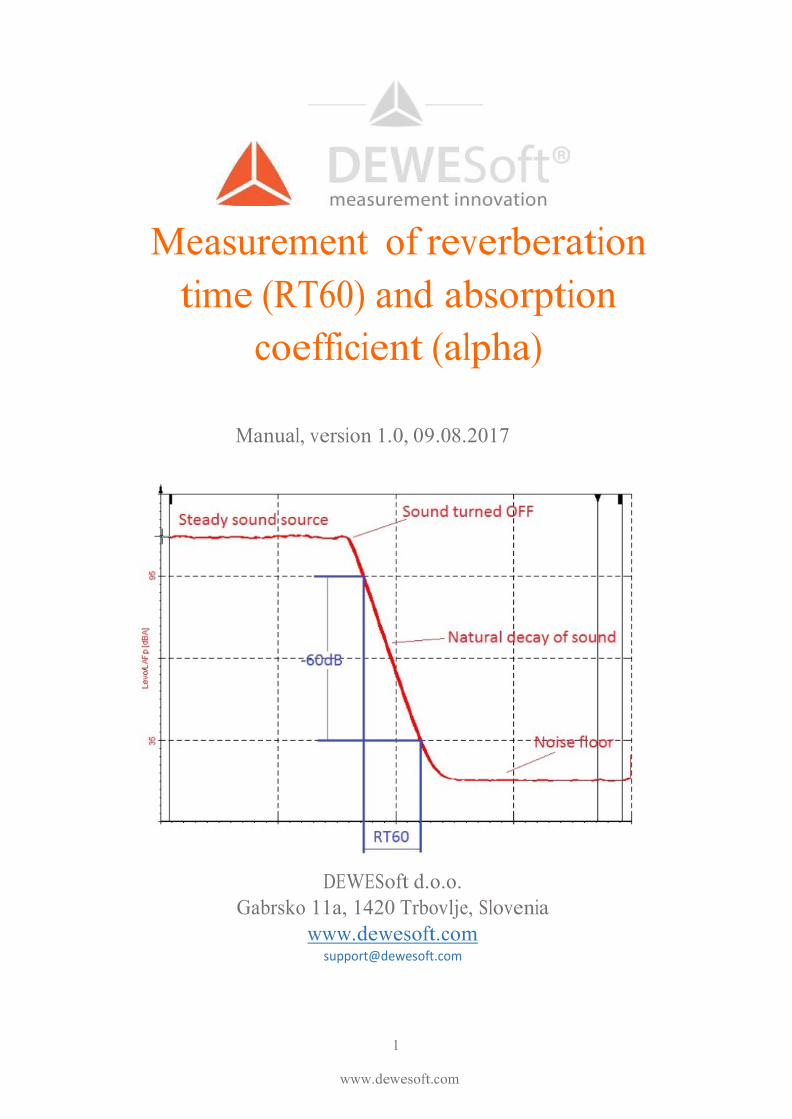
Measurement of reverberation
time (RT60) and absorption
coefficient (alpha)
Manual, version 1.0, 09.08.2017
DEWESoft d.o.o.
Gabrsko 11a, 1420 Trbovlje, Slovenia
www.dewesoft.com [email protected]
2
www.dewesoft.com
Table of content Reverberation time ................................................................................................................................... 3
Sabine equation ........................................................................................................................................ 3
Eyring formula........................................................................................................................................... 4
Comparison of Eyring and Sabine absorption coefficients ....................................................................... 5
Absorption coefficient (alpha) .................................................................................................................. 5
Measurements of reverberation time ...................................................................................................... 5
RT60 plugin setup in DEWESoft ................................................................................................................ 6
Octave settings ..................................................................................................................................... 7
Decay curve calculation ........................................................................................................................ 7
Evaluation range ................................................................................................................................... 7
SPL averaging type ................................................................................................................................ 8
Cross point search ................................................................................................................................. 8
Output channels ................................................................................................................................... 8
Measurement ........................................................................................................................................... 9
Placing of the cursors ................................................................................................................................ 9
Alpha coefficient calculation ............................................................................................................. 11
Report and analysis ................................................................................................................................. 13

3
www.dewesoft.com
Reverberation time Reverberation time is a time required for sound to decay 60 decibels from its initial level.
Reverberation time is measured in narrow bands and differ depending on the frequency band
being measured. For precision, it is important to know what ranges of frequencies are being
described by a reverberation time measurement.
Room used for speech typically need a shorter reverberation time so that speech can be
understood more clearly. If on the other hand, the reverberation time is too short, tonal
balance and loudness may suffer.
Reverberation effects are often used in studios to add depth to sounds. Reverberation
changes the perceived spectral structure of a sound, but does not alter the pitch.
Basic factors that affect a room's reverberation time include the size and shape of the
enclosure as well as the materials used in the construction of the room. Every object placed
within the enclosure can also affect the reverberation time.
Sabine equation In the late 19th century, Wallace Clement Sabine started to investigate the impact of
absorption on the reverberation time. Using a portable wind chest and organ pipes as a
sound source, a stopwatch and his ears, he measured the time from interruption source to
inaudibility (a difference of roughly 60 dB). He found that the reverberation time is
proportional to room dimensions and inversely proportional to the amount of absorption
present.

4
www.dewesoft.com
• C20 is the speed
• V is the volume
• S is the total surface
• α is the average
• The product Sα
The total absorption (and reverberation time) generally changes depending on frequency
(which is defined by the acoustic properties of the space). The equation does not take into
account room shape or losses from the sound travelling through the air (which is important in
larger spaces). Most rooms absorb less sound energy in the lower frequency ranges resulting
in longer reverberation times at lower frequencies.
Sabine concluded that the reverberation time depends upon the reflectivity of sound from
various surfaces available inside the hall. If the reflection is coherent, the reverberation time
of the hall will be longer; the sound will take more time to die out.
The reverberation time RT60 and the volume V of the room have great influence on the
critical distance dc. Critical distance is the distance at which the sound pressure level of the
direct sound and the reverberant sound are equal:
• Critical distance dc is measured,
• Volume V is measured in m3,
• Reverberation time RT60 is measured in seconds
Eyring formula The Sabine and Eyring equations were derived under different assumptions. The Sabine
equation assumes that as a sound wave travels around a room it encounters surfaces “one
after another.” The Eyring equation assumes that all the surfaces are simultaneously
impacted by the initial sound wave, and that successive simultaneous impacts, each
diminished by the average room absorption coefficient, are separated by mean free paths.
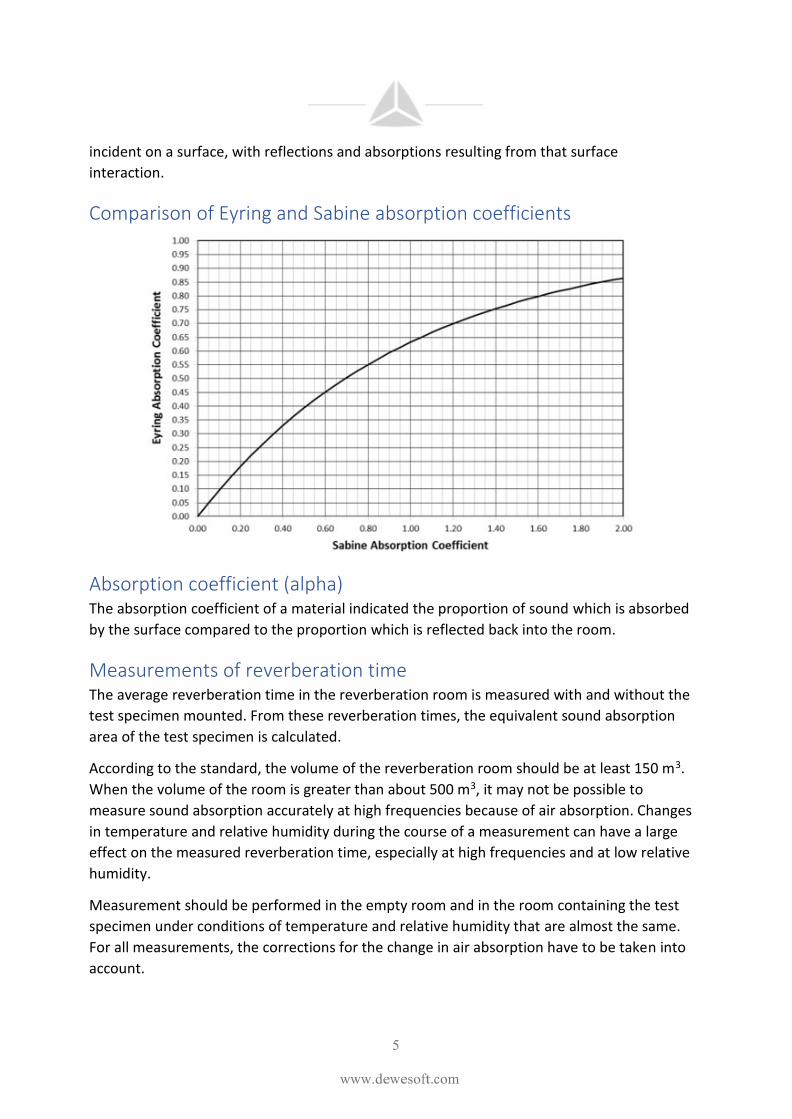
Sabine and Eyring converge at low absorption, but diverge when the absorption is high, in
which case Eyring is more appropriate. The Eyring absorption (and its more accurate
reverberation formula) takes into account that the decay of sound is not a continuous
process, but is instead a stepwise reduction of sound energy whenever a sound wave is
5
www.dewesoft.com
incident on a surface, with reflections and absorptions resulting from that surface
interaction.
Comparison of Eyring and Sabine absorption coefficients
Absorption coefficient (alpha) The absorption coefficient of a material indicated the proportion of sound which is absorbed
by the surface compared to the proportion which is reflected back into the room.
Measurements of reverberation time The average reverberation time in the reverberation room is measured with and without the
test specimen mounted. From these reverberation times, the equivalent sound absorption
area of the test specimen is calculated.
According to the standard, the volume of the reverberation room should be at least 150 m3.
When the volume of the room is greater than about 500 m3, it may not be possible to
measure sound absorption accurately at high frequencies because of air absorption. Changes
in temperature and relative humidity during the course of a measurement can have a large
effect on the measured reverberation time, especially at high frequencies and at low relative
humidity.
Measurement should be performed in the empty room and in the room containing the test
specimen under conditions of temperature and relative humidity that are almost the same.
For all measurements, the corrections for the change in air absorption have to be taken into
account.
6
www.dewesoft.com
Standard prescribes two methods for measuring decay curves:
• The interrupted noise method (the excitation signal shall be sufficiently long to
produce a steady-state sound pressure level in all frequency bands before it is
switched off. In order to obtain steady-state conditions, the excitation time shall be at
least half of the estimate of the expected reverberation time).
• The integrated impulse response method (the impulse response may be measured
directly by using an impulse source such as a pistol shot, balloon burst, spark gap or
any other sound source that produces an impulse with sufficient bandwidth and
energy). This is the preferred method.
The decay curve measured with the interrupted noise method is the result of a statistical
process, and averaging several decay curves or reverberation times measured at one
microphone/loudspeaker position is mandatory in order to obtain a suitable repeatability.
The integrated impulse response of a room is a deterministic function and not prone to
statistical deviations, so no averaging is necessary.
The directivity characteristic of the microphones used for the measurement shall be
omnidirectional. The measurements shall be made with different microphone positions
which are at least 1,5 m apart, 2 m from any sound source and 1 m from any room surface
and the test specimen.
The sound in the reverberation room shall be generated by a sound source with an
omnidirectional radiation pattern. The signals from different microphones shall not be
averaged together.
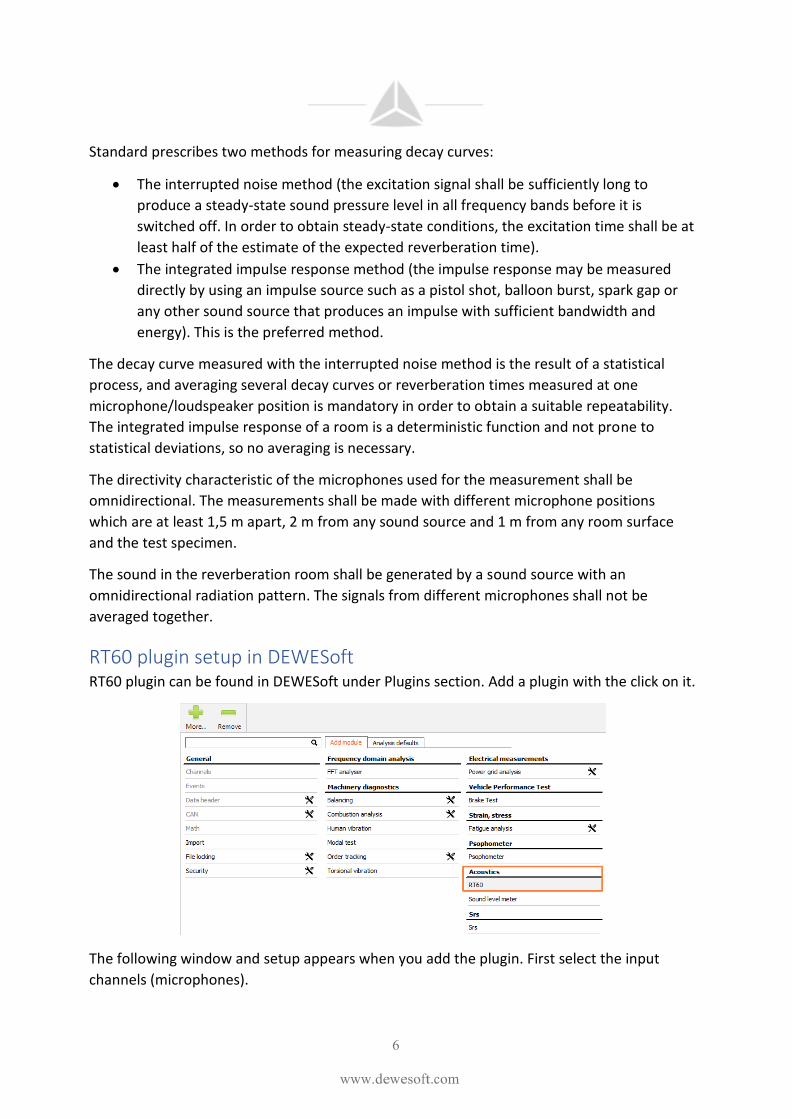
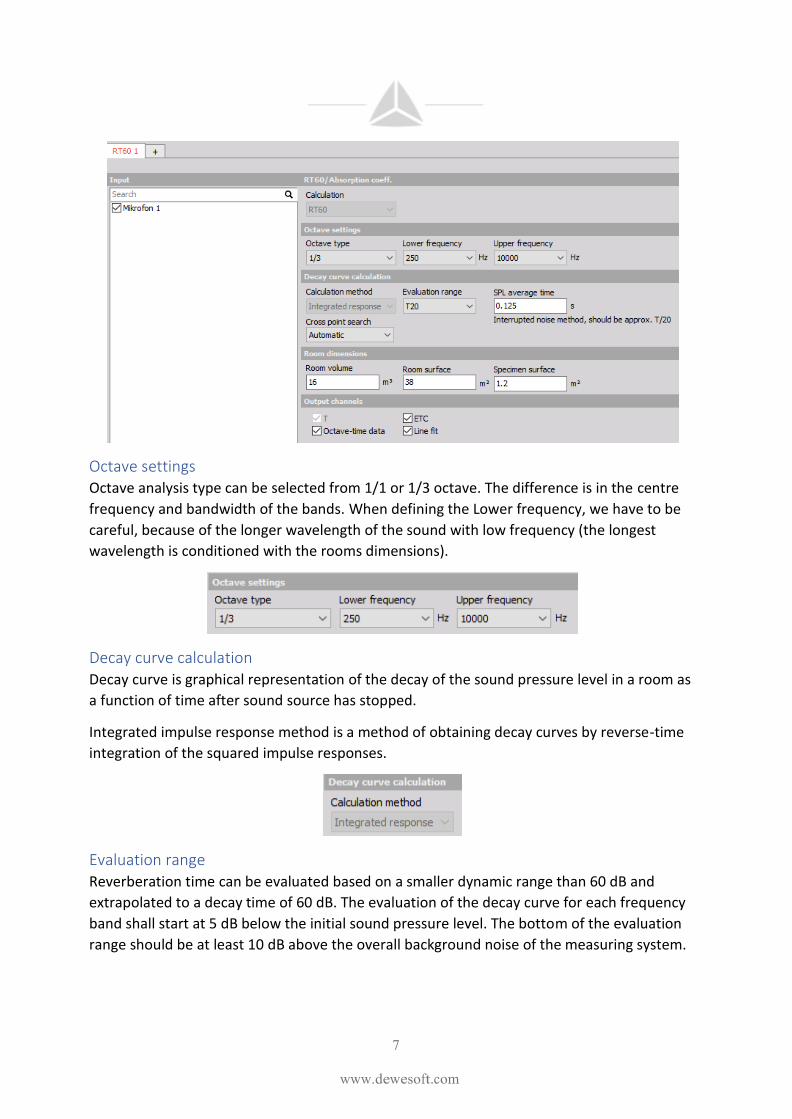
RT60 plugin setup in DEWESoft RT60 plugin can be found in DEWESoft under Plugins section. Add a plugin with the click on it.
The following window and setup appears when you add the plugin. First select the input
channels (microphones).
7
www.dewesoft.com
Octave settings Octave analysis type can be selected from 1/1 or 1/3 octave. The difference is in the centre
frequency and bandwidth of the bands. When defining the Lower frequency, we have to be
careful, because of the longer wavelength of the sound with low frequency (the longest
wavelength is conditioned with the rooms dimensions).
Decay curve calculation Decay curve is graphical representation of the decay of the sound pressure level in a room as
a function of time after sound source has stopped.
Integrated impulse response method is a method of obtaining decay curves by reverse-time
integration of the squared impulse responses.
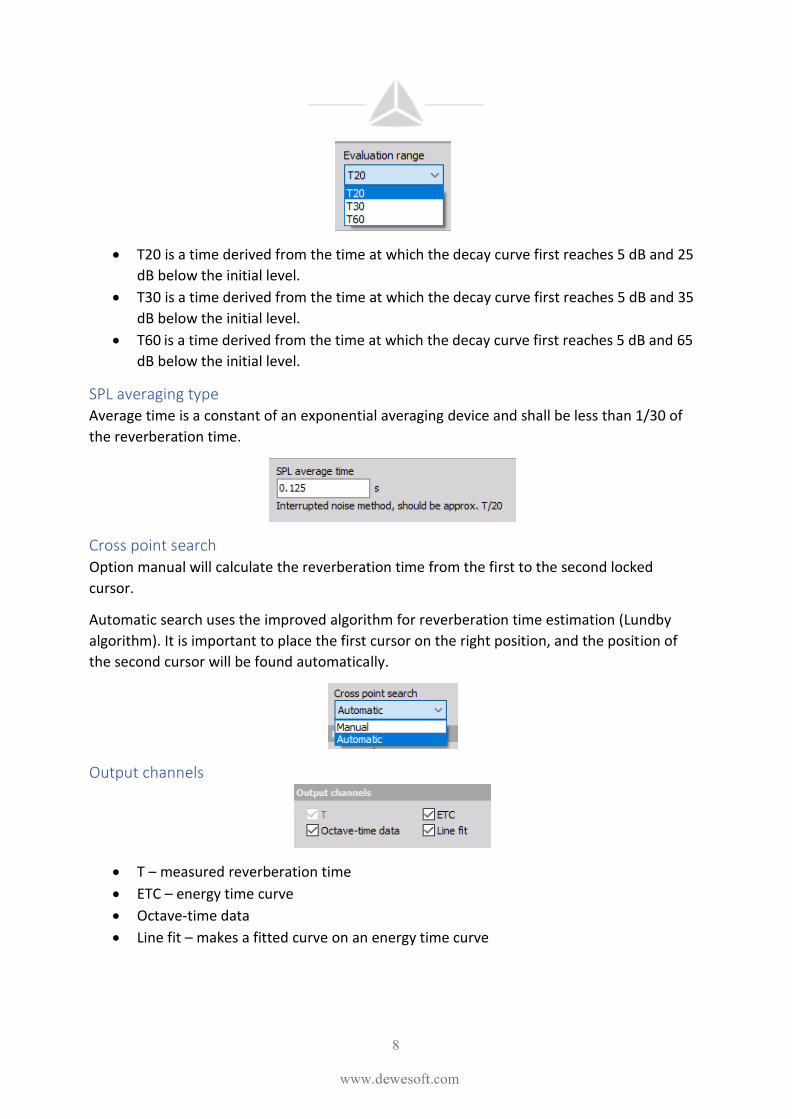
Evaluation range Reverberation time can be evaluated based on a smaller dynamic range than 60 dB and
extrapolated to a decay time of 60 dB. The evaluation of the decay curve for each frequency
band shall start at 5 dB below the initial sound pressure level. The bottom of the evaluation
range should be at least 10 dB above the overall background noise of the measuring system.
8
www.dewesoft.com
• T20 is a time derived from the time at which the decay curve first reaches 5 dB and 25
dB below the initial level.
• T30 is a time derived from the time at which the decay curve first reaches 5 dB and 35
dB below the initial level.
• T60 is a time derived from the time at which the decay curve first reaches 5 dB and 65
dB below the initial level.
SPL averaging type Average time is a constant of an exponential averaging device and shall be less than 1/30 of
the reverberation time.
Cross point search Option manual will calculate the reverberation time from the first to the second locked
cursor.
Automatic search uses the improved algorithm for reverberation time estimation (Lundby
algorithm). It is important to place the first cursor on the right position, and the position of
the second cursor will be found automatically.
Output channels
• T – measured reverberation time
• ETC – energy time curve
• Octave-time data
• Line fit – makes a fitted curve on an energy time curve
9
www.dewesoft.com
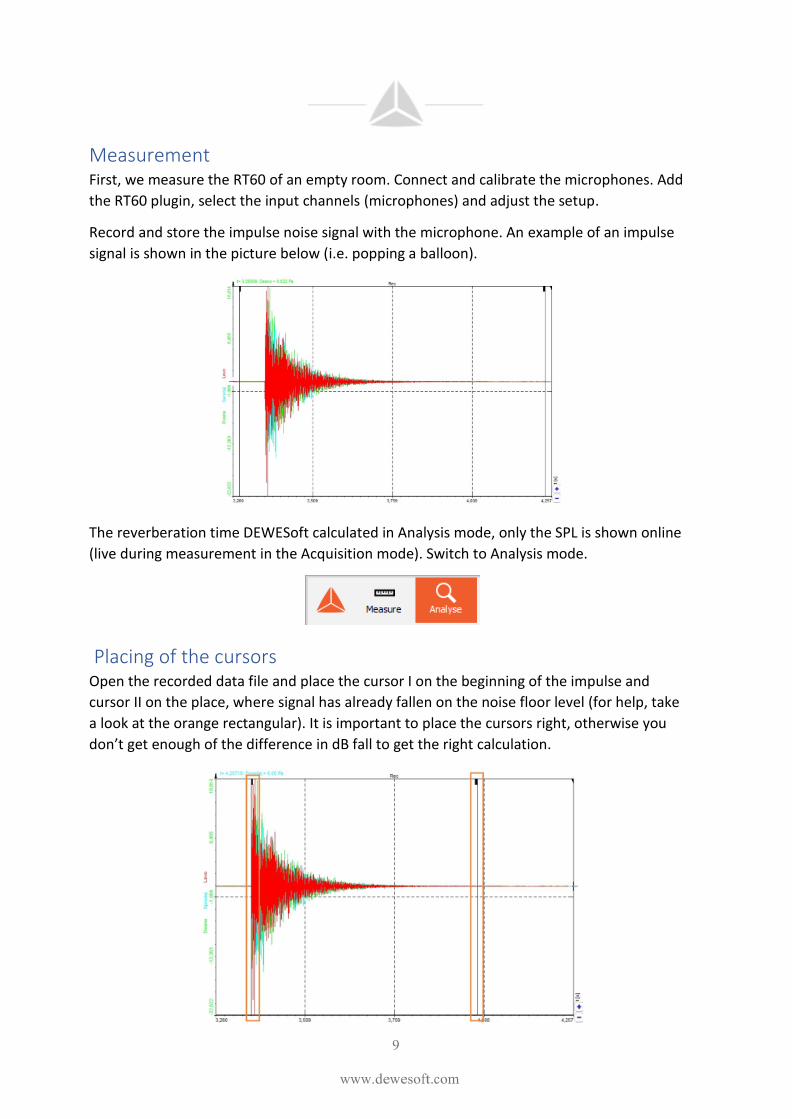
Measurement First, we measure the RT60 of an empty room. Connect and calibrate the microphones. Add
the RT60 plugin, select the input channels (microphones) and adjust the setup.
Record and store the impulse noise signal with the microphone. An example of an impulse
signal is shown in the picture below (i.e. popping a balloon).
The reverberation time DEWESoft calculated in Analysis mode, only the SPL is shown online
(live during measurement in the Acquisition mode). Switch to Analysis mode.
Placing of the cursors Open the recorded data file and place the cursor I on the beginning of the impulse and
cursor II on the place, where signal has already fallen on the noise floor level (for help, take
a look at the orange rectangular). It is important to place the cursors right, otherwise you
don’t get enough of the difference in dB fall to get the right calculation.

10
www.dewesoft.com
Lock the position of the cursors with the click on two locks in the bottom left corner.
After the cursors are locked on the right positions, we have to Recalculate the data. Go back
to Math and change the channel to Offline. Recalculate function will again do the calculation
the selected data (area between the locked cursors).
The results for the reverberation time can be shown on a 2D graph.

11
www.dewesoft.com
Alpha coefficient calculation Alpha coefficient is a calculated with a formula, where both reverberation times are
important parameters.
The provided Excel template RT60_AlphaTemplate_v1_0 contains formulas for averaging and
calculation of absorption (alpha) coefficient.
Open the template and copy the RT60 data to Excel.
Enter the parameters about the room conditions and dimensions (temperature, humidity,
volume, surface). The important parameter is the surface area of a test specimen.
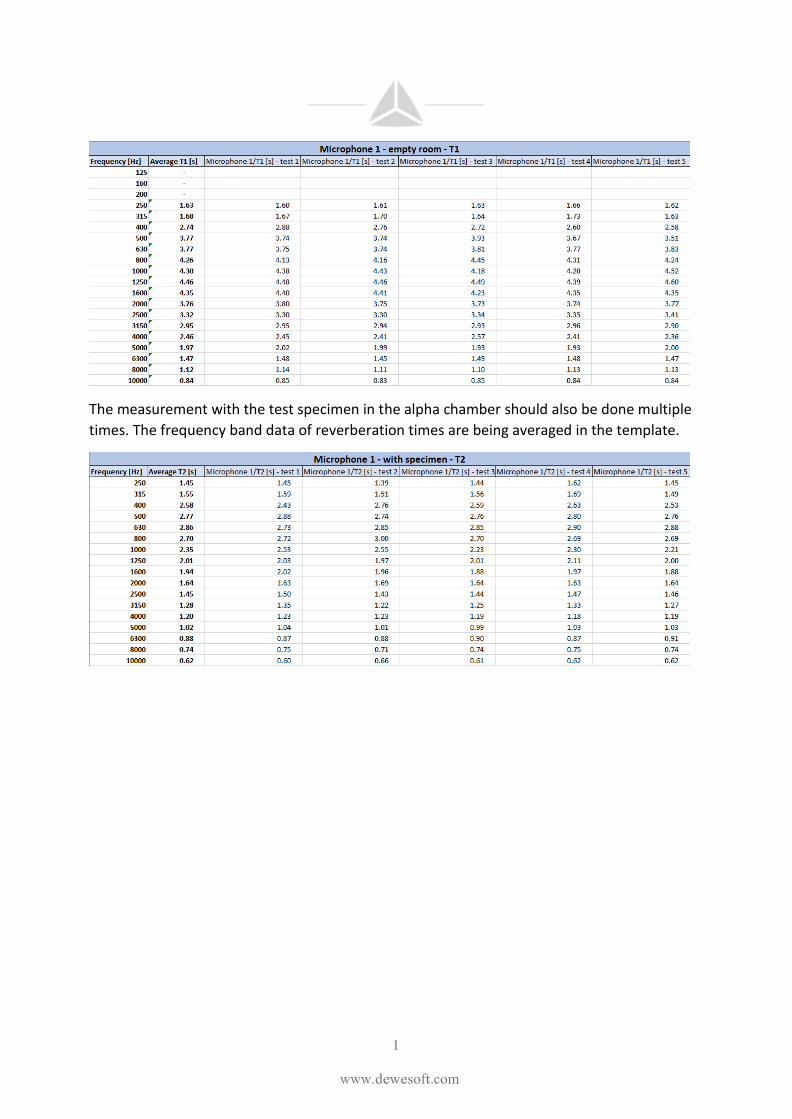
Data for reverberation time T1 (in an empty room) are copied into Excel template. It is
recommended that the measurement of the reverberation time is repeated multiple times to
ensure the right data. Reverberation times in the same frequency band are averaged.
12
www.dewesoft.com
The measurement with the test specimen in the alpha chamber should also be done multiple
times. The frequency band data of reverberation times are being averaged in the template.
13
www.dewesoft.com
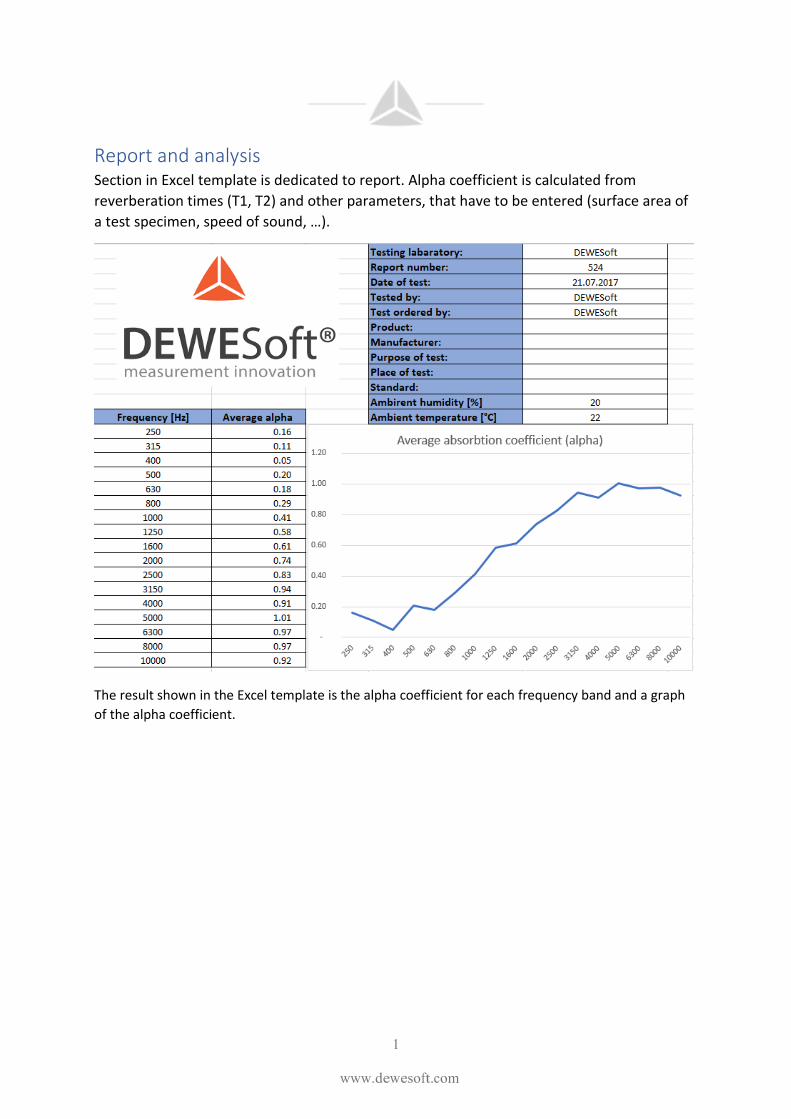
Report and analysis Section in Excel template is dedicated to report. Alpha coefficient is calculated from
reverberation times (T1, T2) and other parameters, that have to be entered (surface area of
a test specimen, speed of sound, …).
The result shown in the Excel template is the alpha coefficient for each frequency band and a graph
of the alpha coefficient.