measurement of quality in preschool child care classrooms...
TRANSCRIPT
Measurement of quality in preschool child care classrooms: An exploratory and confirmatory factor analysis of the early childhood environment rating scale-revised
By: Deborah J. Cassidy, Linda L. Hestenes, Archana Hedge, Stephen Hestenes, Sharon U. Mims
Cassidy, D., Hestenes, L., Hedge, A., Hestenes, S., & Mims, S. (2005). Measurement of quality in preschool child care classrooms: An exploratory and confirmatory factor analysis of the early childhood environment rating scale-revised. Early Childhood Research Quarterly, 20(3), 345-360. doi: 10.1016/j.ecresq.2005.07.005
Made available courtesy of Elsevier: http://dx.doi.org/10.1016/j.ecresq.2005.07.005
This is the author’s version of a work that was accepted for publication in Early Childhood Research Quarterly. Changes resulting from the publishing process, such as peer review, editing, corrections, structural formatting, and other quality control mechanisms may not be reflected in this document. Changes may have been made to this work since it was submitted for publication. A definitive version was subsequently published in Early Childhood Research Quarterly, [20, 3, 2005] DOI: 10.1016/j.ecresq.2005.07.005
Abstract:
The purpose of the current study was to examine the psychometric properties of the Early Childhood Environment Rating Scale-Revised (ECERS-R) with a large sample (1313 classrooms). We explored both the seven subscales and the possibility of fewer distinct aspects of quality being measured by the scale. The large sample size allowed both exploratory and confirmatory factor analyses to be performed. The results showed two distinct factors, Activities/Materials (nine items) and Language/Interaction (seven items), which accounted for 69% of the variance. High internal consistency scores, a moderate correlation between the factor-based scales, and a strong correlation between the combined factor-based scales and the overall ECERS-R score suggested these were distinct factors that could serve as a proxy for the larger scale. Structural aspects of quality and teacher education were examined in relation to the new factor-based scales and the overall score. Implications for practitioners and future research suggestions are provided
Keywords: Preschool | Activities/Materials | Language/Interaction | Early Childhood | Teacher Education
Article:
The Early Childhood Environment Rating Scale-Revised (ECERS-R) (Harms, Clifford, & Cryer, 1998) is perhaps the most frequently used measure of global quality in early childhood settings. As Scarr et al. have argued, instruments, such as the ECERS-R, have multiple purposes including regulatory, research, and consultative (Scarr, Eisenberg, & Deater-Deckard, 1994). Desirable properties of such instruments vary with the purpose. For research purposes, a streamlined, easier
to administer measure is most preferable while for regulatory and consultative purposes a more detailed, longer scale may be more appropriate. Certainly, when a scale, such as the ECERS-R, is used for regulatory purposes, it is critical that the breadth of quality be examined in as comprehensive a manner as possible. When using the scale for research there are advantages in efficiency to having fewer items. The time to obtain inter-observer reliability and to administer the scale may be shortened. The use of factor analysis techniques to reduce the scale can also provide insight into underlying unique dimensions of quality rather than a single global indicator. Several factor analyses have been completed on the both the original ECERS (Harms & Clifford, 1980; Howes, Phillips, & Whitebook, 1992; Phillipsen, Bruchinal, Howes, & Cryer, 1997; Scarr et al., 1994) and the revised version (Holloway, Kagan, Fuller, Tsou, & Carroll, 2001; Perlman, Zellman, & Le, 2004; Sakai, Whitebook, Wishard, & Howes, 2003) with different results. Limited sample sizes in these past studies have not permitted both exploratory and confirmatory factor analytic techniques to be used. The large sample size in the current study allowed for a more statistically rigorous approach to determine if there are underlying distinct constructs of quality in the ECERS-R and if a shorter version of scale can be reliably used in research studies.
1. Previous factor analytic and scale reduction techniques for the ECERS and ECERS-R
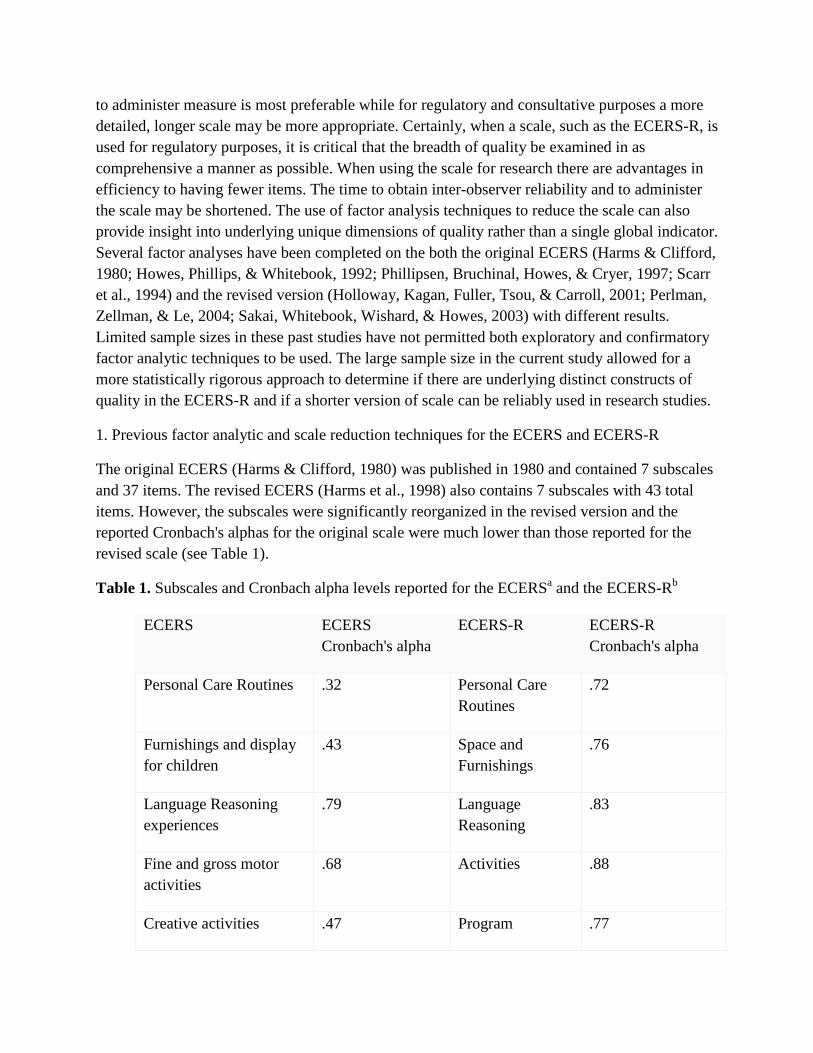
The original ECERS (Harms & Clifford, 1980) was published in 1980 and contained 7 subscales and 37 items. The revised ECERS (Harms et al., 1998) also contains 7 subscales with 43 total items. However, the subscales were significantly reorganized in the revised version and the reported Cronbach's alphas for the original scale were much lower than those reported for the revised scale (see Table 1).
Table 1. Subscales and Cronbach alpha levels reported for the ECERSa and the ECERS-Rb
ECERS ECERS Cronbach's alpha
ECERS-R ECERS-R Cronbach's alpha
Personal Care Routines .32 Personal Care Routines
.72
Furnishings and display for children
.43 Space and Furnishings
.76
Language Reasoning experiences
.79 Language Reasoning
.83
Fine and gross motor activities
.68 Activities .88
Creative activities .47 Program .77

ECERS ECERS Cronbach's alpha
ECERS-R ECERS-R Cronbach's alpha
Structure
Social development .53 Interactions .86
Adult needs .56 Parents and Staff .71
a Harms and Clifford (1980).
b Harms, Clifford, and Cryer (1998).
Although both the ECERS and the ECERS-R include seven subscales, few studies have found that the subscales represent distinct domains of quality (Beller, Stahnke, Butz, Stahl, & Wessels, 1996; Munton, Rowland, Mooney, & Lera, 1997). However, these studies relied on very small samples to replicate the initial subscales. Howes et al. (1992) found two factors (Appropriate Caregiving and Developmentally Appropriate Activity) that explained 100% of the common variance. The Cost, Quality, and Child Outcomes Study (Helburn, 1995) reported one overall factor of quality for the ECERS, although support for two factors was also found (Appropriate Caregiving and Developmentally Appropriate Activities). Phillipsen et al. (1997), also report only one factor of global quality for the ECERS. Scarr et al. (1994) also examined the psychometric properties of the ECERS with a larger sample (although perhaps statistically inadequate) of 120 classrooms. Their findings from different factor analytic methods suggested a single factor explaining 69% or 44% of the common variance, depending on the analysis. They further reported that the 37-item scale was reducible to a randomly selected set of 12 items that was as reliable at predicting quality as the overall scale (Scarr et al., 1994). This finding was later replicated by Beller et al. (1996) and Perlman et al. (2004).
It would be erroneous to assume that the revised version has identical psychometric properties to the original scale since the revisions to the scale have been significant. However, recent research with the revised version of the scale yielded only one factor (Holloway et al., 2001). In addition, in a sample of higher quality facilities, Perlman et al. (2004) did not support the seven aspects of quality identified by the subscales. Although three factors were identified by the factor analysis, because the eigenvalue of the first factor overwhelmed the other two factors and explained 71% of the common variance, the authors propose that the scale is a unidimensional measure of quality. Sakai et al. (2003) reported a two-factor solution (“Teaching and Interactions” and “Provisions for Learning”) as the most appropriate for the ECERS-R.
None of the studies conducted to date have had the benefit of a very large sample that would allow both an exploratory and confirmatory factor analyses to be conducted. Shorter versions of scales as determined by factor analysis, item analysis, or using predictive properties of individual items to determine best items have been shown to be similarly correlated to child outcome

measures as longer versions of scales (Moore, Halle, Vandivere, & Marimer, 2002). There is a clear need for such analyses to determine what constructs of quality are being measured with the revised version of the scale and if a reliable shorten-version of the scale can be confirmed.
1.1. Relationship between global and structural quality
A number of studies have reported a strong relationship between global quality and structural quality variables. Phillipsen et al. (1997) examined the associations between structural and global quality for 100 child care centers in four states (California, Colorado, Connecticut, and North Carolina) using scores on the ECERS. The authors found strong associations between ECERS scores and structural quality. Centers with teachers who had at least some college education, lower classroom ratio, and higher pay scored higher on the measure of global quality.
In a similar study, Burchinal, Cryer, Clifford, and Howes (2002) examined the associations between caregiver sensitivity and caregiver education in 553 child care classrooms based on ECERS-R scores. Classrooms with teachers who had a Bachelor's degree scored significantly higher on the ECERS-R than classrooms with teachers with less education. Moreover, children in these classrooms of teachers with a Bachelor's degree showed significantly better language skills than did children in classrooms with teachers with less education. Phillips, Mekos, Scarr, McCartney, and Abbott-Shim (2000) found that classroom quality, especially the quality of teacher–child interactions, was positively related to structural factors such as teacher training and education, parent fees, teachers’ wages, and teacher/child ratio, and was negatively related to group size.
1.2. Context for the current study
The current study utilizes a large sample generated by the North Carolina Rated License Assessment Project. A recent trend across the country has been the inclusion of a global measure of quality, such as the ECERS-R, as a component of the regulatory or licensing system. In North Carolina, the rating scales are used to determine a point total for program standards. Typically, only programs striving for a higher point total (and a higher star rating) undergo the assessment process resulting in a higher quality sample. Nonetheless, the large sample allows for statistical procedures that are not possible with smaller samples. The sample has a normal distribution and is representative of the state with regard to rural and urban and small and large programs. Other characteristics of the sample also appear to mirror the broader population of facilities in the state. To date there are only a few large-scale studies that have used the ECERS-R. Perlman et al. (2004) report a relatively high mean score of 5.15 on the ECERS-R for 326 classrooms in Colorado that were part of the Center for Human Investment Policy (CHIP) Project. It may also be that the Colorado sample represented higher end programs in Colorado since the programs are part of a quality improvement initiative.
1.3. Purpose
The purpose of the current study was to examine the psychometric properties of the ECERS-R with a large sample (1313 classrooms). We explored both the seven subscales and the possibility of fewer distinct aspects of quality being measured by the scale. The large sample size allowed both exploratory and confirmatory factor analyses to be conducted and to systematically examine the items on the ECERS-R that best differentiated lower and higher quality classrooms. The study also attempted to replicate the Scarr et al. (1994) findings regarding any randomly chosen 12 items being adequate as a proxy for the entire scale. Finally, structural aspects of child care quality were examined to determine the relationship between the ECERS-R factors-based scales and teacher education, teacher experience, group sizes, and teacher/child ratios.
2. Method
2.1. Participants
Data were collected from 1313 preschool classrooms in child care programs across North Carolina from 1999 to 2002. These assessments were completed as part of North Carolina's Star Rated License process. Child care facilities in North Carolina can earn from one to five stars depending on outcomes from three domains (i.e. program standards, staff education levels, and compliance history). One portion of the program standards requirement for centers that want to achieve a higher star rating is the completion of a global quality assessment using one of the Environment Rating Scales (i.e. ECERS-R, ITERS, ITERS-R, FDCRS, or SACERS). The ECERS-R assessments used in this study were completed only in programs that were striving for the higher star ratings (typically four or five stars). Thus, this data set most likely represents only the higher quality programs in the state. Although only programs striving for higher star ratings received the assessment, there was still a wide range of scores that were normally distributed. ECERS-R assessments were completed in 92% of the counties in North Carolina.
2.2. ECERS-R
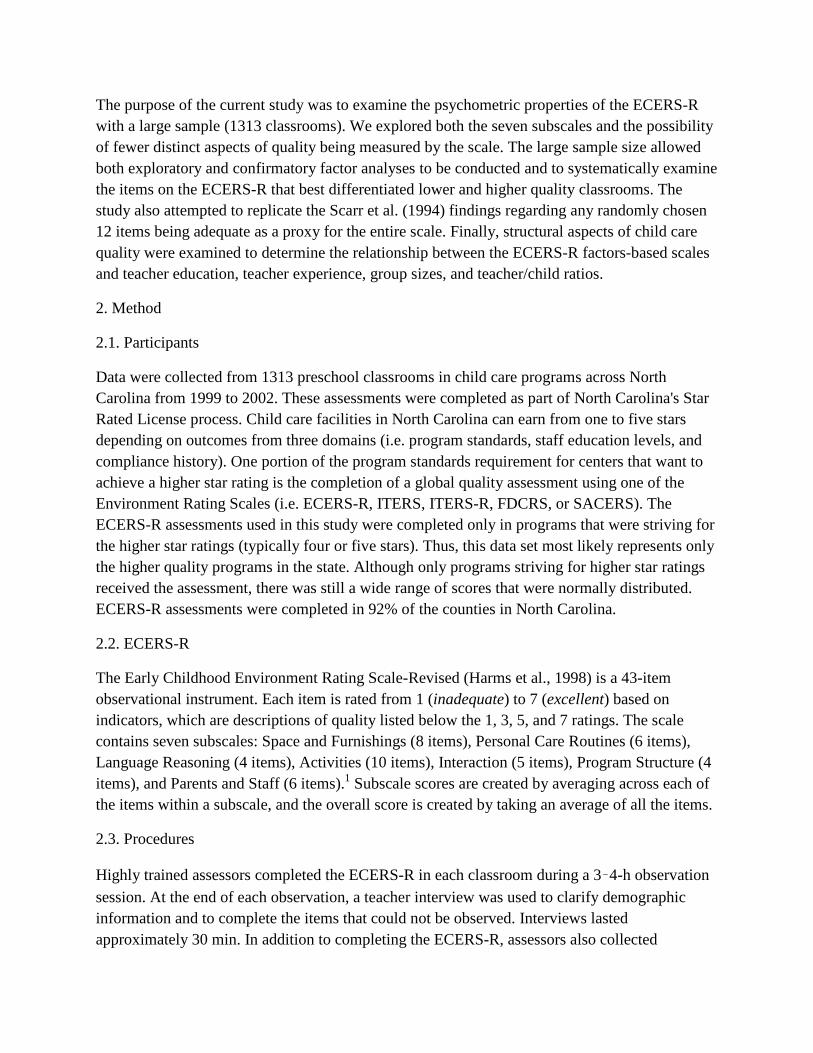
The Early Childhood Environment Rating Scale-Revised (Harms et al., 1998) is a 43-item observational instrument. Each item is rated from 1 (inadequate) to 7 (excellent) based on indicators, which are descriptions of quality listed below the 1, 3, 5, and 7 ratings. The scale contains seven subscales: Space and Furnishings (8 items), Personal Care Routines (6 items), Language Reasoning (4 items), Activities (10 items), Interaction (5 items), Program Structure (4 items), and Parents and Staff (6 items).1 Subscale scores are created by averaging across each of the items within a subscale, and the overall score is created by taking an average of all the items.
2.3. Procedures
Highly trained assessors completed the ECERS-R in each classroom during a 3–4-h observation session. At the end of each observation, a teacher interview was used to clarify demographic information and to complete the items that could not be observed. Interviews lasted approximately 30 min. In addition to completing the ECERS-R, assessors also collected
background information on teachers, group size, and teacher/child ratios during their observation. Teachers’ level of education was coded into 1 of 12 categories from ‘did not complete high school’ to a ‘graduate degree’. Each level represented increasing years of education and amounts of child development/early childhood education.
2.4. Assessor training
Each assessor was a trained staff member of the North Carolina Rated License Assessment Project. The assessors receive extensive and ongoing training on the instrument as part of their job. Each assessor is trained to at least an 85% agreement level (based upon consensus scoring within one rating point) across programs that differ by level of quality, ethnicity, age, special needs, and program type. Reliability is maintained at that level via checks after approximately every 6th assessment. Highly reliable assessors (i.e. those maintaining a 90% agreement level over three consecutive reliability checks) are re-evaluated for reliability after every 10th assessment. Each assessor receives updated training and clarification on items every quarter and feedback at each reliability check.2
3. Results
3.1. Preliminary analyses
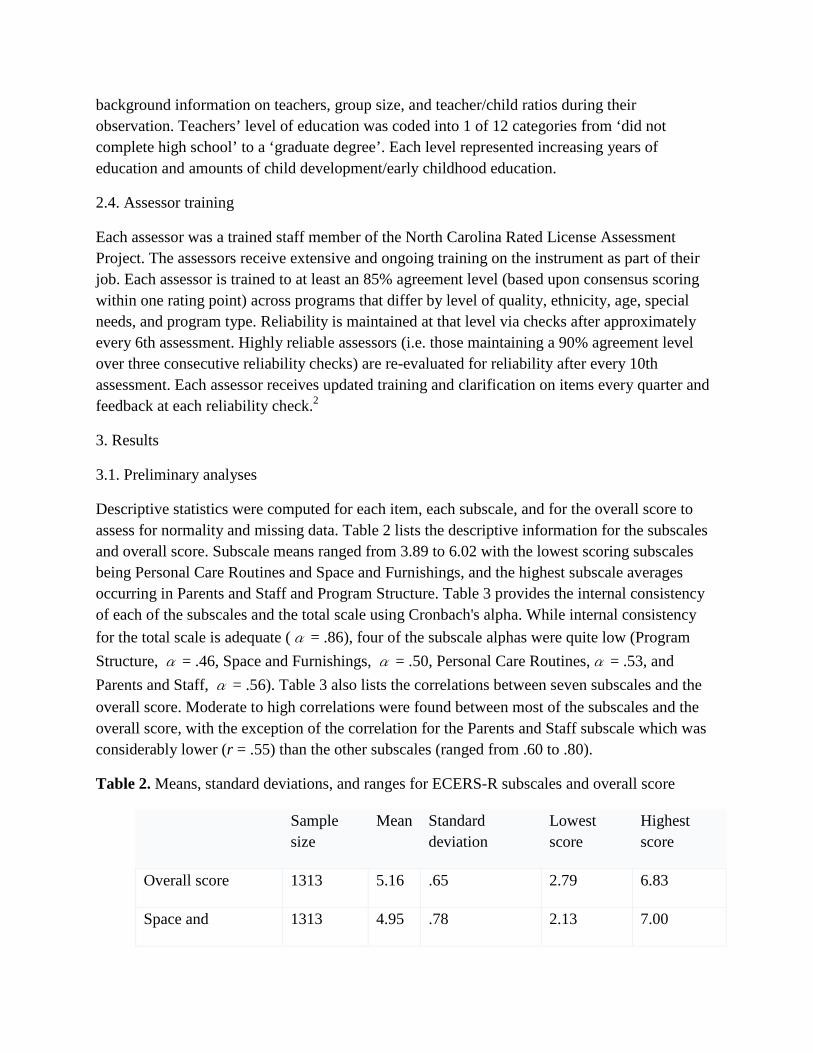
Descriptive statistics were computed for each item, each subscale, and for the overall score to assess for normality and missing data. Table 2 lists the descriptive information for the subscales and overall score. Subscale means ranged from 3.89 to 6.02 with the lowest scoring subscales being Personal Care Routines and Space and Furnishings, and the highest subscale averages occurring in Parents and Staff and Program Structure. Table 3 provides the internal consistency of each of the subscales and the total scale using Cronbach's alpha. While internal consistency for the total scale is adequate (α = .86), four of the subscale alphas were quite low (Program Structure, α = .46, Space and Furnishings, α = .50, Personal Care Routines,α = .53, and Parents and Staff, α = .56). Table 3 also lists the correlations between seven subscales and the overall score. Moderate to high correlations were found between most of the subscales and the overall score, with the exception of the correlation for the Parents and Staff subscale which was considerably lower (r = .55) than the other subscales (ranged from .60 to .80).
Table 2. Means, standard deviations, and ranges for ECERS-R subscales and overall score
Sample size
Mean Standard deviation
Lowest score
Highest score
Overall score 1313 5.16 .65 2.79 6.83
Space and 1313 4.95 .78 2.13 7.00

Sample size
Mean Standard deviation
Lowest score
Highest score
Furnishings
Personal Care Routines
1313 3.89 .99 1.67 7.00
Language Reasoning
1313 5.41 .89 1.75 7.00
Activities 1313 5.11 .91 2.30 7.00
Interaction 1313 5.59 1.18 1.00 7.00
Program Structure 1313 5.67 1.00 1.00 7.00
Parents and Staff 1307 6.02 .76 3.00 7.00
Table 3. Cronbach's alpha and correlations for ECERS-R subscales and total scale
Number of items
Cronbach's alpha
Correlations with ECERS-R overall score
Space and Furnishings
8 .50 .74
Personal Care Routines
6 .53 .60
Language Reasoning
4 .61 .74
Activities 10 .78 .80
Interaction 5 .78 .74
Program Structure 4 .46 .71
Parents and Staff 6 .56 .55

Number of items
Cronbach's alpha
Correlations with ECERS-R overall score
Total scale (all items)
43 .86
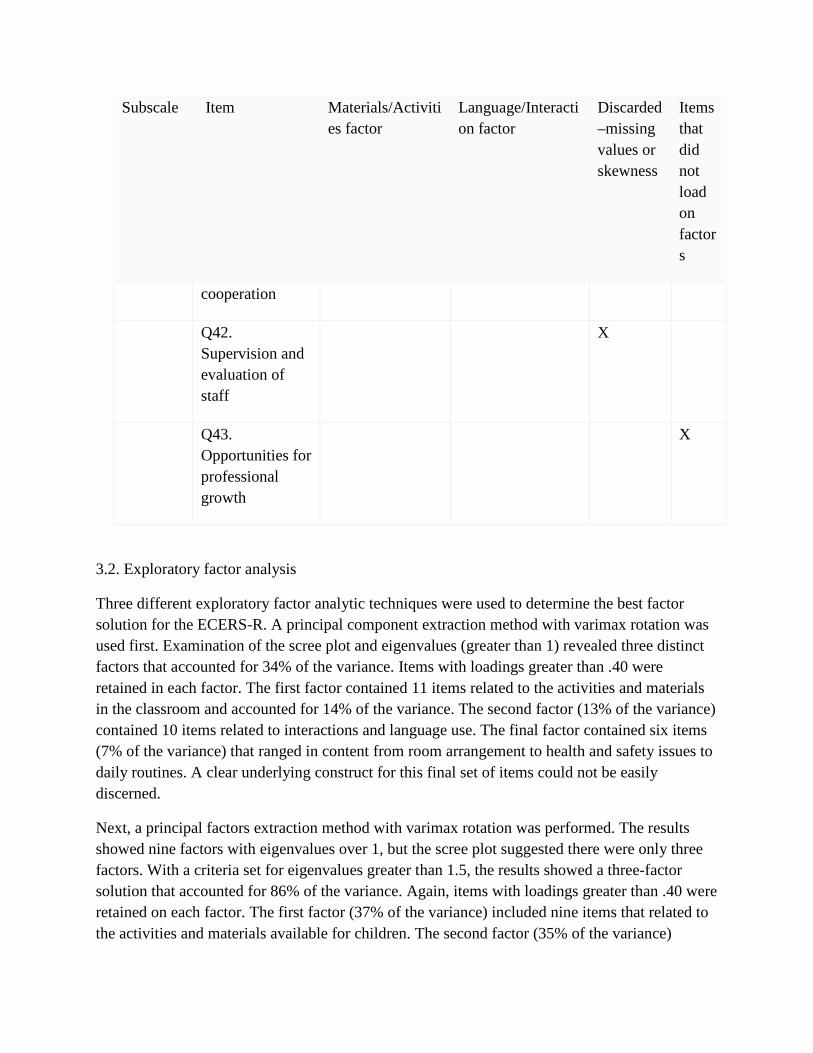
To determine how many unique aspects of quality were being measured in the ECERS-R (either by confirming the seven subscales or establishing a different number of factors), the sample was split in half and both exploratory and confirmatory factor analyses were used. In each of the analyses, items from the original sample with more than 10% missing and then items with highly skewed distributions (>±2.0) were removed. This criterion led to the removal of six items. Three of the items were dropped due to missing data (Item #27—use of TV, video, computers; Item #41—staff interactions and cooperation; Item #37—provisions for children with disabilities) and three were dropped due to high skewness values (Item #9—greeting/departure; Item #16—encouraging children to communicate; Item #42—supervision and evaluation of staff) (see Table 4). Perlman et al. (2004) also reported dropping a high number of items on the ECERS-R. In all, seven items were dropped from their analysis. Before the sample was split, the individual cases with missing data were also removed from the dataset, leaving a total of 958 classrooms with complete data. A random selection procedure in SAS® was utilized to split the file into two data sets. Comparisons of the two data sets revealed they did not differ by teacher education, teacher experience, ECERS-R subscale scores, or overall score. All the exploratory analyses were conducted with the first data set (N = 486) and the confirmatory analyses were done on the second data set (N = 472).
Table 4. Comparison of discarded and retained items in analysis
Subscale Item Materials/Activities factor
Language/Interaction factor
Discarded–missing values or skewness
Items that did not load on factors
1 Q1. Indoor space
X
Q2. Furniture X

Subscale Item Materials/Activities factor
Language/Interaction factor
Discarded–missing values or skewness
Items that did not load on factors
for routine care, play and learning
Q3. Furniture for relaxation
X
Q4. Room arrangement
X
Q5. Space for privacy
X
Q6. Child-related display
X
Q7. Space for gross motor
X
Q8. Gross motor equipment
X
2 Q9. Greeting/departing
X
Q10. Meals/snacks
X
Q11. Nap/rest X

Subscale Item Materials/Activities factor
Language/Interaction factor
Discarded–missing values or skewness
Items that did not load on factors
Q12. Toileting/diapering
X
Q13. Health practices
X
Q14. Safety practices
X
3 Q15. Books and Pictures
X
Q16. Encouraging children to communicate
X
Q17. Using language to develop reasoning skills
X
Q18. Informal use of language
X
4 Q19. Fine motor X
Q20. Art X
Q21. Music/movemen
X

Subscale Item Materials/Activities factor
Language/Interaction factor
Discarded–missing values or skewness
Items that did not load on factors
t
Q22. Blocks X
Q23. Sand/water X
Q24. Dramatic play
X
Q25. Nature/science
X
Q26. Math/number
X
Q27. Use of TV, video, and/or computers
X
Q28. Promoting acceptance of diversity
X
5 Q29. Supervision of gross motor activities
X
Q30. General supervision of children
X

Subscale Item Materials/Activities factor
Language/Interaction factor
Discarded–missing values or skewness
Items that did not load on factors
Q31. Discipline X
Q32. Staff–child interactions
X
Q33. Interactions among children
X
6 Q34. Schedule X
Q35. Free play X
Q36. Group Time
X
Q37. Provisions for children with disabilities
X
7 Q38. Provisions for parents
X
Q39. Provisions for personal needs of staff
X
Q40. Provisions for professional needs of staff
X
Q41. Staff interaction and
X
Subscale Item Materials/Activities factor
Language/Interaction factor
Discarded–missing values or skewness
Items that did not load on factors
cooperation
Q42. Supervision and evaluation of staff
X
Q43. Opportunities for professional growth
X
3.2. Exploratory factor analysis
Three different exploratory factor analytic techniques were used to determine the best factor solution for the ECERS-R. A principal component extraction method with varimax rotation was used first. Examination of the scree plot and eigenvalues (greater than 1) revealed three distinct factors that accounted for 34% of the variance. Items with loadings greater than .40 were retained in each factor. The first factor contained 11 items related to the activities and materials in the classroom and accounted for 14% of the variance. The second factor (13% of the variance) contained 10 items related to interactions and language use. The final factor contained six items (7% of the variance) that ranged in content from room arrangement to health and safety issues to daily routines. A clear underlying construct for this final set of items could not be easily discerned.
Next, a principal factors extraction method with varimax rotation was performed. The results showed nine factors with eigenvalues over 1, but the scree plot suggested there were only three factors. With a criteria set for eigenvalues greater than 1.5, the results showed a three-factor solution that accounted for 86% of the variance. Again, items with loadings greater than .40 were retained on each factor. The first factor (37% of the variance) included nine items that related to the activities and materials available for children. The second factor (35% of the variance)
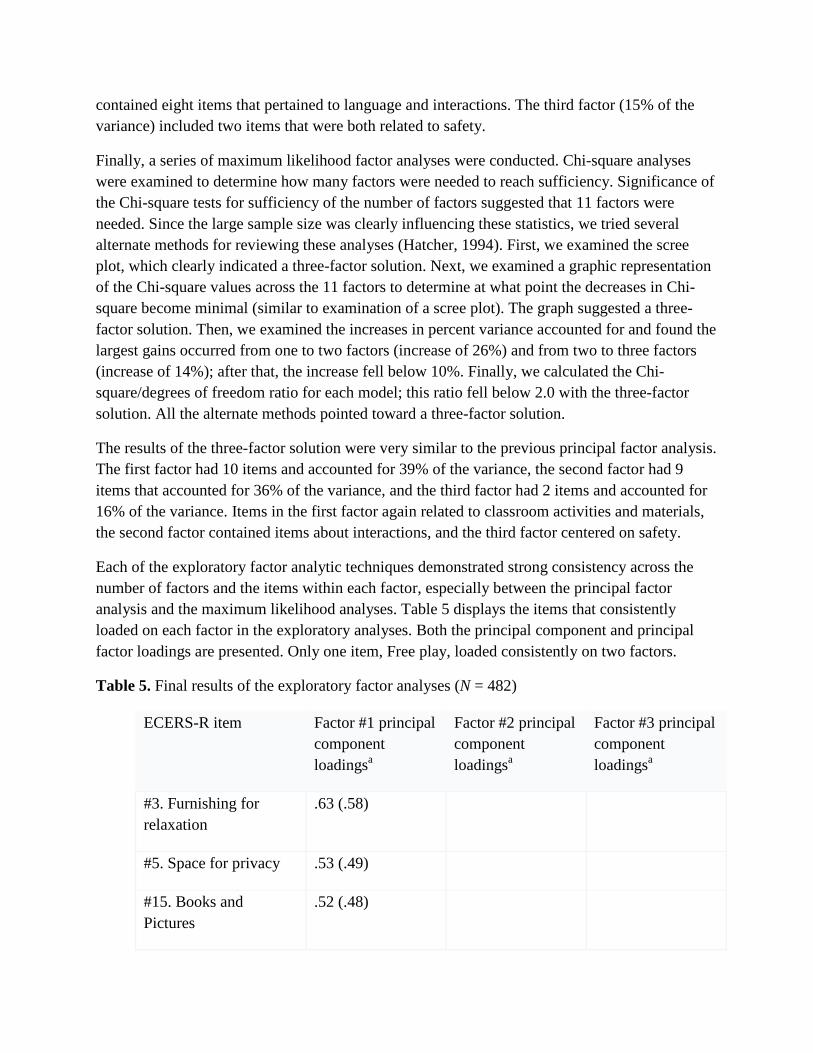
contained eight items that pertained to language and interactions. The third factor (15% of the variance) included two items that were both related to safety.
Finally, a series of maximum likelihood factor analyses were conducted. Chi-square analyses were examined to determine how many factors were needed to reach sufficiency. Significance of the Chi-square tests for sufficiency of the number of factors suggested that 11 factors were needed. Since the large sample size was clearly influencing these statistics, we tried several alternate methods for reviewing these analyses (Hatcher, 1994). First, we examined the scree plot, which clearly indicated a three-factor solution. Next, we examined a graphic representation of the Chi-square values across the 11 factors to determine at what point the decreases in Chi-square become minimal (similar to examination of a scree plot). The graph suggested a three-factor solution. Then, we examined the increases in percent variance accounted for and found the largest gains occurred from one to two factors (increase of 26%) and from two to three factors (increase of 14%); after that, the increase fell below 10%. Finally, we calculated the Chi-square/degrees of freedom ratio for each model; this ratio fell below 2.0 with the three-factor solution. All the alternate methods pointed toward a three-factor solution.
The results of the three-factor solution were very similar to the previous principal factor analysis. The first factor had 10 items and accounted for 39% of the variance, the second factor had 9 items that accounted for 36% of the variance, and the third factor had 2 items and accounted for 16% of the variance. Items in the first factor again related to classroom activities and materials, the second factor contained items about interactions, and the third factor centered on safety.
Each of the exploratory factor analytic techniques demonstrated strong consistency across the number of factors and the items within each factor, especially between the principal factor analysis and the maximum likelihood analyses. Table 5 displays the items that consistently loaded on each factor in the exploratory analyses. Both the principal component and principal factor loadings are presented. Only one item, Free play, loaded consistently on two factors.
Table 5. Final results of the exploratory factor analyses (N = 482)
ECERS-R item Factor #1 principal component loadingsa
Factor #2 principal component loadingsa
Factor #3 principal component loadingsa
#3. Furnishing for relaxation
.63 (.58)
#5. Space for privacy .53 (.49)
#15. Books and Pictures
.52 (.48)

ECERS-R item Factor #1 principal component loadingsa
Factor #2 principal component loadingsa
Factor #3 principal component loadingsa
#19. Fine motor .74 (.69)
#20. Art .71 (.68)
. Blocks .61 (.56)
#23. Sand/water .44 (.41)
#24. Dramatic play .68 (.62)
#25. Nature/science .71 (.69)
#26. Math/number .71 (.68)
#35. Free play .42 (.41) .45 (.42)
#17. Using language to develop reasoning skills
.48 (.43)
#18. Informal use of language
.67 (.63)
#30. General supervision of children
.64 (.59)
#31. Discipline .73 (.71)
#32. Staff–child interactions
.72 (.68)
#33. Interactions among children
.71 (.67)
#36. Group Time .46 (.42)
#38. Provisions for parents
.52 (.44)

ECERS-R item Factor #1 principal component loadingsa
Factor #2 principal component loadingsa
Factor #3 principal component loadingsa
#43. Opportunities for professional growth
.48 (.41)
#7 Space for gross motor
.70 (.62)
#14. Safety practices .71 (.64)
a Principal factor loadings listed in parentheses.
3.3. Confirmatory factor analysis: two-factor, three-factor, and seven-factor model comparison
To evaluate the original seven-factor model and the two- and three-factor models found in the exploratory analyses, we conducted three confirmatory factor analyses using PROC CALIS in SAS®. These analyses using structural equation modeling techniques, allowed us to confirm which model was the best fit for the data. These analyses were run on the second random sample, which contained 472 classrooms. Various measures of fit for these analyses are listed in Table 6 for each of the models. The χ2 value for each of the models was statistically significant; however, the χ2 value for the seven-factor model was over six times larger than the values for the other two models. The ratio of χ2 to degrees of freedom is slightly above the recommended cutoff of 2.0 for all three models. The goodness of fit indices were all far superior for the two- and three-factor models compared to the seven-factor model. For all three models the parameter estimates for the items were all statistically significant, however, the t-values for the two- and three-factor models were much higher than for the seven-factor model. An examination of the factor loadings revealed that all of the items loaded at the .40 level or higher in the two- and three-factor models, but in the seven-factor model, 12 of the 42 items loaded below .40. Taken together these findings suggest that either the two- or three-factor models better represent the data than the seven-factor model.
Table 6. Measures of fit for the two-factor, three-factor, and seven-factor models
Measures of fit information Seven-factor model
Two-factor model
Three-factor model
Number of items 42 16 18
Chi-square value 1704.49 243.84 290.22

Measures of fit information Seven-factor model
Two-factor model
Three-factor model
Probability for Chi-square <.0001 <.0001 <.0001
d.f. 798 103 132
Ratio of Chi-square/d.f. 2.14 2.37 2.20
Goodness of Fit Index (GFI) .84 .94 .94
Comparative Fit Index (CFI) .81 .95 .94
Non-Normed Fit Index (NNFI)
.79 .94 .94
Correlations between the three factor-based scales showed an interesting pattern of results. Factor 1 was moderately correlated with Factor 2 (r = .50), but the correlations between Factor 3 and Factor 1 (r = .09) and between Factor 3 and Factor 2 (r = .19) were quite low. The internal consistency of each factor-based scale and the correlations between each factor-based scale and the overall ECERS-R score illustrated that the third factor was not as internally consistent as the other two, and it was not as strongly related to the overall global measure of quality, most likely due to the factor consisting of only two items (see Table 7).
Table 7. Internal consistency of potential factors and correlations with overall ECERS-R score (N = 472)
ECERS-R potential factors Cronbach's alpha
Correlation with overall ECERS-R score
Factor #1: Activities/Materials .88 .76
Factor #2: Language/Interactions
.81 .81
Factor #3: Safety .65 .36
Combined Factor #1 and #2 .89 .90
Combined Factor #1, #2, and #3
.87 .93
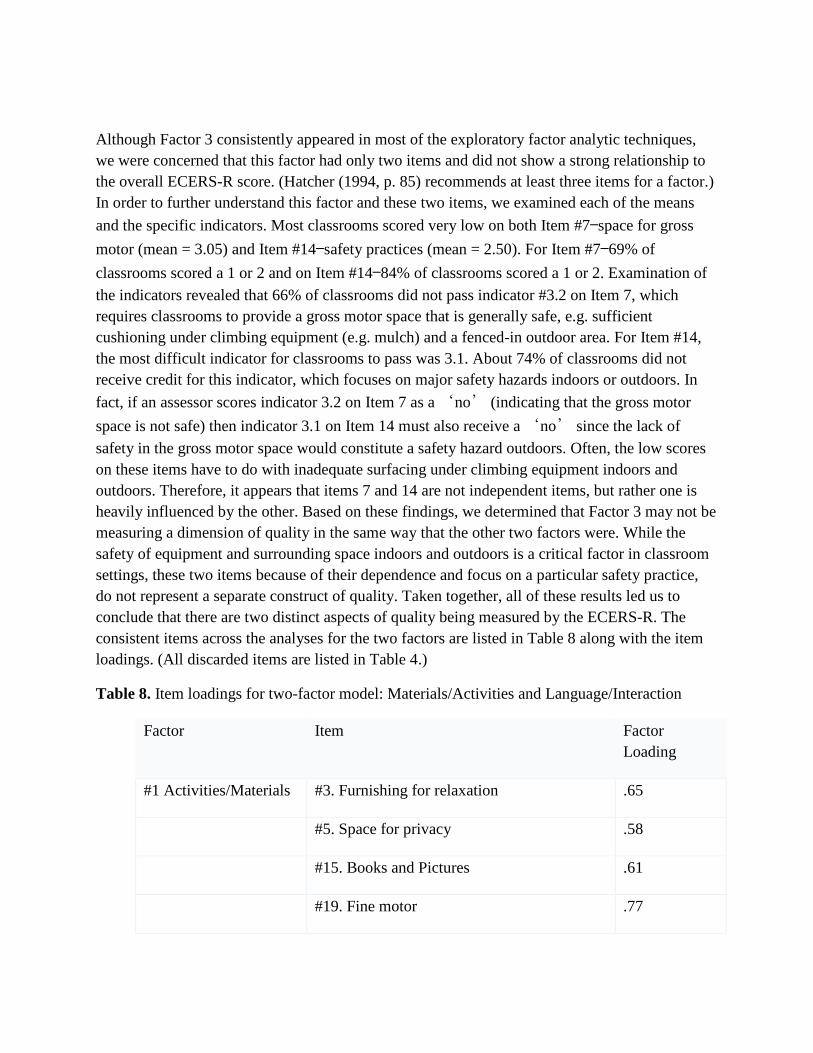
Although Factor 3 consistently appeared in most of the exploratory factor analytic techniques, we were concerned that this factor had only two items and did not show a strong relationship to the overall ECERS-R score. (Hatcher (1994, p. 85) recommends at least three items for a factor.) In order to further understand this factor and these two items, we examined each of the means and the specific indicators. Most classrooms scored very low on both Item #7—space for gross motor (mean = 3.05) and Item #14—safety practices (mean = 2.50). For Item #7—69% of classrooms scored a 1 or 2 and on Item #14—84% of classrooms scored a 1 or 2. Examination of the indicators revealed that 66% of classrooms did not pass indicator #3.2 on Item 7, which requires classrooms to provide a gross motor space that is generally safe, e.g. sufficient cushioning under climbing equipment (e.g. mulch) and a fenced-in outdoor area. For Item #14, the most difficult indicator for classrooms to pass was 3.1. About 74% of classrooms did not receive credit for this indicator, which focuses on major safety hazards indoors or outdoors. In fact, if an assessor scores indicator 3.2 on Item 7 as a ‘no’ (indicating that the gross motor space is not safe) then indicator 3.1 on Item 14 must also receive a ‘no’ since the lack of safety in the gross motor space would constitute a safety hazard outdoors. Often, the low scores on these items have to do with inadequate surfacing under climbing equipment indoors and outdoors. Therefore, it appears that items 7 and 14 are not independent items, but rather one is heavily influenced by the other. Based on these findings, we determined that Factor 3 may not be measuring a dimension of quality in the same way that the other two factors were. While the safety of equipment and surrounding space indoors and outdoors is a critical factor in classroom settings, these two items because of their dependence and focus on a particular safety practice, do not represent a separate construct of quality. Taken together, all of these results led us to conclude that there are two distinct aspects of quality being measured by the ECERS-R. The consistent items across the analyses for the two factors are listed in Table 8 along with the item loadings. (All discarded items are listed in Table 4.)
Table 8. Item loadings for two-factor model: Materials/Activities and Language/Interaction
Factor Item Factor Loading
#1 Activities/Materials #3. Furnishing for relaxation .65
#5. Space for privacy .58
#15. Books and Pictures .61
#19. Fine motor .77
Factor Item Factor Loading
#20. Art .74
#22. Blocks .60
#24. Dramatic play .59
#25. Nature/science .73
#26. Math/number .74
#2 Language/Interaction
#17. Using language to develop reasoning skills
.47
#18. Informal use of language .63
#30. General supervision of children .54
#31. Discipline .78
#32. Staff–child interactions .72
#33. Interactions among children .72
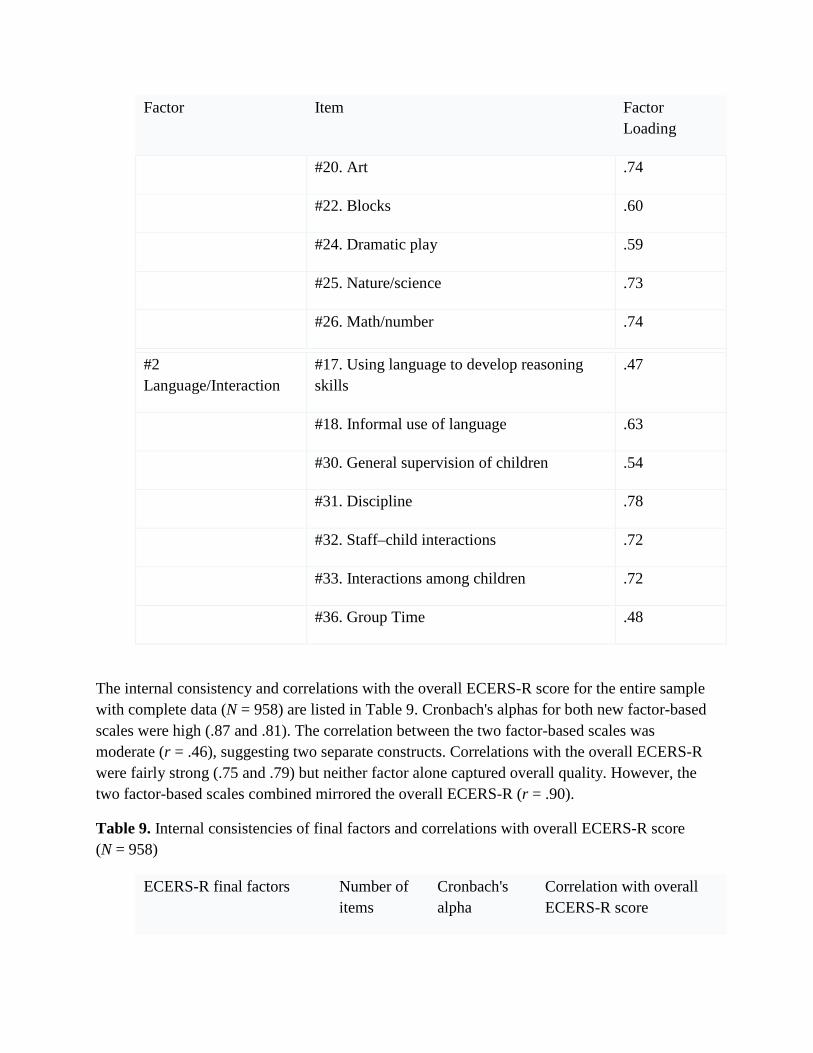
#36. Group Time .48
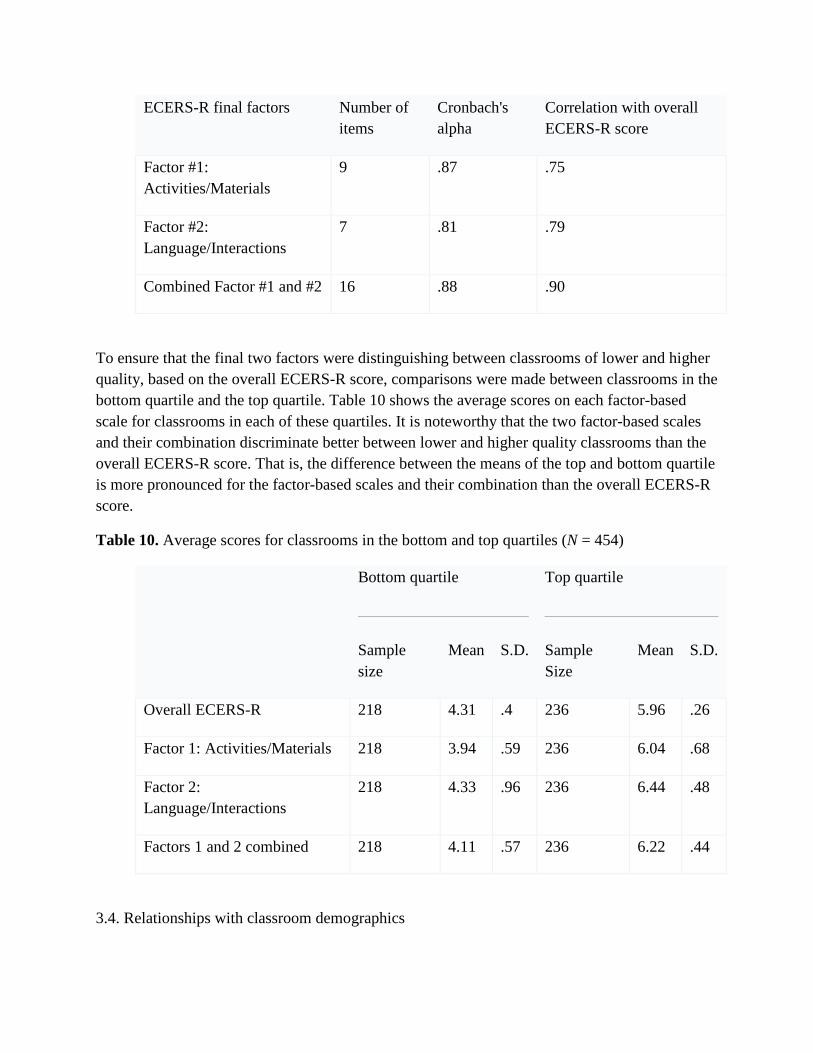
The internal consistency and correlations with the overall ECERS-R score for the entire sample with complete data (N = 958) are listed in Table 9. Cronbach's alphas for both new factor-based scales were high (.87 and .81). The correlation between the two factor-based scales was moderate (r = .46), suggesting two separate constructs. Correlations with the overall ECERS-R were fairly strong (.75 and .79) but neither factor alone captured overall quality. However, the two factor-based scales combined mirrored the overall ECERS-R (r = .90).
Table 9. Internal consistencies of final factors and correlations with overall ECERS-R score (N = 958)
ECERS-R final factors Number of items
Cronbach's alpha
Correlation with overall ECERS-R score
ECERS-R final factors Number of items
Cronbach's alpha
Correlation with overall ECERS-R score
Factor #1: Activities/Materials
9 .87 .75
Factor #2: Language/Interactions
7 .81 .79
Combined Factor #1 and #2 16 .88 .90
To ensure that the final two factors were distinguishing between classrooms of lower and higher quality, based on the overall ECERS-R score, comparisons were made between classrooms in the bottom quartile and the top quartile. Table 10 shows the average scores on each factor-based scale for classrooms in each of these quartiles. It is noteworthy that the two factor-based scales and their combination discriminate better between lower and higher quality classrooms than the overall ECERS-R score. That is, the difference between the means of the top and bottom quartile is more pronounced for the factor-based scales and their combination than the overall ECERS-R score.
Table 10. Average scores for classrooms in the bottom and top quartiles (N = 454)
Bottom quartile
Top quartile
Sample size
Mean S.D. Sample Size
Mean S.D.
Overall ECERS-R 218 4.31 .4 236 5.96 .26
Factor 1: Activities/Materials 218 3.94 .59 236 6.04 .68
Factor 2: Language/Interactions
218 4.33 .96 236 6.44 .48
Factors 1 and 2 combined 218 4.11 .57 236 6.22 .44
3.4. Relationships with classroom demographics
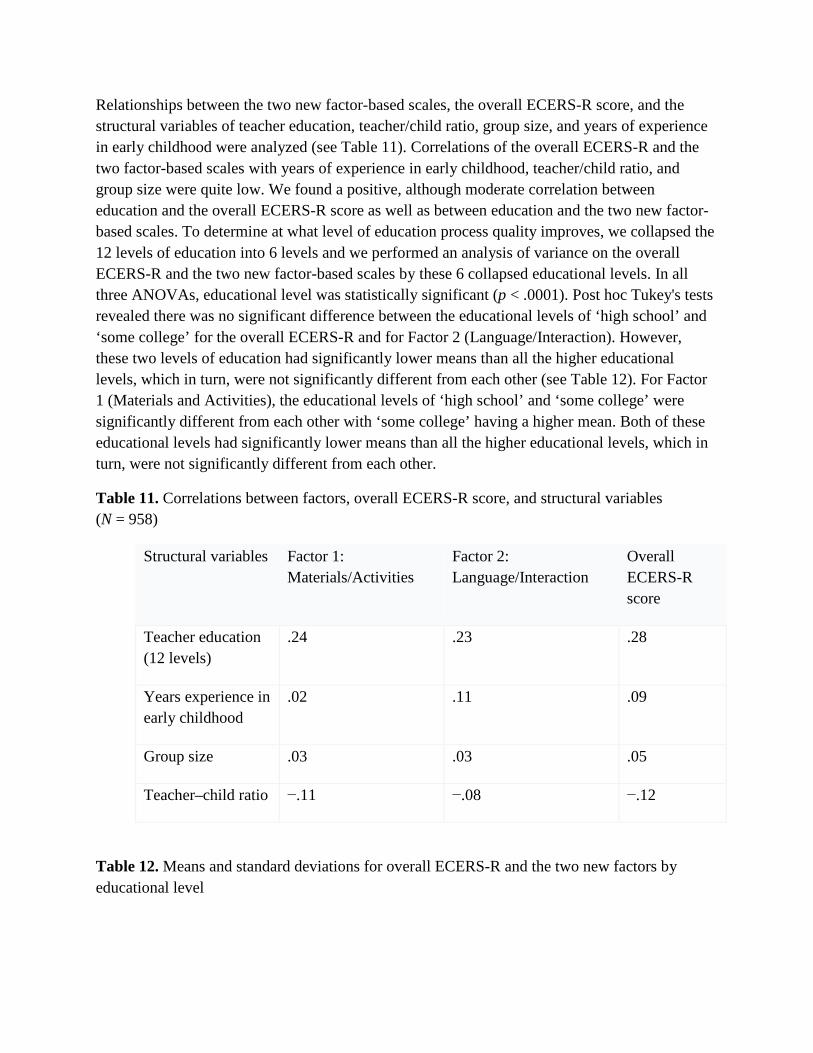
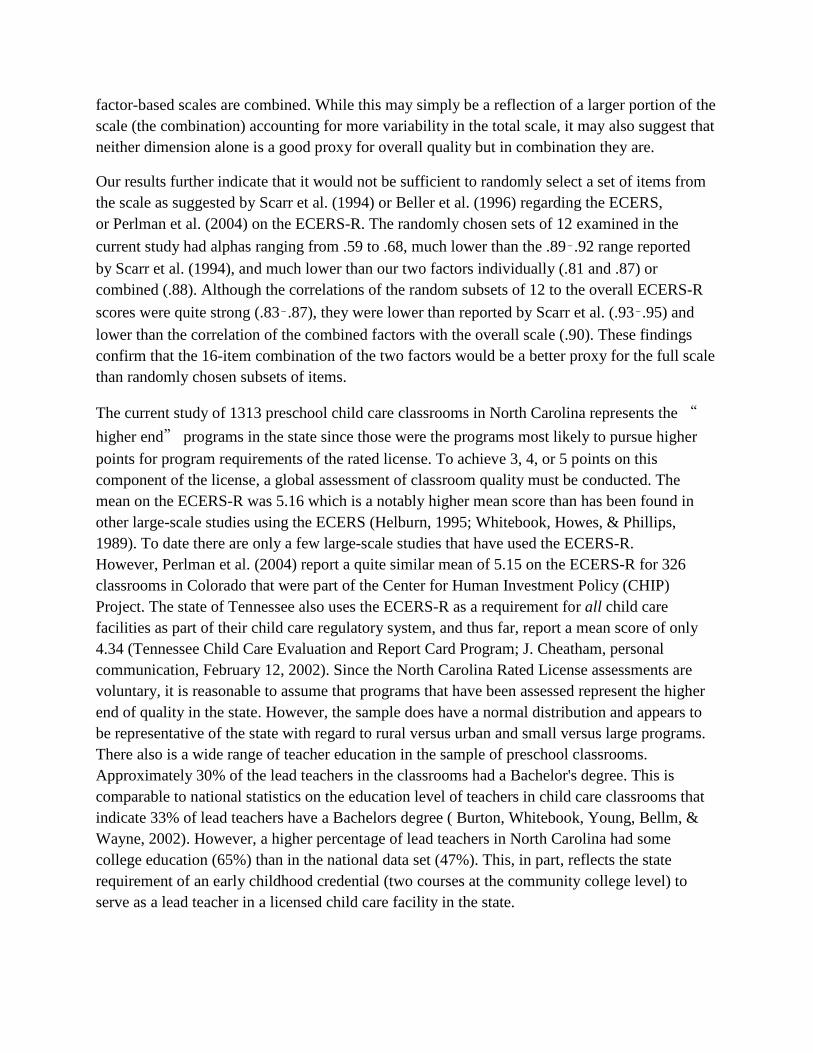
Relationships between the two new factor-based scales, the overall ECERS-R score, and the structural variables of teacher education, teacher/child ratio, group size, and years of experience in early childhood were analyzed (see Table 11). Correlations of the overall ECERS-R and the two factor-based scales with years of experience in early childhood, teacher/child ratio, and group size were quite low. We found a positive, although moderate correlation between education and the overall ECERS-R score as well as between education and the two new factor-based scales. To determine at what level of education process quality improves, we collapsed the 12 levels of education into 6 levels and we performed an analysis of variance on the overall ECERS-R and the two new factor-based scales by these 6 collapsed educational levels. In all three ANOVAs, educational level was statistically significant (p < .0001). Post hoc Tukey's tests revealed there was no significant difference between the educational levels of ‘high school’ and ‘some college’ for the overall ECERS-R and for Factor 2 (Language/Interaction). However, these two levels of education had significantly lower means than all the higher educational levels, which in turn, were not significantly different from each other (see Table 12). For Factor 1 (Materials and Activities), the educational levels of ‘high school’ and ‘some college’ were significantly different from each other with ‘some college’ having a higher mean. Both of these educational levels had significantly lower means than all the higher educational levels, which in turn, were not significantly different from each other.
Table 11. Correlations between factors, overall ECERS-R score, and structural variables (N = 958)
Structural variables Factor 1: Materials/Activities
Factor 2: Language/Interaction
Overall ECERS-R score
Teacher education (12 levels)
.24 .23 .28
Years experience in early childhood
.02 .11 .09
Group size .03 .03 .05
Teacher–child ratio −.11 −.08 −.12
Table 12. Means and standard deviations for overall ECERS-R and the two new factors by educational level

Educational level Overall ECERS-R
Factor 1 Materials/Activities
Factor 2 Language/Interaction
Mean S.D. Mean S.D. Mean S.D.
High school 4.80 .61 4.22 .86 5.09 .99
Some college 5.04 .62 4.77 .99 5.39 1.05
2-year degree 5.28 .61 5.03 1.03 5.73 1.02
4-year degree (other field)
5.37 .59 5.25 1.00 5.86 .96
4-year degree (CD/ECE)
5.44 .56 5.30 .99 5.85 .99
Graduate work 5.43 .63 5.27 1.15 5.97 .92
3.5. Random selection of items
To replicate Scarr et al.'s (1994) finding that the original ECERS could be reduced to a single factor scale represented by any 12 items (α = .90), a similar analysis was conducted with 3 randomly selected subsets of 12 items each. The Cronbach alphas for these three random subscales were .59, .68, and .61, respectively. The randomly selected items do not seem to hold together as well as either of the two new factor-based scales identified in the current study. Correlations between the 12 randomly selected items and the overall ECERS-R mean were .87, .85, and .83. These correlations are higher than the correlations obtained for our two new factor-based scales (r = .75 and .79), probably because the random sets are capturing items from both dimensions measured by the two new factor-based scales or simply because they contain a larger portion of the entire scale (28% of the total 43 items) than either Factor 1 (21%) or Factor 2 (16%). However, when the two factor-based scales are combined (16 items), they have a higher correlation with the overall ECERS-R (r = .90) than any of the random sets of 12 items. These 16 items may be more highly correlated with the overall scale because they are the essence of what the overall scale is measuring or simply because they represent a higher portion of the entire scale (37%) than any of the random sets (28%).
4. Discussion

Results of this study indicate that a shorter version of 16 items of the ECERS-R can be an efficacious scale and one that is a relatively good proxy for scores on the full scale. The 16 items correlated strongly with the overall ECERS-R (r = .90) and clearly differentiated the top quartile programs from the bottom quartile programs. The 16 items that loaded on the two factors of the ECERS-R reflect two widely held constructs of quality: Activities/Materials and Language/Interactions. The first factor includes 6 of the 10 items in the Activities subscale, 2 items from the Space and Furnishings subscale as well as an item from the Language Reasoning subscale (Books and Pictures). The nine items in this factor collectively measure the materials and activities that are provided in the classroom environment. The second factor includes four of the five items in the Interaction subscale, two items from the Language Reasoning subscale, and one item from the Program Structure subscale. Examination of the items indicates that although two items are from the Language Reasoning subscale, they measure teacher verbalizations with the children: Item #17 measures language used to develop reasoning skills, and Item #18 assesses the informal use of language in the classroom. The item from the Program Structure subscale is “Group Time” which requires a substantial amount of verbal input from the teacher as she manages the group and encourages participation. Obviously, the Interaction subscale items also require teacher verbalizations.
The two factor-based scales confirmed in this study could prove advantageous in future research conducted on the quality of care and education settings. Although these 16 items could certainly expedite the research process, one might question whether a 16-item scale would suffice for the regulatory system or for consultation purposes. As Scarr et al. (1994) explained, the additional detail provided by the full scale of 43 items, in the case of the ECERS-R, may be necessary for such purposes. For example, the items in the Personal Care Routines subscale did not load on either factor. However, the scores achieved by the 1313 preschool classrooms assessed on this subscale are the lowest of any of the subscales. It would seem prudent to further investigate, from a regulatory perspective, what factors (e.g., hand washing) might be causing such low Personal Care Routine subscale scores. This is critical information needed in order to protect the health and safety of young children who are cared for and educated in group settings. It is also interesting to note that these items did not seem to differentiate higher quality from lower quality programs. That is, even in this higher quality sample, scores were quite low for most classrooms on this subscale.
The two factor-based scales also seem to represent fairly distinct dimensions of quality, as indicated by the only moderate correlation of .46 between the two scales. This correlation would seem to indicate that although the materials and activities available in a classroom are somewhat related to the interactions that take place in a classroom, one is not entirely dependent on the other. Indeed, it is easy to imagine a classroom that would have more than adequate materials available but a teacher who is less than inadequate in her ability to interact appropriately with the children. Another indication of distinct dimensions is reflected in the correlations of .75 and .79 of the two scales with the overall ECERS-R compared to a correlation of .90 when the two
factor-based scales are combined. While this may simply be a reflection of a larger portion of the scale (the combination) accounting for more variability in the total scale, it may also suggest that neither dimension alone is a good proxy for overall quality but in combination they are.
Our results further indicate that it would not be sufficient to randomly select a set of items from the scale as suggested by Scarr et al. (1994) or Beller et al. (1996) regarding the ECERS, or Perlman et al. (2004) on the ECERS-R. The randomly chosen sets of 12 examined in the current study had alphas ranging from .59 to .68, much lower than the .89–.92 range reported by Scarr et al. (1994), and much lower than our two factors individually (.81 and .87) or combined (.88). Although the correlations of the random subsets of 12 to the overall ECERS-R scores were quite strong (.83–.87), they were lower than reported by Scarr et al. (.93–.95) and lower than the correlation of the combined factors with the overall scale (.90). These findings confirm that the 16-item combination of the two factors would be a better proxy for the full scale than randomly chosen subsets of items.
The current study of 1313 preschool child care classrooms in North Carolina represents the “higher end” programs in the state since those were the programs most likely to pursue higher points for program requirements of the rated license. To achieve 3, 4, or 5 points on this component of the license, a global assessment of classroom quality must be conducted. The mean on the ECERS-R was 5.16 which is a notably higher mean score than has been found in other large-scale studies using the ECERS (Helburn, 1995; Whitebook, Howes, & Phillips, 1989). To date there are only a few large-scale studies that have used the ECERS-R. However, Perlman et al. (2004) report a quite similar mean of 5.15 on the ECERS-R for 326 classrooms in Colorado that were part of the Center for Human Investment Policy (CHIP) Project. The state of Tennessee also uses the ECERS-R as a requirement for all child care facilities as part of their child care regulatory system, and thus far, report a mean score of only 4.34 (Tennessee Child Care Evaluation and Report Card Program; J. Cheatham, personal communication, February 12, 2002). Since the North Carolina Rated License assessments are voluntary, it is reasonable to assume that programs that have been assessed represent the higher end of quality in the state. However, the sample does have a normal distribution and appears to be representative of the state with regard to rural versus urban and small versus large programs. There also is a wide range of teacher education in the sample of preschool classrooms. Approximately 30% of the lead teachers in the classrooms had a Bachelor's degree. This is comparable to national statistics on the education level of teachers in child care classrooms that indicate 33% of lead teachers have a Bachelors degree ( Burton, Whitebook, Young, Bellm, & Wayne, 2002). However, a higher percentage of lead teachers in North Carolina had some college education (65%) than in the national data set (47%). This, in part, reflects the state requirement of an early childhood credential (two courses at the community college level) to serve as a lead teacher in a licensed child care facility in the state.
Although the current findings are quite similar to other studies with regard to the relationship between teacher education and higher classroom quality (Burchinal et al., 2002, Phillipsen et al., 1997 and Whitebook et al., 1989), it is somewhat surprising that there were no significant differences in ECERS-R scores between the AA or AAS degrees at the community college and higher levels of education. Burchinal et al. (2002) reported that teachers with a Bachelors degree scored significantly higher on the ECERS than did teachers with an AA degree or less education. Similarly, Whitebook et al. (1989) reported significantly higher scores on one factor of the ECERS (Appropriate Caregiving) for teachers with a Bachelors degree than for teachers with less education. The mean scores in the current study did progress steadily with increasing education, but there were no significant differences beyond the community college degree.
4.1. Implications and future research directions
The current research provides a provocative examination of one of the most commonly used research instruments in preschool classrooms—the ECERS-R. The use of the ECERS-R for regulatory purposes is becoming increasingly more common and thus the scale has important implications for practitioners. The descriptive findings from the scale suggest that practitioners need to pay careful attention to the items in the Personal Care Routines subscale as well as the Space and Furnishing subscale to improve quality in these areas. The averages for each of these subscales fell below the categorization of “good”. It appears that quality improvement efforts should include health and safety practices as well as providing appropriate activities and materials and high quality interactions with young children.
The detailed factor analyses provide convincing evidence regarding the dimensions of quality in early childhood classrooms. Further research should examine whether or not shortening the scale by using only the factor-based scales actually translates into less observation time. Clearly, next steps should examine the relationship between the two factor-based scales identified in the research and child outcomes to determine if the 16-item brief scale is sufficient to measure all dimensions of classroom quality that impact children's development and later school success. In addition, future research should further examine the relationship between 2- and 4-year programs of higher education and how the content of coursework in these degree programs relates to actual classroom practices and classroom quality.
References
Beller, E. K., Stahnke, M., Butz, Stahl, W., & Wessels, H. (1996). Two measures of the quality of group care for infants and toddlers. European Journal of Psychology of Education, 11(3), 151–167.
Burchinal, M. R., Cryer, D., Clifford, R. M., & Howes, C. (2002). Caregiver training and classroom quality in child care centers. Applied Developmental Science, 6(1), 2–11.

Burton, A., Whitebook, M., Young, M., Bellm, D., & Wayne, C. (2002). Estimating the size and components of the U.S. child care workforce and caregiving population. Washington, DC: National Center for the Child Care Workforce.
Harms, T., & Clifford, R. (1980). Early childhood environment rating scale. New York: Teachers College Press.
Harms, T., Clifford, R., & Cryer, D. (1998). Early childhood environment rating scale-revised. New York: Teachers College Press.
Hatcher, L. (1994). A step-by-step approach to using the SAS® system for factor analysis and structural equation modeling. Cary, NC: SAS® Institute, Inc.
Helburn, S., 1995.Cost, quality, and child outcomes in child care centers. Available from the Department of Economics, Center for Research in Economic and Social Policy, University of Colorado at Denver.
Holloway, S. D., Kagan, S., Fuller, B., Tsou, L., & Carroll, J. (2001). Assessing child-care quality with a telephone interview. Early Childhood Research Quarterly, 16(2), 165–189.
Howes, C., Phillips, D. A., & Whitebook, M. (1992). Thresholds of quality: Implications for the social development of children in center-based child care. Child Development, 63, 449–460.
Moore, Halle, Vandivere, & Mariner. (2002). Scaling back survey scales: How short is too short? Sociological Methods and Research, 30, 530–566.
Munton, A. G., Rowland, L., Mooney, A., & Lera, M. J. (1997). Using the early childhood environment rating scale (ECERS) to evaluate quality of nursery provision in England: Some data concerning reliability. Educational Research, 39(1), 99–104.
Perlman, M., Zellman, G. L., & Le, V. (2004). Examining the psychometric properties of the early childhood rating scale-revised (ECERS-R). Early Childhood Research Quarterly, 19(3), 398–412.
Phillipsen, L. C., Burchinal, M. R., Howes, C., & Cryer, D. (1997). The prediction of process quality from structural features of child care. Early Childhood Research Quarterly, 12, 281–303.
Phillips, D., Mekos, D., Scarr, S., McCartney, K., & Abbott-Shim, M. (2000). Within and beyond the classroom door: Assessing quality in child care centers. Early Childhood Research Quarterly, 15, 475–496.
Sakai, L., Whitebook, M., Wishard, A., & Howes, C. (2003). Evaluating the early childhood rating scale: Assessing differences between the first and revised edition. Early Childhood Research Quality, 18, 427–445.

Scarr, S., Eisenberg, M., & Deater-Deckard, K. (1994). Measurement of quality in child care centers. Early Childhood Research Quarterly, 9, 131–151.
Whitebook, M., Howes, C., & Phillips, D. (1989). Who cares? Child care teachers and the quality of care in America. Final report of the National Child Care Staffing Study. Oakland, CA: Child Care Employee Project.