measurement of dioxin emissions from bushfires in...
TRANSCRIPT

Measure
ment of D
ioxin
Em
issio
ns fro
m
Bushfire
s in A
ustr
alia
Tea
m:
Jochen M
uelle
r-N
RC
ET
Garr
y C
ook, D
onovan M
arn
ey,-
CS
IRO
Kevin
Tolh
urs
t –
Melb
Uni
Lachie
McC
aw
-D
EC
, W
A
Bob S
ym
ons, N
MI
Supported by the Australian Commonwealth Government
Department of Environment and W
ater
Mic
k M
eyer
CS
IRO
Marine a
nd A
tmosph
eri
c R
esearc
h,
Aspend
ale
,
Vic
toria,
AU
ST
RA
LIA
Mic
k,M
eyer@
csiro.a
u

In 2
006:
66 M
ha
16%
of
NT
,10%
of W
A,
6%
of Q
ld.
8%
of
Austr
alia
That
pro
duces a
lot
of
dio
xin
s

Dio
xin
s
•210 P
CD
Ds
& P
CD
Fs
•th
e 2,3
,7,8
dio
xin
s an
d f
ura
ns
are
toxic
•7 P
CD
Ds,
10 P
CD
Fs
are
assi
gned
toxic
ity w
eightings
•list
ed in the
Sto
ckholm
Conven
tion o
n
PO
Ps

Invento
ries
M
ass
Em
issio
n f
acto
r E
mis
sio
n
(t
) ug
TE
Q/t
g
To a
ir
To
lan
d
To a
ir
To
lan
d
Sa
van
na a
nd T
em
pera
te G
rassla
nd
216,1
73,0
00
5
4
1081
865
Pre
scrib
ed
burn
ing
of
fore
sts
3,5
05,0
00
5
4
18
14
Wild
fire
s
10,5
88,0
00
5
4
53
42
Agricu
ltura
l re
sid
ues-
wh
ea
t 3,4
92,0
00
0.5
1
0
2
35
Agricu
ltura
l re
sid
ues-
coa
rse
gra
ins
6,0
44,0
00
0.5
1
0
3
60
Agricu
ltura
l re
sid
ues-
sug
ar
653
,300
0.5
1
0
0
7
Total
1156
1023
All sources
1410
1300
82%
79%
B
ushfire
s a
re t
he larg
est
sourc
e a
nd t
he m
ost
uncert
ain
sourc
e in t
he I
nvento
ry
National
Dioxin
Program
(2004)
Environment
Australia
(2002)
Em
issio
n
facto
rs
(u
g T
EQ
.t)
Em
issio
n (
g
TE
Q)
Sa
van
na a
nd t
em
pera
te
gra
ssla
nds
0.5
-10
3.5
-68
Pre
scrib
ed
burn
ing
, stu
bble
burn
ing
0.5
-10
62
- 12
40
Wild
fire
s
0.5
-28
7-4
00
Total
72-1700
(46%-81%)
1994
2001

Outlin
e
�F
ire
s
�M
ea
su
rin
g e
mis
sio
n f
acto
rs
�P
ote
ntia
l m
ea
su
rem
en
t a
rtifa
cts
�R
esid
ue
s
�D
isp
ers
ion
�E
me
rgin
g issu
es

Fires in A
ustr
alia

Thre
e e
stim
ate
s o
f glo
bal bio
mass b
urn
ing in
2002
M. S
imon, S. Plu
mm
er, F. Fie
rens,
J. J.
Hoel
zem
ann, an
d O
. A
rino
(2004)
Jan-M
ar
April-Ju
ne
July
-Sept
Oct
-D
ec

Glo
bal em
issio
ns
Fro
m K
asis
chke
and P
enner
(2004)
G
LO
BS
CA
R
GB
A-2
00
0
A
rea (
Mh
a)
%
Are
a (
Mha
) P
erc
enta
ge
Afr
ica
1
21
57
.4%
2
24
.6
64%
No
rth/C
en
tra
l A
me
rica
1
1
5.2
%
6.2
2
%
So
uth
Am
eri
ca
1
3.8
6
.5%
1
1.9
3
%
Au
str
alia
1
8
8.5
%
55.9
1
6%
Asia
2
1.2
10
.1%
2
7.1
8
%
Eu
rop
e
5.8
2
.8%
4
.3
1%
Ru
ssia
2
0
9.5
%
22.2
6
%
Global
210.7
100.0%
352.2
100%
Austr
alia
n f
ire s
car
analy
sis
1999/2
000 =
52
Mha
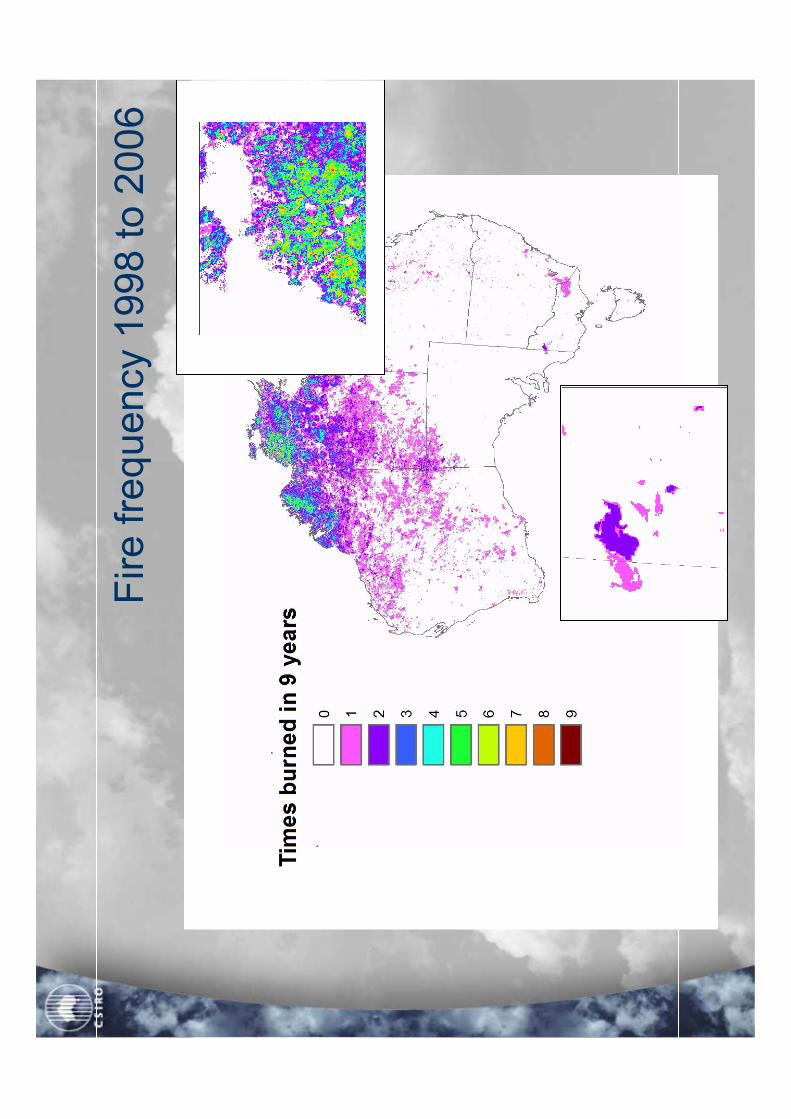
Fire fre
quency 1
998 to 2
006

When f
ires h
appen
�F
ires a
re f
uel lim
ited
�T
here
is a
lways a
n ignitio
n s
ourc
e
05
10
15
20
25
30
Percent annual
regional area
Jan
Mar
May
Jul
Sep
Nov
0510
15
20
25
30
35
40
Percent annual
regional area
Jan
Mar
May
Jul
Sep
Nov
�F
ires a
re NOT
fuel lim
ited
�Ig
nitio
n/p
ropagation is w
eath
er
dependent

Wild
fire
Causes
Cau
seN
um
ber
of
fire
s
%
Lig
htn
ing
1602
25
Fore
stry
per
sonnel
255
4
Rec
reat
ional
use
rs600
10
Res
iden
ts/F
arm
ers
2117
33
Unknow
n/A
rson
1627
26
Unre
port
ed99
2
Cau
ses
of
fire
s in
Sta
te F
ore
sts
and N
atio
nal
Par
ks
in V
icto
ria
1990-1
999.
Most
fir
es h
ave
anth
ropogen
ic ignitio
n c
ause
s

Austr
alia
n c
arb
on e
mis
sio
n e
stim
ate
s
(2000)
Veg
etation
% Total carbon emitted
N
SW
T
as
WA
SA
Vic
Q
ld
NT
A
CT
AU
ST
Tro
pic
al s
avan
nah
0
0
89
0
0
88
100
0
89
Open
woodla
nd a
nd
tem
per
ate
gra
ssla
nd
10
6
- 34
5
0
0
0
Fore
st, P
resc
ribed
15
13
2
0
41
2
0
10
2
Fore
st, W
ildfi
re
49
80
8
0
33
3
0
90
6
Cer
eals
24
1
2
66
21
3
0
0
3
Sugar
2
0
0
0
0
4
0
0
0
Tota
l 100
100
100
100 100
100
100
100
100
% N
atio
nal
em
issi
on
1.2
0.1
2
36.1
0.5
0
0.4
15.6
40.9
0.0
100
%N
atio
nal
em
issi
on
excl
udin
g tro
pic
al
savannah
1.2
0.1
3.9
0.5
0.4
1.9
0.0
0.0
8.1
M
ost
of
the e
mis
sio
ns a
re f
rom
savanna
wo
odla
nd a
nd
arid g
rassla
nd in N
ort
hern
Austr
alia
wh
ere
th
e p
opu
latio
n
is lo
w.
Wild
fire
s,
agricultura
l a
nd p
rescribed f
ires a
re w
here
most
of
the p
opula
tion liv
e-i
n t
he S
outh
and a
lon
g t
he E
ast
Coast

Savanna fire area (ha)
0
20x10
6
40x10
6
60x10
6
80x10
6
100x10
6
Prescribed and Wildfire Areaha
0
1x10
6
2x10
6
3x10
6
4x10
6
5x10
6
Savanna
Wild
fire
Pre
scribed
1980
1985
1990
1995
2000
2005
2010
Fraction Savanna
0.9
0
0.9
2
0.9
4
0.9
6
0.9
8
1.0
0
Fire A
rea
Are
a
Fra
ctio
n S
avan
na

National E
mis
sio
n T
imeseries
19
80
198
519
90
199
520
00
20
05
20
10
Emission (Gg CO2-e)
0
50
00
100
00
150
00
200
00
Savanna
Pre
scribed
Wild
fire
0
50
00
100
00
150
00
200
00
250
00
Invento
ry
Annual
Sydney
, 1992
Can
ber
ra, 2003
Ash
Wed
nes
day
, 1983

0
20
,00
0,0
00
40
,00
0,0
00
60
,00
0,0
00
80
,00
0,0
00
10
0,0
00
,00
0 19
80
19
85
19
90
19
95
20
00
20
05
Ye
ar
Fire area (ha)
To
p
Ce
ntr
e
To
tal
20
02
NG
GI
-
10
,00
0,0
00
20
,00
0,0
00
30
,00
0,0
00
40
,00
0,0
00
50
,00
0,0
00
60
,00
0,0
00
70
,00
0,0
00
80
,00
0,0
00
19
88
19
92
199
620
00
20
04
Year
Fire scar area (ha)
NT
Top
NT
Ce
ntr
e
WA
Top
WA
Cen
tre
To
tal
Inte
r-an
nual
Var
iability o
f
Sav
anna
Fir
es
Rang
e m
in t
o m
ax
Woodla
nds ~
2
Gra
ssla
nds ~
80

Fire H
isto
ry in V
icto
ria
1940-1
999
~60%
of
fore
st/w
oodla
nd
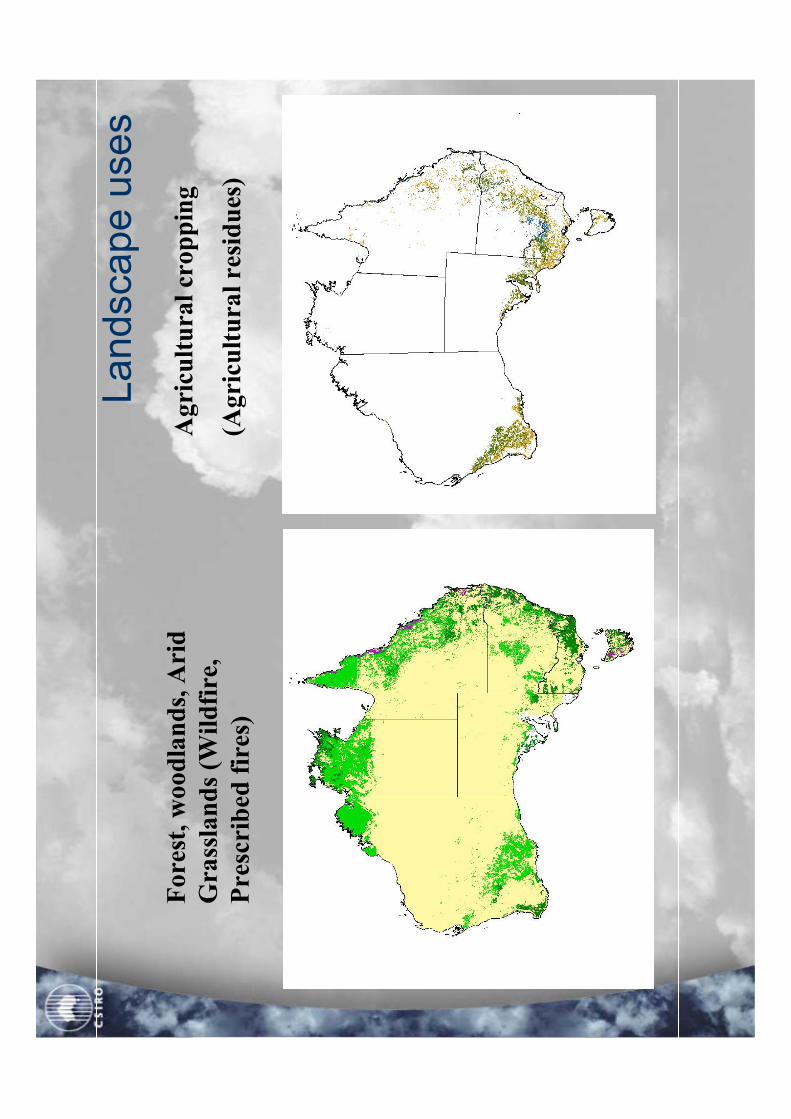
Landscape u
ses
Fore
st, w
oodla
nds, A
rid
Gra
ssla
nds (W
ildfire
,
Pre
scri
bed
fir
es)
Agri
cultura
l cr
oppin
g
(Agri
cultura
l re
sidues
)

Fir
es a
re:
�A
na
tura
l p
art
of
the
Au
str
alia
n la
nd
sca
pe
�H
igh
ly v
ari
ab
le f
rom
ye
ar
to y
ea
r
�A
ma
jor
co
mp
on
en
t o
f th
e c
arb
on
cycle
Fir
es f
rom
la
nd
cle
ari
ng
are
ve
ry d
iffe
ren
t
�O
ccu
r o
nce
�O
fte
n o
n to
pso
ils w
ith
hig
h c
arb
on
co
nte
nt

How
do w
e m
easure
dio
xin
em
issio
ns

Em
issi
on =
Fuel
burn
ed x
em
issi
on f
acto
r
Fuel
burn
ed=
Are
a x f
uel
load
x c
om
bust
ion e
ffic
iency
How
to d
eter
min
e em
issi
on f
acto
rs:
•D
irec
t m
easu
rem
ent –
mas
s dio
xin
em
itte
d/m
ass
fuel
burn
ed -
poss
ible
in lab
ora
tory
•Fro
m a
tmosp
her
ic c
once
ntr
atio
n m
easu
rem
ents
usi
ng a
dual
tra
cer
tech
niq
ue
–fi
eld m
ethod

Dio
xin
em
issio
ns f
rom
bio
mass b
urn
ing
•S
urr
ogat
e es
tim
ates
wer
e m
ade
usi
ng w
ood
com
bust
ion h
eate
rs w
ere
mad
e usi
ng o
pen
com
bust
ion c
ham
ber
s (0
.5 to 3
0 u
gT
EQ
/kg)
•F
ield
mea
sure
men
ts (
e.g
(Pra
nge,
Muel
ler
et a
l.
(NR
CE
T)
�Lo
w r
ate
s,
OC
DD
dom
inate
d
•C
om
bust
ion r
oom
s e.
g. G
ullet
tan
d T
ouat
i(U
S
EP
A) �
0.5
-55 u
gT
EQ
/kg
�F
uel depe
nde
nt

Measurement Principle
Du
al tr
ace
r te
ch
niq
ue
][]
[C
PC
DD
EE
CP
CD
D×
=
Tra
cer
(Ec)
is tota
l vola
tilise
d f
uel
car
bon

Fuel
50%
car
bon
1 k
g b
urn
ed f
uel
=500 g
fuel
carb
on
Raw
Sm
oke
500 g
car
bon,
1 n
g T
EQ
PC
DD
/F,
ratio =
2 p
g T
EQ
(g C
)-1
O2
Sm
oke
plu
me
Fro
m fuel
:
500 g
car
bon,
1 n
g T
EQ
PC
DD
/F
ratio =
2 p
g T
EQ
(g C
)-1
Fro
m a
mbie
nt air
56 to 1
680 g
C
0.1
to 0
.4 n
g T
EQ
PC
DD
/F
Am
bie
nt A
ir
0.2
gC
m-3
0.0
5 p
g T
EQ
PC
DD
/Fm
-3
Combustion
Dilution
1.8
m3
280 –
8400 m
3
282 –
8402 m
3
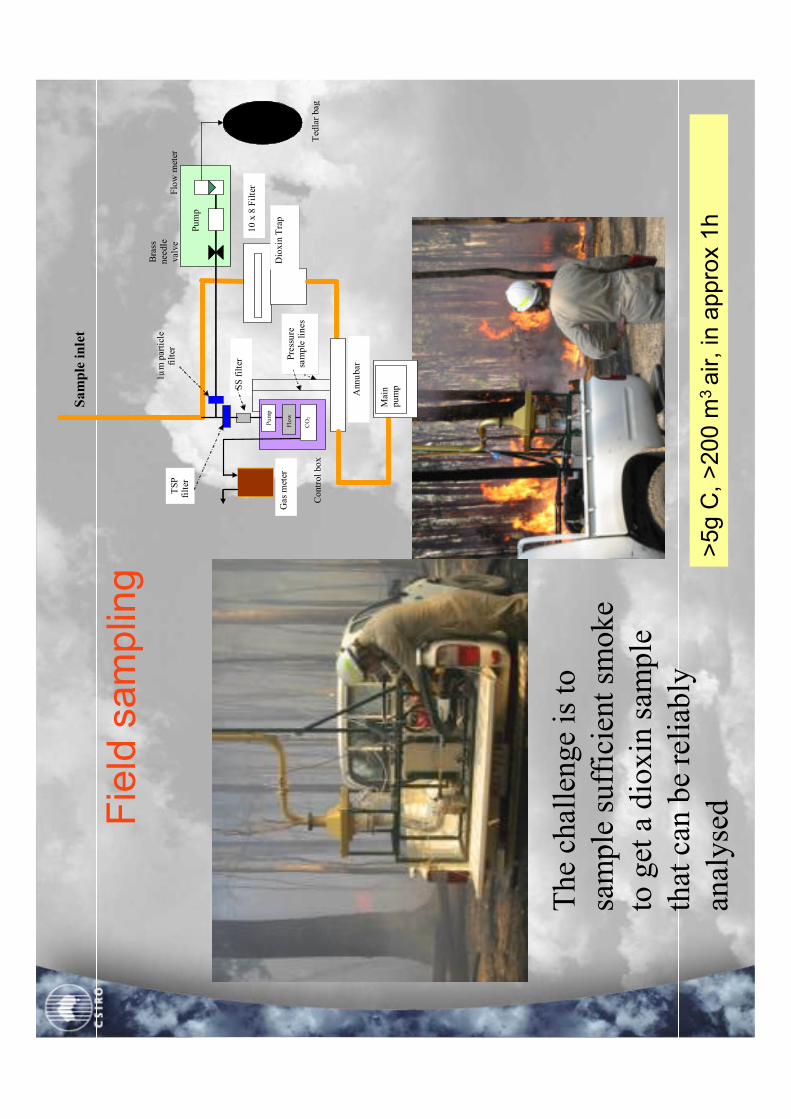
Fie
ld s
am
plin
g
Sam
ple
inle
t
Dio
xin
Tra
p
10 x
8 F
ilte
r
Gas
met
er
SS f
ilte
r
TSP
filt
er
1µ
m p
art
icle
filt
er
Annubar
Bra
ss
needle
valv
e
Pum
p
Flo
w m
eter
Ted
lar
bag
Contr
ol box
Main
pum
p
Pre
ssure
sa
mple
lin
es
CO
2
Flo
w
Pum
p
The
chal
lenge
is to
sam
ple
suff
icie
nt sm
oke
to g
et a
dio
xin
sam
ple
that
can
be
reliab
ly
anal
yse
d>
5g C
, >
200 m
3 a
ir,
in a
ppro
x 1
h

In t
he
Fie
ld

Savanna
Fires
Earl
y s
easo
n
Late
seaso
n

Fu
el b
ed
an
d s
oil
tem
pe
ratu
res P
rescribe
d b
urn
,
Vic
toria
0
50
100
150
13
:00
:00
14
:00
:00
1
5:0
0:0
0
16
:00:0
0
17
:00
:00
0
200
400
600
800
Surf
ace
2cm
depth

Sug
ar
Can
e
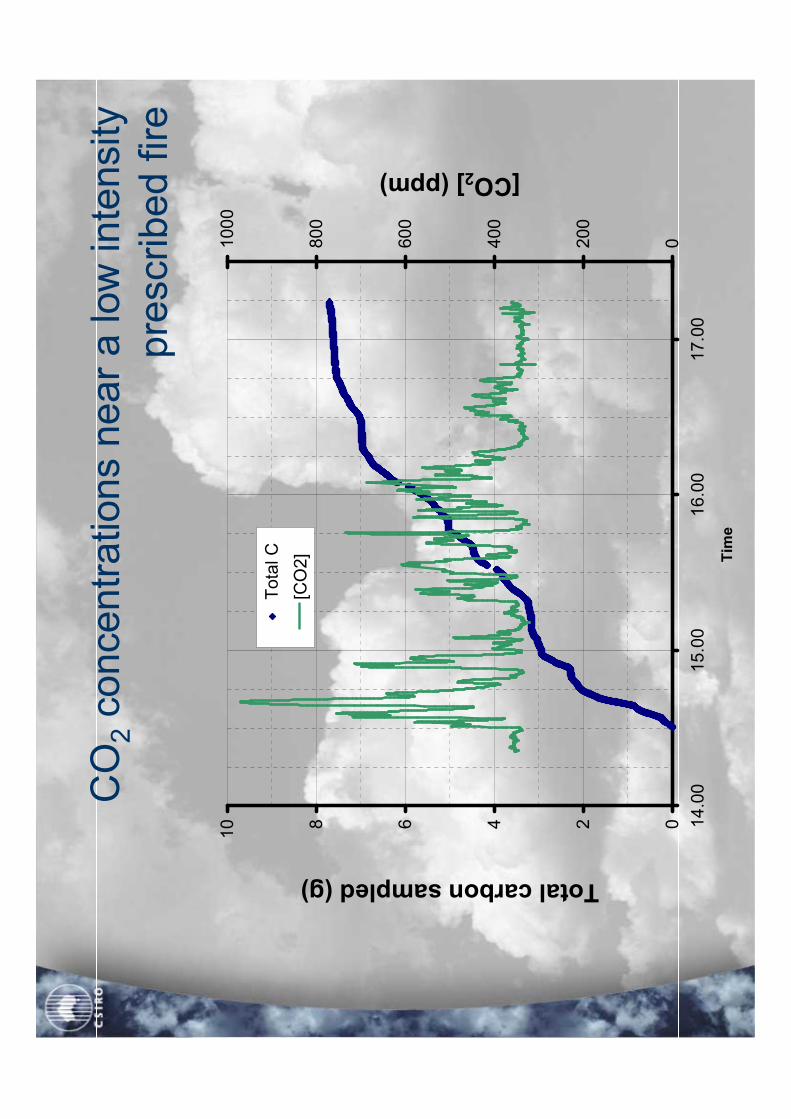
CO
2concentr
ations n
ear
a low
inte
nsity
pre
scribed fire
02468
10 1
4.0
015.0
016.0
017.0
0
Tim
e
Total carbon sampled (g)
0200
400
600
800
100
0
[CO2] (ppm)
Tota
l C
[CO
2]
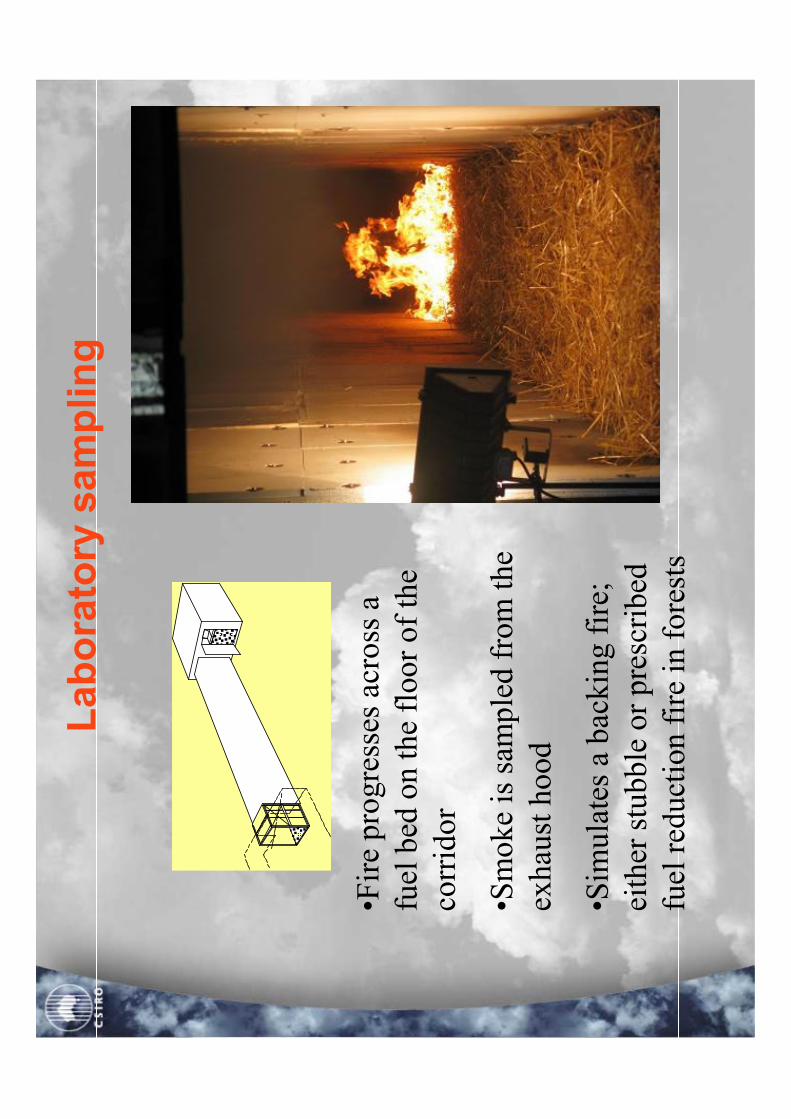
Laboratory sampling
•Fir
e pro
gre
sses
acr
oss
a
fuel
bed
on the
floor
of
the
corr
idor
•Sm
oke
is s
ample
d f
rom
the
exhau
st h
ood
•Sim
ula
tes
a bac
kin
g f
ire;
eith
er s
tubble
or
pre
scri
bed
fuel
red
uct
ion f
ire
in f
ore
sts

Le
af lit
ter
Bu
rn

0
20
0
40
0
60
0
80
0
100
0
05
10
15
20
25
Tim
e (
min
)
Temperature (oC)
0
200
400
600
800
10
00
05
10
15
20
25
Tim
e (
min
)
Temperature (oC)
10
1
3
76
5
2
4
98
Str
aw
Can
e
Tim
ecours
e
of
fire
alo
ng
the
bed

In t
he
fie
ld-
at
clo
se
qu
art
ers
(sa
mp
ler
ve
rsio
n 2
)


Wild
fire
s
Fo
r sa
fety
, yo
u n
eve
r se
e to
fir
e f
ront.
�T
he
en
erg
y r
ele
ase
is 5
0-
10
0 M
W m
-1
co
mp
are
d w
ith
1 -
5 M
W m
-1 fo
r p
rescri
be
d
fire
s.
�T
he
fro
nt
ca
n m
ove
at
10
-20
km
h-1

Measure
ments

Locations o
f field
measure
ments

Results
Em
issio
n r
atio
s (
pg
TE
Q g
C-1)
Fie
ld sam
ple
s
Spec
ies
Cane
Pre
scrib
ed
Wildfire
Savanna
PC
DD
1.8
1.2
3
0.6
5
2.0
3
PC
DF
0.1
4
0.3
6
0.1
3
0.1
6
PC
B
0.0
7
0.1
8
0.1
3
0.0
7
Tota
l 1.9
8
1.7
8
0.9
1
2.3
Labora
tory
sam
ple
s
Spec
ies
Cane
Fore
st
Sorg
hum
Str
aw
PC
DD
3.7
0.4
2
11.5
11.4
PC
DF
5.1
0.3
3
22.4
18.7
PC
B
0.2
0.0
9
0.3
5
0.3
5
Tota
l 8.9
0.8
3
34.2
30.5

Fore
st a
nd S
avanna
fuels
WF
NDP field NT
NDP field WA
NDP field Vic
NDP field Qld
Lab-Litter -NDP
NDP Lab cane
NDP lab sorghum
NDP lab straw
Gullett OR
Gullett NC
0
10
20
30
40
50
60
EF in ng TEQ/kg dwt

Can
e fie
ld
ND
P L
ab c
ane
ND
P la
b so
rghu
m
ND
P la
b st
raw
Gul
lett
w&
r
05
10
15
20
25
30
EF in ng TEQ/kg dwt
Agri
cult
ura
l R
esid
ues

Co
ng
en
er
Pro
file
fo
r h
om
olo
gue
gro
up
s
(by m
ass)
Cane Wildfire Savanna Prescribed
TC
DD
isom
ers
1
19
4
16
PeC
DD
iso
mers
1
9
3
6
HxC
DD
iso
mers
2
21
6
9
HpC
DD
iso
mers
11
15
10
9
OCDD
79
17
51
41
TC
DF
isom
ers
4
11
25
1
7
PeC
DF
isom
ers
0
3
0
1
HxC
DF
isom
ers
0
2
0
0
HpC
DF
iso
mers
1
1
0
0
OCDF
2
1
0
0
Total CDD
93
82
74
82

Co
ng
en
er
pro
file
s-
toxic
co
ng
en
ers
by m
ass
Congener
Cane
Wildfire
Savanna Prescribed
1,2
,3,7
,8-P
eC
DD
0
2
1
0
1,2
,3,4
,7,8
-HxC
DD
0
2
0
1
1,2
,3,6
,7,8
-HxC
DD
0
2
1
1
1,2
,3,7
,8,9
-HxC
DD
0
2
1
1
1,2
,3,4
,6,7
,8-H
pC
DD
6
24
7
8
OCDD
91
62
89
88
OCDF
2
2
0
0
Tota
l C
DD
97
93
99
98

Co
ng
en
er
pro
file
s –
toxic
co
nge
ne
rs b
y toxic
ity
(TE
Q)
Cane Wildfire Savanna Prescribed
2,3
,7,8
-TC
DD
12
5
16
7
1,2
,3,7
,8-P
eC
DD
47
5
4
49
4
0
1,2
,3,4
,7,8
-HxC
DD
5
6
4
5
1,2
,3,6
,7,8
-HxC
DD
7
7
6
8
1,2
,3,7
,8,9
-HxC
DD
2
5
9
7
1,2
,3,4
,6,7
,8-H
pC
DD
17
7
7
8
OCDD
3
0
1
1
2,3
,7,8
-TC
DF
2
1
1
4
1,2
,3,7
,8-P
eC
DF
0
1
0
1
2,3
,4,7
,8-P
eC
DF
2
9
4
12
Total CDD
93
83
93
76

Are
wil
dfi
res
real
ly low
em
itte
rs o
f PC
DD
/PC
DF
?
Booro
lite
1.7
Mha
fire
are
a

05
10
15
20
PCDD/PCDF concentration
(fg TEQ m-3 )
0
20
0
40
0
60
0
80
0 Ma
y-0
2S
ep
-02
De
c-0
2M
ar-
03
Ju
n-0
3O
ct-
03
mass (µµµµg m-3)
0.0
0.4
0.8
1.2
1.6
non sea salt potassium
(µµµµg m-3)
ma
ss
non
-sea
-sa
ltp
ota
ssiu
m
The
smoke
plu
me
from
the
NE
fir
es im
pac
ted B
oro
olite
in J
an/F
eb
TS
P a
nd N
SS-K
conce
ntr
atio
ns
wer
e ver
y h
igh f
rom
im
pac
ta
den
se
smoke
plu
me
BU
T
PC
DD
/PC
DF
conce
ntr
atio
ns
wer
e at
am
bie
nt bac
kgro
und
conce
ntr
atio
ns
Fir
e ev
ent

Com
pare
fie
ld a
nd labora
tory
measure
ments

0%
25%
50
%7
5%
10
0%
L-s
tra
w_
1
L-s
tra
w_
2
L-s
tra
w_
3
L-s
tra
w_
4
L-s
tra
w_
5
L-s
tra
w_
6
L-s
tra
w_
7
L_
so
rgh
um
_1
L_
so
rgh
um
_3
L_
can
e_
4
L_
can
e_
1
L_
can
e_
2
L_
can
e_
3
litte
r_V
ic1
-1
litte
r_V
ic1
-2
litte
r_V
ic1
-3
litte
r_V
ic2
litte
r_Q
ld
% P
CD
D
ΣT
CD
Ds
ΣT
CD
Fs
0%
25%
50
%7
5%
100
%
F_C
ane
_1
F_C
ane
_2
WF
_V
ic_
1
WF
_V
ic_
2
S_
NT
_1
S_
NT
_2
S_
NT
_3
S_
NT
_4
PF
_W
A_1
PF
_W
A_2
PF
_W
A_5
PF
_W
A_4
PF
_W
A_3
PF
_V
ic_
1
PF
_V
ic_
2
PF
_V
ic_
3
PF
_V
ic_
4
PF
_Q
ld_1
PF
_Q
ld_2
PF
_Q
ld_3
PF
_Q
ld_4
% PCDD
ΣT
CD
Ds
ΣT
CD
Fs
Lab
ora
tory
tes
tsFie
ld m
easu
rem
ents
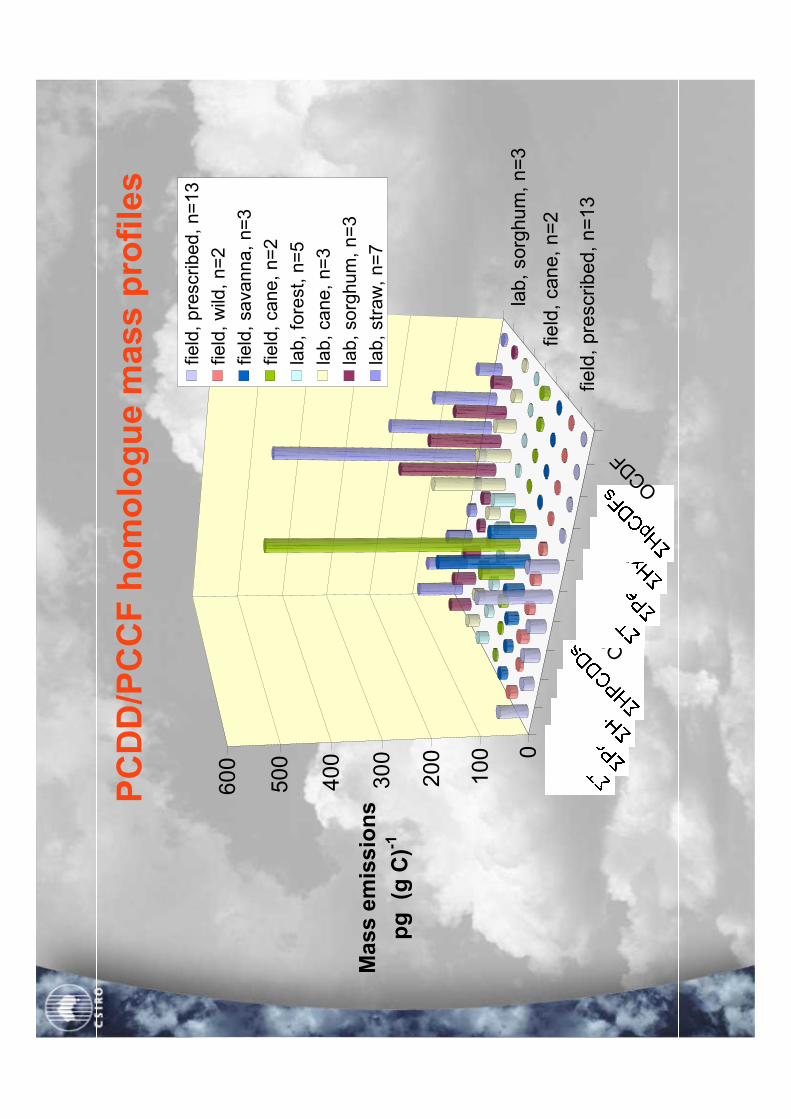
PCDD/PCCF homologue m
ass profiles
OC
DD
OC
DF
fie
ld,
pre
scri
bed
, n
=13
fie
ld,
can
e,
n=
2
lab
, sorg
hu
m,
n=
30
100
200
30
0
400
500
60
0
Mass emissions
pg (g C)-1
field
, p
rescri
bed
, n=
13
field
, w
ild,
n=
2
field
, sa
vann
a,
n=
3
field
, ca
ne,
n=
2
lab,
fore
st,
n=
5
lab,
ca
ne,
n=
3
lab,
so
rghu
m,
n=
3
lab,
str
aw
, n=
7

PCDD/PCCF toxic congener profiles
2,3,
7,8-
TCD
D
1,2,
3,7,
8-PeC
DD
1,2,
3,4,
7,8-
HxC
DD
1,2,
3,6,
7,8-
HxC
DD
1,2,
3,7,
8,9-
HxC
DD
1,2,
3,4,
6,7,
8-H
pCD
D OC
DD
2,3,
7,8-
TCD
F
1,2,
3,7,
8-PeC
DF
2,3,
4,7,
8-PeC
DF
1,2,
3,4,
7,8-
HxC
DF
1,2,
3,6,
7,8-
HxC
DF
2,3,
4,6,
7,8-
HxC
DF
1,2,
3,7,
8,9-
HxC
DF
1,2,
3,4,
6,7,
8-H
pCD
F
1,2,
3,4,
7,8,
9-H
pCD
F OC
DF
fie
ld,
pre
scribe
d,
n=
13
field
, ca
ne
, n
=2
lab
, so
rgh
um
, n
=3
0123456789
10
Toxic emissions
pg Teq (g C)-1
field
, p
rescri
be
d,
n=
13
field
, w
ild,
n=
2
field
, savan
na
, n
=3
field
, can
e,
n=
2
lab
, fo
rest,
n=
5
lab
, ca
ne
, n
=3
lab
, so
rghu
m,
n=
3
lab
, str
aw
, n
=7

Mechanisms
Dio
xin
s fo
rm b
y
•gas
phas
e ch
emis
try a
t 400 –
600
oC
•het
erogen
eous
chem
istr
y a
t 200 -
450
oC
.
In f
urn
aces
, in
slo
w c
om
bust
ion h
eate
rs a
nd in o
pen
fir
e
pla
ces
the
com
bust
ion g
ases
are
ret
ained
at hig
h
tem
per
ature
in the
flue.
And w
e se
e PC
DD
/PC
DF p
roduct
ion

Le
af lit
ter
Bu
rn

0
20
0
40
0
60
0
80
0
10
00
02
04
06
080
10
0
Tim
e (
min
)
Temperature oC
0
20
0
40
0
60
0
80
0
10
00
05
10
15
20
25
Tim
e (
min
)
Temperature (oC)
10
1
3
7
6
5
2
4
9
Str
aw-
fan a
ssis
ted
Lea
f litter
Tim
ecours
e
of
fire
alo
ng
the
bed

0
20
40
60
80
10
0
020
040
060
0
Mean Corridor Temperature (C)
PCDD fraction (%)
Na
tura
l V
en
tila
tio
n
Fo
rced
ve
ntila
tio
n
0
500
1000
1500
2000
02
00
400
600
Mass Emission PCDD+PCDF
(pg gC-1)
Wit
h f
an-a
ssis
ted
ven
tila
tion a
ir f
low
is m
ore
turb
ule
nt
and s
moke
resi
den
ce tim
e is
short
er
In the o
pen
, am
bie
nt
air is e
ntr
ain
ed into
the s
moke
plu
me. It
�ra
pid
ly d
ilute
s a
nd
�ra
pid
ly c
oo
ls
This
is v
ery
difficult t
o r
epro
duce p
recis
ely
there
fore
la
bora
tory
tests
should
be inte
rpre
ted w
ith c
aution
.

Who e
lse h
as s
een these p
attern
s

2,3
,7,8
-TC
DD
1,2
,3,7
,8-P
eCD
D
1,2
,3,4
,7,8
-HxC
DD
1,2
,3,6
,7,8
-HxC
DD
1,2
,3,7
,8,9
-HxC
DD
1,2
,3,4
,6,7
,8-H
pCD
D OC
DD
2,3
,7,8
-TC
DF
1,2
,3,7
,8-P
eCD
F
2,3
,4,7
,8-P
eCD
F
1,2
,3,4
,7,8
-HxC
DF
1,2
,3,6
,7,8
-HxC
DF
2,3
,4,6
,7,8
-HxC
DF
1,2
,3,7
,8,9
-HxC
DF
1,2
,3,4
,6,7
,8-H
pCD
F
1,2
,3,4
,7,8
,9-H
pCD
F OC
DF
All
HWH
W-C
lo
w f
low
HW
-C2
-lo
w-d
ry
0123456789
10
Emission (ng
kg fuel-1)
Congener
All
HW
MF
All
Pin
e
HW
open f
irepla
ce
HW
-C h
igh f
low
HW
-C low
flo
w
HW
-olo
ad
HW
-C-h
i-dry
HW
-C-h
i-w
et
HW
-C1-low
-dry
HW
-C2-low
-dry
HW
-NC
-dry
-lo
HW
-C2-h
i_dry
Fura
ns
dom
inat
e
Slo
w c
om
bust
ion w
oodhea
ters
(Gra
s et
al. , 2
002)
Mean 4
ng
TE
Q (
g f
uel)
-1

Dio
xin
s in s
moke,
Com
bustion h
ood test
Pra
nge
et
al.,
(2002)
Gulle
ttand T
ouati
(200
3)
sa
w s
imila
r p
att
ern
s f
or
wh
eat
and r
ice

Sugar
Cane-
burn
hut
Gulle
ttet
al. (
2006)
1
10
100
1000
Haw
aii
Flo
rida
I
Flo
rida
II
Flo
rida
II
leaves
Emission (ng TEQ g C-1)A
lso O
regan
and N
ort
h
Caro
lina f
ore
st
fuels
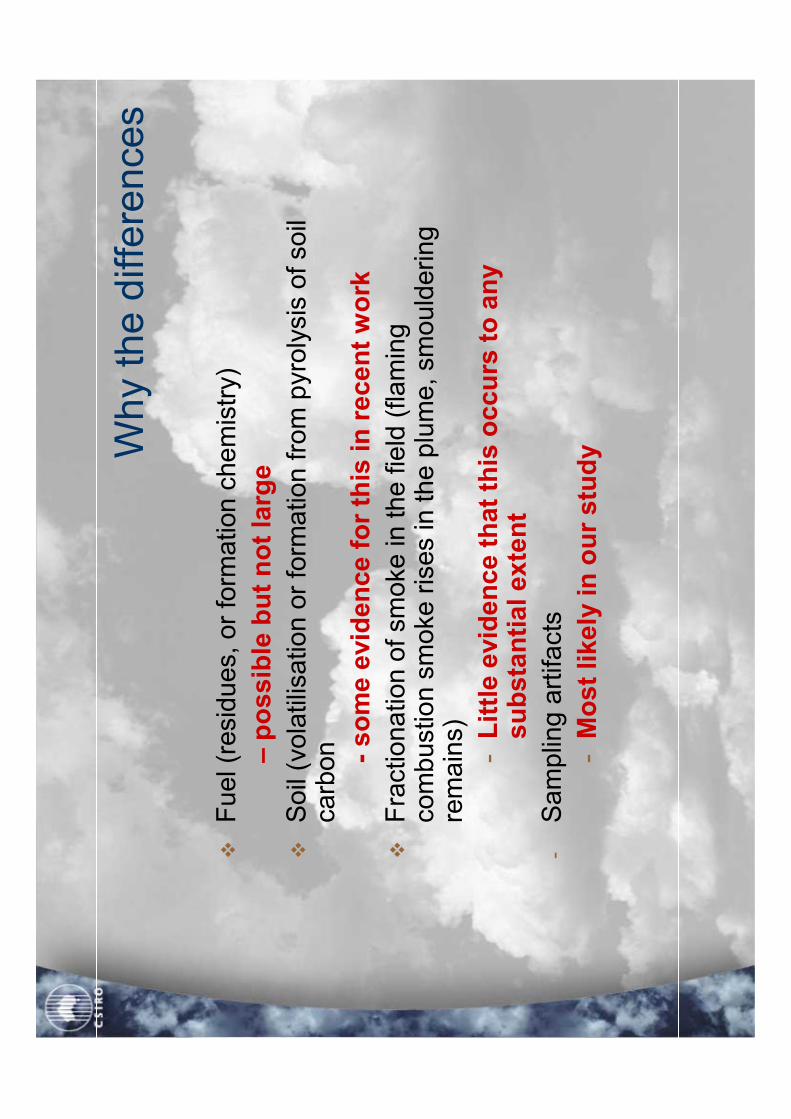
Why t
he d
iffe
rences
�F
ue
l (r
esid
ues, or
form
ation
che
mis
try)
–possible but not large
�S
oil
(vo
latilis
atio
n o
r fo
rma
tio
n fro
m p
yro
lysis
of so
il carb
on
-some evidence for this in recent work
�F
ractio
na
tio
n o
f sm
oke
in
th
e fie
ld (
fla
min
g
co
mb
ustio
n s
mo
ke
ris
es in th
e p
lum
e, sm
ou
lderi
ng
re
ma
ins)
-Little evidence that this occurs to any
substantial extent
-S
am
plin
g a
rtifa
cts
-Most likely in our study

Clu
ste
r a
na
lysis
of fie
ld e
mis
sio
n fa
cto
rs b
y P
DC
C/P
DC
F h
om
olo
gu
e g
rou
ps
F-Cane-1
F-Cane-2
WF-Vic-1
WF-Vic-2
S-NT-2
S-NT-3
S-NT-4
PF-WA-1
PF-WA-2
PF-WA-5
PF-WA-4
PF-WA-3
PF-Vic-1
PF-Vic-2
PF-Vic-3
PF-Vic-4
PF-Qld-1
PF-Qld-2
PF-Qld-3
PF-Qld-4
0200400600
HeightTropical Coastal
There
is s
om
eth
ing in t
he loca
tion o
f
the f
ire.
Is it
fuel?
Is
it soil?

All s
ourc
es
2.5
%9
7.5
%
02468
10
00
.20.4
0.6
0.8
1
PC
DD
/F &
PC
B e
mis
sio
n (
kg T
EQ
)
Frequency (10 -3)
142g T
EQ
(30-4
90)
Dow
n f
rom
70-1
700
Revis
ed E
mis
sio
ns
199
4 –
Re
vis
ed E
A (
2002)

M
ass
Em
issio
n f
acto
r E
mis
sio
n
(t
) ug T
EQ
/t
g
Revis
ed
To a
ir
To land
To a
ir
To land
To a
ir
Sa
van
na a
nd T
em
pera
te G
rassla
nd
216,1
73,0
00
5
4
1081
865
230
Pre
scribed
burn
ing o
f fo
rests
3,5
05,0
00
5
4
18
14
3
Wild
fire
s
10,5
88,0
00
5
4
53
42
4.7
Agricu
ltura
l re
sid
ues-
wh
ea
t 3,4
92,0
00
0.5
10
2
35
2.9
Agricu
ltura
l re
sid
ues-
coars
e g
rain
s
6,0
44,0
00
0.5
10
3
60
5
Agricu
ltura
l re
sid
ues-
sug
ar
653,3
00
0.5
10
0
7
0.4
5
Total
1156
1023
246.05
All sources
1410
1300
500
82%
79%
49%
Emissions to air reduce by a factor of 4, but still
comprise 50% of emissions (with a high range of
uncertainty)
UN
EP
toolk
it
200
1
Estim
ate
s

Ma
ss B
ala
nce
-C
oa
sta
l sa
va
nn
aw
oo
dla
nd
pg
( g
fu
el)
-1
Ho
molo
gu
e g
rou
p
Fu
el
Sm
oke
A
sh
Tota
l T
CD
D iso
me
rs
0.1
8
10.3
0
.2
Tota
l P
eC
DD
isom
ers
0
.1
15.5
0
.2
Tota
l H
xC
DD
isom
ers
0
.61
2
6.9
1
.9
Tota
l H
pC
DD
iso
me
rs
2
40.4
4
.1
OC
DD
2
9
18
2.2
2
7.0
Tota
l T
CD
F iso
me
rs
0.2
6
.4
0.3
Tota
l P
eC
DF
iso
me
rs
0.1
1
.2
0.2
Tota
l H
xC
DF
iso
me
rs
0.1
0
.6
0.2
Tota
l H
pC
DF
isom
ers
0
.05
0
.1
0.1
OC
DF
0
.02
0
.1
0.1
Total
32.4
283.8
34.1
Fuel (32 pg)
Smoke (238 pg)
Ash (34 pg)
Resid
ues

Dis
pers
ion-
where
does it
fall
�S
mo
ke
plu
me
s a
re t
ran
sp
ort
ed
hu
nd
red
s t
o t
ho
usa
nd
s o
f kilo
me
ters
�W
he
re t
he
sm
oke
co
nta
cts
th
e
su
rfa
ce
, th
ere
is s
urf
ace
de
po
sitio
n

PM
2.5
Em
issio
ns (
kg h
a-1
)
-200
-10
00
10
02
00
300
400
50
060
07
00
800
900
Eastin
g (
km
)
7900
8000
8100
8200
8300
8400
8500
8600
8700
Northing (km)
Da
rwin
Ja
bir
u
Grid
Cen
tre
0510
15
20
25
30
PM
2.5
(kg
ha
-1),
Ap
ril -
May 0
4(a
)
-200
-100
0100
200
300
400
500
600
700
800
900
Eastin
g (
km
)
7900
8000
8100
8200
8300
8400
8500
8600
8700
Northing (km)
Da
rwin
Ja
bir
u
Grid
Cen
tre
PM
2.5
(kg h
a-1
), J
une -
July
04
(b)
-20
0-1
00
01
00
20
030
04
00
50
06
00
700
80
0900
Eastin
g (
km
)
79
00
80
00
81
00
82
00
83
00
84
00
85
00
86
00
87
00
Northing (km)
Darw
inJa
bir
u
Grid
Ce
ntr
e
PM
2.5
(kg h
a-1
), A
ug.
- S
ept.
04
(c)
-20
0-1
00
010
02
00
300
40
050
060
07
00
800
90
0
Eastin
g (
km
)
79
00
80
00
81
00
82
00
83
00
84
00
85
00
86
00
87
00
Northing (km)
Da
rwin
Ja
bir
u
Grid
Cen
tre
PM
2.5
(kg
ha-1
), O
ct.
- N
ov. 0
4(d
)

PM
2.5
Surf
ace C
oncentr
ations
-200
02
00
400
60
080
0
Ea
sting
(km
)
80
00
82
00
84
00
86
00
88
00
Northing (km)
Da
rwin
Ja
bir
u
510
15
20
25
30
35
PM
2.5
(µ
g m
-3),
Ap
ril -
Ma
y 0
4(a
)
-200
0200
400
600
800
Ea
stin
g (
km
)
8000
8200
8400
8600
8800
Northing (km)
Da
rwin
Ja
bir
u
510
15
20
25
30
35
PM
2.5
(µ
g m
-3),
Aug. -
Sept. 0
4
(c)
-200
0200
400
600
800
Ea
stin
g (
km
)
8000
8200
8400
8600
8800
Northing (km)
Da
rwin
Ja
bir
u
510
15
20
25
30
35
PM
2.5
(µ
g m
-3),
Oct. -
Nov. 04
(d)
-200
0200
400
600
800
Ea
stin
g (
km
)
8000
8200
8400
8600
8800
Northing (km)
Da
rwin
Ja
biru
510
15
20
25
30
35
PM
2.5
(µ
g m
-3),
June -
July
04
(b)

Where
does it end u
p: P
M2.5
leavin
g the
dom
ain
0
45
90
13
5
180
22
5
270
31
5
020
40
60
80
10
0
PM
2.5 (
Gg)A
pr
- M
ay
Ju
n -
Jul
Aug -
Se
p
Oct -
Nov
2004
Tota
l em
itte
d 6
68 G
gA
larg
e p
roport
ion is
transport
ed into
the T
imor
Sea
In t
he late
fire s
eason,
som
e is t
ransp
ort
ed S
W t
o
NW
WA
.

Qu
an
tify
ing
th
e e
mis
sio
ns is o
nly
the
sta
rt-
to
un
de
rsta
nd
im
pa
cts
of
dio
xin
s w
e f
irst
ne
ed
to u
nd
ers
tan
d t
he
dis
pe
rsio
n a
nd
de
po
sitio
n.

Conclu
sio
ns/ E
merg
ing A
rea
�T
he
em
issio
ns in
Au
str
alia
n e
co
syste
ms a
re low
�M
easure
me
nt a
rtifacts
ma
y b
e a
pro
ble
mcare
ful m
easure
ment
pro
toco
ls a
re r
equir
ed
�E
mis
sio
ns to
la
nd
re
qu
ire
re
vie
w
�L
on
g-r
ang
e tra
nsp
ort
ca
n b
e s
ign
ific
an
tT
he im
pact
may b
e d
ista
nt
from
the s
ourc
e.
But that may not be universal
–
�o
ther
fue
ls a
nd
so
ils m
ay h
ave
diffe
ren
t e
mis
sio
ns
�S
oil
pyro
lysis
. W
hat h
ap
pen
s w
he
n th
ere
is
su
bsta
ntia
l soil
he
atin
g e
.g.
�S
lash b
urn
s f
rom
fore
st
cle
ari
ng
�P
eat
fire
s in f
ore
sts