measurement of charge versus depth in flextensional...
TRANSCRIPT

Defence R&D Canada
Measurement of Charge Versus Depth in
Flextensional Sonar Projectors
Richard A.G. Fleming
Technical Memorandum
DRDC Atlantic TM 2002-204
December 2002
Copy No.________
Defence Research andDevelopment Canada
Recherche et développementpour la défense Canada

Copy No:
Measurement of Charge Versus Depth inFlextensional Sonar Projectors
Richard A.G. Fleming
Defence R&D Canada – AtlanticTECHNICAL MEMORANDUM
DRDC Atlantic TM 2002-204
December 2002


DRDC Atlantic TM 2002-204 i
Abstract
Gas-backed flextensional sonar projectors achieve their low frequency performance byutilizing a mechanical transformation of linear motor motion to radial projector surfacemotion. Due to the mechanical transformation ratio, hydrostatic loads alter the performance ofthese projectors to varying degrees and are directly related to projector geometry. Bymeasuring the accumulated charge on the piezoceramic drive motor as a function ofhydrostatic load; an accurate evaluation of the quasi-static mechanical transformation ratiocan be deduced.
Résumé
Les projecteurs sonar flextensionnels au gaz doivent leur performance aux basses fréquences àla transformation mécanique du mouvement linéaire du moteur en mouvement radial de lasurface de projection. En raison du rapport de transformation mécanique, les chargeshydrostatiques , qui sont directement liées à la forme géométrique des projecteurs, modifieplus ou moins la performance de ces projecteurs. En mesurant la charge accumulée dans lemoteur d’entraînement en céramique piézoélectrique en fonction de la charge hydrostatique,on peut procéder à une évaluation précise du rapport de transformation mécanique quasi-statique.

ii DRDC Atlantic 2002-204
This page intentionally left blank.

DRDC Atlantic TM 2002-204 iii
Executive summary
Introduction
Flextensional sonar projectors are usually designed such that a small longitudinal motion ofits piezoelectric drive motor causes a large motion of its radiating surface. The ratio of theprojector’s radiating wall motion to the piezoelectric motor motion is called the mechanicaltransformer ratio. Determining this transformer ratio has traditionally been carried out byfinite element techniques or by calculation from established formulae. By evaluating thecharge build-up on the piezoceramic drive motor as a function of depth; the mechanicaltransformation ratio can be quickly determined in the non-driven, quasi-static case.
Results
The mechanical transformation ratio of numerous test projectors were found by lowering theprojectors into a water column and measuring their motors’ charge with an electrometer overa series of depths. This measurement technique was shown to provide good agreement withcalculated mechanical transformation ratios.
Significance
It is important to characterize this ratio because as this value increases, the projector’sperformance becomes more sensitive to depth. In addition, since the effect of hydrostatic loadis amplified in high transformation ratio projectors, these projectors become prone to failure atshallower depths.
This charge versus depth characterization can also prove useful to determine consistency ofconstruction of gas-backed flextensional projectors. The technique can also be used to aid indiagnosing projector failures by uncovering drive motor or mechanical anomalies.
Finally, this method is a very low cost and direct method for measuring mechanicaltransformation ratio. The other methods, finite element analysis, equivalent circuit fitting andlaser vibrometry, are all much more complicated to utilize in making this characterization.
Future Plans
The next step in the development of this technique is to automate the measurement byemploying a pressure vessel instead of a water column as the pressure variable environment.This would permit faster turnaround time for the measurements, as the projector would notrequire temperature equilibration.
Fleming, R.A.G. 2002. Measurement of Charge Versus Depth in Flextensional SonarProjectors. TM 2002-204.DRDC Atlantic

iv DRDC Atlantic 2002-204
Sommaire
Introduction
Les projecteurs sonar flextensionnels sont habituellement conçus de façon à ce qu’un légerdéplacement longitudinal de leur moteur d’entraînement piézoélectrique produise undéplacement important de la surface rayonnante. Le rapport du déplacement de la paroirayonnante du projecteur au déplacement du moteur piézoélectrique est appelé le rapport detransformation mécanique. Auparavant, le rapport de transformation était établi à l’aide detechniques à éléments finis ou en utilisant des formules de calcul établies. Grâce à uneévaluation de la charge accumulée dans le moteur d’entraînement en céramiquepiézoélectrique en fonction de la profondeur, il est possible de déterminer rapidement lerapport de transformation mécanique dans les cas quasi-statiques où il n’y a pasd’entraînement.
Résultats
Le rapport de transformation mécanique de nombreux projecteurs d’essai a pu être déterminéen abaissant ces projecteurs dans une colonne d’eau et en mesurant, à différentes profondeurs,la charge de leur moteur avec un électromètre. Cette technique de mesure donne des résultatsqui correspondent bien avec les rapports de transformation mécaniques établis au moyen decalculs.
Signification des résultats
Il est important de caractériser ce rapport parce que, au fur et à mesure que sa valeuraugmente, la performance du projecteur devient plus sensible à la profondeur. De plus, étantdonné que l’effet de la charge hydrostatique est amplifié dans les projecteurs ayant un rapportde transformation élevé, ces derniers deviennent plus enclins aux défaillances dans les eauxmoins profondes. Cette caractérisation de la charge en fonction de la profondeur peutégalement être utile pour déterminer l’uniformité dans la fabrication des projecteursflextensionnels au gaz. Cette technique peut aussi faciliter le diagnostic des pannes deprojecteurs en aidant à la localisation des anomalies dans le moteur d’entraînement ou desanomalies mécaniques. Enfin, cette méthode de mesure du rapport de transformationmécanique est une méthode directe et très économique. L’emploi des autres méthodes, soitl’analyse des éléments finis, l’ajustement de circuit équivalent et la vibrométrie au laser, estbeaucoup plus compliqué pour réaliser cette caractérisation.
Plans futurs
La prochaine étape de mise au point de cette technique consiste à automatiser la mesure enutilisant un appareil sous pression au lieu d’une colonne d’eau comme environnement àpression variable. Cette modification permettrait d’effectuer les mesures plus rapidement,étant donné qu’il ne serait plus nécessaire d’attendre que le projecteur atteigne un équilibrethermique.
Fleming, R.A.G. 2002. Measurement of Charge Versus Depth in Flextensional SonarProjectors. TM 2002-204.DRDC Atlantic

DRDC Atlantic TM 2002-204 v
This page intentionally left blank.

vi DRDC Atlantic 2002-204
Table of contents
Abstract ....................................................................................................................................... i
Executive summary................................................................................................................... iii
Sommaire ...................................................................................................................................iv
Table of contents ........................................................................................................................vi
List of figures ........................................................................................................................... vii
List of tables............................................................................................................................ viii
1. Introduction....................................................................................................................1
2. Theoretical Derivation....................................................................................................2
3. Experimental Set-up.......................................................................................................3
4. Data ................................................................................................................................4
5. Conclusion......................................................................................................................7
6. References......................................................................................................................8
List of symbols/abbreviations/acronyms/initialisms ...................................................................9
Distribution list..........................................................................................................................10

DRDC Atlantic TM 2002-204 vii
List of figures
Figure 1. Barrel stave projector 30X23-7 ...................................................................................1
Figure 2. Folded shell projector .................................................................................................3
Figure 3. BSP SP39-06-98-89 Trial 1 ........................................................................................5
Figure 4. BSP SP39-06-98-89 Trial 2 ........................................................................................5
Figure 5. SX-100 charge versus depth .......................................................................................6

viii DRDC Atlantic 2002-204
List of tables
Table 1. Charge constant table ...................................................................................................2
Table 2. Charge versus depth data for BSP SP-39-06-98-89 .....................................................4

DRDC Atlantic TM 2002-204 1
1. Introduction
Flextensional sonar projectors are a class of projector characterized by a curved cylindricalsurface driven longitudinally by a drive motor (see figures 1 and 2). The curved nature of thecylinder transforms longitudinal motion into an amplified volume displacement. Thetransformation ratio between longitudinal motion and radial motion is greater than 1 and iscurrently determined by using finite element analysis, laser vibrometry and equivalent circuitcalculation [1]. The ability to confirm the mechanical transformer ratio is beneficial forquality control after manufacture of projectors and for troubleshooting mechanical problemswith individual projectors.
Gas-backed flextensional projectors not only transform motor motion into increasedcylindrical surface motion, they are also subject to the reverse effect of exaggeratedhydrostatic sensitivity. The curved cylindrical area of the projectors exerts an amplifiedadditive longitudinal force to the ends of the drive motor mechanism [2].
Since piezoceramic charge/force constants are well characterized at the time of manufactureand the measurement of charge accumulation on a piezoceramic drive motor can be achievedwith the use of an electrometer, measurement of force on a drive motor can be readilydetermined.
Comparison of the measured hydrostatically loaded surface area to the apparenthydrostatically loaded surface area yields the quasi-static mechanical transformer ratiowithout the requirement for finite element analysis.
This measurement can also be used for quality assurance in construction and for diagnosingchanges in individual projector performance over a projector’s lifetime.
Figure 1. Barrel stave projector (BSP) 30X23-7

2 DRDC Atlantic 2002-204
2. Theoretical Derivation
The derivation of the mechanical transformer ratio is based on the effect of the ratio onaccumulated charge over depth. Therefore the expected untransformed force per unit depthversus the transformed force per unit depth (due to the projector’s shape) is the mechanicaltransformer ratio in the quasi-static case.
A piezoceramic drive motor’s d33 is a measurement of intrinsic piezoelectric charge per unitforce where charge is collinear to the applied force. Here the 3 direction is taken to be thelongitudinal or z-direction of the drive motor [3]. These values can vary widely for differentpiezoelectric materials, as seen in table 1.
Piezoceramic Charge constant d33 (x 10-12 C/N)
Lead Zirconate Titanate 4(PZT-4) 289
Lead Zirconate Titanate 5(PZT-5) 374
Lead Zirconate Titanate 8(PZT-8) 218
SensorTech BM527 480
SensorTech BM532 580
Table 1. Charge constant table
The slope of the charge versus depth measurements is charge per unit depth. The force on thedrive motor per unit depth is determined by dividing the data slope by the drive motor’s d33.
Data slope/ d33 = (charge/depth)/(charge/force)= force/depth (N/m) (2.1)
The change in hydrostatic load of water over depth can also be described as change in forceper unit area by depth.
Pressure/depth = force/area/depth =ρgh/depth (N/m2/m) (2.2)
This conversion factor for the acoustic calibration tank with a water temperature of 17 Celsiusand corresponding water density of 998.5± 0.5 Kg/m3 [4] is given by
[(998.5± 0.5 Kg/m3)(9.80665 m/s2)(1m)]/m = 9792± 5 N/m2/m. (2.3)
Thus the force per depth due to change in hydrostatic load is the effective area of theprojector.
(force/depth)/(force/area/depth) = effective area (m2) (2.4)
Dividing this value by the actual hydrostatically loaded area results in the mechanicaltransformer ratio.

DRDC Atlantic TM 2002-204 3
3. Measurement set-up
Measurements of charge versus depth were carried out in the DRDC-Atlantic calibration tank.Measurements were taken by electrically connecting a test projector to a Keithley Model 602solid-state electrometer using an 8-meter extension cable, a 0.5-meter adapter cable with aconnector used to short the projector inputs. The projector was secured with a mooring lineand a fibreglass measuring tape attached to it. The electrometer was zeroed and then set-up forcharge measurement [5]. The projector was lowered to near the bottom of the acousticcalibration tank.
The charge versus depth measurement was carried out by first allowing the test projector ‘stemperature to equilibrate in the water column. This equilibration took as long as four hours.The electrical short was removed from the projector’s inputs and a measurement of chargewas taken to ensure temperature equilibration had occurred (the water column used wasessentially isothermal) by ensuring the charge measurement did not wander over time. Thenthe projector was lowered by rope to numerous depths and measurements of accumulatedcharge versus depth taken. The results were graphed using Microsoft Excel and linear fitswere inserted. As well, Excel plotting provided slope information and error bars were inputfrom analysis of all available uncertainties. The slope information was entered into thecalculations seen in Section 2 to determine the apparent hydrostatically loaded area.
The projector’s actual hydrostatically loaded surface was then determined so that apparentversus real area loading could be resolved. The actual area could be revealed from finiteelement modelling (especially in complex shapes like the folded shell projector in figure 2),by making physical measurements or by creating analytic expressions for the shapes [6].
Figure 2. Simplified view of folded shell projector with one fold cut away and endcapremoved.
4 DRDC Atlantic 2002-204
4. Data
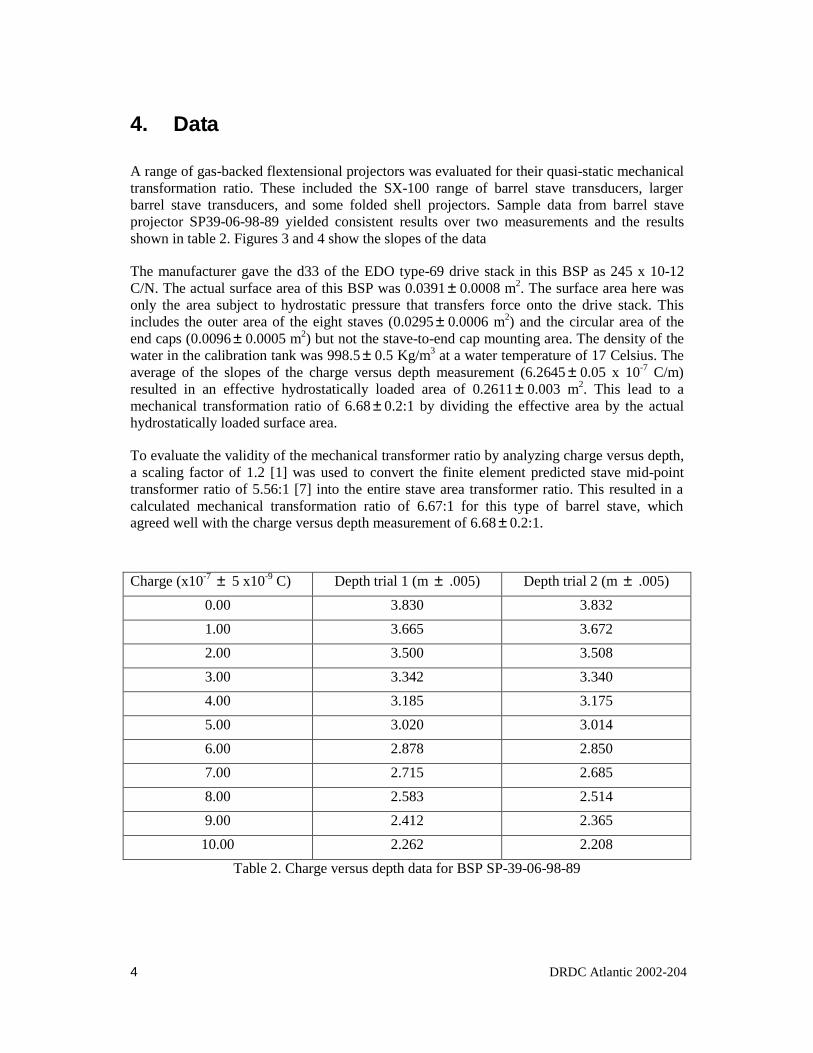
A range of gas-backed flextensional projectors was evaluated for their quasi-static mechanicaltransformation ratio. These included the SX-100 range of barrel stave transducers, largerbarrel stave transducers, and some folded shell projectors. Sample data from barrel staveprojector SP39-06-98-89 yielded consistent results over two measurements and the resultsshown in table 2. Figures 3 and 4 show the slopes of the data
The manufacturer gave the d33 of the EDO type-69 drive stack in this BSP as 245 x 10-12C/N. The actual surface area of this BSP was 0.0391± 0.0008 m2. The surface area here wasonly the area subject to hydrostatic pressure that transfers force onto the drive stack. Thisincludes the outer area of the eight staves (0.0295± 0.0006 m2) and the circular area of theend caps (0.0096± 0.0005 m2) but not the stave-to-end cap mounting area. The density of thewater in the calibration tank was 998.5± 0.5 Kg/m3 at a water temperature of 17 Celsius. Theaverage of the slopes of the charge versus depth measurement (6.2645± 0.05 x 10⁻⁷ C/m)resulted in an effective hydrostatically loaded area of 0.2611± 0.003 m2. This lead to amechanical transformation ratio of 6.68± 0.2:1 by dividing the effective area by the actualhydrostatically loaded surface area.
To evaluate the validity of the mechanical transformer ratio by analyzing charge versus depth,a scaling factor of 1.2 [1] was used to convert the finite element predicted stave mid-pointtransformer ratio of 5.56:1 [7] into the entire stave area transformer ratio. This resulted in acalculated mechanical transformation ratio of 6.67:1 for this type of barrel stave, whichagreed well with the charge versus depth measurement of 6.68± 0.2:1.
Charge (x10-7 ± 5 x10⁻⁹ C) Depth trial 1 (m± .005) Depth trial 2 (m± .005)
0.00 3.830 3.832
1.00 3.665 3.672
2.00 3.500 3.508
3.00 3.342 3.340
4.00 3.185 3.175
5.00 3.020 3.014
6.00 2.878 2.850
7.00 2.715 2.685
8.00 2.583 2.514
9.00 2.412 2.365
10.00 2.262 2.208
Table 2. Charge versus depth data for BSP SP-39-06-98-89

DRDC Atlantic TM 2002-204 5
y = 6.4066E-07x - 2.4448E-06
-1.200E-06
-1.000E-06
-8.000E-07
-6.000E-07
-4.000E-07
-2.000E-07
0.000E+00
2.000E-07
2 2.2 2.4 2.6 2.8 3 3.2 3.4 3.6 3.8 4
Depth (m)
Cha
rge
(C)
Figure 3. BSP SP39-06-98-89 Trial 1
y = 6.1224E-07x - 2.3458E-06
-1.200E-06
-1.000E-06
-8.000E-07
-6.000E-07
-4.000E-07
-2.000E-07
0.000E+00
2.000E-07
2 2.2 2.4 2.6 2.8 3 3.2 3.4 3.6 3.8 4
Depth (m)
Cha
rge
(C)
Figure 4. BSP SP39-06-98-89 Trial 2

6 DRDC Atlantic 2002-204
As a further confirmation of the charge versus depth measurement technique, two SX-100barrel stave projectors with different drive motor piezoceramic formulation were tested andcompared for mechanical transformation ratio. SX-100 #25 contained a SensorTech BM532based drive motor (d33 of 580 x 10-12 C/N) while SX-100 #14 contained a BM400 drive motor(d33 of 285 x 10-12 C/N).
SX-100 #14 and #25
y = -5.740E-07x + 1.010E-06
R2 = 9.998E-01
y = -1.117E-06x + 6.630E-07
R2 = 9.997E-01
-2.0E-07
0.0E+00
2.0E-07
4.0E-07
6.0E-07
8.0E-07
1.0E-06
1.2E-06
0 0.2 0.4 0.6 0.8 1 1.2 1.4 1.6 1.8 2
Depth (m)
Cha
rge
(C)
Figure 5. SX-100 charge versus depth
As seen if figure 5, SX-100 #25 has a slope of 1.117x10⁻⁶ C/N while #14 has a slope of5.740x10-7 C/N. Taking into account the different charge constant of these two projectors, themechanical transformation ratio of #25 was 9.8:1 while #14 was 10.3:1. As can been seen inthis example, the charge constant for the motor drops out in the calculation commensuratewith the charge versus depth slope. After testing another BM400 motored SX-100 (#15), theaverage mechanical transformation area was found to be 10.2:1±0.4.
A low-frequency version of the folded shell projector (see figure 2) was tested and found tohave an average charge versus depth of 6.3 x 10⁻⁷ C/m. Since the drive motor was BM400material, this results in an effective hydrostatically loaded area of 0.225 m2. Since the actualhydrostatically loaded area of this FSP was on the order of 0.0333 m2 [7], the mechanicaltransformer ratio of this transducer was on the order of 6.8:1. This was in good agreementwith a finite element prediction of 7:1 for this projector [7].
DRDC Atlantic TM 2002-204 7
5. Conclusion
The charge versus depth technique for establishing the quasi-static mechanical transformationratio has been demonstrated to give results consistent with calculated values. This techniquealso permits a relatively rapid evaluation of this ratio without resorting to more complexcalculations or measurements.
Exaggerated mechanical transformation ratios can limit the operating depth of a projector dueto extreme shear loads at the curved wall-endcap intersection. This inherent feature offlextensionals was seen in the recent failure of two 1200 Hz FSP’s during deep-water trials.The shell-endcap joint failed in these transducers at depths of slightly more than 120m. Sincethe mechanical transformation ratio of these transducers was on the order of 7:1, they failedwhere FSP’s of lower transformation ratio have operated without effect. In fact, the FSP thatformed the heart of the flextensional resonant pipe projector (FRPP) has a mechanicaltransformation ratio of 3.1:1 and has operated to 250m without failure.

8 DRDC Atlantic 2002-204
6. References
1. M.B. Moffet, et al., An Equivalent Circuit Model for Barrel-Stave FlextensionalTransducers,Proceedings Transducers for Sonics and Ultrasonics, (1993).
2. Y.R. Bonin and J.S. Hutton. Increasing the Depth Capability of Barrel StaveProjectors,Canadian Acoustics,24(3):50, Sept 1996.
3. O.B. Wilson. Introduction to Theory and Design of Sonar Transducers.PeninsulaPublishing.(1985).
4. R.D. Blevins. Formulas for Natural Frequency and Mode Shape.Robert E.Krieger Publishing Company,(1979).
5. Keithley Instruments Model 602 Solid State Electrometer Instruction Manual
6. D.F. Jones, Analytic Expressions for the Mass and Surface Area of ConcaveFlextensional Projector Shells, DREA Technical Memorandum 92/213, May 1992.
7. C.J. Purcell, Private Communication (2001).

DRDC Atlantic TM 2002-204 9
List ofsymbols/abbreviations/acronyms/initialisms
DND Department of National Defence
DRDC Defence Research and Development Canada
BSP Barrel stave projector
FSP Folded shell projector
FRPP Flextensional resonant pipe projector

10 DRDC Atlantic 2002-204
Distribution list
Richard Fleming (2)
Christopher Purcell (1)
Carey Risley G/L SA (1)
Neil Sponagle Head US (1)
DRDC Atlantic Library (3)
DSIS (1)


