measurement models: identification and estimation
DESCRIPTION
Measurement Models: Identification and Estimation. James G. Anderson, Ph.D. Purdue University. Identification and Estimation. Identification is concerned with whether the parameters of the model are uniquely determined. - PowerPoint PPT PresentationTRANSCRIPT
Measurement Models:Identification and Estimation
James G. Anderson, Ph.D.
Purdue University

Identification and Estimation
• Identification is concerned with whether the parameters of the model are uniquely determined.
• Estimation involves using sample data to make estimates of population parameters.

spatial
visperc
cubes
err_v
err_c
1
1
1
Example 8Factor analysis: Girls' sample
Holzinger and Swineford (1939)No. of independent pieces of information =3
No. of paramters estimated =4DF =-1

spatial
visperc
cubes
lozenges
err_v
err_c
err_l
1
1
1
1
Example 8Factor analysis: Girls' sample
Holzinger and Swineford (1939)No. of independent pieces of information =6
No. of paramters estimated =6DF = 0

spatial
visperc
cubes
lozenges
err_v
err_c
err_l
1
1
1
1
Example 8Factor analysis: Girls' sample
Holzinger and Swineford (1939)No. of independent pieces of information =6
No. of paramters estimated =7DF =-1

spatial
visperc
cubes
lozenges
wordmean
paragrap
sentence
err_v
err_c
err_l
err_p
err_s
err_w
verbal
1
1
1
1
1
1
1
1
Example 8Factor analysis: Girls' sample
Holzinger and Swineford (1939)No. of independent pieces of information = 21
No. of paramters estimated = 13DF = 8
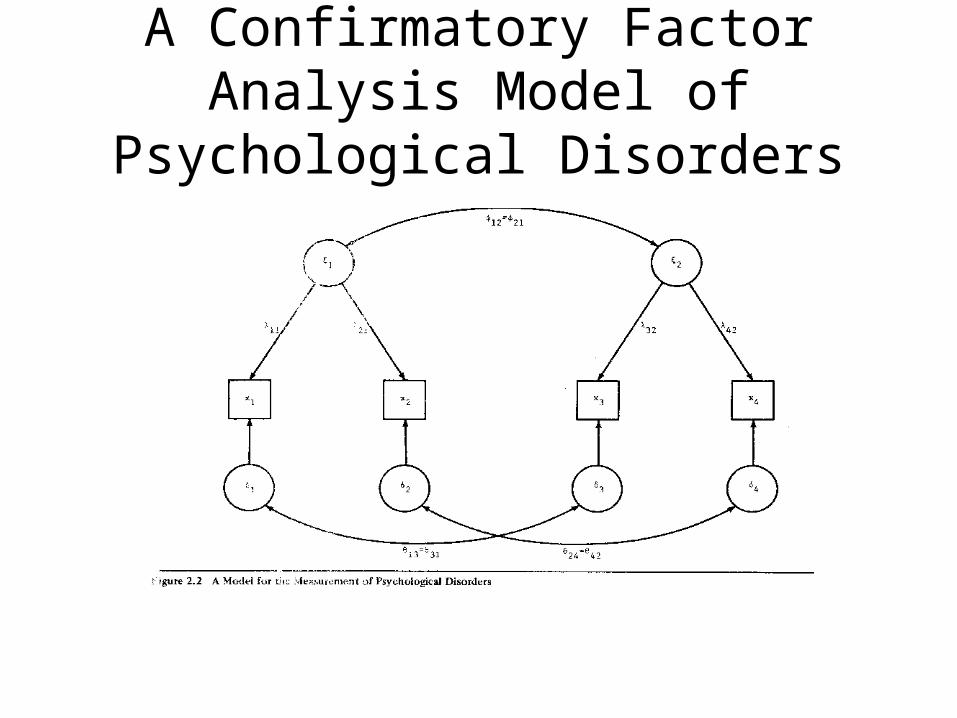
A Confirmatory Factor Analysis Model of Psychological Disorders
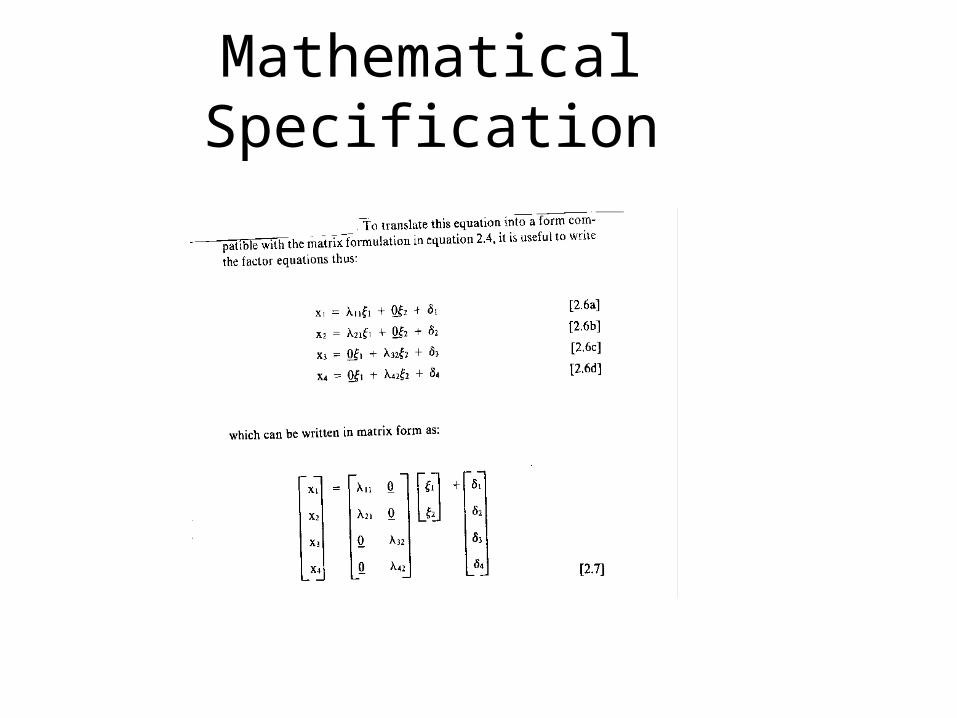
Mathematical Specification

Mathematical Specification

Assumptions
• Each observed variable (X) loads on only one latent variable
• Each observed variable (X) is also affected by a single residual or unique factor
• Curved arrows correspond to correlations among latent variables
• Variances and covariances of the residual factors are contained in the Theta matrix

Conditions for Identification
• Necessary
• Sufficient
• Necessary and Sufficient

Degrees of Freedom

Degrees of Freedom

Models

Model A
spatial
visperc
cubes
cubes2
visperc2
err_v
err_c
err_s
err_w
spatial 2
1
1
1
1
Example 8Factor analysis: Girls' sample
Holzinger and Swineford (1939)No. of independent pieces of information = 10
No. of parameters to be estimated =11DF=-1
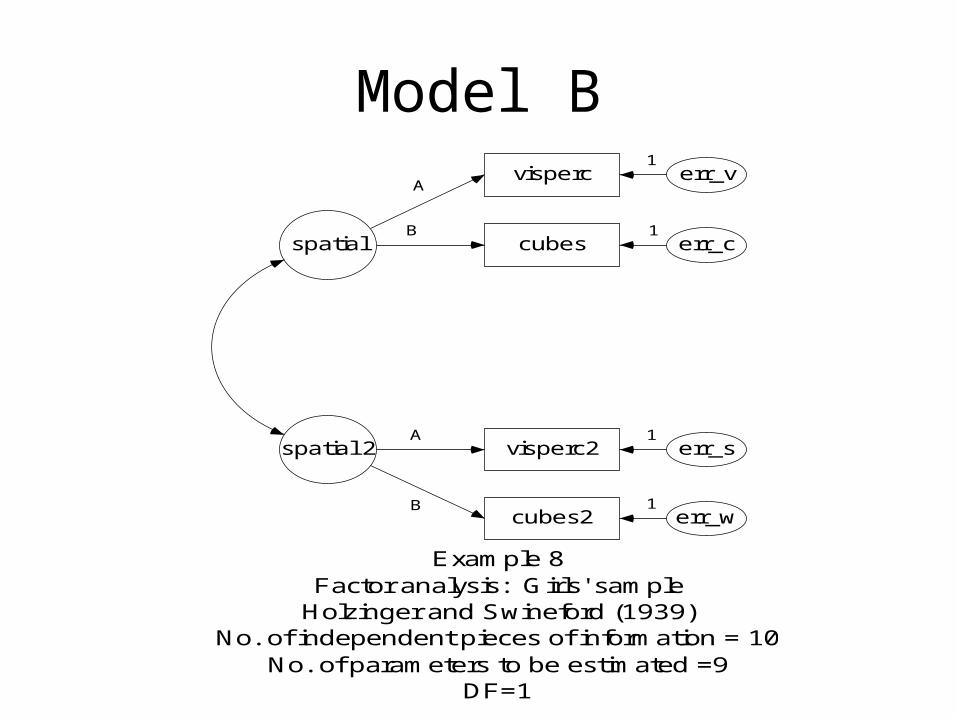
Model B
spatial
visperc
cubes
cubes2
visperc2
err_v
err_c
err_s
err_w
spatial 2
A
B
A
B
1
1
1
1
Example 8Factor analysis: Girls' sample
Holzinger and Swineford (1939)No. of independent pieces of information = 10
No. of parameters to be estimated =9DF=1

Model C
1
spatial
visperc
cubes
cubes2
visperc2
err_v
err_c
err_s
err_w
1
spatial 2
1
1
1
1
Example 8Factor analysis: Girls' sample
Holzinger and Swineford (1939)No. of independent pieces of information = 10
No. of parameters to be estimated = 9DF=1
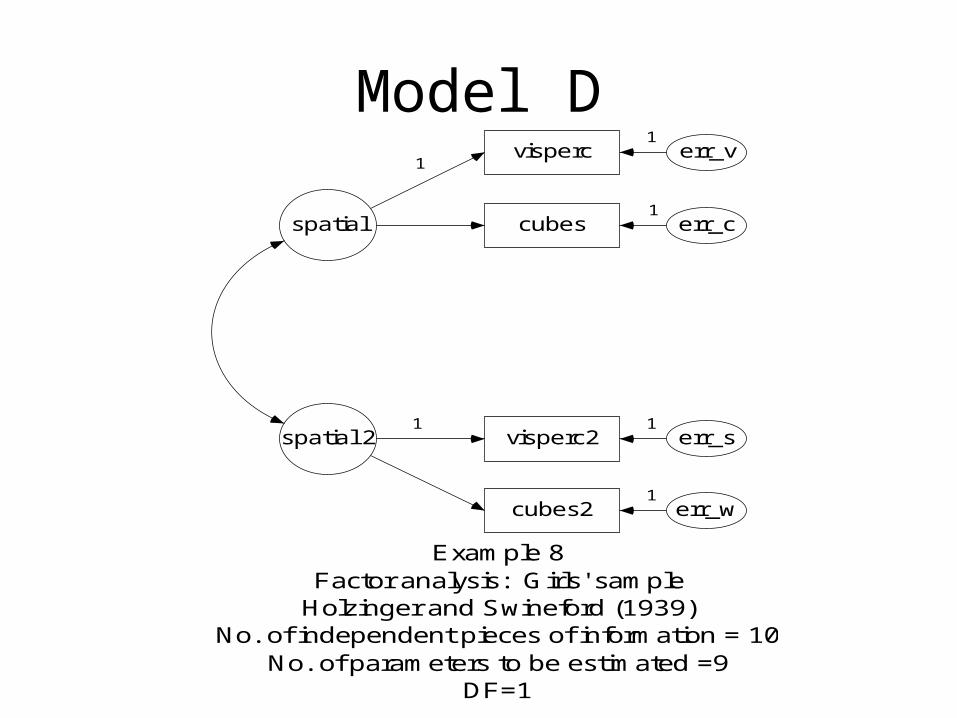
Model D
spatial
visperc
cubes
cubes2
visperc2
err_v
err_c
err_s
err_w
spatial 2
1
1
1
1
1
1
Example 8Factor analysis: Girls' sample
Holzinger and Swineford (1939)No. of independent pieces of information = 10
No. of parameters to be estimated =9DF=1
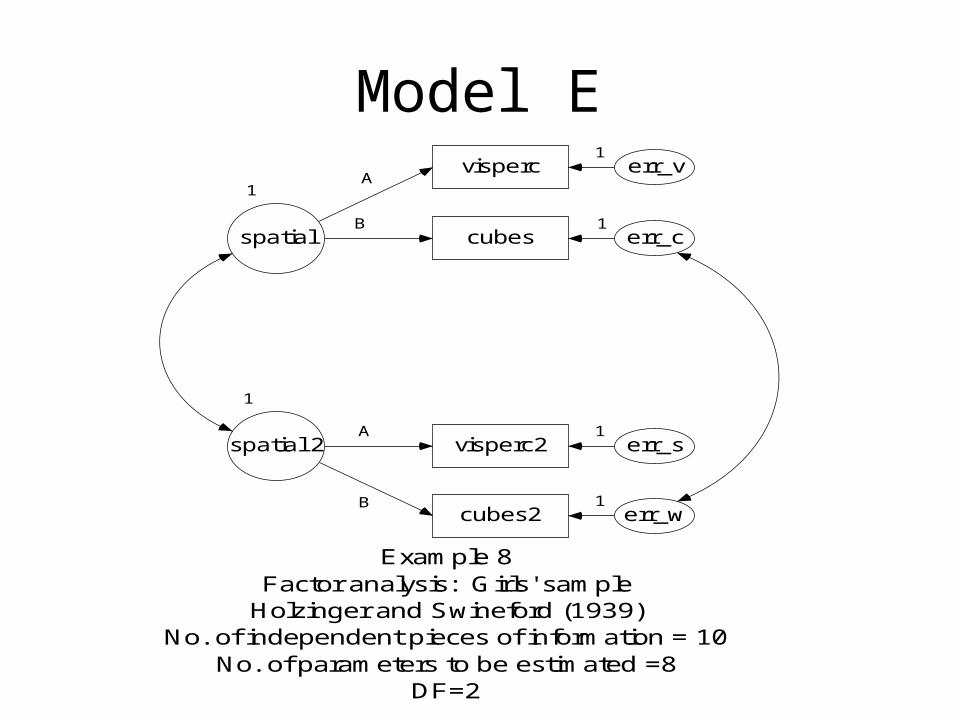
Model E
1
spatial
visperc
cubes
cubes2
visperc2
err_v
err_c
err_s
err_w
1
spatial 2
A
B
A
B
1
1
1
1
Example 8Factor analysis: Girls' sample
Holzinger and Swineford (1939)No. of independent pieces of information = 10
No. of parameters to be estimated =8DF=2
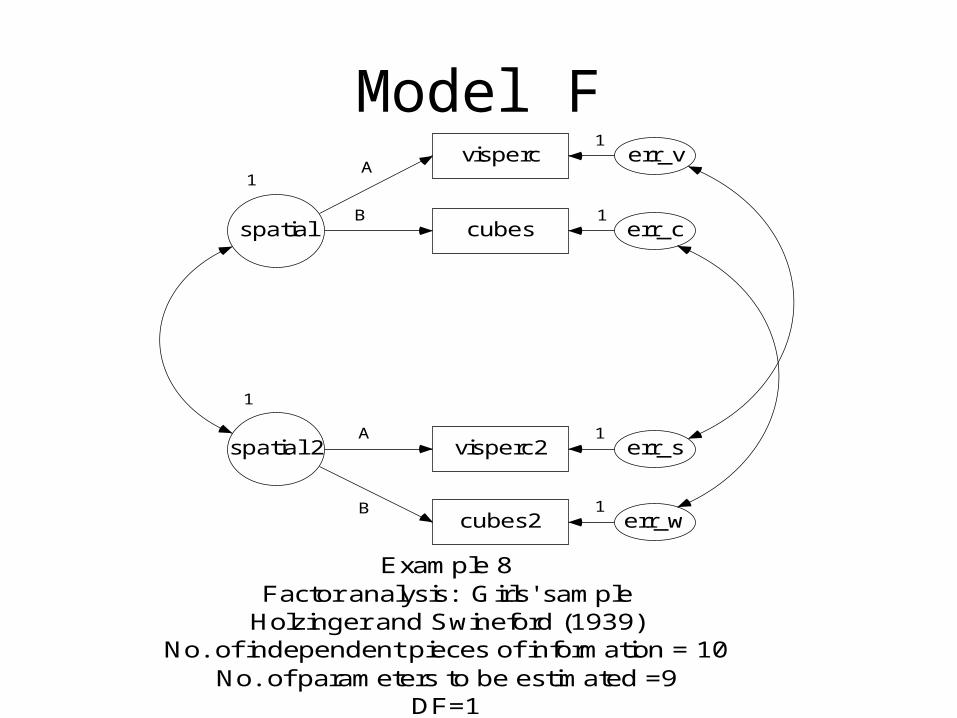
Model F1
spatial
visperc
cubes
cubes2
visperc2
err_v
err_c
err_s
err_w
1
spatial 2
A
B
A
B
1
1
1
1
Example 8Factor analysis: Girls' sample
Holzinger and Swineford (1939)No. of independent pieces of information = 10
No. of parameters to be estimated =9DF=1

Model G
C
spatial
visperc
cubes
cubes2
visperc2
err_v
err_c
err_s
err_w
C
spatial 2
1
B
1
B
1
1
1
1
Example 8Factor analysis: Girls' sample
Holzinger and Swineford (1939)No. of independent pieces of information = 10
No. of parameters to be estimated =7DF=3

Model HC
spatial
visperc
cubes
cubes2
visperc2
err_v
err_c
err_s
err_w
C
spatial 2
1
B
1
B
1
1
1
1
Example 8Factor analysis: Girls' sample
Holzinger and Swineford (1939)No. of independent pieces of information = 10
No. of parameters to be estimated =8DF=2
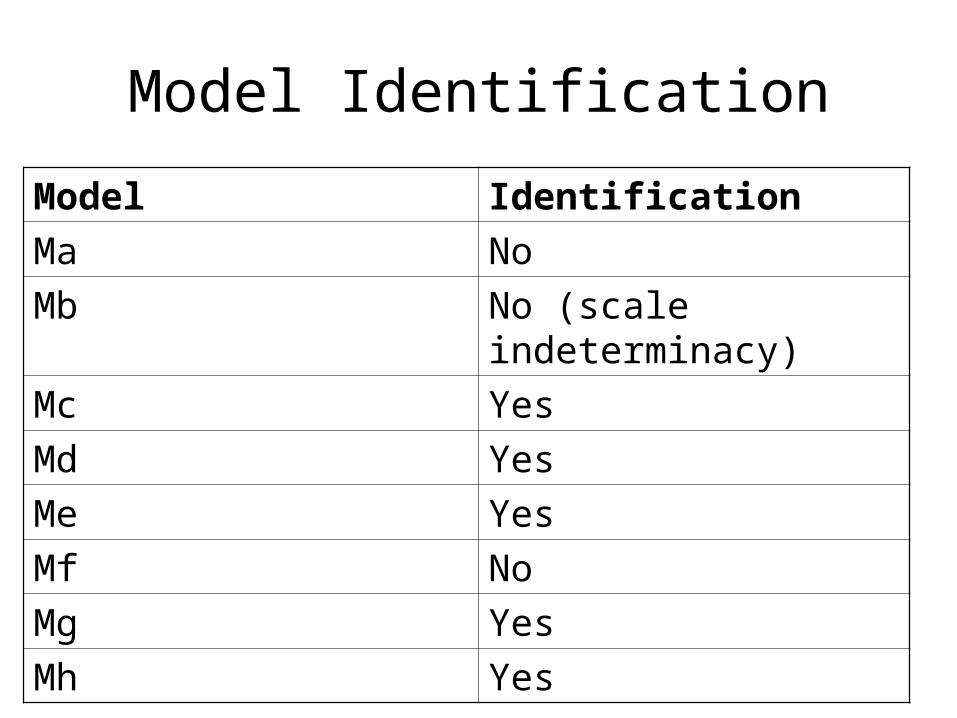
Model Identification
Model Identification
Ma No
Mb No (scale indeterminacy)
Mc Yes
Md Yes
Me Yes
Mf No
Mg Yes
Mh Yes

Estimation
• Unweighted Least Squares (ULS): Minimizes the trace or the sum of the diagonal elements of tr[(S-Sigma)2] ULS makes no distributional assumption so there are no tests of significance. Also ULS is scale dependent.
Estimation
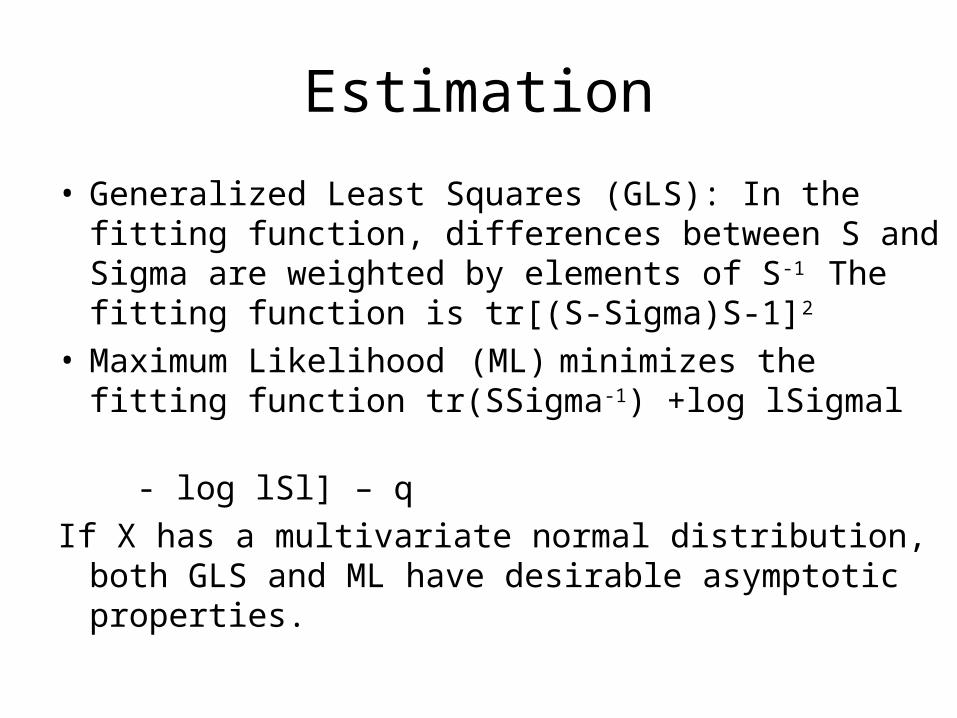
• Generalized Least Squares (GLS): In the fitting function, differences between S and Sigma are weighted by elements of S-1 The fitting function is tr[(S-Sigma)S-1]2
• Maximum Likelihood (ML) minimizes the fitting function tr(SSigma-1) +log lSigmal
- log lSl] – q
If X has a multivariate normal distribution, both GLS and ML have desirable asymptotic properties.

Estimates with Different Constraints

Estimation of Model Md with ULS, GLS and ML

Model Building
• Models are nested when one model can be obtained from the other by imposing one or more free parameters. Therefore, model Mg is nested in Md and Mg is nested in Mh.
• When models are nested, the difference in Chi Square value is also distributed as Chi Square so the models can be compared statistically.

Comparing the Fit of Nested Models

Standardization
• The observed variables (X) can be standardized so S is a correlation matrix.
• The latent variables can be standardized by constraining the diagonal elements of the phi matrix to be 1.0.

Estimates of Md and Mg with Standardized Observed
Variables and/or Standardized Latent Variables

Effects of Standardization
• For Md the decision to analyze the covariance or correlation matrix or to set the metric by fixing loadings or variances makes no difference when scale free estimators such as GLS or ML are used.
• For Mg which involves equality constraints, analyzing the correlation matrix versus the covariance matrix can have substantive effects on the results obtained.
Improper Solutions
• Nonpositive definite matrices
• Nonconvergence
• Heywood cases
• Improper sign in nonrecursive models
• Binary variables
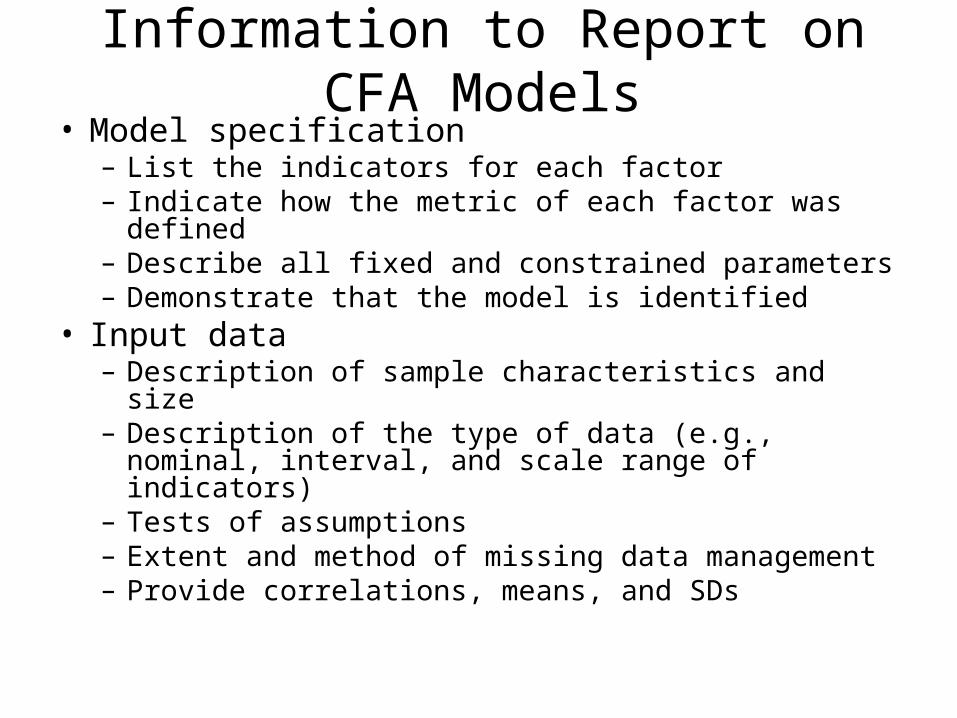
Information to Report on CFA Models• Model specification
– List the indicators for each factor– Indicate how the metric of each factor was defined– Describe all fixed and constrained parameters– Demonstrate that the model is identified
• Input data– Description of sample characteristics and size– Description of the type of data (e.g., nominal, interval,
and scale range of indicators)– Tests of assumptions– Extent and method of missing data management– Provide correlations, means, and SDs
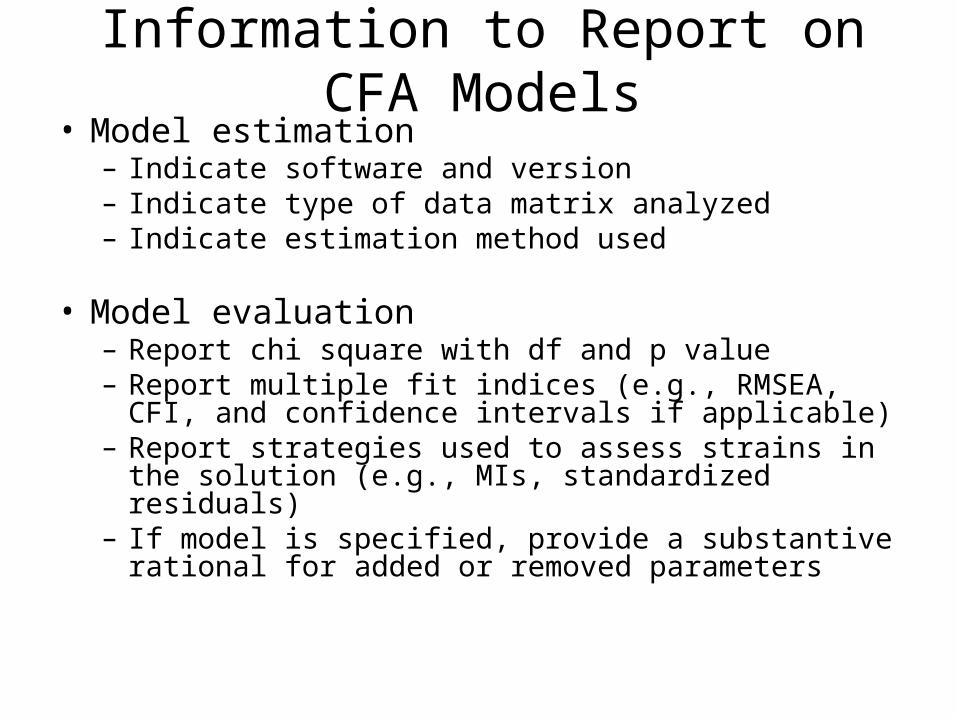
Information to Report on CFA Models• Model estimation
– Indicate software and version– Indicate type of data matrix analyzed– Indicate estimation method used
• Model evaluation– Report chi square with df and p value– Report multiple fit indices (e.g., RMSEA, CFI, and
confidence intervals if applicable)– Report strategies used to assess strains in the
solution (e.g., MIs, standardized residuals)– If model is specified, provide a substantive rational for
added or removed parameters

Information to Report on CFA Models• Parameter estimates
– Provide all parameter estimates (e.g., factor loadings, error variances, factor variances)
– Include the standard errors of the parameter estimates
– Consider the clinical as well as the statistical significance of the parameter estimates
• Substantive conclusions– Discuss the CFA results in regard to their substantive
implications– Interpret the findings in the context of the study
limitations

Reference
• J.S. Long, Confirmatory Factor Analysis, Series: Quantitative Applications in the Social Sciences, No. 33, Sage publications, 1983.