measurement in practice
TRANSCRIPT
Measurement in Practice Stan Rifkin Charles Cox
July 1991
TECHNICAL REPORT CMU/SEI-91-TR-016 ESD-TR-91-016

ii CMU/SEI-91-TR-016
Pittsburgh, PA 15213-3890
Measurement in Practice CMU/SEI-91-TR-016 ESD-TR-91-016 Stan Rifkin Charles Cox
July 1991
Unlimited distribution subject to the copyright.
CMU/SEI-91-TR-016 iii

This report was prepared for the
SEI Joint Program Office HQ ESC/DIB 5 Eglin Street Hanscom AFB, MA 01731-2116
The ideas and findings in this report should not be construed as an official DoD position. It is published in the interest of scientific and technical information exchange.
FOR THE COMMANDER
Norton L. Compton, Lt Col, USAF SEI Joint Program Office
This work is sponsored by the U.S. Department of Defense. The Software Engineering Institute is a federally funded research and development center sponsored by the U.S. Department of Defense.
Copyright 1991 by Carnegie Mellon University.
NO WARRANTY
THIS CARNEGIE MELLON UNIVERSITY AND SOFTWARE ENGINEERING INSTITUTE MATERIAL IS FURNISHED ON AN "AS-IS" BASIS. CARNEGIE MELLON UNIVERSITY MAKES NO WARRANTIES OF ANY KIND, EITHER EXPRESSED OR IMPLIED, AS TO ANY MATTER INCLUDING, BUT NOT LIMITED TO, WARRANTY OF FITNESS FOR PURPOSE OR MERCHANTABILITY, EXCLUSIVITY, OR RESULTS OBTAINED FROM USE OF THE MATERIAL. CARNEGIE MELLON UNIVERSITY DOES NOT MAKE ANY WARRANTY OF ANY KIND WITH RESPECT TO FREEDOM FROM PATENT, TRADEMARK, OR COPYRIGHT INFRINGEMENT.
Use of any trademarks in this report is not intended in any way to infringe on the rights of the trademark holder.
Internal use. Permission to reproduce this document and to prepare derivative works from this document for internal use is granted, provided the copyright and "No Warranty" statements are included with all reproductions and derivative works.
External use. Requests for permission to reproduce this document or prepare derivative works of this document for external and commercial use should be addressed to the SEI Licensing Agent.
This work was created in the performance of Federal Government Contract Number F19628-00-C-0003 with Carnegie Mellon University for the operation of the Software Engineering Institute, a federally funded research and development center. The Government of the United States has a royalty-free government-purpose license to use, duplicate, or disclose the work, in whole or in part and in any manner, and to have or permit others to do so, for government purposes pursuant to the copyright license under the clause at 252.227-7013.
For information about purchasing paper copies of SEI reports, please visit the publications portion of our Web site (http://www.sei.cmu.edu/publications/pubweb.html)
iv CMU/SEI-91-TR-016

Table of Contents Acknowledgements iii
1. Introduction 1
2. Results 2 2.1. Decriminalization of Errors 2 2.2. Measurement Is Part of Something Larger 2 2.3. Patterns 4 2.4. Measures 4
2.4.1. Start Small 4 2.4.2. Use a Rigorously Defined Set 4 2.4.3. Automate Collection and Reporting 4
2.5. People 5 2.5.1. Motivate Managers 5 2.5.2. Set Expectations 5 2.5.3. Involve All Stakeholders 5 2.5.4. Educate and Train 5 2.5.5. Earn Trust 6
2.6. Program 6 2.6.1. Take an Evolutionary Approach 6 2.6.2. Plan to "Throw One Away” 6 2.6.3. Get the Right Information to the Right People 7 2.6.4. Strive for an Initial Success 7
2.7. Implementation 7 2.7.1. Add Value 7 2.7.2. Empower Developers to Use Measurement Information 7 2.7.3. Take a “Whole Process” View 7 2.7.4. Understand that Adoption Takes Time 8
2.8. Benefits 8
3. Measurement Mandate 9
Appendix A. Case Studies 10 A.1. Approach and Method 10 A.2. Template 11 A.3. Introduction to the Case Studies 11 A.4. Case 1 16 A.5. Case 2 22 A.6. Case 3 28 A.7. Case 4 35 A.8. Case 5 41 A.9. Case 6 48 A.10. Case 7 53 A.11. Case 8 57 A.12. Case 9 63 A.13. Case 10 71 A.14. Case 11 76
Appendix B. Additional Measurement Program Information 79
CMU/SEI-91-TR-016 i

List of Figures Figure A.1-1: Organizational Structure 15 Figure A.3-1: Organizational Structure 27 Figure A.6-1: Organizational Structure before PDR 42 Figure A.6-2: Organizational Structure after PDR 43
ii CMU/SEI-91-TR-016
Acknowledgements We gratefully acknowledge the support of the Software Process Program led by Watts Humphrey at the Software Engineering Institute (SEI), at the time we conducted the survey. The SEI Joint Program Office generously supported Mr. Cox’s effort while he was a Resident Affiliate, particularly his travel. The Naval Undersea Warfare Engineering Station and the Naval Weapons Center both contributed resources to aid Mr. Cox. Master Systems Inc. provided time and computing resources for Mr. Rifkin. The report was reviewed by our SEI colleagues, who sacrificed time: Maribeth Carpenter, Sholom Cohen, Bob Park, Al Pietrasanta, Jim Rozum, and Jane Siegel. The manuscript was ably edited by Frost McLaughlin, Linda Hutz Pesante, and her colleagues in SEI Information Management. Anita Carleton supported us as the SEI project leader. Marcia Theoret helped the authors handle those many details that need to be accomplished to publish any SEI technical report. We owe a substantial debt of gratitude to the 11 divisions of the 8 organizations that participated in the survey for spending considerable time with us, for reviewing our findings, and for granting us permission to publish the material presented here.
CMU/SEI-91-TR-016 iii

iv CMU/SEI-91-TR-016
Measurement in Practice
by Stan Rifkin and Charles Cox*
Abstract: A few organizations have reputations for implementing excellent software measurement practices. A sample of these organizations was surveyed in site visits. Clear patterns of practices emerged and they are reported at a con-solidated, “lessons learned” level and in more detailed case studies.
1. Introduction The Software Engineering Institute (SEI) Software Process Program encourages the use of measurement1 to aid the management of software development and maintenance.2 As part of our encouragement, we seek to expose software practitioners and managers to the greatest benefits and best operation of measurement programs. Measurement is critical to the software process maturity framework3 promulgated by the SEI, and this relationship provided additional impetus to collect excellent measurement practices. This report presents the results of site surveys of 11 divisions of 8 organizations that have gained reputations for having excellent4 measurement practices. While these organizations are considered leaders in software measurement, this is by no means an exhaustive list. By publishing these results, we hope to encourage other organizations to increase the effectiveness of their measurement programs. We visited one or more divisions of the following organizations (in alphabetical order): Contel, Hewlett Packard, Hughes Aircraft, IBM, McDonnell Douglas, NASA, NCR, and TRW.
*Current affiliations: Stan Rifkin, Master Systems Inc., PO Box 8208, McLean, Virginia 22106; Charles Cox, Naval Weapons Center, Code 3108, China Lake, California 93555. 1 The terms "measurement,” "measures," and "metrics" are used interchangeably. "Measurement" includes the categories of process, product, and project. 2 "Development" is used in the remainder of this report to mean both development and maintenance. 3 Watts S. Humphrey, “Characterizing the software process: A maturity framework,” IEEE Software, 73-79, March 1988; and Managing the Software Process, Watts S. Humphrey, Addison-Wesley, 1989. 4 "Excellent" is used in the same sense as "excellent companies" in In Search of Excellence, Thomas J. Peters and Robert H. Waterman, Jr., Warner, 1982, namely, "continuously innovative", p. 13.
CMU/SEI-91-TR-016 1
2. Results Persistent patterns emerged from our discussions with measurement leaders, and we found numerous interrelationships among the patterns. There were two patterns that ran through all the organizations: errors have been decriminalized, and measurement is part of something larger.
2.1. Decriminalization of Errors The organizations we interviewed discuss, analyze, examine, study, and evaluate errors, failures, defects, shortfalls, and problems. These organizations expressed the belief that one of the most effective ways to improve quality and productivity is to eliminate currently known errors. They seek to eliminate those errors in ways that insure they will not occur again–by improving the underlying software development process that produced the error in the first place. We saw this decriminalization of errors in many ways. Project estimates included expected defect rates, and actual rates were closely tracked. Senior management project reviews dealt in detail with causes of deviating from cost, schedule, and quality targets. Project managers became experienced in planning corrective actions that kept actual defects under control. Defect prevention teams regularly looked for root causes of errors and suggested process improvements. Customer support personnel took the customer's point of view and, therefore, had a broad definition of failure (“any problem the customer is having”). In a word, defects were made public. No one was surprised by them. Everyone was working to eliminate them. Errors were talked about in the hallways and around the water coolers. These organizations believe that if you cannot see errors, you cannot eliminate them.
2.2. Measurement Is Part of Something Larger These organizations developed their programs in the first place within the context of overall software improvement (though not necessarily process improvement). Measurement was an integral part of a culture of quality in the organizations; it was not added on, appended, or made to stand alone. One of the most impressive integrations was with an organization that had a corporate standard requiring that each new product at release have a defect density lower than the mature product it replaced. The only way to know whether the new product had a lower de-fect density was to measure the mature product and to measure the new product. And if the measurement of the new product was made only just before the release decision, there would not have been enough time to take corrective action. Accordingly, this organization learned to track the defect density profiles over the whole development cycle in time to plan and execute corrective actions, if required. This organization now knows a great deal about how to set quality goals, the shape and behavior of defect density profiles over the devel-opment and field life cycle, and which corrective actions work and which do not. In other words, measurement was used to aid understanding of the software development life cycle. It was part of a bigger picture, part of a culture of quality improvement.
2 CMU/SEI-91-TR-016

CMU/SEI-91-TR-016 3

2.3. Patterns We observed a small set of patterns that were consistent across numerous organizations surveyed, though not every element of these patterns was found in every surveyed organi-zation. One aspect bears repeating: the patterns are overlapping and interrelated. For ex-ample, taking an evolutionary approach and understanding that adoption takes time are re-lated: one is urged to take an evolutionary approach in light of the observation that adoption takes time. The patterns fell along four dimensions: the content of the measures, matters regarding people, the measurement program, and how the program was implemented. Each dimension is elaborated below in the following sections.
2.4. Measures 2.4.1. Start Small Several organizations collect just one datum, one measure: defects. They present and ana-lyze this one measure in many ways, and they manage software development based on the measure. Other organizations collect in the range of 10 to 20 measures, concentrating on information that has to be collected for other purposes (such as for cost accounting). All organizations emphasized measures that were conspicuously practical, that incurred low collection cost and effort, and that could be presented simply (i.e., were fundamental or were a binary function of fundamental measures). Typical starter sets included measures of effort (labor hours), size (lines of code), and quality (defects). 2.4.2. Use a Rigorously Defined Set All organizations agonized over the precise definitions of the measures they wanted to col-lect. Typically, they first defined the uses of the measures and then prepared draft definitions that were circulated to the stakeholders or their representatives for review. Many or-ganizations concentrated on defining sets that could be collected by machine. Some organizations prototyped their definitions by using the draft definitions on a pilot project for a short time to see if any unanticipated concerns arose. 2.4.3. Automate Collection and Reporting Those interviewed advised us to minimize as much as possible the impact of measurement on software developers by defining measures that could be collected automatically. We noted that most organizations planned for, developed, and provided automated tool support for measurement as early as possible. Many organizations had automated line counters, and some organizations had front-ends to traditional time card accounting systems; these front-ends would strip off a code indicating where in a project's work breakdown structure the reported labor hours were being spent. Many organizations used existing automated tools such as spreadsheet software, software configuration management systems, and text presentation systems linked to numerical in-formation in other files to assist in report generation.
4 CMU/SEI-91-TR-016
2.5. People 2.5.1. Motivate Managers Our interviewees said that managers must be motivated to learn the value of measurement as a management tool and to accept the added responsibility (and cost) of performing measurement. Appropriate rewards and recognition need to be established at all levels of the organization in order to encourage and sponsor measurement efforts. Many organizations saw that if line management liked what the measurement program was producing, then by “natural selection” the effort would survive, grow, and prosper. Accord-ingly, line management has been the primary user of many of the measurement programs surveyed. One motivation for using measurement is the support measurement provides for decisions. In meetings with upper management or with customers, measurement reports can substantiate the schedule needed for changes, the time and resources required for incorporating proposed changes, and other typically controversial issues. 2.5.2. Set Expectations Measurement can be used for many purposes. In order to set expectations, the goals of measurement must be focused and articulated. The most common foci were on cost, schedule, and quality. One common goal was to ascertain where additional resources could be applied in order to improve the software product or process. Again, we found that the emphasis was on collecting information that had to be collected for another purpose anyway. These organizations were careful not to over-promise the benefits of measurement. Measurement thereby gained acceptance as part of the “standard practice” of software development and management, as opposed to an art practiced by staffers who might not be involved in the day-to-day experience of software design and production. 2.5.3. Involve All Stakeholders Measurement is used in different ways at different levels and, therefore, is perceived differ-ently by its users and by those measured. Organizations with successful programs found it important during formative stages to include all stakeholders in the discussions of the goals, uses, and definitions. Some organizations had proclaimed measurement standards or definitions unilaterally and found that such proclamations were resisted, particularly at the practitioner level. Later, these organizations had to re-engineer their measurement programs in order to involve all stakeholders. Involving all stakeholders is one step toward earning trust (see 2.5.5). By acknowledging that measurement is a “loaded” subject in the eyes of those who may have had negative experiences with measurement (SAT scores, school grades, job performance evaluations, etc.), the successful measurement programs have worked to include software practitioners in the early stages of measurement definition. 2.5.4. Educate and Train
CMU/SEI-91-TR-016 5

It is important to educate and train all persons who are affected by measurement. Training materials need to be tailored to the level and responsibilities of the target groups. It is typical for organizations to target measurement training courses for different audiences: an overview course for those who need to know why they are–or should be–involved in a measurement program, an analysis course for managers and development staff, and an implementation course for those responsible for preparing, entering, and validating the input data. Several organizations stated that the payoff in measurement is its use for evaluating the software process; training is required to take advantage of that use. 2.5.5. Earn Trust A fear of software developers and managers is that the results of measurement will be used to rate individuals, projects, and/or divisions. A common practice to allay such concerns was to make results anonymous so that at each succeeding level of aggregation it was not possible to identify the specific reporting units. For example, presentations that contain multiple projects refer to those projects as Project A, Project B, etc. Usually, the staff associated with each project knows which data are its own, but cannot match the other coded project designations with real projects. On a par with the rating issue is the concern that no harm come to the bearer of bad tidings–that the truth not be penalized. The earlier problems surface, the easier and less costly it is to deal with them. This need for candor extends all the way from the sources of the data to those who report on the results of the analyses.
2.6. Program 2.6.1. Take an Evolutionary Approach Because measurement is part of a culture change, it must be viewed as part of a continuous journey. Measurement can be viewed as an application of both standard management prac-tices and the scientific method. The most successful programs we observed supported experimentation and innovation (both with measurement and with software development), self-actualization, and improvement of technology and process. To support evolution, there is a need to plan for regular reviews of all aspects of the measurement program (goals, implementation, use, delivery, cost-effectiveness, etc.). One of the ways this was manifested was in the changing focus of the organization’s measurement program. As development problems made visible by the measurement program were being resolved, new issues were being raised that called for a modification of the measurement effort. These changes were needed to obtain the information required to analyze the new concerns and then to determine whether the changes implemented were successful in remedying the problems. 2.6.2. Plan to "Throw One Away” The evolutionary approach can, by itself, imply the need to throw away some or all of the first measurement program (a paraphrase of one of “Brooks' Laws”5). Several organizations pilot tested their measurement system, knowing that some parts of it would survive scrutiny and that other parts would have to be revised. Along these lines, pilot programs do more than just prove a new technology, they also help identify those items that lack merit and should be
5 The Mythical Man Month, F. Brooks, Addison-Wesley, 1975.
6 CMU/SEI-91-TR-016

dropped from the program. Futher, pilot programs help organizations learn how to change, how to implement new technologies independent of the content. Virtually every organization surveyed is using a different measurement set than it used a few years ago. For some, this represented throwing away the program and starting over. 2.6.3. Get the Right Information to the Right People The value of even the best measurement programs will be diminished if the people who have managerial authority do not receive the information that will help guide their decision making. Measurement reports must be relevant, timely, and limited to that information needed at the particular level of the recipient. 2.6.4. Strive for an Initial Success Carefully choose the initial projects to be measured. The whole program will be judged by an assessment of the early return on investment. Many organizations achieved continuing support for measurement by targeting projects based on their potential for a successful measurement program. Naturally, this factor has to be balanced with an accurate set of expectations about what measurement can and cannot deliver (see Section 2.5.2).
2.7. Implementation 2.7.1. Add Value Adding value implies that something must result from the measurement effort. The increase in knowledge and understanding as a result of measurement must be translated into action by managing and developing software in better and smarter ways. Some organizations cautioned not to promise more than could be delivered, especially early in the life of a measurement program when there is an insufficient base of data upon which to support inferences. It was easier for some organizations to add value because they bound the program's costs by concentrating on data that had to be collected in any case. 2.7.2. Empower Developers to Use Measurement Information Measurement can help developers in their interchange with both external and internal customers. The ability to quantify concerns helps developers and customers reach a com-mon understanding as to where viewpoints and definitions differ. Further, armed with his-torical measurement information, developers can respond to customer request for change with reasoned analyses of the impact of those changes upon the program. In a few organizations, we heard about the following kind of statement made by a develop-ment manager to a customer: “I am going to work very hard to make the changes by the time you need them, but historically, based on the figures I have just given you, it will take longer than your imposed deadline. I recommend that you modify your plans in light of our history.” 2.7.3. Take a “Whole Process” View The application of measurement to development is just one piece, though an important one, of the development mosaic. An understanding of the whole system development process, as well as of measurement, is required for beneficial use of the technology. Also, measurement
CMU/SEI-91-TR-016 7

information must be tempered by good judgment. For example, one organization found that it had planned to improve a particular area of software development only to discover–while developing its business case for the improvement–that software development accounted for a very small portion of the system development cost. Also, persons experienced in software process improvement advise others considering a pro-gram of continuous improvement to be careful to stabilize the development process before trying to change it, whether the change is suggested by measurement or not. 2.7.4. Understand that Adoption Takes Time Measurement and process improvement take time. They take more than just defining and establishing a program. They require a change in attitude, a shift in culture, and these do not happen quickly. The change can take years and must be continually reinforced to survive and grow.
2.8. Benefits We saw evidence that measurement has been beneficial to:
• Support management planning by providing insight into product development and by quantifying trade-off decisions
• Support understanding of both the development process and the development envi-ronment
• Highlight areas of potential process improvement as well as objectively characterize improvement efforts
The table in Appendix A indicates a few of the specific benefits experienced by the organi-zations surveyed, and the actual case studies in that appendix provide more detail about the benefits.
8 CMU/SEI-91-TR-016

3. Measurement Mandate Most improvement efforts fail not for lack of planning, but in implementation–for lack of understanding how change is made. Measurement follows that pattern. Those implementations that were successful experimented to find the right mix of needs, levels of sponsorship, and scope of measurement. Accordingly, experimentation has to be encouraged, something we see only rarely in software organizations at large, but which we saw consistently in the excellent measurement organizations surveyed. Perhaps the biggest impediment to successfully implementing measurement is fear, fear that measurement will be used to control and coerce workers. After all, one hears slogans such as, “You cannot control what you cannot measure” and “What gets measured gets done.” There is no better prescription for driving out fear than that offered by W. Edwards Deming in Out of the Crisis.6 We recommend it to our readers. There are many good examples of successfully implemented software measurement pro-grams in this report that will serve our readers as an inspiration. The next step for an organization desiring to start a measurement program or to increase the effectiveness of an existing program is to study the patterns in the previous chapter and the case studies in Ap-pendix A in order to develop a program tailored to the organization’s culture, structure, and needs.
6 MIT Press, 1986.
CMU/SEI-91-TR-016 9
Appendix A. Case Studies
A.1. Approach and Method We developed a survey instrument and canvassed a variety of experts and authorities to identify organizations reputed to have excellent software measurement programs. We then selected a cross-section of defense, commercial, and government software development or-ganizations from the candidates identified to provide as representative a picture of the state of the art among the leaders of software measurement as our resources would permit. We conducted the survey from February to August, 1990. We visited 11 sites representing eight organizations. We interviewed a wide variety of peo-ple; for example, the leader of a corporate advanced technology applications department, a department manager tasked with advancing measurement efforts within a division, a soft-ware project manager who was creating a measurement program to help manage his own project, a cost engineer, a quality assurance manager, and software engineers. We spoke with people at project, site, and corporate levels. The number of persons with whom we spoke at each site ranged from one to more than a dozen; the interviews ranged from half a day to several days. While we used our survey instrument to structure and direct our inves-tigation, the reported results of each visit reflect the variety of experiences and organizational positions of our sources. We encouraged our sources to communicate with us in their own terms. We have attempted to report their disparate descriptions within a common structure in this case study section in an attempt to reveal patterns across the programs. At the same time, each case study has been written as much as possible in a style reflecting its sources; therefore, some consis-tency of presentation style among the case studies has been sacrificed in order to achieve an accurate characterization of what we heard. Each case study is introduced by material highlighting the organization's distinguishing characteristics to indicate the environment and "culture" that we observed, but which may not have been reflected by looking at measurement issues alone. To ensure candor on the part of our sources, we promised confidentiality to the organizations surveyed, so the identity of the respondent organization is not provided with the case studies. In order to keep the identity of their organizations confidential and to preserve proprietary information, many respondents were reluctant to share for publication either (a) the specific metrics they use, or (b) typical values of measurements. As odd as it may seem for a technical report on measurement, we were unable to obtain permission for much in the way of tangibles: graphs, charts, tables, and actual measurements. This constrained our results to subjective and qualitative terms. All of the case studies have been reviewed by the surveyed organizations and all have given their permission for publication.
10 CMU/SEI-91-TR-016
A.2. Template We divided our observations into the following categories:
• Distinguishing characteristics - We observed more than measurement alone. We saw the results of organizational culture, so in this section we briefly state what we saw.
• Organization - How an entity is organized is sometimes reflective of its capability to produce quality software, so we have recorded it here. Also, it helps to answer how best to organize the measurement function.
• Metrics history - We tried to capture the relevant history that brought the measure-ment program to its current state.
• Current program - We tried to obtain the actual metrics that were being recorded. In many cases, we could not obtain permission to report them.
• Future plans - Many programs have announced plans for the extension of the measurement program and we record them here.
• Funding - The sources of funding varied and we report here what we were told. • Lessons learned - These are usually in the form of paraphrases from the persons we
interviewed. Many are disjoint, spontaneous, prescriptive statements; sometimes they are statements of the benefits.
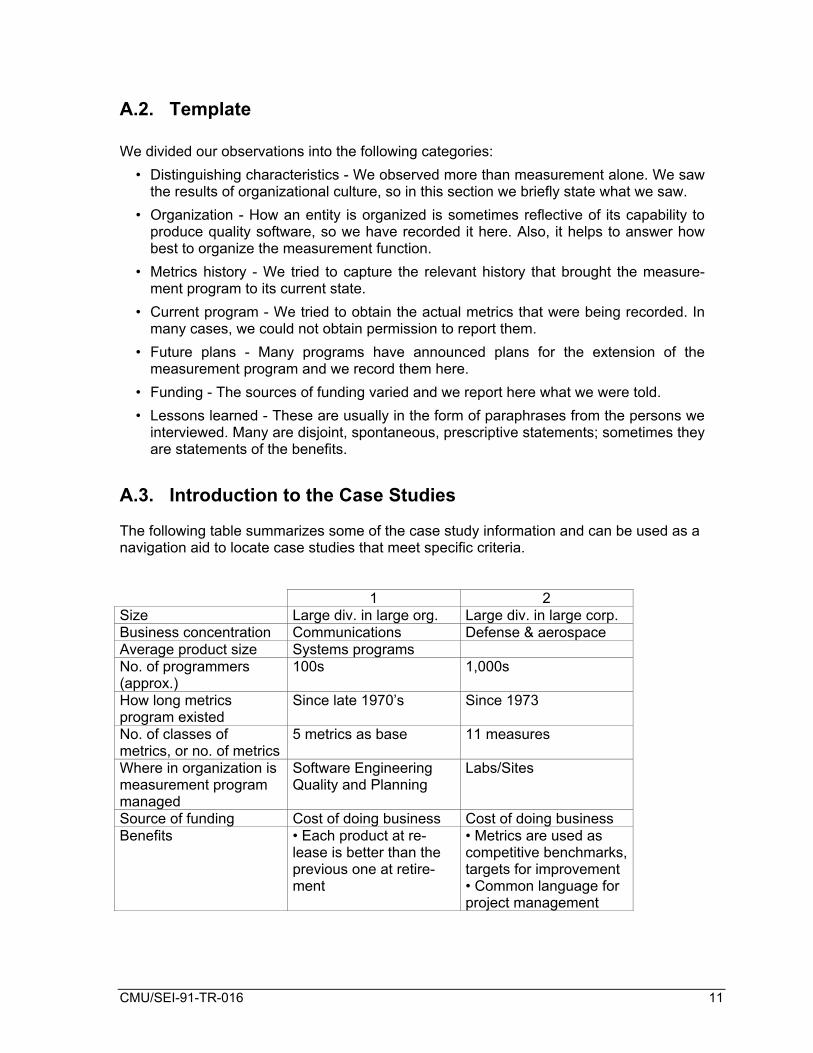
A.3. Introduction to the Case Studies The following table summarizes some of the case study information and can be used as a navigation aid to locate case studies that meet specific criteria. 1 2 Size Large div. in large org. Large div. in large corp. Business concentration Communications Defense & aerospace Average product size Systems programs No. of programmers (approx.)
100s 1,000s
How long metrics program existed
Since late 1970’s Since 1973
No. of classes of metrics, or no. of metrics
5 metrics as base 11 measures
Where in organization is measurement program managed
Software Engineering Quality and Planning
Labs/Sites
Source of funding Cost of doing business Cost of doing business Benefits • Each product at re-
lease is better than the previous one at retire-ment
• Metrics are used as competitive benchmarks, targets for improvement • Common language for project management
CMU/SEI-91-TR-016 11

3
4 Size Large org. Large div. in large org. Business concentration Computers & electronics Space flight Average product size Varies widely 150 KSLOC No. of programmers (approx.)
1,000s 180
How long metrics program existed
Since 1983 14 years
No. of classes of metrics, or no. of metrics
3 sets of corporate level metrics; 3 sets of division and lab measures (one still in development); various project-specific measures. Some measures are applied at several levels
Basic set addressing cost, errors, project chars, history, resources, plus add’l metrics driven by the Goal/Question/Metric paradigm for each project
Where in organization is measurement program managed
Corporate engineering and quality groups, product level quality groups, division productivity/quality managers
Program office
Source of funding Overhead • "Tax" on programs for collection • Separate line item for processing • Research funding for analysis
Benefits High Level--Strategic measures to view product quality, time to develop products, resource usage, generic problems Middle Level--More process focused, used to control development in lab environments Low Level--Deal with more immediate issues such as readiness for integration, ability to meet milestone deadlines, etc.
• State of the art insights into the development process and the value of alternative tools and methods • Most of the insights into software engineer-ing & development that have come from metrics arise from this program
12 CMU/SEI-91-TR-016

5
6 Size Large div. in large org. Large div. in large org. Business concentration Space flight Defense & aerospace Average product size 300 KSLOC No. of programmers (approx.)
325 75
How long metrics program existed
Since the early 1970s New
No. of classes of metrics, or no. of metrics
Four classes (product, schedule, cost, quality)
14 metrics
Where in organization is measurement program managed
Cost engineering Office of the chief (project) engineer
Source of funding In the contract Combination of over-head and direct costs
Benefits • Cost and schedule are segregated into function- and time-driven • SEI maturity level 5 • More time spent on inspections
• Project is on time and within budget
CMU/SEI-91-TR-016 13
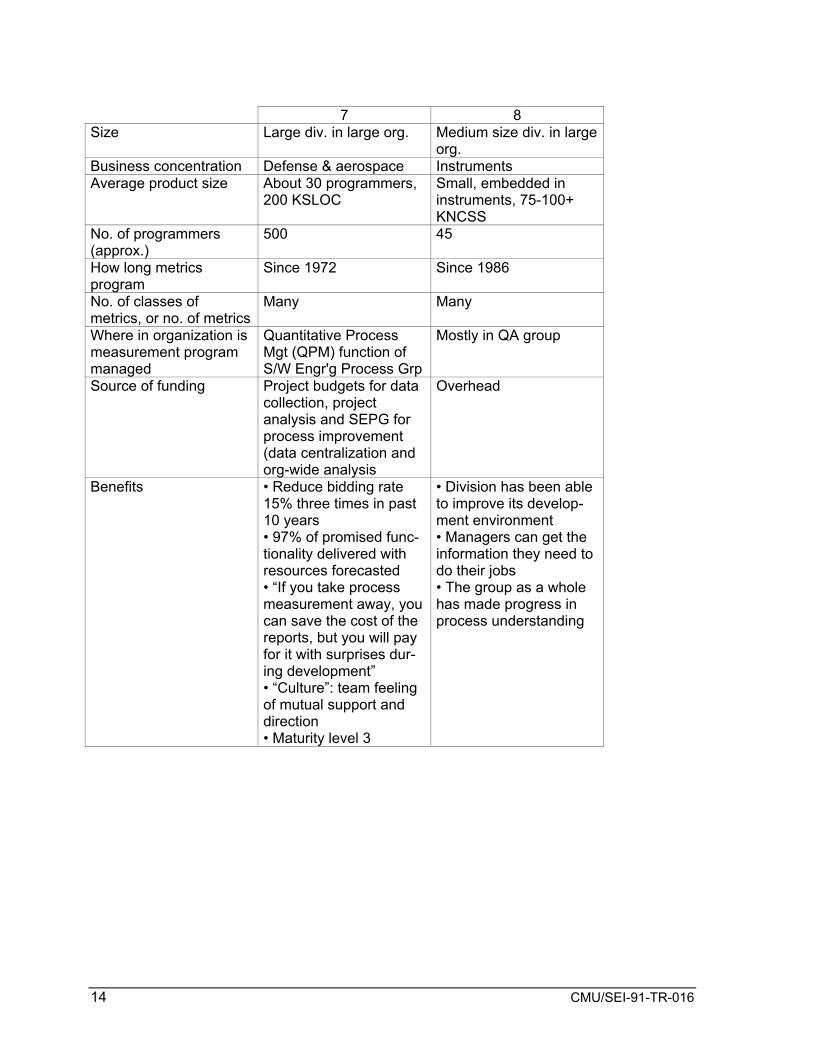
7 8 Size Large div. in large org. Medium size div. in large
org. Business concentration Defense & aerospace Instruments Average product size About 30 programmers,
200 KSLOC Small, embedded in instruments, 75-100+ KNCSS
No. of programmers (approx.)
500 45
How long metrics program
Since 1972 Since 1986
No. of classes of metrics, or no. of metrics
Many Many
Where in organization is measurement program managed
Quantitative Process Mgt (QPM) function of S/W Engr'g Process Grp
Mostly in QA group
Source of funding Project budgets for data collection, project analysis and SEPG for process improvement (data centralization and org-wide analysis
Overhead
Benefits • Reduce bidding rate 15% three times in past 10 years • 97% of promised func-tionality delivered with resources forecasted • “If you take process measurement away, you can save the cost of the reports, but you will pay for it with surprises dur-ing development” • “Culture”: team feeling of mutual support and direction • Maturity level 3
• Division has been able to improve its develop-ment environment • Managers can get the information they need to do their jobs • The group as a whole has made progress in process understanding
14 CMU/SEI-91-TR-016

9 10 Size Large div. in large org. Large org. Business concentration Defense & comm. Computers Average product size 10s of KSLOC; 30-50
programmers each Major programs: 100 programmers build 1 million SLOC
No. of programmers (approx.)
Many 4,000
How long metrics program
2 years Since 1969
No. of classes of metrics, or no. of metrics
2-5 metrics for each maturity level
9 metrics
Where in organization is measurement program managed
Corporate R&D Corporate quality assurance
Source of funding Overhead and business units
Cost of doing business
Benefits • Tailored to process maturity • Vendor products being evaluated numerically • More rational testing: every hour spent on metrics saved 10 hours of testing • Portability & reuse substantiated • Software no longer the cause of all schedule slips
• Documented 8% im-provement in productiv-ity due to using auto-mated tools
11 Size Medium size div. in large
org. Business concentration Defense & aerospace Average product size 150-200 KSLOC No. of programmers (approx.)
40
How long metrics program
New
No. of classes of metrics, or no. of metrics
Dozen measures of resource usage, product, and error data
Where in organization is measurement program managed
Software development management
Source of funding In the contract Benefits New program
CMU/SEI-91-TR-016 15

A.4. Case 1 Distinguishing Characteristics There is a corporate directive that every new version, at release, will contain fewer defects than the last version contained at retirement. A defect prevention process has been widely used for some time. Many of this organization's software products are mature, so the organ-ization concentrates on examining just how defects escape the development process and get incorporated into the product. Some defect injection processes have been permanently corrected. The defect prevention process may be the highest leverage way for this organi-zation to improve at this point because the staff is well-trained in software engineering and the products are mature. Organization This programming organization develops and maintains software products for communica-tions systems for a major computer manufacturer. These products contain about half a mil-lion lines of code each. Each product area performs its own design, implementation, unit test, and functional verifi-cation testing; there is some process and tool support dedicated to each product area. Each product area is organizationally divided into development and testing groups. Each group is then partitioned into units with responsibility for major components of the product software. Each one of those units is further broken down into departments of 8-12 people who are collectively responsible for the modules assigned to them. In addition to the product areas, there are numerous laboratory-wide functions. For example, a software engineering group provides process, metric, and tool support to all product areas. In the following figure, this group is labeled “Software engineering.” There is also a testing organization, System test, that is independent of the development organizations. shown below.
Figure A.1-1: Organizational Structure
16 CMU/SEI-91-TR-016
There are generally three levels of test beyond unit test From the least integrated and farthest from the customer, to the most integrated and closest to the customer, they are:
• Functional verification test • Product verification test • System verification test
Metrics History In 1985 an effort was initiated to improve the way software was being developed. A method was defined for evaluating software development products. This method was documented in detail in a pair of corporate instructions. Each producing organization was responsible to define process goals and methods to better manage development processes and improve ef-ficiency. These instructions prompted the organization to develop a five-point strategy for the initiative:
• Inject fewer defects • Find defects sooner • Ship fewer defects • Improve productivity • Reduce development cycle elapsed time
The measurements used to help monitor progress toward these goals were:
• Total internal defects per KCSI: indicates progress in dealing with defect injection (KCSI are thousands of changed source instructions, where change is defined as new and modified).
• Percentage of all defects found before functional verification test: shows how well design and implementation phases are discovering defects and indicates the quality delivered to the “customer” (represented by the functional verification test organiza-tion).
• Defects (total valid unique problems from the field) per KCSI (thousands of changed source instructions) and per KSSI (thousands of shipped source instructions).
• KCSI per person-year. • Development elapsed time.
Data for 1986 provide the baseline for both the metrics and the five-year improvement plan. Based on lessons learned from the higher quality products, products with lower quality levels should improve faster. Each product must show improvement; it is not sufficient just to stay within the range of “acceptable” quality.
CMU/SEI-91-TR-016 17

Current Program The major focus of this organization's program is on process changes to improve the way work is accomplished, resulting in increased product quality and reduced cycle time. Additional effort is targeted toward improving the estimation and forecasting process to better predict both the resources and time frame required to develop software, and the resources that should be budgeted to maintain commercial products. Process improvement was initiated at the corporate level. The focus of internal measurement is to inject fewer defects and to find defects sooner (i.e., do not solely rely on testing to find product defects). The goal is for the best product to get better and the worst to improve quickly. The rules are to stay within target goals and to improve on past performance. This quality focus embraces code already released (base code) as well as newly developed code. Defects found by the testing organization, customer-reported defects, defects per KCSI (new and modified code), and defects per KSSI (shipped source instructions) are the only numbers carried forward for field tracking. These numbers have provided an early warning of quality concerns and allowed product management to concentrate on potential and real quality problems. Analysis charts of predecessor, planned, actual-to-date, and expected defect values per KCSI provide signal flags for the development phases: three levels of design (product, component, and module), code, unit test, other (e.g., defects found by developers after release to testing), and the three verification test levels (functional, product, and system). Deviation from the target defect range for a particular phase indicates possible development process problems that must be investigated. Total defects per KCSI is interpreted as adherence to a defined, repeatable process; that is, a low and stable value for total defects per KCSI is considered to be evidence of following a defined, repeatable process. Quality levels for the development stages are evaluated against the plan. Significant variations must be explained and corrective actions are taken where warranted. Quality certification is conducted at least two times: prior to product announcement and prior to product shipment. The objective of quality certification is to decide whether the product will meet post-shipment targets; it is an independent assessment of product quality performed by an independent quality support group. Quality reviews are held quarterly with upper management and cover all products within the organization. The reviews are at a summary level with more detailed presentations for key products. Detailed product-level quality reviews with product management are held at least monthly and more often with individual departments as needed.
18 CMU/SEI-91-TR-016

External Measures - For each of the measures below, there are several variants of graphical representation: stacked and unstacked, instantaneous and cumulative, customer-reported and all sources, etc. These measures are tracked for shipped software:
• Number of copies in field use - Indicates how many product users there are and as-
sists in predicting staffing levels required for the service organization. • Number of valid, unique problem reports from the field, projected vs. actual, by
version and release, per KCSI over the life of the product. • Number of valid, unique problems from the field, projected vs. actual, for all releases,
per KSSI. • Total problem reports per user-month of experience, planned vs. actual. • Fixes in error over time.
There are a number of other measurements of product quality, many of them more detailed breakdowns of these data, that are also tracked. Internal Measurements - These measures are collected and reported for code still under de-velopment.
• Percentage of defects found before functional verification test (a range based on
statistical experience). • Internal defect injection rate goals (a range based on statistical experience) per KCSI
vs. actual by product release. • Defects per KCSI by development phase (product level design to unit test, and func-
tional verification test to system verification test), showing predecessor, plan, expected, and actual-to-date.
For each product release, a quality summary report is prepared that includes:
• Product identification • Ship date • Total number of changed source instructions • Product quality: projected field defect rate (valid unique problem reports per KCSI,
over the life of the product.) • Process quality:
- Percentage of defects encountered before functional verification test - Defects per thousand lines of changed source instructions during the phases of functional verification test to system verification test - Total defects per thousand lines of changed source instructions during
development
The standardized approach permits the automation of a large part of the collection of data and chart generation. This frees resources to address specific process issues. “The result is delighted customers and good estimates of maintenance costs.”
CMU/SEI-91-TR-016 19

20 CMU/SEI-91-TR-016

Future Plans They plan to expand tracking to include the rate of defect injection by phase. “We've got to get a lot better.” Funding All measurements are funded as part of product development. Lessons Learned
• Don’t set the release goal for defects per thousand lines of code arbitrarily. Goals for quality improvement should be backed up with concrete process improvement actions.
• Measuring problems per user-month was found not to be useful; the rate of problems can go up as the problems per user-month decreases, because user-months can in-crease dramatically just after a new release. There are a lot of confounding influences in this metric.
• The best way to manage fixes in error is to go by raw numbers, not by percentages, rates, or other normalization. The reason is that derived measures (that is, ones computed from two or more different dimensions) can deviate for a number of reasons not related to the factor you are examining. For instance, if fixes in error per KCSI decrease, it may be because there has been an extraordinary increase in the number of changed source instructions and not because of any improvement in the fix process.
• Internal defect discovery (via inspection and test) is a fairly good predictor of external (field) discovery rates if a repeatable software engineering process is followed.
• The biggest challenge is sensitizing the organization to the customer. If developers don't follow the process, then the customer will discover the relatively high number of defects that have been injected.
CMU/SEI-91-TR-016 21

A.5. Case 2 Distinguishing Characteristics This division, a pioneer in measurement, has a very strong quality culture and a reputation for producing high quality systems. The measurement program has been in place for 18 years and is just emerging from a major redefinition. Two organizations were surveyed: a division headquarters staff organization and a division site. 1. Division Headquarters Staff Organization This is a large division specializing in computer systems development. The division provides the federal government with systems solutions that may include integrating hardware and software from other manufacturers with their own products. The division headquarter’s measurement effort is a staff function under its software engi-neering process group. One person has responsibility for the analysis of measurement in-formation submitted by the sites. A software engineering council and a software technical steering group control the metrics program based on input from users or sites, division headquarters staff, and others. Division headquarters maintains a list of proposed changes and the steering group prioritizes these changes. Metrics History Some measurements have been collected since 1973, when a program to look at new software development processes was initiated. The division redefined the system of measurement in 1979 and again in 1989 to take advantage of better tools and to establish a historical database for the division. The division effort grew out of problems resulting from inconsistencies across different sites. The renewed (1989) effort was guided by a white paper produced under the sponsorship of the division's software engineering council, a body with representatives from all sites. The white paper identified several services the revamped measurement program should provide: (1) add previously lacking key information regarding reuse, quality, and technology; (2) promote use of the database by making it easily accessible to all members of the division; (3) allow for effective monitoring by upper management and division headquarters, while maintaining anonymity of the projects.
22 CMU/SEI-91-TR-016
Another concern described by the white paper was a desire to determine how competitive the organization was and the reasons for that standing. Still another goal was to help manage programs-in-progress and plan for their completion. The division has significant support for this effort from the division manager for software technology who is, in turn, supported by the software engineering council, which is comprised of senior-level software managers. Another key factor supporting this division-level program is the work in progress to establish universal measurement objectives at the corporate level. The focus of the effort is to create a crisp, lean set of measures that look not just at how things are done now, but also at how to improve the way they will be done in the future. Therefore, the major effort has been to establish a small set of agreed upon definitions to keep the measurement requirements simple. Current Program Data collection with the current system (resulting from the redefinition effort in 1989) began in the fourth quarter of 1989. The first report was produced in December 1989 using a tool developed in-house; the report covered 11 projects (2 completed, 1 nearly completed, the rest still in progress). Each site has a Site Measurements Representative who is responsible for collecting data according to site procedures, recording data using the tools system, and, with concurrence of site management, transmitting site data to division headquarters. Data are collected by project, by site, by type, and by class (company or subcontractor). All sites use the in-house tools. Reports are submitted at four milestones: proposal submission, contract award, fall plan, and contract end. Measurement data and reports are then provided back to the sites for use and analysis. The individual sites themselves may–and most do–keep additional metrics for local concerns. Definition of the measures, the measurement practices, and the tool requirements are con-trolled by the software technology steering group and the software engineering council. Collection of the measurement data is viewed as part of a software manager's job. The current measurement system consists of:
• Ten measures that have been systematically reported since the fourth quarter of 1989. An 11th measure was added in April 1990. Identification of these measures was made by the software engineering council level, and agreement was reached based on past history, current technology, and perceived needs of the software engi-neering council based on practitioner and management input.
• Program support for data entry, data submittal (from sites to headquarters), and re-port generation. The raw data are collected by automated tools that then calculate the 11 measures and produce a set of measurement reports for the site user. Upon approval of site management, these reports are then transmitted to division head-quarters.
• An on-line mainframe SQL-based database that is accessed by the sites.
CMU/SEI-91-TR-016 23

The measurement program:
• Establishes a rational basis for process evaluation and improvement. • Provides summary reports to all division programs via software engineering council
representatives. • Promotes competitive bids via insights into productivity achieved by top performing
programs. • Promotes management tracking of projects.
Future Plans A list of proposed changes (measurements, practices, tools, etc.) is maintained at the divi-sion level and is prioritized by the software technology steering group and the software engineering council. Future enhancements to the program will include both systems engineering and integration and test measures. Some metrics tools such as a language-sensitive line counters are under review. Funding At headquarters, one person's time has been devoted to initiation of the measurement program for the first two years. Tool development has required two person-years of effort. Tool enhancement work is continuing. Division also has given the sites initial funding to cover the cost of entering data into the database. This one-time increment has cost two labor months and $5,000 of computer cost per site. Lessons Learned
• A great deal of effort was required to reach final agreement on crisp definitions. They learned to focus on keeping measurement requirements simple and to target a solid base set. This provided a critical foundation for what is seen as an evolutionary effort.
• Putting together a plan was relatively easy. The real work began when it was time to establish, document, lay out, and set up the measurements themselves. This pro-cess is also evolutionary.
• Pilot installations helped to reveal early problems and provided a testing ground for solutions.
• Involve key management early and get commitment for automated support early. • To build and maintain early support for measurement, the measurement program
staff planned and strived for meaningful data early to demonstrate the productive po-tential of the program.
24 CMU/SEI-91-TR-016

• They learned to limit resistance to measurement by dealing with practitioner con-cerns:
- Treating data on an anonymous basis in response to fears that measurement in-formation would be used to rate practitioners and managers (“You can have my data, but don't single me out”). Data are identified in the database as representing Project A, Project B, etc., not the real project identifier. This system has helped to earn the trust of practitioners.
- A written rationale and explanation of the measurement factors has helped keep a “lean and crisp” program focus. By being able to offer clear responses to questions directed at the reasons for collecting specific information (“What do you want this data for anyway?”) they have been able to keep the program within manageable bounds in both size and cost.
• The transition effort involved identifying likely supporters as targets for first imple-mentations. These implementations all began with a minimal set of measures that division headquarters required of all sites, with each site able to tailor additional metrics for local needs.
• The friendliness of the automated tool was considered a major plus. Also, measurement use and thinking is integrated into the standard division software ed-ucation program, so measurement on the job is not a surprise or disruption. This education effort reinforces the software measurement requirements documented in division practice.
• The measurement program has promoted more competitive bidding as a result of increased understanding of software productivity, quality, and technology.
• Measurement provides visibility into the software engineering process and that sup-ports rapid, dynamic detection and reassessment of development status and provides a basis for process evaluation and improvement.
CMU/SEI-91-TR-016 25
2. One Division Site Distinguishing Characteristics This site has been gathering software measurement data since the mid-1970s, when the group helped pioneer the advances being made in what was then a new field. Current Program Software measurement is part of the cost engineering function, which, in turn, reports to the controller. Among the goals of the current program are:
• Collecting and classifying objectively verifiable properties of software projects with the focus on management controllable items, i.e., software tools, programming practices, and personnel capabilities.
• Creating an ongoing calibration effort for estimation. • Putting decision variables and their values in context.
A major effort lies in calibrating the historical database to several models (SEER, PRICE S, Before You Leap). Measurement is used to create goals. Cost engineerings competitively benchmark the divi-sion’s performance. When competing against the leaders, cost engineers encourage line management to set as its performance goal meeting or exceeding the competitive leader. Data are collected selectively because of resource constraints. In fact, sites gather more in-formation than they send to division headquarters. Major areas of concentration are: input, labor, cost, product, quality. Uses of the data include:
• Supporting proposals as well as government and subcontractor negotiations • Performing cost/benefit analysis, risk analysis, and performance measurement
(estimated time to completion, estimated time at completion) • Planning schedules
Future Plans With division headquarters leading the effort, this division is seeking faster turnaround time, more detailed data, and higher local sponsorship of the program.
26 CMU/SEI-91-TR-016

Lessons Learned
• Stay close to your data. Know what it means, what its limitations are, under what cir-cumstances it was collected.
• Focus on estimation to help the drive toward improvement. Look at cost drivers and at what gives the greatest leverage for improvement.
• The “lean and crisp” rationale is that the information to be gathered is information to be collected anyway; thus, the effort should not place a great strain on the practi-tioner.
• Practitioners can react negatively to the creation and tracking of defect reports be-cause they view such activities as whistle-blowing, and feel that pointing out defects is an audit function instead of an improvement function.
• Initial success and a sense of adding value to software management are both very important.
CMU/SEI-91-TR-016 27
A.6. Case 3 Distinguishing Characteristics This corporation has been a market leader in electronics for many years. It is well known for its high standard of quality for hardware and for its pioneering work in software measurement. Since we visited this organization in the early stages of our investigation, the corporation has taken further great strides in software measurement. It is an organization of, for, and by engineers. Organization This organization is the headquarters corporate engineering staff of a major electronics equipment manufacturer. Among the programs centralized at the corporate level are the corporate engineering department which includes a software process assessment program. This program measures software development processes at product divisions throughout the corporation. The corporation is divided into self-contained product-related sectors. Each sector is composed of several groups or business units that are themselves aggregates of divisions and operations. While the divisional structure vary, the quality manager usually reports directly to the division manager and the productivity manager normally reports directly to the research and development (R&D) manager who, in turn, is subordinate to the division manager.
28 CMU/SEI-91-TR-016
Figure A.3-1: Organizational Structure Metrics History The corporate-level measurement software quality activity began its evolution with the establishment of a software quality council in 1983. It was chartered to provide software engineering training and to operate a software engineering lab. In 1985, a network of productivity managers was established to provide an infrastructure supporting the improvement of software development environments and methods. The work in environments and systems has proceeded in parallel with a corporate quality program started in 1987.
CMU/SEI-91-TR-016 29

Current Program The charter of corporate engineering's process assessment program is to improve software development environments by developing and implementing a software engineering review process. The activities include measuring division software development methods against company and industry norms and performing analyses to identify the corporation's strengths and weaknesses and to determine high-leverage areas for improvement across divisions. Analysis activities consider:
• Human resource variables • Project management and control • Programming environments • Tools and methodologies • Defect prevention and removal • Physical environments • Measurement • Maintenance
Corporate process assessments are performed approximately two times per month by invitation of the R&D managers. Participation is not required, and comparisons with group or company-wide measures are the prerogative of the division. No "corporate standard" has been established. The basic goals are to establish a division baseline, identify strengths and weaknesses, and provide follow-up measures to show trends over time. When a request for analysis is received by the lab, the staff assigns it a priority and incorpo-rates it into the evaluation schedule. The initial assessment takes about a week, with two days of interviews (data gathering), two days of initial analysis, and a feedback session on the fifth day. Final analysis and preparation of the written report takes another 6-8 weeks. A second assessment (again by invitation) may be made 18-24 months later to measure again and report on changes. Due to the fluid nature of the corporation's management structure, situations can change radically in such a time frame. Software assessment program results reported to date include a 95% rate of requests for follow-up analysis and 75% of all groups use the analysis data for planning. These results are used by other function areas to perform corporate-wide trend analysis, support internal market research, and promote best practices. Measurement usage in the divisions has been on the rise in the past three years. This trend supports the growing awareness of, and belief in the importance of process improvement. Software measurement of several factors is commonly performed:
30 CMU/SEI-91-TR-016

Factor
Aspect Measured
Code Source size Quality/Reliability Defect quantities Defect severities Duplicate reports for same defect Efficiency of testing in defect removal User Satisfaction User defect reports User requests for enhancement In addition to the above, approximately half of the projects evaluated also tracked reliability and quality properties such as defect origins, defect distributions through code, and invalid defect reports: Today, most projects use formal tools to help track development progress. The defect tracking system, for example, is made up of two internal tools, one of which tracks pre-release defects found in the lab. The other tracks post-release defects after delivery to the customer. A survey of 201 project managers' satisfaction with the current software measurement methods followed a roughly bell-shaped distribution with about 20% judging the effort as good/excellent, 40% as adequate, and 40% as poor or not used. Measures in addition to those defined at the corporate level are collected at individual sites. Such customization is encouraged by corporate engineering. Many are collected by inter-nally developed or commercially available tools; some still require manual input. Some of the site-specific measures are:
• McCabe complexity: A preliminary study has indicated that a value of 15 should be the signal flag for potential problems. Some labs have shown no correlation between use of this complexity measure and problems found in individual modules.
• Turmoil: The rate of change of source lines of code. This is used to help determine high risk areas as well as readiness for release.
• DeMarco quality factor • Slip rates: A scheduling aid which seeks to mitigate the effect of conflicting results
produced by the many different schedule estimation tools used in the corporation (e.g., SoftCost and COCOMO). Different environments and weighting factors make comparisons difficult when different tools are used.
• Inspections data such as the number of defects found and the rate of discovery.
CMU/SEI-91-TR-016 31

One product group has begun a software quality effort to unify the existing, disparate quality initiatives among the group's divisions. The nature of the group (it is one where software development is on a par with hardware in terms of importance) makes this larger scale effort viable. Thus, in late 1989 a group-wide productivity, methods, and education effort was initiated to enhance the group's competitive advantage. The initial focus has been to plan for the effort by establishing a baseline to show where the group stands in relation to the rest of the corporation and to industry. All the labs in the group have been through the first corporate engineering software process assessment. Much progress has been made in defining standard metrics for the group and in getting a group-wide metrics program going. The group decided to start with a limited set of metrics, which is partly a reflection of the difficulty in getting agreement on a common measure of productivity. To establish a baseline and to help plan for improvement, the group is going through a proposal review process for more precise metrics. Of 10 metrics originally proposed, the group is working on the definition of 5 that have a strong quality orientation (they found defining straight productivity metrics difficult). Those five candidates are: 1. Cumulative defect density during the first year post-release. 2. Pre-release defect density for major software phases, and pre-release defect density
for each module at integration. 3. Error detection effectiveness, defined as pre-release defects divided by the total
number of defects found pre-release. 4. Open critical and serious defects from valid problem reports. 5. Number of hotsites per time to resolve problems (a “hotsite” is a situation in which a
customer is dissatisfied with a field representative's handling of a problem and the lab is called in to resolve the issue).
Future Plans As noted in the introduction, the measurement program at this organization continues to evolve. The future plans when we visited early on in our study are now becoming reality. The four-year effort for the definition and application of measures targeted for use at particu-lar management levels has now been implemented. The program as it now exists identifies measures appropriate for three management levels: High Level for group managers and above responsible for multiple divisions of 3,000 to 10,000 employees; Middle Level for division managers and their R&D managers; and Low Level for project managers on software development projects. While some measures are specific for particular levels of management, others are used by multiple levels with more detail at the lower levels (e.g., middle level management might track size vs. effort for a project while lower level management would track size vs. effort for a module). The organization's measurement program continues to evolve. The long-term vision projects software metrics which not only control software projects but reflect true understanding of the process of software development.
32 CMU/SEI-91-TR-016
Funding Corporate engineering is funded from overhead. Routine measurement is accepted as a cost of doing business for the product divisions.
CMU/SEI-91-TR-016 33
Lessons Learned
• Measurement is an evolutionary process tailored to the corporation's culture. • Resistance has been encountered to collecting non-simple measures and to drawing
conclusions from them. It is important that the use of the measures is at least as visible as the collection of those measures.
• Standardization of the metrics effort, including establishing a common set of enactable measures in one format, presents both technical and transitional challenges.
• The high degree of autonomy granted the divisions creates some potential for the creation of highly individualized programs. One goal of the corporate management program is to bring some standardization to the process so that the benefits of the measurement program can be more fully realized. The ability to make comparisons across product lines, groups and process differences would pay important dividends for the corporation.
• Although a great deal is being done across the corporation, the efforts are sometimes disjoint, and comparisons and aggregate analyses are difficulty. Management understanding of software efforts is not as the same level as that for hardware efforts.
• Three factors critical to the success of the corporate software assessment program are:
- The solid foundation of experience in software measurement supported by a set of common terms and standardized measures and a corporate-wide awareness of software measurement and what its use can accomplish.
- An organizational infrastructure which supports software measurement. - Recognition that measures must be geared to different levels of management
information needs.
34 CMU/SEI-91-TR-016

A.7. Case 4 Distinguishing Characteristics This organization has taken advantage of its leadership vision and its unique access to government, academic, and industrial resources to advance the state of both the art and the practice of measurement technology. Organization This is the software systems development branch at one site of a large government agency. The agency is responsible for time-critical flight dynamics computations for earth-orbiting unmanned space flight. The branch itself is part of a larger cooperative effort among the government agency and corporate and academic organizations created to investigate the effectiveness of software engineering technologies applied to the development of software for the agency's applica-tions. The organization has 30-35 government programmers and 150-250 contractor programmers. Metrics History The organization has been collecting metrics for 14 years. The purpose of the measurement effort has been to assess the effects of the various methods, tools, and models on the software development process as applied in the organization's environment. The goal is to identify and apply the best development practices. In the beginning, the program had some rough edges; for example, a major problem was the inability to deliver feedback as soon as promised. Gradually, the credibility of the effort was built up, especially the application to management decision-making; regrettably, software developers still do not see much professional benefit. Even so, the acceptance of the program inside the branch has allowed a clean, neat, and accurate process for data collec-tion to evolve. Those interviewed stated that software development today is done very well relative to a number of years ago, but that there is still a long way to go. They had started by trying measurement in a big way. As the effort matured and was used, the non-productive measures were dropped and others were added. The initial motivation was to support a research effort to experiment with evolving tech-nologies to try to identify the most effective technique(s) for a particular project, the goal being to develop a set of standards and practices. The branch's major charter is to develop software, not conduct or sponsor research, but funding was obtained for measurement be-cause of its direct applicability to development. Much of the early metrics collection effort was trimmed due to the noise that swamps the important issues. For example, effort was collected so precisely that its (local) variations could have masked long-term trends.
CMU/SEI-91-TR-016 35

36 CMU/SEI-91-TR-016

Current Program Now the focus is no longer on rapid feedback of information to practitioners (a long-time goal that proved impossible to achieve), but rather on incrementally improving the development process by providing measurement information to the appropriate level of software management. Opportunities are being sought for experimental projects and language-specific technical testing. The branch collects about half as much data today as it did eight years ago. Too much data without strong drivers as to the reasons for collecting them camouflaged the real issues (which is also a “lesson learned”). New software practitioners receive a one-hour presentation on how to record data on forms. Program librarians get involved as well because they extract line counts and phase comple-tion dates. Raw data from recording forms are keyed by data technicians. Future Plans The original motivation for the measurement effort–to support research and experiments with evolving technologies to identify effective techniques for particular environments–still exists today. The process continues to evolve with the deletion and addition of particular measures. As non-productive measures are deleted from the program, paradigms such as goal/question/metric are used to identify candidate measures for new studies. Funding Direct measurement is funded as a tax on programs. Development of the metrics process, tools, and methods was funded by the agency's research element. The resources required to specify, collect, and analyze measurement are:
• The collection cost itself has now been minimized. The cost of data collection is ap-proximately 1%-2% of the cost of development.
• Data processing (maintain the database, assure the quality of the data, etc.) costs 6%-9% of the cost of development.
• Analysis (interpretation, reporting, and packaging; developing new standards, poli-cies, and overall research) - If less than 10% of development cost the metrics effort may be wasted; the cost can go as high as 20%.
• Total cost is on the order of 20%-30% of development costs. The costs of the program may be considered significant by some, yet the return on the measurement investment has been many more times the expense; that is, the savings en-abled through measurement have far exceeded measurement program costs. Enumeration of all the advances in software development made possible through this organization's years of measurement experience is beyond the scope of this survey.
CMU/SEI-91-TR-016 37

The work performed by this organization has contributed to the technical growth of the soft-ware engineering discipline. Its efforts led to the creation of a complete set of policies and guidelines for software development and management for the organization, a practice now common among software development organizations. The organization's measurement efforts helped establish the value of code reviews, another now common practice, in their software development environment. Other benefits include identification of specific testing methods, design methods, and “numerous other” software engineering methodologies that support their development efforts. Not only has measurement been important in establishing beneficial practices for software development in general, but it has also helped tailor local practices to take advantage of the technologies most appropriate for local applications, environments, and processes. For example, independent validation and verification was dropped as a universal tool when it was shown through measurement to be generally not cost effective in this organization's development environment. Even individual process concerns have benefitted from measurement. When error analysis indicated an excessive number of interface errors, an interface checker tool was obtained and measures later provided feedback that proved the worth of the tool. Lessons Learned
• Management has always been supportive of measurement proposals that have a solid engineering foundation; however, it has proven difficult to get busy managers to operate a measurement program for themselves. Higher level managers have grown more supportive of measurement lately with the attention and popularity of Total Quality Management, process improvement, etc.
• It has taken considerable time to convince practitioners that there is a need and use for data collection. New programmers look on it as just “part of the job,” and are still not completely convinced that measurement helps them.
• For the first 10 years, those performing measurement promised that practitioners would benefit from the feedback they were to receive, but regrettably, even today, there is still too great a time delay in feeding back results to the source of the data.
• Even though feeding data back to the developer is slow, management use of the data in “real time” has proven extremely valuable in the planning, monitoring, assessment, and control of ongoing projects.
• As a result, managers have become convinced that measurement is a good thing. The payback may be from costs avoided, but the major savings is from doing things better.
• Measurement efforts have contributed to software development in five important ways. They:
1. Provide an important management planning aid. 2. Support process understanding. 3. Support development environment understanding. 4. Provide rationale for adopting a standard development approach.
38 CMU/SEI-91-TR-016
5. Provide discipline to project development. • Unfortunately, project managers in other branches still wait for the software devel-
opment branch to do the measurement job for them. It is just now getting to the point where software project managers in other branches are beginning to handle their own measurement needs.
• Few practitioners are self-motivated to the point where they see a professional benefit in a metrics program. There was early resistance by a few, and significant re-luctance on the part of many.
It is difficult for practitioners to organize goals for themselves. They need management to provide the leadership and the overall picture, and then they need someone outside their realm to analyze their relative success at achieving a goal. Practitioners need:
• Measures defined (directed to a goal) • Processes mandated (what is to be measured) • Feedback on performance
There are two major problems: the definition of what the goal is (proper goals imply contin-uous process improvement), and the timeliness of the feedback. There is a lot of support for metrics at the site as long as the surveyed branch does the work. What is needed is a simple way to transfer the program so others can apply it. The branch is encouraged about the possibilities for transfer, but:
- Measurement has to be done (it has positive impact on the way work is done). - The transfer process will be long and gradual. - There will not be immediate payback. • An early concern was the place of software measurement in personnel assessments.
People were not convinced that metrics were not focused on individuals, so the data are “sanitized” i.e., no names or identifiers of people or projects are presented.
• The noise in data and sheer volume will swamp any large effort to collect detailed information. The greatest payback comes from the data that are cheapest to collect, i.e., data that must be collected anyway for other purposes.
• A simple start-up guide is the best way to get new programs underway. Managers still need a cookbook approach.
• There is another set of concerns related to measuring contractors: - Who in the government or among the competition is going to see the data and will
that bias chances for other contracts? One attempt to monitor a metrics effort at one contractor resulted in even the limited data drying up completely as a result of such fears.
- If a corporation gathers metrics data for its own internal use, what prevents a gov-ernment program office from saying, “OK, where's the metrics data?” Is it better not to collect data in the first place?
CMU/SEI-91-TR-016 39

• One of the big surprises was the complexity of the data handling, how difficult it was to ensure valid data and to verify them. This is even true today with a reduced metrics set.
40 CMU/SEI-91-TR-016

A.8. Case 5 Distinguishing Characteristics This organization produces mission-critical software that functions in the field without defects. Its measurement program is an important factor in providing support for the tightly controlled development and repair processes required to produce software of such pre-eminent quality. High quality is a conspicuous element of the corporate culture. What follows is the report of a senior systems engineer describing his observations of the nearly two decades of progress whereby software development evolved from “cowboy” programmers and punched cards to a team-oriented, systems-driven application of state of the art technology to address some of today's more demanding software problems. Organization We interviewed a group within a division of a large computer manufacturing and software development company. The division is, and has been, devoted to developing and maintaining software with extremely high requirements for safety and reliability. This particular group within the division has 325 people working on software, which is down somewhat from a program peak of 420 people. Metrics History The growth in the size and complexity of the software programs developed by this group in the early 1970s forced a change in the way systems and system software were to be devel-oped. The old methods that had worked well enough on small, relatively straightforward projects were woefully inadequate for rapidly expanding and more demanding development efforts. For example, just one piece of a project wound up running to 60-80 KLOC when the initial forecast for the entire package had been only 25 KLOC. Massive changes to the original specifications created the need for new development processes that could deal with pro-grams with orders of magnitude greater size and complexity. The changing nature of the work and how it was to be performed elevated the importance of data collection to support forecasts for new products. Forecasting was not so difficult a problem when products were small, but it became one when developers began to encounter large blocks of requirements changes on larger, more complex programs. The assessment of issues related to such changes led to the recognition of two types of cost. The first, function-driven, was the cost recognized by the “old” methods and was related to the functionality of proposed systems based on the level of understanding of the re-quirements at the time of contract award. With programs experiencing hundreds and even thousands of changes between the requirements baseline and initial operation, there arose a need to deal with such change. This required a configuration management system where each change could be assessed and tracked by the resources forecasted and consumed.
CMU/SEI-91-TR-016 41

The second cost factor is a schedule-driven one resulting from maintaining the development staff while other, non-development functions (e.g., end-user testing) are being performed as part of the product life-cycle. The overhead due to the stretching out of schedules must be added to the cost of a project. It took some three years of analysis for the organization to discover the dichotomy of function- and time-driven costs. This was as much a revelation to this contractor as it was to their major customer. To make this determination, they had to tie costing and configuration management accounting together to get the consistency of data required to reveal the true impact of change on development costs. Recognition of these cost factors forced a redefinition of the accounting system. In the old days, the size of the product in lines of code and in number of modules was dealt with as an elapsed time problem in terms of milestone achievement and resources against a schedule. Now, cost-oriented change accounting systems look at where the cost impacts are and at what areas of development are affected the most. The group had other issues to deal with in addition to change management and growth in size and complexity. Meeting rigid product delivery dates replaced product definition as the cost driver. To accommodate this new constraint, the organization began to develop soft-ware in incremental releases. Partitioning the increments facilitated (a) more consistent ef-fort and staff size, and (b) made it possible to get intellectual control over the various inter-faces that modern systems developments must deal with, i.e., operating systems, service applications, user interface management systems, etc. If the evolving program management needs had not driven the move to a series of releases, the complexity of dealing with multiple architectures (function, human-computer interface, operating system, etc.) would have forced the change in process anyway. Even so, the first major development effort using the process saw the initial plan for nine releases expand to 17 by the time the five year development project was completed. Now, the estimation of costs attributable to function is fairly well established and schedule-driven costs have been running about six times that of the function-driven costs. The exis-tence and the size of this relation would not have become visible without a means for measuring and tracking costs that is tied to the configuration management system. In the early 1970s, costing plans revealed great differences in the estimated cost of changes to products. This led to an effort to describe the development process in place. The focus was on how work was performed and on how effort was related to cost, so that bid prices could be made early regarding individual changes. When the transition was made to incremental product releases, a follow-on costing effort was made to separate the scheduling and development processes of the multiple, parallel efforts. Now schedules are revisited at a high level every six months and are reconciled based on the product, cost, and schedule. On a lower, project level, schedules are tracked monthly with weekly tracking at even lower management levels. Cost and product measures are also tracked at the project and sub-project level. This multi-level effort allows for joint decision making with key customers. In fact, the up-front marketing of measurement efforts and the results achieved by measurement application have contributed to a positive pro-ducer/customer relationship.
42 CMU/SEI-91-TR-016

A third aspect in addition to cost and schedule is quality. Since it is possible to meet both cost and schedule forecasts without delivering a quality product, there was a need to de-termine how to get a view of quality. The answer is in tracking defect reports (DRs) and change requests (CRs). DRs were already tracked by the configuration management system (no DRs are written before unit test since the cost of verification and processing is very expensive) and differentiated from CRs. The need was to track both kinds of changes in a consistent manner. Collecting large volumes of data presents new problems, however. Whereas cost concerns are limited to collecting and tracking expenditure totals, people want to know everything about quality. Something had to be done to help determine the areas of greatest return when tracking quality. If too much information is collected, it becomes difficult to distill out the lessons. Fortunately, it turned out that the necessary data was being collected all along. The need was not to collect more data, but to learn how to use the existing data in new ways. The first step was to track error counts. At the outset, there was a reluctance to track errors that occurred early in the life-cycle. Programmers basically refused to do it (during inspec-tions, unit tests, etc.). In the early, “campfire” days, programmers interfaced often, but they did not call such meetings reviews, walk-throughs, or anything - they were just informal gatherings to compare notes. In 1973, inspections were formalized, and, to deal with the fear of ratings, managers were banned from the sessions that were convened by formal moderators using a defined pro-cess. Ultimately, the message was accepted that finding errors early was good, but still there was a tendency to steer away from metrics. In 1977-78, the division started collecting information on DRs (they had been counted before in the configuration management system, but the information was not used as an analytical decision-making tool until 1978). Even with a redesigned development process and the means to track cost, schedule, and quality factors, the group found that there was still more to be done. The added visibility of product and process issues made possible through measurement unveiled still another surprise: processes go unstable in the transition from development to operation and main-tenance (O&M). The processes that worked smoothly in the development environment were too long and too slow for the operational need for rapid response in order to minimize mission critical downtime. The shift from software development alone to development and production re-quired a shift in process. This was the big gut-wrench for the organization in the early 1980s – learning to change their mode of operation while adhering to a schedule and yet still maintaining quality. Forcing O&M to operate under a process designed for development caused productivity to fall and error rates to rise. “Anyone who makes that transition is going to lose it.” Compounding the problem was the erosion of the project team's skill base as developers moved on to other projects and those in O&M had to develop new expertise. Once the group had “been to the mountain” (error rates down, productivity up) it would not accept lower standards. The effort began to determine what it would take to achieve their development performance levels.
CMU/SEI-91-TR-016 43

The production orientation part of O&M meant short bursts of program development in small increments and resilience to change due to the emphasis on error detection and correction. The need to rapidly produce operational increments mandated a change in environment, that forced a change in process, that, in turn, necessitated a change in process models. The new model was established, predictions were made, the changes were incorporated, and then data collection made the process visible. This led to an improvement both in the O&M process and in the software produced. Even with all the attention paid to downstream details of the software life-cycle, the group also wanted to improve its efforts on the front end, in particular in the area of requirements analysis. The result was that they added 40% to development estimates for the early life-cycle activities: 20% for a requirements analysis group of experts to minimize the number of errors that get into the system (including a help desk to make sure DRs are valid), with the balance to increase inspection resources and the measurement effort to track inspection results. In essence, resources were shifted from other parts of the process (mostly from performance testing) to inspections, keeping the total project resources about the same. The customer was informed of this change in advance and provided support for the effort. Current Program Measurement covers the “Big 4” process factors (product, schedule, cost, and quality) as the minimum set. The organization's method of assessment is to start with the product and work toward establishing a schedule; then estimate cost and reconcile with the schedule; then estimate quality and reconcile with cost; and, through cost, reconcile with the schedule. Coverage of the four factors must allow for project-specific concerns, the organization's cur-rent state of knowledge regarding those concerns, and the organization's defined processes. The biggest challenge is understanding the interrelationships among the four factors and the necessary trade-offs that must be made to achieve project goals. Understanding these interrelationships and recognizing the separation of costs (into function- and schedule-related) are marks of a mature process. Fundamental to the use of measurement is understanding what data must be collected. This organization identifies three classes: data that are used on a regular basis to provide insight into the software process and product status, data that might be needed to provide additional insight into areas of concern flagged by the standard measurement process, and data that can help explain how a process or product problem slipped through the measurement process without being flagged. To collect enough data without swamping the system is yet another trade-off issue. The measurement program now in use is a result of the organization's own experience and its assessments of other programs. Much of what they are doing is a style of statistical pro-cess control based on a sampling of the data they collect (they almost never look at all of the real data). They take the samples and compare them with model-generated bounds. Key features of the measurement effort revolve around managing and controlling software processes, changes, and errors. The focus on process and models (noted in the History section) is reflected by the influence of the measurement effort in a number of other areas. Change and the effect of change on
44 CMU/SEI-91-TR-016

the project can be predicted and assessed because the configuration management system is tied to cost accounting so that the various components of cost can be forecasted and tracked. The configuration management system is custom-built and provides tight controls on baselined products to the extent that code cannot be modified without being tied to an approved DR or CR. Measurement insight and configuration control are both necessary to manage software processes. For instance, tracking effort and managing to a schedule has revealed that the required O&M staff level for critical skills is 60% of that for the development phase (for this group working on this application in this environment). O&M staffing demonstrates a Rayleigh distributed front-end and a slower fall off than that of straight development. Only after the inflection point is passed is it possible for O&M to take on new work for the project. Handling errors is another area where measurement has proven hypotheses regarding methods and processes. DR action involves everybody on the project. It is expensive, and management has to really want defect data to start collecting it early in the life-cycle. One focus for the organization is the formal inspection process, which has received high visibility due to its very high return on investment. As a result of the insight provided by measure-ment, the formal inspection process was tuned and formalized. Now, 85-90% of the errors found are discovered during formal inspections and unit test. Due to the relative lack of static errors, integration testing can be more focused on substantive problems. Our source viewed these surrounding factors as placing this organization “in a different ball park” from most other software operations. He said that their cost to develop code is lower, as are their back-end maintenance costs, and that the organization’s quality and attendant customer satisfaction is higher. Not only have these changes contributed to a higher quality product, the shift in resources from the old model to the new has allowed the improvements to take place without adding to the costs for development and test, while the maintenance bill has dropped 30%. Future Plans An important issue is strategic planning. The site management thought it knew how to per-form strategic planning until a site study was conducted and could not identify organiza-tional/structural relationships. They then built a model to represent the structure with the goal of building a dynamic tool to model and evaluate the organization’s effectiveness and the quality of its products. There are no process measures in the model, just product or in-terim measures. There is a lot of emphasis on measures used to perform the development and maintenance work. Now they are building an expert system to score an organization based on the model of processes used and how the model is applied. Other future possibilities include:
• Examining software reliability forecasting and comparing results with Musa et al. • Making risk analysis more quantitative. • Improving resource assessment, i.e., factors such as skills, tools, size, and central
processing unit capability and their effects on cost, schedule, and quality. • Hypothesizing about a possible Level 6 and beyond of the five-level SEI software
process maturity model.
CMU/SEI-91-TR-016 45

The success of the measurement efforts to date and the visions of possibilities for the future have made it difficult to keep the appetite for data in check. The group is constantly re-evaluating what the next important piece of data needs to be. Funding When asked how much the measurement effort cost, the response was, “One cannot man-age without it. Though people try, they just can't afford not to do it. Most of the data needed should be collected for other reasons anyway, like configuration management data, inspec-tion data, etc. Over the long haul it's cheaper to have the data than not to have it.” It results in meeting schedule deadlines by finding problems in time to do something about them, that is, fixing them early, before they get out of control. “The point is that this data has to be collected anyway for people to do their jobs. One may have to tailor the data for measurement purposes, or one may have to help format data, but neither has a great impact on cost. There is a lot of data from people in the project office, from configuration management and inspection data, and from people already in the loop. There is a lot of interconnection here. Most of the data comes out of tools that have to be used anyway.” Lessons Learned
• The biggest surprise was in understanding the separation of the types of cost (schedule-driven vs. function-driven). In 1976, neither this contractor nor their customer knew of any such separation. To that point, software pieces were broken up and dealt with on a small scale by small teams–“campfire” problems. It was easy to establish intellectual and management control because the products were small and all under the same second line manager.
• The second shock was that DRs have followed a Rayleigh distribution, plus or minus 10%. This allows flags to be raised when a swing in the data is substantial in either a positive or negative direction.
• “It doesn't take a lot of data to tell us a heck of a lot. It's the time element that tells the story–it ties errors to schedules.”
• The biggest measurement payoff is the improvement in the process, and this was shown early in the program. Measurement showed the need to spend more time on formal re-quirements, design, and code inspections, to use more people during development, and to add more testers.
• The place to insert technology is into a stable process base. Then you can evaluate the effects of the change.
• One cannot “jump start” a culture by mixing process veterans with new people. A mixed crew will force a backing off from cost and quality models, but it will not take the five years to establish a project culture that it took this group since the target model and some expertise are already institutionalized. “For a whole new crew of people, we would still be looking at a five year self-internalization process.” Where a new project falls in the 2-5 year timeline is a function of a number of factors, including the experience carried over from previous projects and processes, and the magnitude of the new undertaking.
46 CMU/SEI-91-TR-016
• The group's application domain is complicated and its constraints are demanding. The necessarily disciplined structure can crush the great workers while it stretches those of lesser abilities because the interfaces between the pieces have to be maintained. The key is finding good people who are creative within bounds. The tough part is preserving the process with those who remain while at the same time orienting the new people as they join the group.
• What was once a mystery is now much more visible due to: establishment of a cost accounting system, creation of a state-of-the-art configuration management system, and setting up a schedule impact assessment system for incremental releases.
CMU/SEI-91-TR-016 47

A.9. Case 6 Distinguishing Characteristics This large project is on time and within budget, even though there have been many user changes. The overall software architecture, project management approach, and life-cycle definition were completed before work on the project started. Risk is managed explicitly; the riskiest aspects are identified and explored first. Organization This is a major DoD project in the defense systems arm of a major aerospace firm. At award it was estimated that the project would take 38 months to develop approximately 325,000 source lines of Ada. About 75 professionals are assigned to the project. Since the project was primarily software development, a deputy program manager was designated to oversee the software effort. We spoke with the chief software engineer (indicated by a darker box below). Before prelim-inary design review (PDR), the organization structure was:
48 CMU/SEI-91-TR-016

Figure A.6-1: Organizational Structure before PDR After PDR the structure is:
Organization
Figure A.6-2: Organizational Structure after PDR
CMU/SEI-91-TR-016 49

Metrics History Measurement began as a goal of an internal research and development (IRAD) project that sought a more rational software development life-cycle, one driven by project-specific risks (i.e., the spiral model). This 3-year, 15 labor-year effort developed a software life-cycle definition and process model that included diverse measurements as integral project control and management feedback mechanisms. The IRAD project also developed the software architecture approach and some of the reusable Ada components that the major project is using. Current Program All measurements are collected with very little direct practitioner involvement. Labor hours are collected by the time accounting system; the project work breakdown structure (WBS) is coded on the time cards so that practitioners can account for their labor by WBS item. Ada is used as the program design language. A special kind of comment statement indicates how many source lines of Ada this design element will take. As the design is coded, the correspondence between the estimate and actual can be tracked. The chief engineer and his staff took about two labor months to define the metrics report formats and generation capability and then about six labor months to develop data collection tools. To actually collect and display the metrics, a technician spends about half a labor month per month performing data entry, and then the program manager, deputy program manager and the chief engineer spend an afternoon analyzing the data. Six sub project man-agers also analyze the reports prior to higher level review. The managers each spend about 1/2 day for their review and analysis of their inputs to the reports. The project uses an incremental build approach, so multiple builds are in progress at any one reporting instant.
50 CMU/SEI-91-TR-016

The following areas are reported on:
• Staffing profile, planned vs. actual • Personnel attrition and addition history • Size of software, planned vs. actual • Size of tool-generated reused and newly developed software • Complexity • Development progress summary (build content, calendar progress against mile-
stones, percent developed, percent tested, number of software development folders documented), planned vs. actual
• Detailed development progress for each CSCI and build, planned vs. actual • Software requirement verification summary planned vs. actual • Software problem report status: total; now open or closed; by age; and by subsystem • Software architecture stability • Software reliability testing progress • Development and target computer resource utilization • Program volatility • Incremental release content
The measures are reviewed monthly, and they are presented in total, in a written monthly report. This project is, and has been, on schedule despite the fact that requirements have changed moderately. Future Plans The firm is trying to attract new business that will use this life-cycle model and its concomi-tant measurement elements. The firm is also contemplating additional automation, especially that of integrating the col-lected data into printed reports. An additional set of measures is being introduced to evaluate ease of change as an indicator of rework and maintenance expense. It will measure ease of change by precise definitions of modularity, changeability, and maintainability. Funding The software life-cycle approach, its measurement emphasis, and the overall software architecture development was funded as internal research and development. The architectural specifics and the metrics definition, implementation, and operation were funded by the project.
CMU/SEI-91-TR-016 51
Lessons Learned
• Measurement has provided feedback in time for an early response to development problems or changes in project requirements. These changes have included modi-fying the project plan.
• Measurement has been well-accepted by practitioners and sub project managers. The measurement system has been used to surface problems to management in a non-attributive way, and practitioners have used measurement information to support their arguments for certain process changes and for communicating progress or issues. Measurement information allows for meaningful dialogue regarding management decisions so that all affected parties understand the rationale for such decisions.
• Measurement has been an effective, uniform way to objectively characterize and explain the benefits of the new life-cycle, especially to the government program office and its support staff. The increased uniformity and objectivity of communication has been reflected in increased team morale, re-work avoidance, and improved customer openness, trust, and rapport.
• The key success factor was getting people to believe in measurement. A few cham-pions were enough in this organization to get things moving.
• In the future, measurement might be done with two sets: a standard set that all projects use, plus a set tailored to the needs of a specific project.
• The project provided tools to minimize the impact of the measurement effort on the day-to-day work. One critical need was the requirement for a standard automatic line counter which recognized the syntax of Ada and its use as a design language.
• Customer program office support was critical to the measurement effort. They did not mandate specific metrics, but permitted the contractor to choose the most meaningful set and let it evolve over time.
• Their attitude: if we err, just let them know and they will try to fix it. The worst is not knowing that one has erred.
• Metrics can help explain what is going on in a software project. Exactness of the the data is not critical for such insight; exposing relative trends can be of great benefit when trying to understand and evaluate project related issues.
• To avoid the Babel effect of a plethora of measures, use a core set of measures with others added where the situation merits.
• The practitioners have been involved in the collection of about half of the metrics information. The rest was automatically and transparently derived.
• Metrics enhance the mechanism for accountability. Since metrics are objective and consistent, performance comparability across the project is enhanced. This is easy to accept by the better performing project groups, but hard to accept by those that are in trouble.
• Project review discipline and standards are necessary to ensure objectivity and consistency.
52 CMU/SEI-91-TR-016

A.10. Case 7 Distinguishing Characteristics This organization has steadily increased its software process maturity. Improvement is part of the division's “corporate culture.” Organization This division is one of several in a large aerospace and defense firm that concentrates on real-time, mission-critical, embedded computer systems for the Department of Defense and related sponsors. It is a matrix organization with software professionals supplied to projects operated by other divisions. Negotiations with other divisions for resources are conducted at the senior management level. The division has about 500 software practitioners now (down from 1,000 three years ago before the division was split in two). An average software development effort requires about 30 software professionals working under an software project leader to produce a 200 KLOC program. Corporate software initiatives are undertaken by interdisciplinary groups that look at corpo-rate-wide opportunities for improvement. Major goals at present include centralizing cost es-timation and earning a higher SEI software process maturity level corporation-wide. The maturity level itself is a metric and a goal in the corporation’s continuous measurable im-provement program. While the division has a strong rating based on the SEI maturity level yardstick and two SEI-assisted assessments, other divisions in the corporation have not yet achieved the same level. Metrics History The division has been collecting metrics since 1972. The historical file of project data is mostly on paper. There has been an effort toward automating more of the data collection process as the group assesses what data are being collected and why. In 1978, the measurement program was codified in division-wide standards for project reporting as a result of their experience during the first five years of their metrics effort. Although project data reporting standards are continuously improved through individual improvement suggestions, in 1985, the division re-evaluated their project data collection standards and further refined them through a formal review process. They are now undergoing a third major evaluation of the standards as part of a quantitative process management initiative. Recent emphasis has been on error, productivity, and complexity metrics. The division started working with quality indicators as part of a statistical process control ef-fort five years ago. They were not certain where to focus their efforts, so they took a shotgun approach: each department did what seemed reasonable. The focus was on errors, but the results were inconclusive due to differing definitions. This situation inspired a move to standardize the program so that the usefulness of the error data—limited due to the relatively
CMU/SEI-91-TR-016 53

small number of data points in each project—could be enhanced by a division-wide database. Historically, senior management analyzed measurement data to ascertain project health. For the first 15 years, the reports went to the division manager. In the last five years, the reports have been going to the lab managers, and the division manager conducts project reviews quarterly. The division-sponsored Software Quality and Productivity Program studies tools, methods, and other technologies for applicability to division projects. As a result of this program, the division has been able to reduce its bidding rate (cost to perform a given amount of work) by 15% three times over the past 10 years (approximately a 40% drop overall). As is typical of a matrixed organization, there are barriers among the hardware, software, and systems engineering staffs. Breaking down those barriers—a long-term endeavor not directly related to measurement–helped create a more cooperative environment, which encouraged resolution of process problems. Handling a rising volume of project changes resulting from increasingly complex software projects and from maintaining operational programs became a major problem in the 1970s. They have been so successful in addressing process issues that they can handle the high volume of follow-on business they are asked to perform. Despite the inevitable changes that come with such work, the division still performs to a cost performance index of greater than 0.97 (i.e., within 3 % of the planned cost to develop the required software functionality). Current Program The current measurement efforts are based on the results of a 1990 SEI-assisted assessment and are directed toward improving and consolidating the division-wide program. An effort is underway to review the metrics program from the standpoint of how it supports business objectives and to automate project data collection to help reduce the drudgery required to support a centralized database. A central service for sharing resources has been established to provide support for the data collection effort. This facility was established partly due to problems with data collectors frustrated by the amount of work needed to gather all the required data. The practices and procedures for software development have been written from the stand-point of and for the software project leader, the person responsible for software development (there are 20-25 software project leaders in the division). The division also has standards for the 20 monthly reports. The division requires measurement data to manage projects. The software project leaders have accepted the value of measurement and accept the practice as a way of doing business. Measurement helps provide them with the foundation for making decisions based on solid information. As part of the measurement effort, division practice calls for project management presentations to let developers know at least in general what the status of a project is and how measurement is used to provide that visibility. The general acceptance of measurement by software practitioners “in the trenches” is very good when they are shown why it is being done. There is a distinct culture in the division that
54 CMU/SEI-91-TR-016
supports improvement efforts, and the continuous measurable improvement program was created to formalize this goal of improvement and to focus software project leader efforts to sustain process improvement. Maintaining the improvement mind-set as a group culture is more difficult with software engineers who are now widely dispersed geographically throughout the division. The review and upgrade of a common set software development practices is one mechanism to reinforce that culture. “Culture” has been the biggest return on the process improvement investment because it encouraged the team feeling of mutual support and direction that is the foundation for any improvement effort. Having spent so many years (about 20) working toward achieving a culture focused on continuous improvement, they do not see many surprises anymore. “We are in a continual process of change. It's part of the job. Sometimes we don't understand things, so we go find out why. Usually it's due to little glitches. A well-run business doesn't have big surprises.” One manager was asked what he would change about the development process. He responded, “Nothing. I have everything under control. Everything I would change is being changed.” Funding Funding for project measurement collection, analysis, and reporting is included in project bids as a normal part of the effort of the software project leader. Since a software project leader is required for all software projects, and since data collection and reporting is a requirement of the software project leader's job, then measurement is always applied in all software projects. The organization-wide quantitative process management program and database cost is approximately one and one-half people carried on overhead as a general service available to all projects in the division and is charged to the customer as overhead. Assistant program managers spend about 10-15 hours per month producing the monthly re-ports (this is just the time taken to update the previous report; the initial report takes longer). Assistant program managers also spent another 10-15 hours per month working with mea-surement. The finance department spends about five hours on the earned value report. Lab and project managers and 2-3 others spend a couple of hours reviewing the reports. 1 1/2 people are working on the quantitative division-wide process management service and are divided among all the projects. Senior managers review all projects (using a report subset) every month. Future Plans A look at productivity is one of the returns of the data collection effort, but the organization does not view productivity as an absolute measure nor as the ultimate goal, but rather, the effect of continuous process improvement. Improving the organization's process maturity reduces the risk of performing to planned cost and schedule (they use the cost performance indicator as their primary risk measure). Other future goals include using measurement to assess the effect of changes to process. “It's a good thing to do; we just haven't done a complete job of it.” The work done to date has been with models, not with collecting data. They have been using surveys to indicate trends.
CMU/SEI-91-TR-016 55
As the continuous measurable improvement initiative is gaining ground on a corporate level, teams within the division are looking at process changes and the measures needed to assess them in a quantitative way. Every software practitioner in the division is on at least one continuous measurable improvement team. Approximately 50 teams are looking at process issues and at which metrics are required to measure effectiveness. Lessons Learned
• “To be a software process maturity level 3 organization, you have to have reached the point where process, measurement, and improvement are part of the culture, where standardized processes are used on all projects and are accepted by all practitioners. Maybe it doesn't take 17 years to establish a measurement program and design the data reports, but maybe we needed that time to establish the culture to accept data collection and quantitative process improvement as an effective way to run a software business.”
• “It is not so great a task to accomplish these things for projects, but doing it organi-zation-wide takes much longer. Attaining software process maturity level 3 across the organization is the goal, not just on a project. This will require a transition pos-sible only through a change in corporate culture. This includes the organization into which the software group is embedded. It might take two or three years to define a program, but it takes many more years to establish a culture."
• Measurement is an integral part of that process. • Productivity gains, made in part as a result of the information made available through
measurement reporting, have been significant. The group cost performance index, defined as the budgeted cost of work performed divided by the actual cost of work performed, is now .97 (as of March 1990). This is due to good estimates, to knowing what resources the job really needed, and to a good process with controls to ensure it is carried out effectively. The move to .97 from the previous .94 level took two years, and was supported by the use of rate charts to show planned completion and earned value tools to track the percentage of completion.
• “We are successful because of our process. If our budgets are cut on a project bid, we will have to cut function in order to implement a good process. When the debate goes up a management level to rectify differences, we will win because senior management doesn't want a software crisis. If you take process measurement away, you can save the cost of the reports, but you will pay for it with surprises during development.”
56 CMU/SEI-91-TR-016

A.11. Case 8 Distinguishing Characteristics This organization has been reducing its measurement program that has been in place since the mid-1980s. The measurement effort was initiated as part of an ambitious effort to make several significant changes in the way this division develops software. Problems related to the use of both inappropriate software development methods and programming language for the division’s applications have had a negative impact on the perception of measurement. Organization This organization is a division of a major electronics manufacturer. The division makes electronic instruments that have a number of civilian- and defense-related applications. The instruments contain computer programs. In the beginning, the programming effort was limited and almost entirely devoted to firmware. Now, half of the group's work is software-related. Since their products are not produced in high-volume, the division must devote considerable attention to both their R&D and their manufacturing processes to produce quality products and still earn a reasonable profit. This market-driven focus on process has elevated the concern for quality to the point of religion. Metrics History The division was aggressive about developing new products and gaining market share in the mid-1980s. The staff wanted to do good work, but they were unsure how to address the problems they were experiencing. The need to gain visibility into their development pro-cesses was addressed by a product development manager who initiated a software measurement program. The measurement effort began in earnest in 1986 when the group designed a metrics-driven life-cycle. The product development manager at that time was an aggressive, analytical person who had a strong data-driven view of the life-cycle, and was concerned about schedule slips that sometimes reached 100%. Part of the slippage problem was due to the transfer of some projects to a new site, but a more fundamental problem was that the management process produced poor project estimates. The measurement program started with two engineers, some staff support, and a statistician (he was a big asset, but was sometimes overly focused on detailed analysis and micro-decisions). They used some “accepted” measures as the foundation. These were supplemented by additional measures based on a new software life-cycle model being initiated at the same time, and other measures developed by other divisions and corporate engineers. Some people wanted even more information then, and that desire still exists among some developers today. Not only was the measurement effort tied to the implementation of a new life-cycle model, but also at that same time a move was made to use an object-oriented language. Ambitious new projects staffed with young engineers using new tools and a new language created a prime opportunity for failure; several projects indeed suffered significant increases in schedule, staffing and feature set beyond expectation.
CMU/SEI-91-TR-016 57
The new language combined with the new life-cycle did not permit flexibility in the devel-opment process. Engineers needed to do more prototyping than called for in the new life-cycle, but they did not convince upper management of the need. It was not that the im-provements were the result of poor engineering; it was that they were made too soon, before the engineers were ready to implement them. In addition, measurement output consisted of a thick, monthly report long on data and short on analysis that was sent to all project managers and the aforementioned development manager. Routing incompletely analyzed measurement reports to inappropriately high management levels was of little use in dealing with the problems caused by the new life-cycle and language. The fallout from these problems was that measurement carried some of the stigma of failure attributed to the new development life-cycle and the new object-oriented language. Despite this situation, measurement remained a major effort in the division until 1988, when a switch in management occurred and a more intuitive, people-oriented development manager took office. Gradually, support for measurement was withdrawn, and a new push for project manager empowerment was initiated. Measurement had been tainted by:
• Association with life-cycle and language problems • Being imposed from above by a top-down management structure • Lack of promotion among the supervisors and engineers “in the trenches” • Overemphasis on data collection that the limited analysis resources available could
not hope to evaluate • An incorrect belief that it would be used as an evaluation criterion
Accordingly, there was little, lasting grass-roots support to maintain the program. Thus, much of the measurement effort was transferred to the quality assurance group. There were a number of additional factors that contributed to the cutbacks in the program. The limited belief in measurement's potential to solve technical issues and the fact that the managers and engineers in the metrics support group were younger and less experienced than those working in project development countered strong, widespread support. Another obstacle was that the use of measurement was viewed as intrusive in some areas and inappropriate in others. For example, a measurement program experiment with turmoil measures (that is, a measure of change) was dropped due to a lack of beneficial results. They had more success with process measures that helped determine where the failures were occurring. Despite the problems encountered during this ambitious attempt to improve development capabilities, there were some important payoffs from the measurement program. Process understanding made possible through the visibility provided by measurement allowed them to improve the way they developed software. They found that making macro changes to the process were more beneficial and easier to assess than micro changes. Scheduling and testing both improved. Measurement improved performance in the short-term and provided the rationale for the database of historical performance.
58 CMU/SEI-91-TR-016

CMU/SEI-91-TR-016 59

Current Program There are several factors that have contributed to the focus and emphasis of the current measurement program. The new manager is less data-driven and more intuitive, and project managers have been granted free rein to use the measures they want. As part of their new empowerment, project managers have a lot more control over product definition (functionality tradeoffs), scheduling, and staffing decisions where previously they only had control over staffing. Top-down management directives are no longer a fact of life, and project managers are a lot closer to meeting schedules. About 30% of the measurement program staff has survived the program redefinition. Much of the original work has moved into the quality assurance (QA) group, especially defect analysis. Measurement had a powerful impact on the concept of what quality is. Before the change, there was little empirical determination of quality in terms of when testing is con-sidered finished; in part, this was responsible for dragging out the testing process. Software testing is still intact, though no longer driven strictly by numerical software reliability. There had been over-testing due to a lack of understanding of the process. Schedule estimation and measurement still need to be improved, and focusing on time-to-market did make the issue visible. Now, the division has lost some ability to evaluate im-provement efforts, especially in a comprehensive manner; and from time to time they march in the wrong direction in their continuing effort to improve. Because they don't budget the resources to do all the tracking/evaluation they need to do in the measurement arena, they cannot always tell if they are doing the right things. Despite the cutbacks in the measurement program, there has been a major payoff in that the division has been able to improve its development environment, and project managers have been empowered to do a better job of project management. Gains made in process understanding are a particular source of pride. It took five years for project managers to understand what measurement information they needed. Now the focus is on determining the needs of the engineers. The problem is finding the project resources required to deal with all the issues being raised. Currently, issues are being addressed based upon a Pareto analysis of obstacles, with the highest priority issues receiving attention and resources. Most measurement is well enough embedded in QA and appears sufficient to maintain cur-rent quality levels. The division knows where it is in terms of quality. There was no question of support for continuing the measurement effort. The question was where to put it. They claim that the payback has been tremendous. The individual in charge of the division's measurement program has spent considerable time analyzing the corporation's experience with measurement (a task assigned by a corporate department). He concluded that “the need is to understand the process first, then push into goals. This is a human loop. Until you understand the process, you are going to do the wrong things. The scary thing is that you will often see short-term gains (from bad deci-sions). Fundamental change takes time. You can see some real returns in approximately three years when behavioral change begins to take place.” Such behavioral change is a result of the greater insight into factors that impact development efforts. Management no longer piles additional resources onto troubled projects. Now, management terminates programs early if projections supported by historical data indicate a poor or risky return on investment. Though scheduling is still something of a problem, they
60 CMU/SEI-91-TR-016
have developed new ways to apply schedule information, and they have made improvements in their ability to estimate effort using “estimation quality factors”. Progress has also been made in modeling defects, establishing release criteria, and making time-to-completion estimates. Future Plans Redefinition of the measurement program has begun. “We damaged our credibility and now we are redefining what we want to accomplish.” The snapshot gains of the past are being consolidated as project managers assess their own measurement needs and as staff engi-neers put together a small, basic program to be applied group-wide. This time around, less emphasis is being placed on productivity measures. While they were useful for making inferences about process areas to investigate, they were less useful for making improvement decisions. Another set of measurements found to be of limited use were turmoil metrics (a lesson learned). The new program will draw on both local and cor-porate-wide experience and expertise, and some new initiatives will be undertaken in re-sponse to the requests of project managers for more data. Lessons Learned
• The top-down management style was an impediment in at least two ways: in the push to get working level engineers involved in measurement, and in getting information to the people who are close to the work.
• The top-down management thrust was an attempt to deal with major problems in a big way, but the magnitude of the changes initiated were beyond the division's capability to evaluate and control. So much data was gathered that there were too few resources left to perform analysis. Those tasked with measurement responsibility did not do enough of a sales job at the practitioner level. Because they did not make use of all the data being collected and they did not work at developing support among the developers “in the trenches,” the support for measurement was limited when the change in top management occurred.
• The wide distribution of monthly reports meant that people at all levels received a lot of information that was not pertinent to their needs. This often left project managers anxious as senior management reviewed reports loaded with data but short on analysis.
• The following lessons were learned from the quantity of data vs. analysis: - If you confuse people receiving measurement reports with too much detail, you get mayhem. The most successful division programs did the best job giving the right information to the right people. - Project managers need information to facilitate their management and control, and section managers need overall process–not project–information. - Only provide the information that the individual manager needs, but beware of giving too little detail as well. - Credibility is always an issue with measures. Conclusions drawn from measure-ment information have to be put in context by the judgment of knowledgeable practitioners.
CMU/SEI-91-TR-016 61

• To get change accepted, two things are required: top management support and grass-roots acceptance. If those responsible for measurement had it to do over again, they would establish more ownership and communicate more results back to the project teams and de-couple the measurement effort from other, potentially controversial changes. By establishing the program on its own merits and managing it as if no senior management support existed, more of the program could have been retained.
• You can do all the measurement you want, but you must focus on your process first, and this requires a lot of up-front work. You can really help the working engineer if you can improve the manager's decision-making process.
• Some measurement observations: - In response to a question about program cost: “There are some things you ought to do even when times are tight.” - “Measurement always, always shapes behavior.” - “You need to reward good measures even if they display bad results. Don't penalize the truth.” - “Don't make measures a religion. They are a means to an end, not an end in themselves.” - “Managing with bad information is worse than making bad decisions based on good information.”
62 CMU/SEI-91-TR-016

A.12. Case 9 Distinguishing Characteristics This organization's measurement program has been designed for tailorability based loosely on software engineering process maturity, as defined by the SEI. Tools provide automated support to the measurement program. The measurement program is still in its infancy, yet it has already achieved some successes in pilot applications. Organization This organization is an international leader in information and communication systems and services. It is composed of a number of semi-autonomous independent business units that contribute to a corporate R&D effort mainly focused on near-term solution of technical prob-lems encountered by those business units. Much of the software work performed by the business units is in maintenance and integration of purchased software. Most projects are fairly small – a maximum of 30-50 programmers per project – and the resulting computer programs are typically tens of thousands of lines of code. The executive vice president for technology provided a big push for establishing a recom-mended set of measures, but the corporate structure with its heavy representation of in-dependent business units mediated against any top-down measurement mandates. The corporate R&D group has taken the lead in making a measurement toolkit and corporate database priorities. Metrics History Measurement became a corporate sponsored activity with the creation of a corporate Soft-ware Engineering Laboratory (SEL) three years ago. The SEL was created with a four-pronged focus on process, measurement, reuse, and tools/environments. The measurement focus was mandated by the executive vice president in charge of a new facility. The first task for the measurement group in the SEL was to look at both what the individual business units needed to measure and how they were developing software. By coupling the two views into a single process view of measurement, they have been working to tie measurement to the needs of the business units. The plan is to match measurement efforts on projects to the software engineering process maturity of the development teams. There were a number of reasons for tailoring the measurement effort to the process maturity of the project. Tailoring would minimize the overhead cost of measurement by restricting the scope of the effort to that which could be beneficially utilized at a particular project's maturity level. The clarity and usability of the data collected would be enhanced by avoiding data that is not applicable to the current maturity level. Tailoring would allow the ability to use measurement to grow with the maturity level. From May 1989 to January 1990 a recommended measurement set was developed from interviews with the business units and contractors. In December 1989 and January 1990, the structure of the measurement program was established. The effort toward program definition
CMU/SEI-91-TR-016 63

was supported by an investigation of measurement programs outside of the corporation in order to provide a competitive benchmark for the program. Since January 1990, a major focus has been on tool evaluation and toolkit development for measurement program support. Pilot projects for testing the measurement program were selected from areas that had shown interest and support for measurement, and where peo-ple had been looking into measurement themselves. Other positive signals for possible pilot efforts were developer process improvement efforts and recommendations of the corporate process group. The need to demonstrate success in these early measurement programs was doubly impor-tant since there were some field engineers who viewed the SEL effort as little more than an academic exercise. Now that measurement has begun delivering on its promise, more and more field engineers are requesting assistance from the corporate group. Current Program The measurement effort has been receiving steady management support since its inception two years ago. Much of the effort in the initial year of the SEL was spent seeking out the right individual to head up the measurement part of the program. The pilot projects chosen for initial measurement applications were specifically selected for their high probability of success based on local support and manageability of the measurement task. There is a continuing interchange between the process and the measurement initiatives of the SEL. That is why tying measurement to process maturity became the means selected for the corporate effort. Tailoring measurement to process capability is only one factor the corporate group has had to deal with. The comparatively loose corporate structure likewise dictated that measurement be flexible enough to accommodate local preferences of widely dispersed software development teams. For example, the program had to be flexible enough to support one group that uses function points and another that uses lines of code as the basis for estimation. The concern that practitioners have access to tools and methods they are comfortable with is indicative of the SEL's conscious effort to avoid the appearance of an academic, research-type facility. That measurement is finding acceptance in the field is reflected by the fact that the corporate group has far more work than it has time to do. The group is getting many unsolicited requests for help via word of mouth, and its budget requests are getting approved intact by senior management that has been hearing about the measurement effort from the business units. In fact, the demands for assistance from the business units have expanded to the point where the corporate staff is spending almost all of its effort to support them. As a result, the corporate group is experiencing a shift in roles from technologists and researchers to that of advocates in search of establishing measurement as a standard item in project planners' budgets. An active promotional effort has assisted the introduction of measurement technology throughout the corporation. One means has been via the corporate newsletter. Another has been SEL workshops of 60-75 people brought to the facility for 1-3 day classes, part of which is devoted to metrics. Other publicity is done through technical reports and travel to the business units.
64 CMU/SEI-91-TR-016
For projects at the initial maturity level, size and effort measures are collected to establish a performance baseline for development. Size is measured by lines of code or optionally in terms of function points or object counts. Effort is tracked by person months. These measures are mandatory for all projects.
CMU/SEI-91-TR-016 65

In addition to the above, the maturity level two measures include the number of project re-quirements, budgeted and actual costs, personnel experience and expertise, and schedule-related measures such as time spent on major activities. These measures are targeted to baseline general development productivity and are strongly recommended for all projects. Level three measures add tracking of the complexity of intermediate products and the at-tendant quality of those products (completeness, consistency, etc.). These measures indi-cate the likely quality of the product and are also strongly recommended for all projects. Level four measures focus on the development process in the areas of reuse, special tech-niques or methods, etc. The measures to be applied at this level are to be determined through consultation with corporate metrics personnel. The object of these measures is to provide support for decisions about how to proceed at critical junctures in the development effort. Level five measures will add process metrics to describe the type of process to be used in development. Emphasis here will be on tracking process measures over time to provide control feedback to allow dynamic changes in refining development processes. All of these and other measures are being used to deal with a broad range of issues across the corporation as the level of measurement understanding, expertise and maturity grows. The goal of the effort goes beyond providing a window into the status of a developing sys-tem; it seeks further to improve the process that guides the development itself. Along these lines, a number of benefits from measurement are already being realized by the pilot projects:
• Measurement is being applied to help moderate the pace of development and deal with process issues that have been causing significant problems during testing.
• A multi-factor software quality index (SQI) is supporting efforts to evaluate vendors. • A process interplay metric from the project workbench is helping to tie estimates to
actual results in order to develop a database of estimation efforts. • Persistent overtesting is being addressed by using complexity measures and the
change control/configuration management system to direct testing resources and to target modules for testing.
• Portability and reuse efforts are being supported by measures of design and code. • Estimation has been improved by analyzing complexity and modeling techniques
made visible through measurement. Estimates on a particular project indicated that every hour spent on metrics collection and analysis has saved 10 hours on testing. For the first time in the project team's experience, software is not the cause of schedule slips. While it has not been possible to show such clarity of benefits for all the measurement efforts, SEL has not had any organization start using measurement and then drop it. The metrics toolkit project is an outgrowth of the organization's measurement effort. Automation is viewed as an important adjunct to measurement in order to avoid as much as possible measurement's impact on the development process itself. Ideally, the toolkit will be a part of the development environment to allow automation of data collection so practitioners
66 CMU/SEI-91-TR-016
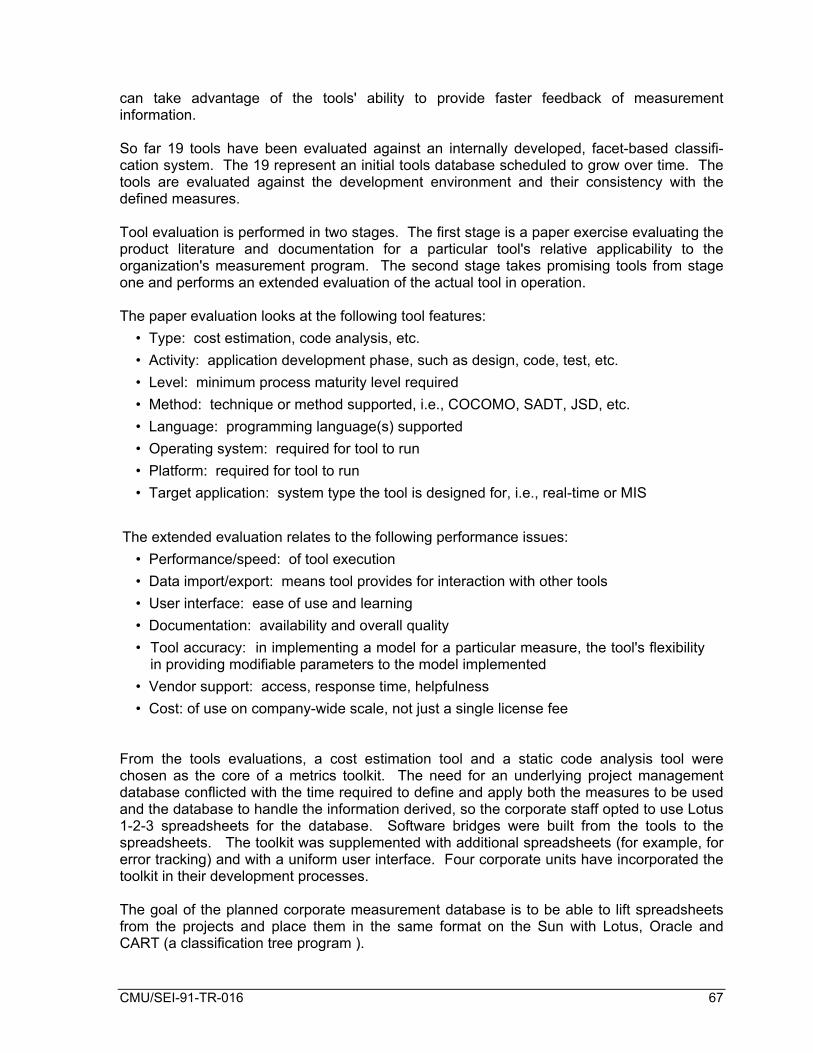
can take advantage of the tools' ability to provide faster feedback of measurement information. So far 19 tools have been evaluated against an internally developed, facet-based classifi-cation system. The 19 represent an initial tools database scheduled to grow over time. The tools are evaluated against the development environment and their consistency with the defined measures. Tool evaluation is performed in two stages. The first stage is a paper exercise evaluating the product literature and documentation for a particular tool's relative applicability to the organization's measurement program. The second stage takes promising tools from stage one and performs an extended evaluation of the actual tool in operation. The paper evaluation looks at the following tool features:
• Type: cost estimation, code analysis, etc. • Activity: application development phase, such as design, code, test, etc. • Level: minimum process maturity level required • Method: technique or method supported, i.e., COCOMO, SADT, JSD, etc. • Language: programming language(s) supported • Operating system: required for tool to run • Platform: required for tool to run • Target application: system type the tool is designed for, i.e., real-time or MIS
The extended evaluation relates to the following performance issues: • Performance/speed: of tool execution • Data import/export: means tool provides for interaction with other tools • User interface: ease of use and learning • Documentation: availability and overall quality • Tool accuracy: in implementing a model for a particular measure, the tool's flexibility
in providing modifiable parameters to the model implemented • Vendor support: access, response time, helpfulness • Cost: of use on company-wide scale, not just a single license fee
From the tools evaluations, a cost estimation tool and a static code analysis tool were chosen as the core of a metrics toolkit. The need for an underlying project management database conflicted with the time required to define and apply both the measures to be used and the database to handle the information derived, so the corporate staff opted to use Lotus 1-2-3 spreadsheets for the database. Software bridges were built from the tools to the spreadsheets. The toolkit was supplemented with additional spreadsheets (for example, for error tracking) and with a uniform user interface. Four corporate units have incorporated the toolkit in their development processes. The goal of the planned corporate measurement database is to be able to lift spreadsheets from the projects and place them in the same format on the Sun with Lotus, Oracle and CART (a classification tree program ).
CMU/SEI-91-TR-016 67

68 CMU/SEI-91-TR-016

Future Plans The corporate database is being designed in 1991. Also in 1991, the measurement staff will expand its work with the process group in setting up metrics standards, practices, tools, and the database. Tools built directly into the process enhancement environment will not permit code to be compiled unless measurement goals are met. An Oracle product to allow Lotus spreadsheets to query the database could be the among the final tools. Measurement issues targeted for further investigation include comparing process description languages, developing measures to describe process characterization and performance, and linking project management to estimation. Another investigative initiative will involve allowing the academic community to access the corporate measurement database. By providing realistic data to academic researchers, the organization hopes to focus research toward solving today's problems rather than investi-gating tomorrow's technology. Funding The pilot projects are being funded by corporate overhead raised via a tax on the business units that also covers the toolkit and the corporate database. Project-specific measurement activities are funded by the business units themselves. The budget proposal for 1991 calls for an increase in corporate staff from two to four with additional rotational assignments for particular expertise for a total of 5 1/2 people plus an academic researcher for the summer (the organization supports cooperative research efforts with several universities). The corporate group is funded directly with about 5% of the SEL budget going to measure-ment, 7 1/2 % of corporate funds for specific business unit work, and 10 % directly from the business units for a total of about $525K. There is an on-going debate about whether the business units or the corporation will pay for the tools. Lessons Learned
• “We've made some mistakes (in the measurement program), but our flexible ap-
proach has helped us to recover. A lot more hand holding is required than we real-ized. Just establishing a program is not enough.”
• Productivity evaluations have never been a program priority. The organization is too diverse for that effort to be of much use. “We're examining processes, not people.” To this point, people have not appeared to feel threatened by measurement.
• “Staying away from the academic image is important. A lot of people don't under-stand the R&D center (SEL's parent organization).” The center is focused on looking at technologies that can be inserted in 3-5 years. The goal is to identify and apply technologies, not to develop new ones. Ties to university research efforts are maintained to keep abreast of the evolving state of the art. The lab focus on solving current problems helps the corporate measurement group avoid appearing “too academic” as does the strong software background of the staff.
CMU/SEI-91-TR-016 69
• Automate as much as possible. Most projects are fairly small and it is hard to ask small programs for a lot of data. “You can only push people so far. If they have to fill out a form, forget it."
• People tend to want to oversimplify things. They want measurement to simplify the problem (for example, to rate products with maturity levels 1-5). This is an unfair ex-pectation; one cannot separate process from measurement. Another problem is that people want to know, “Where do I stand? How can I improve?” The answers to these questions often require a process and measurement maturity not yet achieved.
• The tendency towards simplification of the issues and towards immediate feedback means effort must be expended to keep the focus on the needs of the corporation rather than on comparisons to the rest of the software community, and to keep that focus on process issues, not personal productivity.
• Once people find that one tool helps them, they want more and more, so they have to find a balance between the benefits of using tools and the time it takes to use them well.
• The software development process belongs to the corporation. People can leave, but the process remains as a corporate asset.
• It does not matter so much how the corporation compares with others, but rather how consistent development is within the corporation and whether development is im-proving overall.
70 CMU/SEI-91-TR-016

A.13. Case 10 Distinguishing Characteristics This organization is supporting a software measurement initiative that is being jointly spon-sored by corporate process and quality assurance (QA) groups. Because of the high degree of autonomy granted the line business units, the corporate measurement champions are working directly with representatives of software practitioners across the organization to design and establish a uniform measurement program. Organization This organization produces a wide variety of equipment and systems that support business applications. The product line is split into general purpose platforms and application specific systems. This company makes its living manufacturing and selling hardware, but much of its financial success is dependent upon the quality of the software it produces for that hardware. Be-cause of the company's long and rich hardware tradition, it is sometimes difficult to maintain a focus on software as a tool to enhance product operation and quality. A major software program for this company will have up to 100 people working on it and can produce 1 million lines, but the company has developed a 4 million line system. The company has over 4,000 people working on software development world-wide. As a means to improve its software, both in process and in product, the company has established corporate level activities to tackle development and quality assurance issues. As part of that effort, workshops set up by corporate staff and attended by line software practitioners and managers are conducted periodically. Recommendations from those workshops are then sent to quality councils (one each for the platform and application specific line) for approval. Metrics History The organization's measurement effort began over 20 years ago. In 1969, a system was developed to track field problem reports to better support customer service. At about the same time specifications for the phases of the software development process were estab-lished. In 1970 a formal, separate QA section was established at the corporate level. In 1972 corporate QA looked at performing closed loop correction action, but the effort was viewed as requiring too much effort for the resources available to do the task. The current problem tracking program was started in 1979-80 using an adaptation of a commercially-available off-the-shelf system then in use by the Department of Defense. In 1978 a major software development process update was performed to overhaul the soft-ware development phases specification established in the late 1960s, and all developers were required to use the new process (this included systems issues as well as software ones). The new process cited a number of required documents and the handoff procedures for the documents through the development chain.
CMU/SEI-91-TR-016 71

This process was still intact in 1982 when a decentralization push at the corporate level made each site a profit and loss center. Instead of direction, corporate level entities now give advice and guidance, and individual sites have the leeway to tailor their own software development processes. Along with this decentralization in 1982, corporate headquarters published its development guidelines for software. In 1986 a corporate vice president for QA was created. This move elevated the issue of managing the development process to the same level as that of development of the product. The new QA focus on process was a reaction to a perceived failure on the part of the original QA group to deal with development issues, and one result of the increased emphasis was the release of a corporate quality mission statement in 1986. The commercialization shift in the early 1980s unleashed the bonds to a common corporate standard. This proved to be a boon to corporate profits, but the cost center focus on quality suffered under the short-term view of the profit and loss managers. The re-emphasis on quality in 1986 was an attempt to recover and maintain the corporation's quality reputation and long-term financial prospects. In the early years, measurement was basically a management tool for project control. In 1988 a program was initiated to get information from the customer database for feedback to developers regarding key quality factors (reliability, availability, supportability, usability, and installability). The importance of development process issues to the organization is reflected by the efforts in recent years to survey development practices and to explore process issues in workshops that bring software practitioners and managers from around the world together to share experiences and to search for better ways to operate. The surveys, performed every three or four years, help to steer efforts and set priorities of the corporate research and development and QA groups, and the workshops foster a dialogue between and among individual sites and corporate staff, helping to generate ideas for improvement. The importance that the individual sites place on the workshops is reflected in the evolution of the program over the past 2 1/2 years. The early workshops were attended by people on division engineering staffs, but the effort required considerably more time and attention than originally thought, so a tendency arose to push the assignment off on other people (often junior QA engineers). Then, the realization that junior engineers did not have enough authority to deal with the increasingly visible issues related to software development led to division engineering regaining responsibility for workshop activities. Now, most development organizations have process improvement functions. The most recent Software Process Technology Workshop (August 1990) showed the number one interest of the attendees was measurement, and development methods were second. Current Program Institute of Electrical and Electronics Engineers (IEEE) Standard 982, Software Reliability Measures, provides the basis for the current measures being collected. After an initial review of the standard, 22 of the 39 standard measures were selected for initial experimentation, and nine of those have been approved with seven others still under consideration. While the IEEE selected its measures to look at reliability, the focus of the organization in selecting a subset of the standard was on the potential to provide visibility into development activities.
72 CMU/SEI-91-TR-016

The IEEE measures are supported by two quality measurement system measures that have been collected for the past 10 years, but only formalized as part of the measurement pro-gram last year. Having already experienced the problems related to measurement overload, corporate and division measurement leaders are continually assessing how much they can profitably accomplish. The Measures Organization approved measures based on the IEEE standard are:
• Fault density • Defect density • Cumulative failure profile • Functional or modular test coverage • Requirements traceability • Error distributions • Test coverage • Mean time to failure • Failure rate
Quality measurement system measures are:
• Counts of defects, and faults, pre and post initial customer installation • Specification resolution time (actual time needed to correct field defects)
Still under investigation and based on the IEEE standard are:
• Defect indices • Number of entries and exits per module • Software science measures • Cyclomatic complexity • Minimal unit test case determination • Testing sufficiency • Software release readiness
These measures have been selected for their applicability to the reborn corporate focus on customer service and quality. Customer problem reports are written when field requests for assistance cannot be handled on the spot (approximately 95% of customer calls are rela-tively trivial and can be handled “on the spot”). As the report moves through the system, more information about the problem is obtained and is added to each problem report as it is uncovered. Problems are assigned to a plant team. If the report is indeed a problem, it is sent to the original developer's maintenance group for resolution. A corporate study on operating systems and compiler errors was performed in 1984-85 on data from 1973 to 1983. It revealed that half of the modules had no errors and these modules represented about 30% of the software volume. Some modules had many errors, and small modules were as likely to have errors as large ones.
CMU/SEI-91-TR-016 73

The current program is designed to assist in the creation of realistic estimates for program development and to improve customer service. Developers have accomplished several things using measurement and estimation: better estimates have given them a way to sup-port their cases when dealing with upper management; there is now more support for planning (and taking the time to make the plans realistic); and developers have been able to work the trade-offs necessary so that products can be delivered at a certain time. There is at present no feedback loop in the measurement process–the results of analyses provide status information but are not used to adjust the process. One function of QA is to look into development process improvement and feedback issues. At the division level, local sites have the autonomy to tailor their own software development processes to fit their needs, and they do so. While the focus of the measurement effort has been on quality issues, the visibility into the development process made possible through measurement has provided some concomitant benefits in analyzing process gains resulting from the application of new technologies. For example, the QA group was able to document an 8% annual productivity gain attributable to using automated development tools. The QA group’s experience with measurement has led to a belief that there are different types of measures: performance (after the fact), predictive, and diagnostic. The need for performance and predictive measures relates to the goals of a measurement effort, while diagnostic measures have specific uses related to cause and effect analysis of factors im-pacting the first two categories of measures. Each month sites send measurement reports to corporate QA. While QA is also a staff func-tion, QA does have some on-site leverage to influence local activities via annual site reviews. Future Plans Neither the organization as a whole nor the divisions in particular have taken great advan-tage of the measurement program. Questions still exist regarding what the measurement numbers mean. Corporate staff is still investigating to see if it is collecting the right set of attributes. This investigation was initiated only in the past year, and the data collection is not yet complete. A critical issue for the investigation is that of determining how to know when one has done a good job–of measurement and of software development. It is too tempting to try to use a checklist for conformance, and what corporate QA is trying to find is a way to really know the job is done properly. The search for a solution to the question of conformance to standards often yields the root cause of program problems: failure to follow established processes. Now corporate QA is trying to identify predictive parameters for a corporate database. In the future they hope to unify all the measurement databases (each country has its own with its own levels and types of automation). They are also looking at various cost estimation models to build on their estimation experience of the past five years. The organization's view of improvement is that they do not need more invention. “We do almost everything well, once, somewhere, but how do we transition that expertise to the rest of the organization?” Once the investigation and evaluations are complete, an education program will be initiated to transition best practices throughout the organization.
74 CMU/SEI-91-TR-016

One of the big issues in the most recent workshops was who should pay for measurement (especially the tools). With a major corporate focus on how the corporation compares to the rest of the industry, there was significant concern at the local level about who should be funding the data collection and analysis to support such comparisons. Cost estimation was well accepted when it was performed under corporate overhead (about 50 mangers were taking advantage of it), but there was significant opposition when it came time to transfer the cost of the effort over to the profit and loss centers. Among a number of issues regarding the measures themselves was whether it might be more advantageous to track size by function points rather than by lines of code. Lessons Learned
• Understanding of both process and philosophy is a key goal. Determination of what is correct from a development standpoint cannot be made separately from business considerations.
• Measurement is designed to generate information to direct action to achieve specific results, but the problem is that many people do not get beyond the discussion of measurement. There is a need to look at measurement goals and the results ex-pected from the effort.
• The need is to have machineable measures for both collection and reporting. Some measures require historical data to be useful.
• Improvement in the product will follow from improvement in the process used to de-velop it.
• Software is still an art in some organizations. It is less so after four years of process focus in this organization.
• Developers often want to know the worth of the metric first and resist experimentation to determine utility.
• It is not enough to make improvements to development processes. Effort must be made to maintain any progress achieved. Corporate surveys of the state of software practice are performed every 3-4 years to understand why projects succeed or fail. There is some backsliding from performance levels previously attained.
CMU/SEI-91-TR-016 75

A.14. Case 11 Distinguishing Characteristics Although there is an initiative to establish a corporate-wide measurement program, divisions have the autonomy to set up their own measurement programs. Measurement is being established for a project in this division by a bottom-up effort, led by the software development manager of the project. Members of the project team have discussed the goals of measurement, selected what to measure, and created rigorous definitions for those measures. Organization This organization is a product division of a major aerospace corporation. The company was recently reorganized vertically by product divisions. A process improvement group was created by this division to provide support for process improvement horizontally across products. The quality assurance group within this new group focuses mostly on hardware and mostly on final inspection. We spoke with the department manager for software for a specific product and his software quality assurance engineer. The project will produce 150-200 KLOC written in Ada, assembly, and Jovial. Currently, the program is in full-scale engineering development. Of the 4,600 persons employed at the site, the 40 software developers on this project repre-sent the site's only identifiable software department organization. Metrics History Much of the process improvement groundwork for the department has been performed over the past 5 years, and most of the 40 employees are new to the company and fairly young. Preparation of all practitioners for the job involves becoming familiar with the project tool set, environment, and design method (which is wrapped around the tool set; the method is a form of real-time oriented, structured, top-down design). A 22-chapter software standards manual that establishes the foundation for software development was recently completed. The continuous improvement culture of the group has meant that even as the last of the software procedures was being completed, project management was already discussing where to make the next changes in their plans and processes. A methods training program has been set up in the department to teach a relatively young staff the principles and rationale behind the development process. The class has attracted a number of people from outside the project group including other software people in the division, plant quality assurance people, and government customer representatives. The biggest challenge has been bringing engineers with hardware backgrounds to the point where they understand the nature of software. Other problems include the need to overcome the negative image of software resulting from past problems in both development and
76 CMU/SEI-91-TR-016

performance. The company as a whole has had difficulty getting plans approved by customers due to a lack of confidence in the company's ability to deliver on promises. The company had been collecting metrics data during software development for some years, but no real attempt to use the data had been made until the measurement effort was formalized for application to this product. The metrics program is unique to the project. Since the definition of the measurement program is being performed by the engineers in the department, they are ipso facto supportive of the metrics effort. Current Program Efforts are being made to estimate and track inspection defects and size (LOC, memory usage, and duty cycle). The software staff is wrestling with making precise, meaningful definitions of proposed measures. The major process measure is defects resulting from Fagan-style7 software inspections. The measurement program costs are minimal. Data collection consumes about 1/2 of a labor month for a technician; affected practitioners perform analyses as part of their jobs (e.g., supplying charge data on time cards). Future Plans The project team has continuous improvement as a major goal. As the team's measurement experience matures, it plans to support a steady evolution of its measurement program. At this point, the team can only hypothesize as to the directions in which that evolution may proceed. Funding The program is funded by development funds and has earned the intellectual support of the customer. Lessons Learned
• The metrics program supports the decision process that assesses the impact of changes to system requirements. It provides a baseline for the cost and schedule estimation system.
• It has been easier to get the younger engineers to accept the concept of measure-ment and to support the program. Given time, however, even the veterans who were skeptical of the effort have come around to support measurement, and their vocal expressions of doubt helped maintain discipline in the program and also raised issues that needed to be addressed.
7 M.E. Fagan, “Design and code inspections to reduce errors in program development,” IBM Systems J. 15(3): 182-211, 1976.
CMU/SEI-91-TR-016 77
• There has been no resistance to the data collection effort. Concerns that the inspec-tion results not reflect back on individuals have been addressed by the very limited distribution of the inspection action item list. Inspection moderators, specifically trained for the task do see the inspection data, but any specific problems that arise are handled via individual counseling. Again, the involvement of group members in the writing of the procedures has helped to ease concerns of data misuse. The data are in a database, but have not been accessed for individual assessment.
• Critical to the acceptance of the measurement effort was the fact that practitioners were responsible for developing their own procedures. In the process of developing those procedures, they bought into the process they were creating.
78 CMU/SEI-91-TR-016
Appendix B. Additional Measurement Program Information Additional information on establishing and sustaining measurement programs can be found in:
• Software Metrics: Establishing a Company-Wide Program, R. Grady and D. Caswell, Prentice-Hall, 1987.
• Managing the Software Process, Watts Humphrey, Addison-Wesley, 1989. • Software Engineering Process Group Guide, Priscilla Fowler and Stan Rifkin,
CMU/SEI-90-TR-27, September 1990. The Software Engineering Laboratory at NASA Goddard Space Flight Center in
Greenbelt, Maryland, publishes many measurement-oriented reports. Annotated Bibliography of Software Engineering Laboratory Literature, SEL-82-906, November 1990, contains citations to current reports. Measuring Software Design Quality, by David Card with Robert Glass, Prentice-Hall, 1990, is an excellent reference to measurement work conducted at the Software Engineering Laboratory at NASA Goddard Space Flight Center.
Additional measurement citations can be found in Software Metrics: Citations from
the Computer Database, January 1983 - September 1989, National Technical In-formation Service, PB89-873673, 1989.
CMU/SEI-91-TR-016 79

REPORT DOCUMENTATION PAGE Form Approved
OMB No. 0704-0188 Public reporting burden for this collection of information is estimated to average 1 hour per response, including the time for reviewing instructions, searching existing data sources, gathering and maintaining the data needed, and completing and reviewing the collection of information. Send comments regarding this burden estimate or any other aspect of this collection of information, including suggestions for reducing this burden, to Washington Headquarters Services, Directorate for information Operations and Reports, 1215 Jefferson Davis Highway, Suite 1204, Arlington, VA 22202-4302, and to the Office of Management and Budget, Paperwork Reduction Project (0704-0188), Washington, DC 20503. 1. AGENCY USE ONLY
(Leave Blank) 2. REPORT DATE
July 1991 3. REPORT TYPE AND DATES COVERED
Final 4. TITLE AND SUBTITLE
Measurement in Practice 5. FUNDING NUMBERS
6. AUTHOR(S)
Stan Rifkin and Charles Cox
7. PERFORMING ORGANIZATION NAME(S) AND ADDRESS(ES)
Software Engineering Institute Carnegie Mellon University Pittsburgh, PA 15213
8. PERFORMING ORGANIZATION REPORT NUMBER
CMU/SEI-91-TR-016
9. SPONSORING/MONITORING AGENCY NAME(S) AND ADDRESS(ES) HQ ESC/XPK 5 Eglin Street Hanscom AFB, MA 01731-2116
10. SPONSORING/MONITORING AGENCY REPORT NUMBER
ESD-TR-91-016
11. SUPPLEMENTARY NOTES
12A DISTRIBUTION/AVAILABILITY STATEMENT
Unclassified/Unlimited, DTIC, NTIS 12B DISTRIBUTION CODE
13. ABSTRACT (MAXIMUM 200 WORDS)
A few organizations have reputations for implementing excellent software measurement practices. A sample of these organizations was surveyed in site visits. Clear patterns of practices emerged and they are reported at a con-solidated, “lessons learned” level and in more detailed case studies.
14. SUBJECT TERMS
15. NUMBER OF PAGES
97 16. PRICE CODE
17. SECURITY CLASSIFICATION OF
REPORT
Unclassified
18. SECURITY CLASSIFICATION OF THIS PAGE
Unclassified
19. SECURITY CLASSIFICATION OF ABSTRACT
Unclassified
20. LIMITATION OF ABSTRACT
UL
NSN 7540-01-280-5500 Standard Form 298 (Rev. 2-89) Prescribed by ANSI Std. Z39-18 298-102
80 CMU/SEI-91-TR-016