measurement and finance h edu 5100. quantitative perspectives the size and demographic...
Post on 21-Dec-2015
213 views
TRANSCRIPT

Measurement and Finance
H Edu 5100
Quantitative perspectives
The size and demographic characteristics of the population
The direct measures of health and ill health in a population
Use of services

Census data
Every 10 years Textbook numbers
1996 = 79.9% of lived in MSAs1980 = 78%1960 = 63%
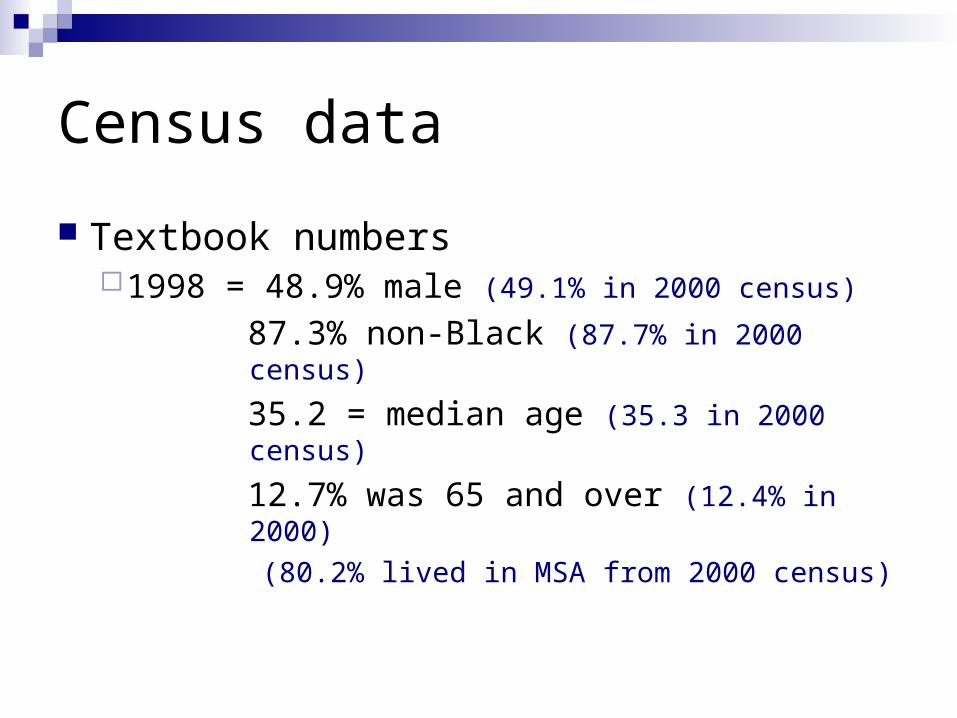
Census data
Textbook numbers1998 = 48.9% male (49.1% in 2000 census)
87.3% non-Black (87.7% in 2000 census)
35.2 = median age (35.3 in 2000 census)
12.7% was 65 and over (12.4% in 2000)
(80.2% lived in MSA from 2000 census)

Why?
What do these data tell us? Why do we need them?
Epidemiology
The study of how and why diseases are distributed in the population…
Why some get sick and some don’t

Some key words…
Study Distribution Determinants Health-related states Populations Control
1/2
1 = numerator 2= denominator
Rate
Denominator = 1,000 or 10,000 Base Comparisons

Rate
Denominator = population at risk Numerator = the events The population at risk has to be all of the
people or things that the numerator could have happened to
Remember…
The numerator has to have all the events you’re measuring
The denominator must include exactly the number that the numerator’s event could have happened to
Rates with the same base can be compared
Definitions
Risk = the probability of an unfavorable event.
Risk factors = factors associated with an increased risk of acquiring disease

Try this…
There are more drownings in Los Angeles each year than in Las Vegas.
Los Angeles must have a less adequate swimming instruction program.
Los Angeles
What’s the population at risk? Los Angeles has a much larger population
at risk. Las Vegas is in the desert, reduces the
population exposed to the risk of drowning.
Do this on your own…
A new and puzzling disease has become epidemic in the Midwest. It is significant that 80 percent of those affected live within a mile of a railroad track. It is therefore obvious that railroads must be somehow related to the disease…
What sounds best?
We reduced the rate from 2/1000 to 1/1000
We reduced the rate from 20/10,000 to 10/10,000
We reduced the rate from 2,000/2,000,000 to 1,000/1,000,000
Check-off list
Establish a problem exists Confirm the homogeneity of the events Collect all the events Characterize the events
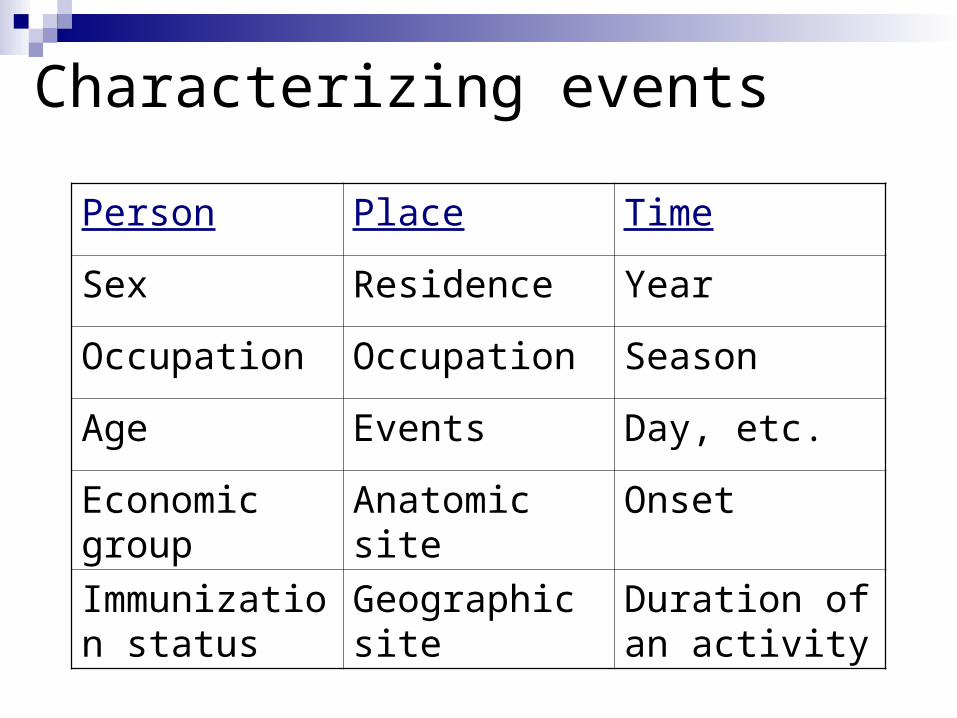
Characterizing events
Person Place Time
Sex Residence Year
Occupation Occupation Season
Age Events Day, etc.
Economic group
Anatomic site Onset
Immunization status
Geographic site
Duration of an activity
Check-off list (cont)
Look for patterns and trends Formulate an hypothesis Test the hypothesis Write up results

Epidemic Curves
Endemic = whenever diseases are regularly and continuously present
Epidemic = the occurrence of disease that clearly exceeds normal expectancy.
Pandemic = epidemic that has gone international

Pneumonia and influenza
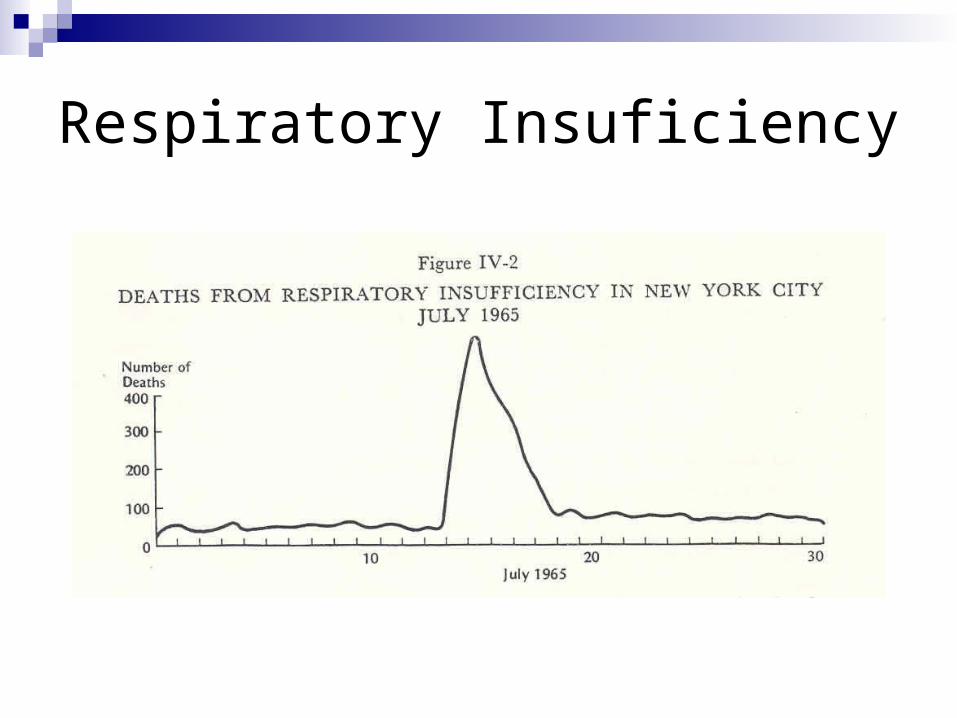
Respiratory Insuficiency
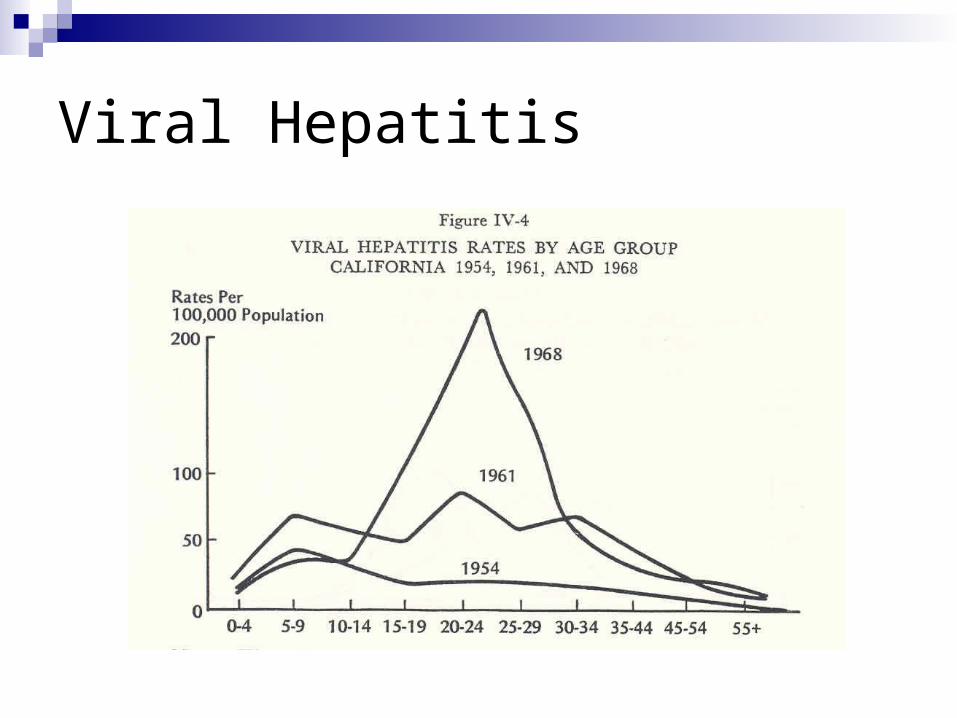
Viral Hepatitis
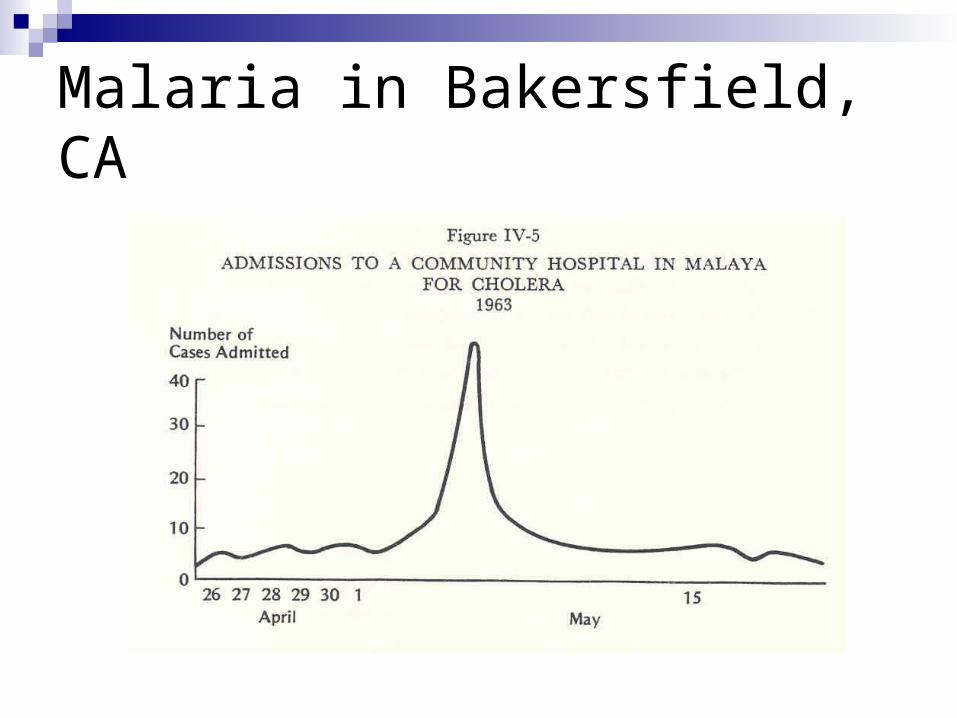
Malaria in Bakersfield, CA
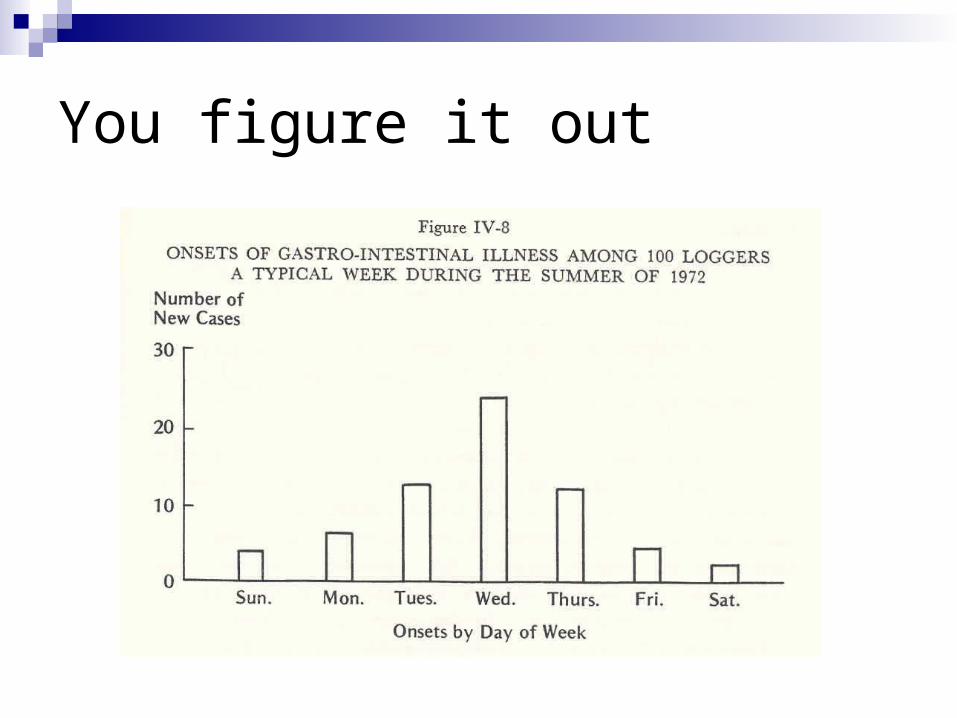
You figure it out
Incidence and prevalence
Prevalence = how many people have a disease at any one moment.
Incidence = how many incidents of the disease are just starting. The new cases.
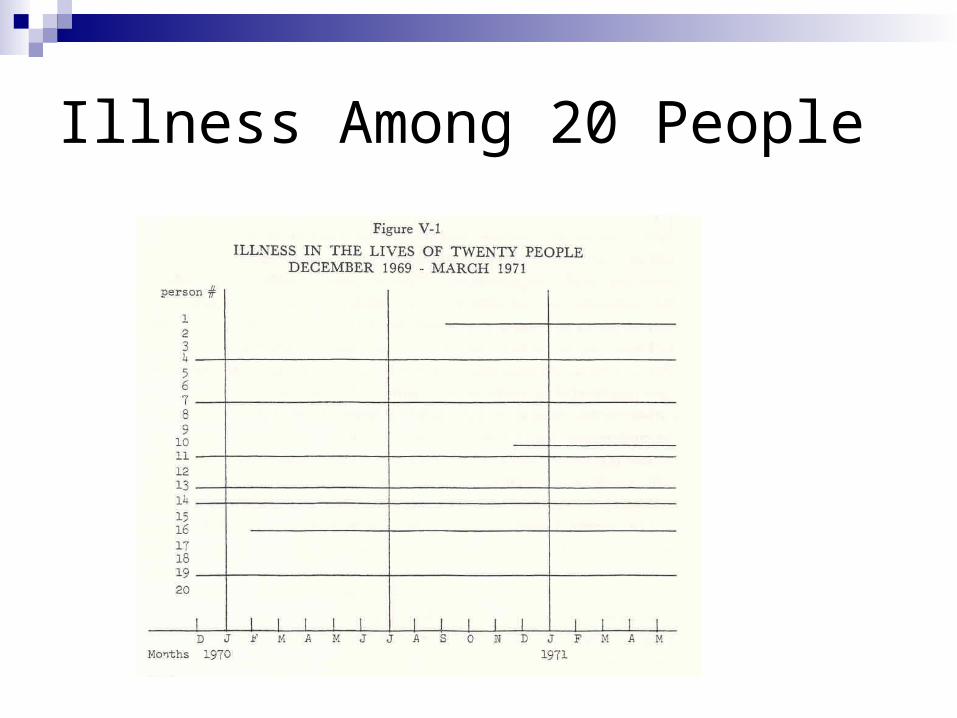
Illness Among 20 People
Figure V-1
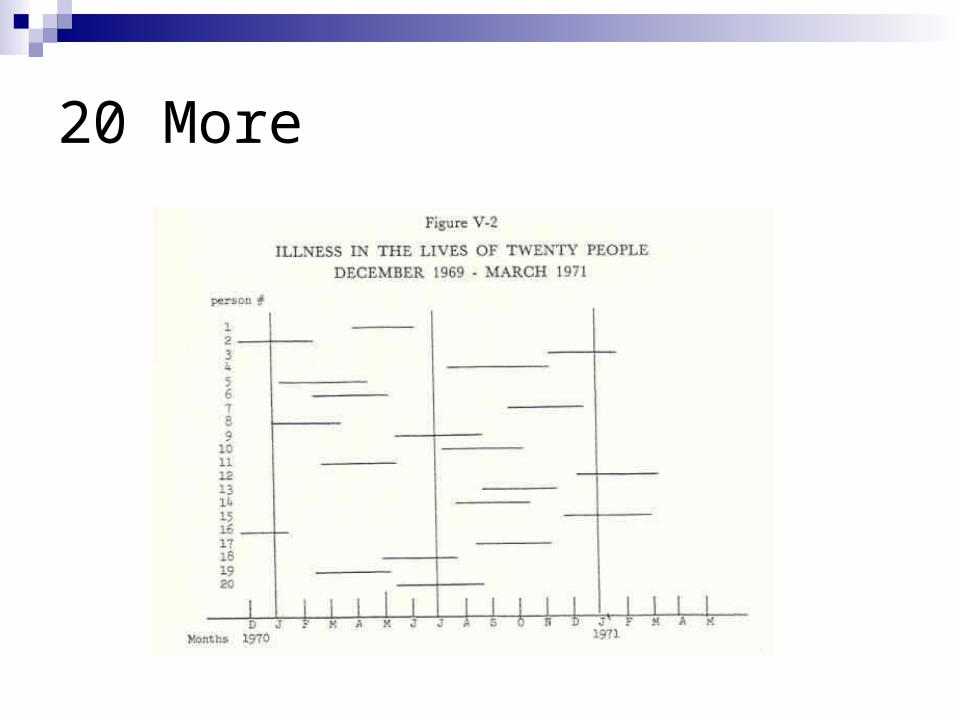
20 More
The Anteater

Anteater
At dinner 3,126 red and 5,210 black ants 3 red to 5 black ratio (not rate) Prevailing ratio in the area is 9 red and 10
black. For every 10 black ants along Random
Path, 9 red ants could come to dinner, but only 6 do.
Ant Queens
What are the odds of each ant being dinner?
Does this mean we’ll have to move? Can I handle the loss with a few more
eggs and if so, how many more eggs?
Ant Queens
Both queens kept track of the next 1,000 ants to graduate from the nursery.
By the end of the season, the ultimate fate of each was known.
Red Ant Queen
Grim Reaper visited in forms such as birds, careless feet, being sat upon, etc.
Anteater accounted for 400
Black Ant Queen
500 ended up as dinner
Direct comparison
Red ants have 80 percent of the risk that black ants have…
(400/1000 vs 500/1000) The anteater could know this…
Retrospective and Prospective
Retrospective (case control) = begin after the fact and look back
Prospective (cohort) = start with a condition in question and watch it over a period of time to see what happens

See if you understand…
The smoking histories of all patients entering a hospital with cold sores who enter the same hospital
Retrospective

See if you understand…
The physical examination records of all incoming freshmen class of 1928 at U.C. are examined to see if their recorded height and weight are related to their chance of developing coronary heart disease by 1968.
Prospective
See if you understand…
All the mothers of Grass Valley who delivered a baby in 1970 are interviewed to see if the number of colds they had during their pregnancy is related to any defects apparent at birth in their infant.
Retrospective
See if you understand…
A whole town is examined and all who are judged to be well are questioned extensively about their diet to see whether or not their eating habits will predict their risk of developing subsequent bowel cancer.
Prospective

See if you understand…
All the patients being discharged from one hospital in NYC with a diagnosis of myocardial infarction (heart attack) are characterized by certain demographic variables and compared to NYC population to see if any of these characteristics are determinants of survival from a heart attack there.
Retrospective
Cause and Association
Association = relationships which may exist between the occurrence of one thing (like a risk factor) and the occurrence of another (like a disease).
Causality …
Causality
If you have “it” and the “disease” is more likely to occur, and
When you take “it” away, the “disease” is less likely to occur, then
“it” is considered a cause of the “disease.”
Five basic criteria…
Consistency Strength Specificity Time relationship Coherence
Practice 1
During the previous year, nine residents of a community died from the same type of cancer. List some of the reasons that might justify an investigation.
Practice 1 ideas
Determine how many cases to expect Research Control and prevention Why people died Training Politics Legal concerns

Practice 2
During August, a county health department received reports of 12 new cases of tuberculosis and 12 new cases of aseptic meningitis. Tuberculosis does not have a seasonal distribution; however, aseptic meningitis, which is caused primarily by an infection, is highly seasonal, and peaks from August-October. What additional information is needed to determine whether either of these groups of cases is an outbreak?

Practice 2 ideas
How many diseases usually occur
Practice 3
You are called to help investigate a cluster of 17 men who developed leukemia in a community. Some of them worked as electrical repair men, and others were ham operators. Which study design would you choose to investigate a possible association between exposure to electromagnetic fields and leukemia?
Practice 3 ideas
Case-control Compare the 17 people already identified
with the control Were they exposed to the same
electromagnetic fields
Practice 4
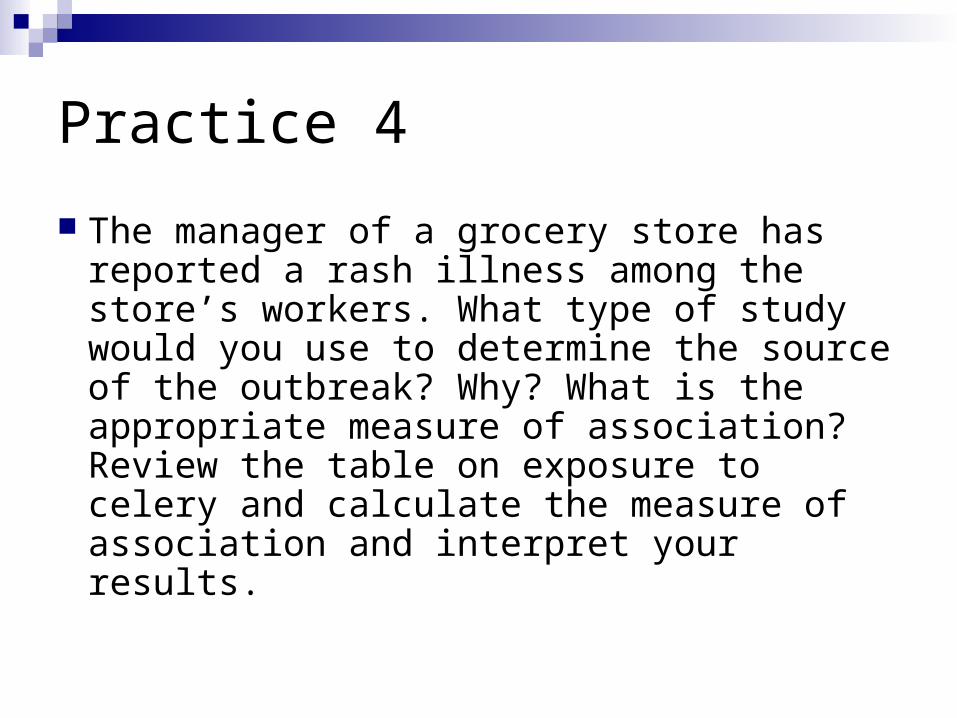
The manager of a grocery store has reported a rash illness among the store’s workers. What type of study would you use to determine the source of the outbreak? Why? What is the appropriate measure of association? Review the table on exposure to celery and calculate the measure of association and interpret your results.
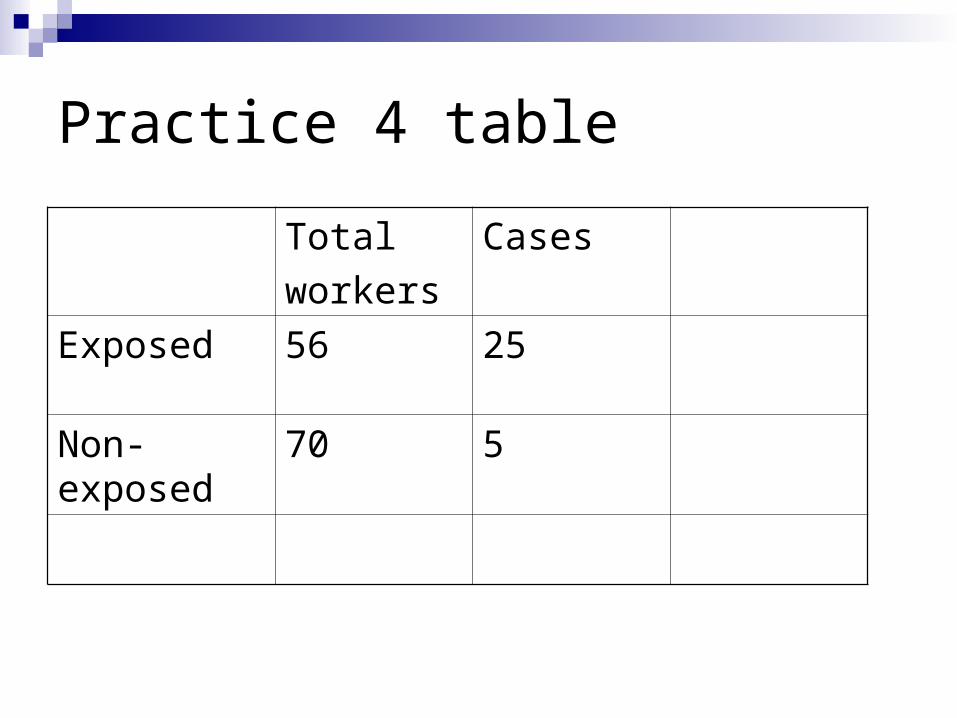
Practice 4 table
Total
workers
Cases
Exposed 56 25
Non-exposed
70 5
Practice 4 table
Total
workers
Cases Attack
rate
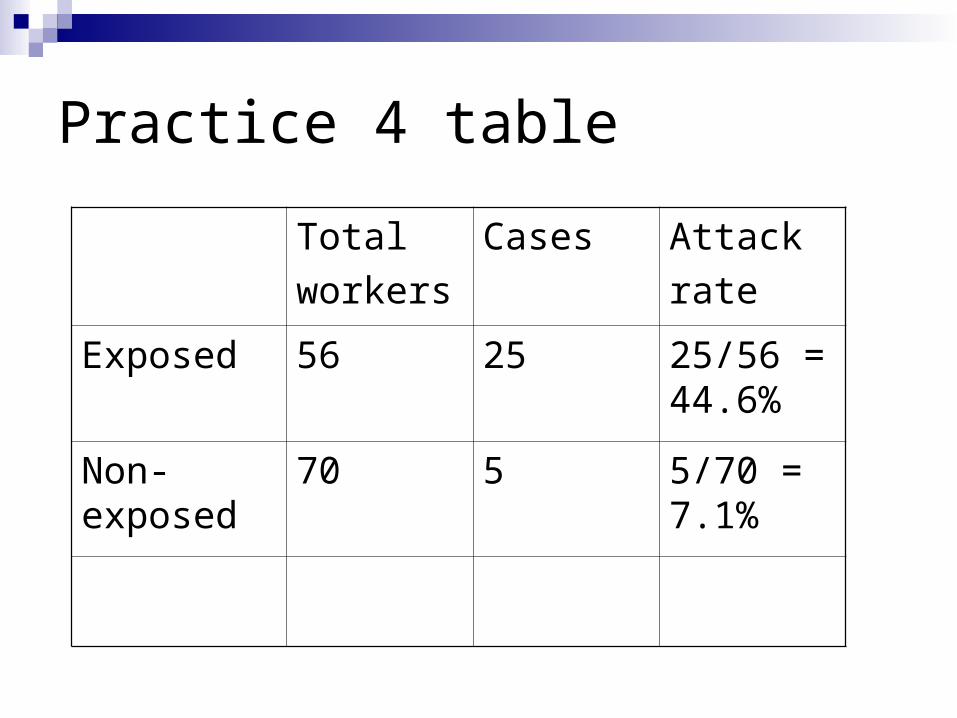
Exposed 56 25 25/56 = 44.6%
Non-exposed
70 5 5/70 = 7.1%
Practice 4 table
Total
workers
Cases Attack
rate
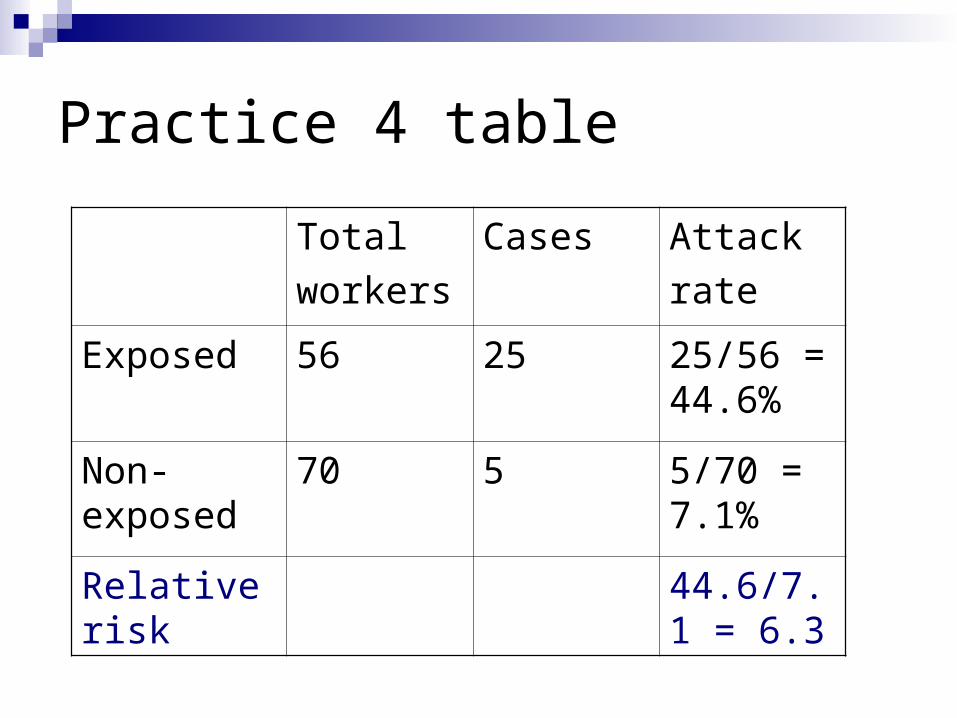
Exposed 56 25 25/56 = 44.6%
Non-exposed
70 5 5/70 = 7.1%
Relative risk
44.6/7.1 = 6.3
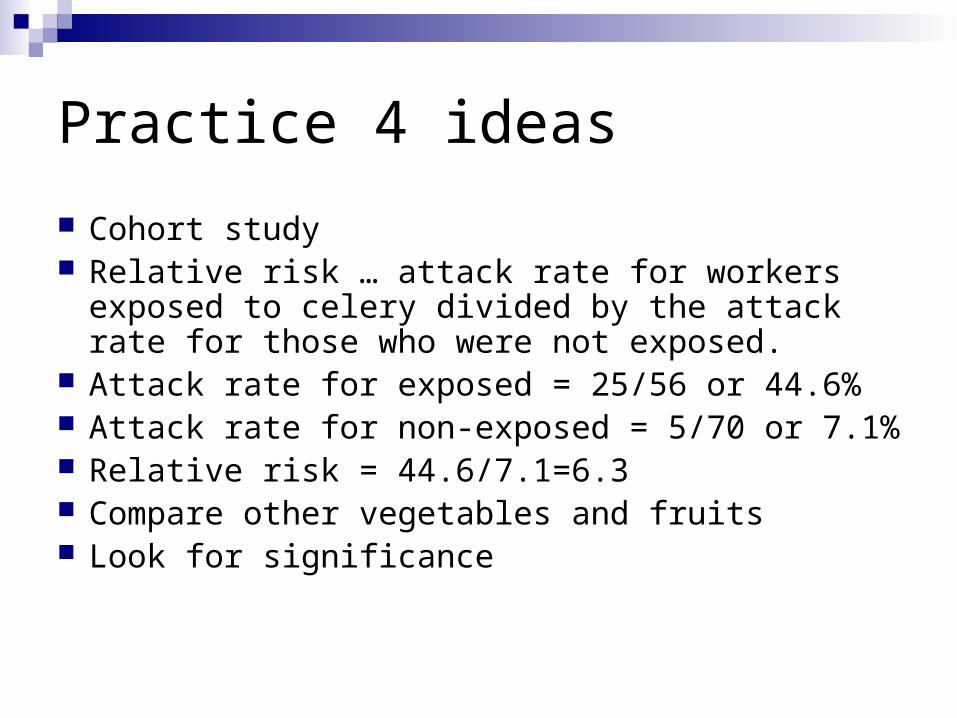
Practice 4 ideas
Cohort study Relative risk … attack rate for workers exposed to
celery divided by the attack rate for those who were not exposed.
Attack rate for exposed = 25/56 or 44.6% Attack rate for non-exposed = 5/70 or 7.1% Relative risk = 44.6/7.1=6.3 Compare other vegetables and fruits Look for significance
Vital Statistics
Births Deaths Fetal deaths Marriages Divorces
Infant Mortality
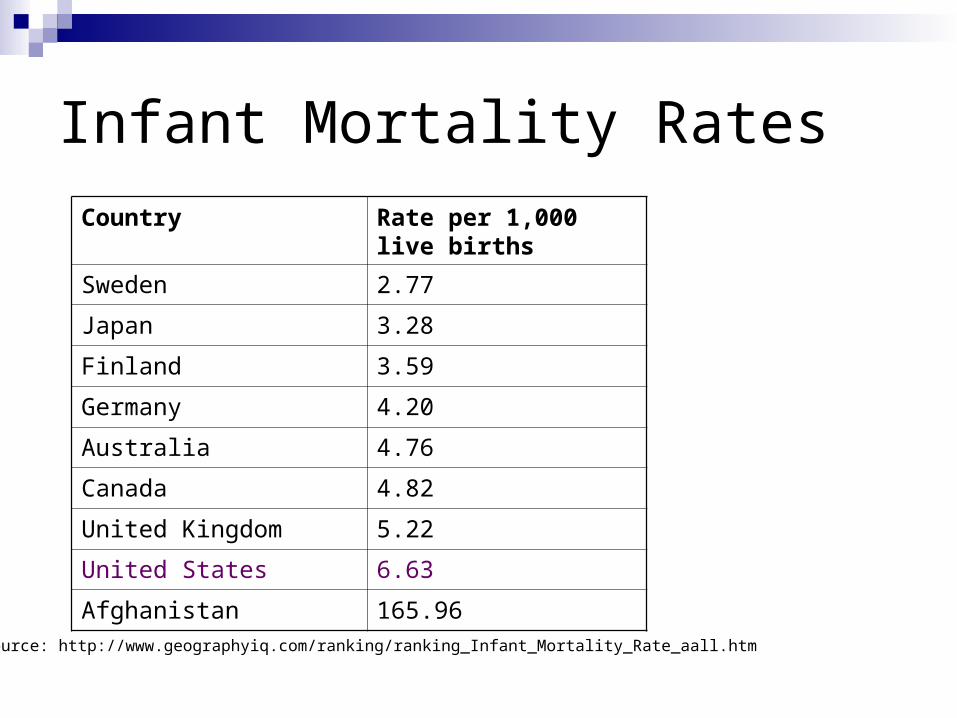
Infant Mortality Rates
Country Rate per 1,000 live births
Sweden 2.77
Japan 3.28
Finland 3.59
Germany 4.20
Australia 4.76
Canada 4.82
United Kingdom 5.22
United States 6.63
Afghanistan 165.96Source: http://www.geographyiq.com/ranking/ranking_Infant_Mortality_Rate_aall.htm
Infant Mortality Rate
Utah = 5.3 deaths per 1,000 live births

Morbidity = sickness & disease
State health department data
Health status & health-related behaviors
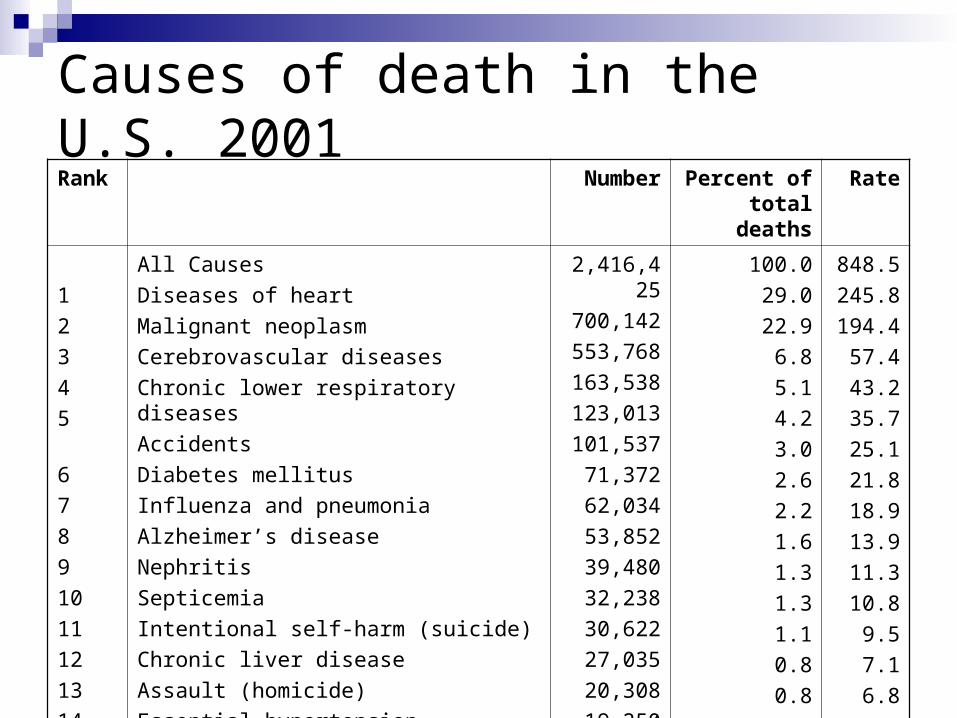
Causes of death in the U.S. 2001Rank Number Percent of
total deathsRate
1
2
3
4
5
6
7
8
9
10
11
12
13
14
All Causes
Diseases of heart
Malignant neoplasm
Cerebrovascular diseases
Chronic lower respiratory diseases
Accidents
Diabetes mellitus
Influenza and pneumonia
Alzheimer’s disease
Nephritis
Septicemia
Intentional self-harm (suicide)
Chronic liver disease
Assault (homicide)
Essential hypertension
2,416,425
700,142
553,768
163,538
123,013
101,537
71,372
62,034
53,852
39,480
32,238
30,622
27,035
20,308
19,250
100.0
29.0
22.9
6.8
5.1
4.2
3.0
2.6
2.2
1.6
1.3
1.3
1.1
0.8
0.8
848.5
245.8
194.4
57.4
43.2
35.7
25.1
21.8
18.9
13.9
11.3
10.8
9.5
7.1
6.8
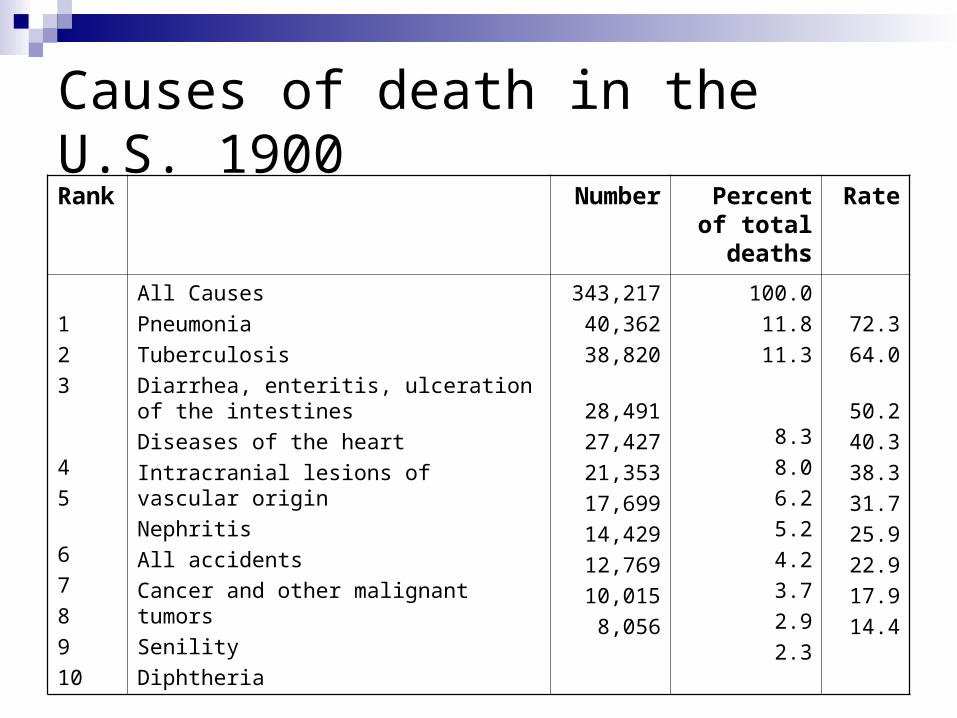
Causes of death in the U.S. 1900Rank Number Percent of
total deaths
Rate
1
2
3
4
5
6
7
8
9
10
All Causes
Pneumonia
Tuberculosis
Diarrhea, enteritis, ulceration of the intestines
Diseases of the heart
Intracranial lesions of vascular origin
Nephritis
All accidents
Cancer and other malignant tumors
Senility
Diphtheria
343,217
40,362
38,820
28,491
27,427
21,353
17,699
14,429
12,769
10,015
8,056
100.0
11.8
11.3
8.3
8.0
6.2
5.2
4.2
3.7
2.9
2.3
72.3
64.0
50.2
40.3
38.3
31.7
25.9
22.9
17.9
14.4
Healthy People 2010
Use of health care services
Hospital discharge data Health department data
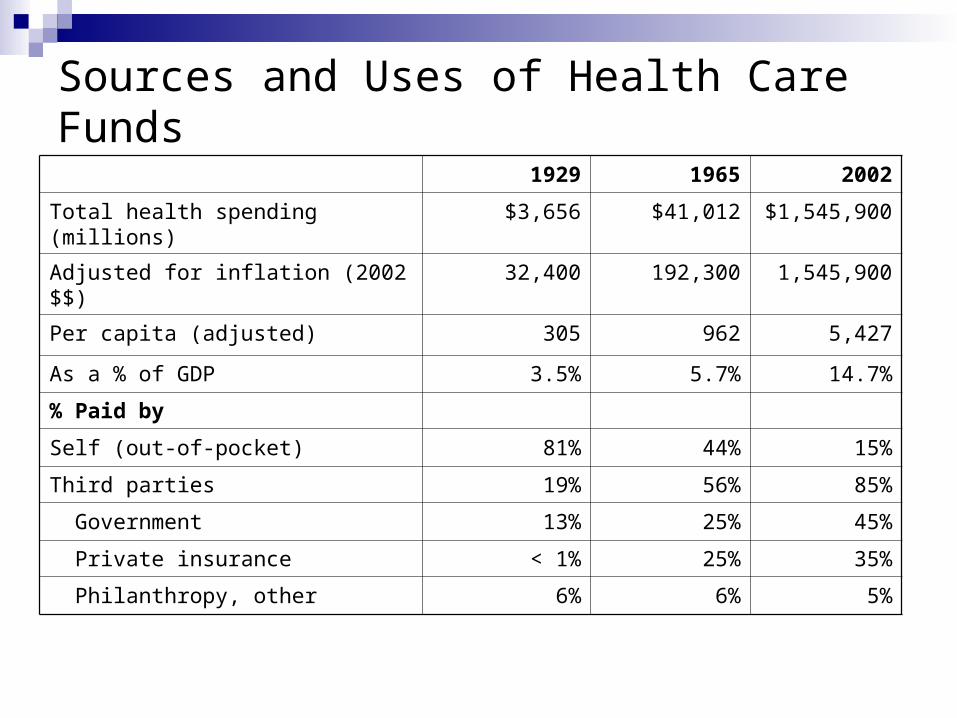
Sources and Uses of Health Care Funds
1929 1965 2002
Total health spending (millions) $3,656 $41,012 $1,545,900
Adjusted for inflation (2002 $$) 32,400 192,300 1,545,900
Per capita (adjusted) 305 962 5,427
As a % of GDP 3.5% 5.7% 14.7%
% Paid by
Self (out-of-pocket) 81% 44% 15%
Third parties 19% 56% 85%
Government 13% 25% 45%
Private insurance < 1% 25% 35%
Philanthropy, other 6% 6% 5%
Flow of funds
Exchange Two-party transaction Derived demand

Role of Government
Sources
Shift to third-party payment Payments are made from…
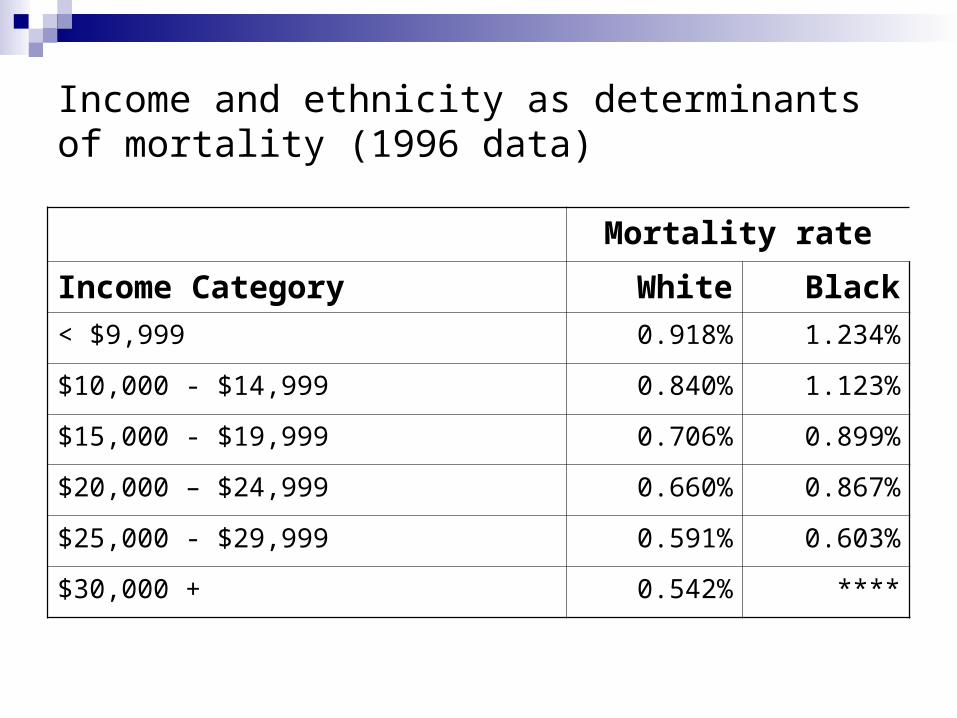
Income and ethnicity as determinants of mortality (1996 data)
Mortality rate
Income Category White Black
< $9,999 0.918% 1.234%
$10,000 - $14,999 0.840% 1.123%
$15,000 - $19,999 0.706% 0.899%
$20,000 – $24,999 0.660% 0.867%
$25,000 - $29,999 0.591% 0.603%
$30,000 + 0.542% ****

Use of funds Intensity of services Hospitals Nursing homes Doctors, nurses and other health care workers Drugs Administration Public health Research