measurement and evaluation of the …eprints.utem.edu.my/4313/1/measurement_and... · the objective...
TRANSCRIPT

MEASUREMENT AND EVALUATION OF THE
REVERBERATION TIME FOR CLASSROOMS IN UTEM
AIZAT MOHAMED ALI
This report is to fulfill the course evaluation
In
Bachelor’s Degree of Mechanical Engineering (Automotive)
Fakulti Kejuruteraan Mekanikal
Universiti Teknikal Malaysia Melaka
MAY 2008
MEASUREMENT AND EVALUATION OF THE
REVERBERATION TIME FOR CLASSROOMS IN UTEM
AIZAT BIN MOHAMED ALI
UNIVERSITI TEKNIKAL MALAYSIA MELAKA

i
I declare that this thesis entitled “Measurement and Evaluation of Reverberation Time
for Classrooms in UTEM ” is the result of my own research except as cited in the
references.
Signature :
Name : AIZAT MOHAMED ALI
Date : 13 MAY 2008
ii
ABSTRACT
Reverberation time is important in achieving the standard speech intelligibility
during lectures in UTeM’s classroom. Basically, RT60 means the time for a sound to
decay 60 dB. The decaying of sound will be affected by the materials used in the
classroom, the noise level background and the size of the classroom itself. The
reverberation time must not exceed the ANSI S12.60-2002 standard which is 0.6 or 0.7
second depending on the classroom sizes. In order to achieve this standard, calculation
and measurement need to be done on a selection of UTeM’s classroom and will be
compared to the standard. The measurements will based on the ASTM E336-97 testing
standard in order to get accurate results. As a conclusion to this project, the
reverberation time for UTeM’s classroom does not achieve the ANSI S12.60-2002
standard.
iii
ABSTRAK
Masa gema adalah penting dalam usaha mencapai piawaian kebolehupayaan
mendengar syarahan di dalam bilik kuliah di UTeM. Secara amnya, RT60 bermaksud
masa yg diambil untuk menurunkan frekuensi bunyi sebanyak 60 desibel (dB).
Penurunan ini juga disebabkan oleh jenis bahan yang digunakan di dalam bilik kuliah,
tahap kebisingan latarbelakang, dan juga saiz bilik kuliah tersebut. Masa gema haruslah
tidak melebihi masa yang telah ditetapkan oleh piawaian antarabangsa ANSI S12.60-
2002 iaitu 0.6 saat untuk kelas bersaiz kecil dan 0.7 untuk kelas bersaiz sederhana. Bagi
mencapai tahap piawaian ini, pengiraan dan pengukuran hendaklah dibuat di bilik kuliah
yang telah dipilih dan akan dibandingkan dengan tahap piawaian ANSI S12.60-2002.
Proses pengukuran akan dijalankan mengikut piawaian ASTM E336-97 dalam mencapai
keputusan yang lebih jitu. Sebagai kesimpulan kepada projek ini, didapati bahawa masa
gema bagi bilik kuliah di UTeM tidak menepati piawaian antarabangsa ANSI S12.60-
2002.
iv
ACKNOWLEDGEMENT
I would like to express my warmest appreciation and deepest gratitude, to my
supervisor, Dr. Janatul Islah bt Mohammad for her guidance and patience in giving
support and advice throughout the progress of this project. In completing this project, I
have learned much from her. Special thanks are also dedicated to Ahmad Kamal Mat
Yamin as PSM coordinator for his advice. Last but not least, I would like to thank my
family and all of my friends especially Abdullah Firdaos, Zainordin Zhafran, Mohd
Husni and Nur Farhana for the support and encouragement given to me, especially
during the hard times.
v
TABLE OF CONTENTS
DECLARATION i
ABSTRACT ii
ABSTRAK iii
ACKNOWLEDGEMENT iv
TABLE OF CONTENTS v
LIST OF TABLE viii
LIST OF FIGURE ix
CHAPTER 1: INTRODUCTION
1.1 Project Introduction 1
1.2 Problem Statement 2
1.3 Project Objective 3
1.4 Project Scope 3
1.5 Report Structure 4
1.6 Gantt Chart 5
vi
CHAPTER 2: LITERATURE REVIEW
2.1 Reverberation Time 7
2.1.1 Rationale for 60 db Reverberation Time 9
2.2 Speech Intelligibility 10
2.3 A-weighted Curve 12
2.4 Background Noise Level 13
2.5 Sound Propagation 14
2.5.1 Direct Sound 14
2.5.2 Reflection 14
2.5.3 Diffraction 14
2.6 The Sabine Equation 16
2.7 Absorption Coefficient 17
2.8 ANSI S12.60-2002 19
CHAPTER 3: RESEARCH METHODOLOGY
3.1 Selecting Measurement Location 21
3.2 Reverberation Time by Calculation 23
3.3 Reverberation Time by Measurement 24
3.4 Experimental Setup 25
3.4.1 Omni directional Calibrated Microphone 26
3.4.2 Signal Conditioning 27
3.4.2.1 Pre-Amp 27
3.4.2.2 Analog-to-Digital Converter (ADC) 28
3.4.3 Data Acquisition System (DAQ) 29
3.4.4 Audacity Procedures 30

vii
3.4.5 Experiment Procedure 31
CHAPTER 4: RESULTS AND DISCUSSION
4.1 Experiments Results 33
4.1.1 BK6 Results 33
4.1.2 BK10 Results 36
4.2 Calculation Results 42
4.2.1 BK6 Calculation 42
4.2.2 BK10 Calculation 43
4.3 Discussion 45
4.3.1 Problems Encountered 46
4.3.2 Implication of the Result 47
4.3.3 Recommendation 47
CHAPTER 5: CONCLUSION 48
REFERENCES 49
viii
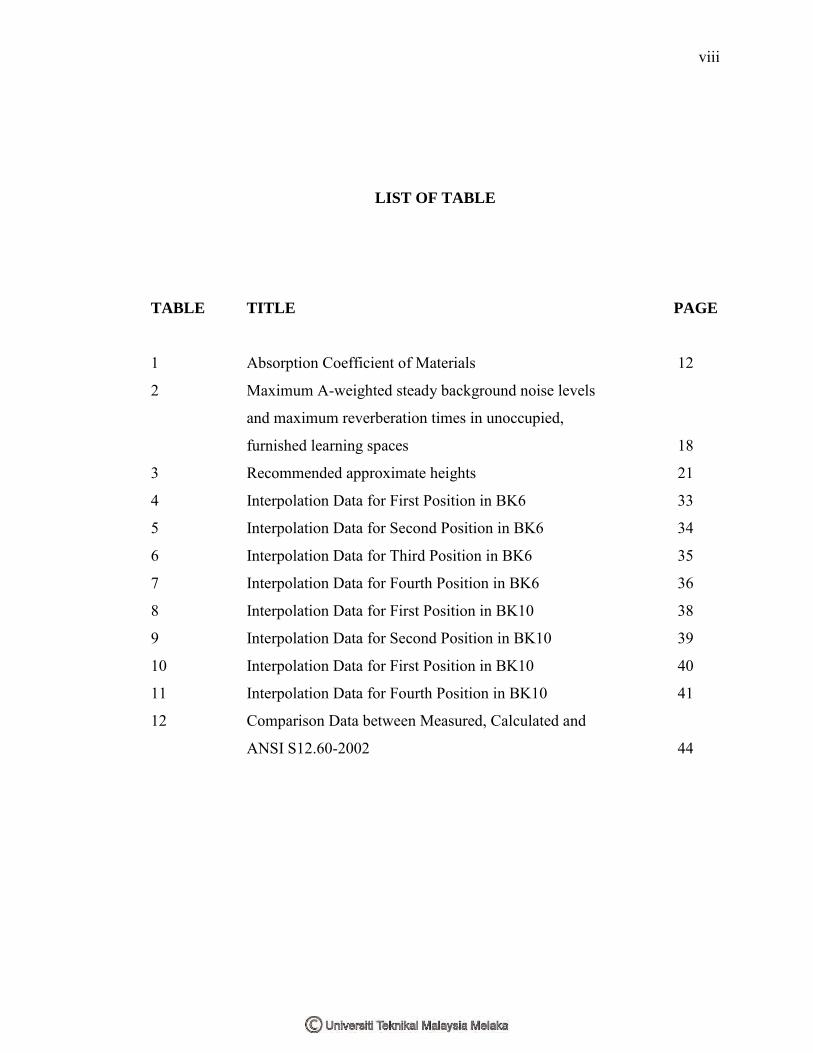
LIST OF TABLE
TABLE TITLE PAGE
1 Absorption Coefficient of Materials 12
2 Maximum A-weighted steady background noise levels
and maximum reverberation times in unoccupied,
furnished learning spaces 18
3 Recommended approximate heights 21
4 Interpolation Data for First Position in BK6 33
5 Interpolation Data for Second Position in BK6 34
6 Interpolation Data for Third Position in BK6 35
7 Interpolation Data for Fourth Position in BK6 36
8 Interpolation Data for First Position in BK10 38
9 Interpolation Data for Second Position in BK10 39
10 Interpolation Data for First Position in BK10 40
11 Interpolation Data for Fourth Position in BK10 41
12 Comparison Data between Measured, Calculated and
ANSI S12.60-2002 44

ix
LIST OF FIGURE
FIGURE TITLE PAGE
1 Sound Propagation 8
2 Relative Sound Level vs Time 10
3 SPL of Speech at 1 m 15
4 A-,B-,C- Weighting Functions 16
5 Experiment Setup Diagram 24
6 A sample of Omni Directional Microphone 25
7 A Sample of Pre-Amp 26
8 Sampling Rates 27
9 A sample of DAQ Device 28
10 Classroom Setup for BK6 31
11 Classroom Setup for BK10 31
12 Measured Data for First Position in BK6 33
13 Measured Data for Second Position in BK6 34
14 Measured Data for Third Position in BK6 35
15 Measured Data for Fourth Position in BK6 36
16 Measured Data for First Position in BK10 37
17 Measured Data for Second Position in BK10 38
18 Measured Data for Third Position in BK10 39
19 Measured Data for Fourth Position in BK10 40
1
CHAPTER1
INTRODUCTION
1.1 Project Introduction
Good acoustical qualities are essential in classrooms and other learning spaces in
which speech communication is an important part of the learning process. Excessive
background noise or reverberation in such spaces interferes with speech communication
and thus presents an acoustical barrier to learning. With good classroom acoustics, learning
is easier, deeper, more sustained, and less fatiguing. Teaching should be more effective and
less stressful with good acoustical characteristics in a classroom. There can be more verbal
interaction and less repetition between teacher and students when spoken words are clearly
understood.

2
1.2 Problem Statement
Primarily, classrooms instruction is presented through the teacher’s speech or
through video or tape recordings. According to the Signal to Noise Ratio (S/N), normal
people will have +6dB S/N which mean the speech signal must be 6dB louder than the
background disturbance in other for it to be understand. One way to improve the teaching
and learning in class is that to increase the volume of the teacher’s voice over the
background noise.
American Speech-Language-Hearing Association (ASHA) recommends that the
teacher’s voice should be 15dB above the background noise in a classroom. From previous
reports that have been studied, the actual range of S/N in a classroom is +5dB to +7dB.
Unfortunately, the background noise, teacher’s location and reverberation could vary the
range from -20dB to +5db. This poor listening environment due to S/N ratios could effect
the student’s concentration.
In order to achieve the S/N classroom standard, the reverberation time needs to be
measured. Background disturbance could lead to students loosing their attention while
learning. This will effect their exam grades thus will not create a high quality of UTEM’s
graduates. As a university that has a high potential in making big names, the standards of
reverberation time in UTEM’s classrooms should be taken seriously.
3
1.3 Project Objective
The objective of this project is to measure the reverberation time for classrooms in
UTEM whether it achieves the standard reverberation time for classrooms specified by
ANSI S12.60-2002. The quality of teaching and learning in classrooms is important in
order to achieve the UTEM’s vision which is to be one of the world’s leading innovative
and creative technical universities. Besides that, the purpose of this project is to suggest
improvements that need to be made to the classrooms.
1.4 Project Scope
Initially, the problem statement of this project is determined which is to achieve the
standard speech intelligibility during lectures in UTEM’s classrooms. For that, research
and some studies about basic acoustics generally and reverberation time especially need to
be done. Previous works done will be taken as guideline in doing this project.
Measurements will be taken by setting up experiments in classrooms using basic method of
measuring the reverberation time. Software such as Audacity will be used in doing the
measurement and evaluation. Finally, suggestions in improving the classroom
reverberation time according to ANSI S12.60-2002 standard will be made.
4
1.5 Report Structure
Chapter 1 covers the project objective and scope thoroughly. This includes the
problem statements of the project on why does this project need to be carried out. The flow
process of making this report is also explained in this chapter with the help of a gantt chart.
Chapter 2 elaborates more about the basic terms of acoustics such as definitions
and other theory. This chapter will also explain in details about reverberation time
definition, terms for reverberation time that need to be considered, ANSI S12.60-2002
standard and the formulas used in calculating reverberation time.
Chapter 3 presents the method in calculating and measuring the reverberation time,
previous measurement method and the measurement equipments that will be used in this
project.
Chapter 4 will provide the experiment findings, calculation and comparison
between the measurements that have been done and ANSI S12.60-2002 standard. Also in
this chapter, discussions have been made on problems encountered and recommendations
in improving the reverberation time.
Chapter 5 is the overall conclusion of the project done which is to measure
reverberation time in UTeM’s classroom.

1.6 Gantt Chart
PSM 1 (July 2007 - September 2007)
ACTIVITIES
WEEK
1 2 3 4 5 6 7 8 9 10 11 12 13 14 15 16
TITLE SELECTION
TITLE CONFIRMATION
OBJECTIVES & SCOPE
PROBLEM STATEMENT
LITERATURE REVIEW
METHODOLOGY
CONCLUSIONS
SUBMIT DRAFT REPORT
SUBMIT FULL REPORT
PRESENTATION
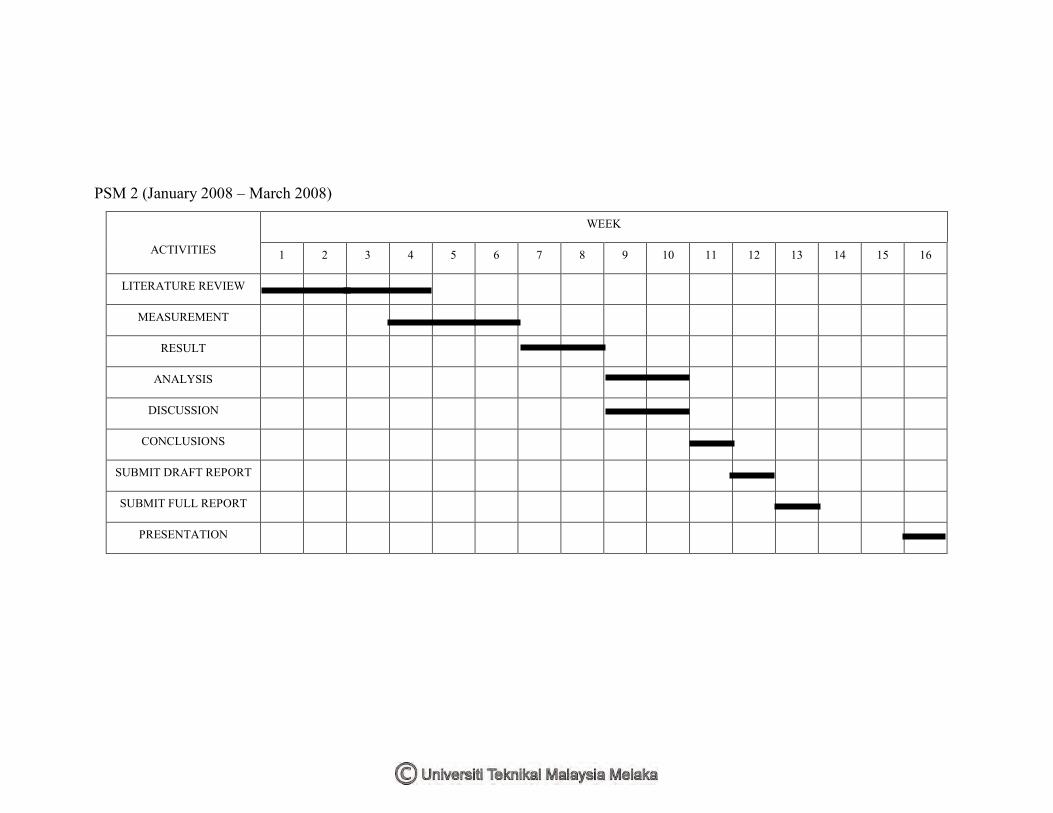
PSM 2 (January 2008 – March 2008)
ACTIVITIES
WEEK
1 2 3 4 5 6 7 8 9 10 11 12 13 14 15 16
LITERATURE REVIEW
MEASUREMENT
RESULT
ANALYSIS
DISCUSSION
CONCLUSIONS
SUBMIT DRAFT REPORT
SUBMIT FULL REPORT
PRESENTATION

7
CHAPTER 2
LITERATURE REVIEW
This chapter will provide the sound definition, the sounds characteristics,
reverberation time and the international standards for reverberation time.
2.1 Sound Propagation
As sound spreads out in an enclosures, it meets obstacles: floor, ceiling,
partitions (partial-height screens), light fixtures, furniture, etc. These obstacles change
the path of the sound. When designing an open-plan room to block sound, designers
must consider all of these paths. Figure 1 illustrates the possibility of sound propagates.
2.1.1 Direct Sound
Sound propagates outward in spheres. It spreads best when the line of sight is
clear. Placing partitions between source and receiver blocks direct propagation paths.
2.1.2 Reflection
When propagating sound meets a barrier, some of the sound energy is reflected
off the barrier (like light reflection). Sound waves can reflect off multiple surfaces,
traveling all around the room. However, with each reflection the sound is attenuated
8
because some energy is absorbed into each surface. Some surfaces are more sound
reflective than others. Sound absorbent surfaces can reduce reflected sounds in the
room.
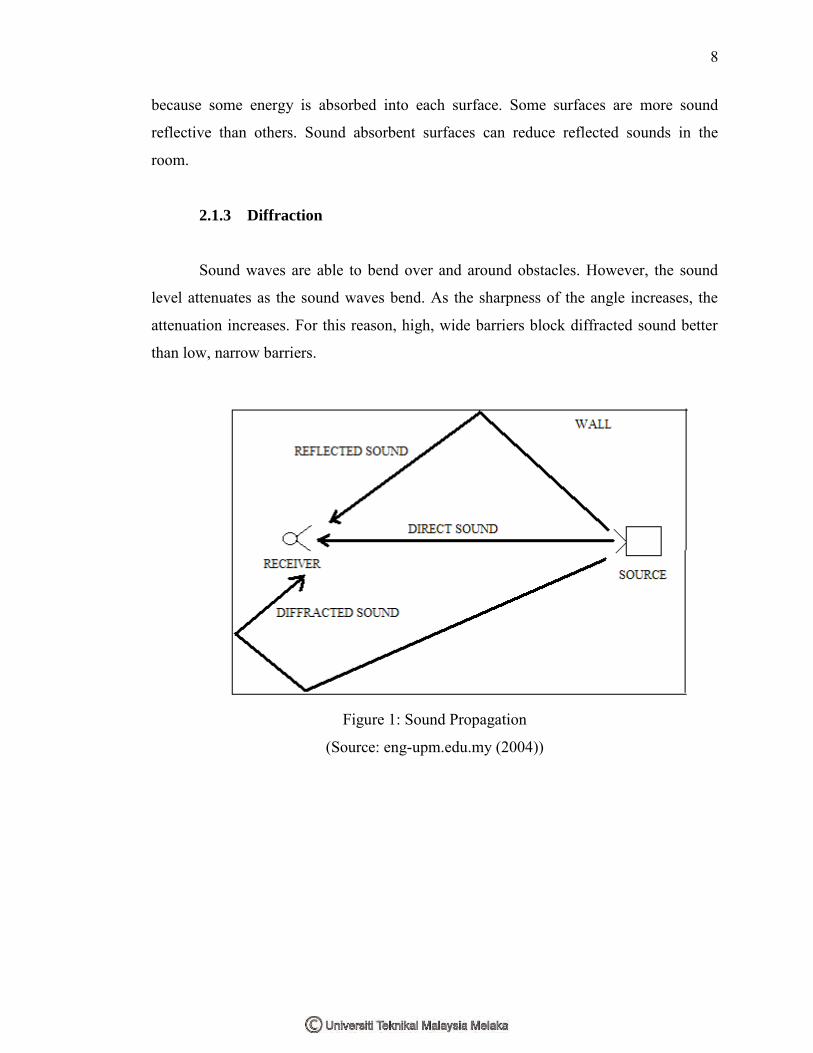
2.1.3 Diffraction
Sound waves are able to bend over and around obstacles. However, the sound
level attenuates as the sound waves bend. As the sharpness of the angle increases, the
attenuation increases. For this reason, high, wide barriers block diffracted sound better
than low, narrow barriers.
Figure 1: Sound Propagation
(Source: eng-upm.edu.my (2004))

9
2.2 Reverberation Time
Reverberation time is the time required for a sound in a room to decay by 60 dB
(called RT60). Reverberation time is defined for wide band signals. When talking about
the decay of an individual frequency, the term decay time is used.
In the late 19th century, Wallace Clement Sabine started experiments at Harvard
University to investigate the impact of absorption on the reverberation time (M. D.
Egan, 1998). Using a portable wind chest and organ pipes as a sound source, a
stopwatch and a clean pair of ears he measured the time from interruption of the source
to inaudibility (roughly 60 dB). This time varies directly with the dimensions of room
but inversely as the absorption present.
The best reverberation time for a space in which music is played depends on the
size of the room and the type of music. Rooms for speech require a shorter reverberation
time than for music. A longer reverberation time can make it difficult to understand
speech. If the reverberation time from one syllable over laps the next syllable, it may
make it difficult to identify the word "Cat", "Cab", and "Cap" may all sound very
similar. If on the other hand the reverberation time is too short, tonal balance and
loudness may suffer. Reverberation effects are often used in studios to "smooth" sounds;
the effect is commonly used on vocals to help remove inconsistencies in pitch.
Basic factors that affect a room's reverberation time include the size and shape of
the enclosure as well as the materials used in the construction of the room. Every object
placed within the enclosure can also affect this reverberation time, including people and
their belongings.

10
Figure 2: Relative Sound Level vs Time
(Source: Roomacoustics.com (2005))
2.2.1 The Sabine Equation
Sabine's reverberation equation was developed in the late 1890s in an empirical
fashion. He established a relationship between the RT60 of a room, its volume, and its
total absorption (S. Bistafa and J. Bradly,2000). This is given by the equation:
RT60 = c · V (1)
Σ Sa
Where:
c = a mathematical constant measuring 0.161
V = the volume of the room in m3
S = total surface area of room in m2
a = the average absorption coefficient of room surfaces
Sa = the total absorption in Sabine

11
It is worth noting that the total absorption in Sabine (and hence reverberation
time) generally changes depending on frequency (dependent on which is defined by the
acoustic properties of the space), and that the equation does not take into account room
shape or dimensions, nor losses from the sound travelling through the air (important in
larger spaces). In general most rooms absorb less in the lower frequencies, causing a
longer decay time.
2.2.2 Absorption Coefficient
The absorption coefficient of a material is a number between 0 and 1 which
indicates the proportion of sound which is absorbed by the surface compared to the
proportion which is reflected back into the room. A large, fully open window would
offer no reflection as any sound reaching it would pass straight out and no sound would
be reflected. This would have an absorption coefficient of 1. Conversely, a thick,
smooth painted concrete ceiling would be the acoustic equivalent of a mirror, and would
have an absorption coefficient very close to 0 (E. Sala and V. Viljanen, (1995).
The effective absorbing area is a factor in determining the reverberation time of
a room. The absorption coefficient of a surface typically changes with frequency, so the
reverberation time is likewise frequency dependent. A table of absorption coefficients
can be used in calculations of reverberation time with the Sabine Equation.

12
Table 1: Absorption Coefficient of Materials
(Source: hyperphysics.gsu.edu (2005))
2.2.3 Rationale for 60 dB Reverberation Time
The reverberation time is perceived as the time for the sound to die away after
the sound source ceases, but that of course depends upon the intensity of the sound. To
have a reproducible parameter to characterize an auditorium which is independent of the
intensity of the test sound, it is necessary to define a standard reverberation time in
terms of the drop in intensity from the original level, i.e., to define it in terms of relative
intensity (D. J. MacKenzie, 1999).
Intensive and continuous learning of social, intellectual, and communication
skills occurs throughout childhood. A wide range of educational research studies has
shown that learning is predicated on the ability to communicate with spoken language,
and that language input and language proficiency form the bases for most cognitive
skills.
13
Additionally, other research has shown that perception of spoken language
provides the foundation for the ability to read and write. Communication with spoken
language is essential to most classroom learning activities. Typically, as much as 60% of
these activities involve students listening to and participating in spoken communications
with the teacher and other students (C. V. Pavlovic, 1987). The central role of spoken
language in classroom learning underscores the need for a clear communication channel
accessible to all students and teachers.