measurement and decomposition of seasonal demand...
TRANSCRIPT

1
MEASUREMENT AND DECOMPOSITION OF SEASONAL DEMAND FOR TOURISM IN
NORWAY
NIGEL HALPERN
Associate Professor in Transport and Tourism
Department of Economics, Informatics and Social Sciences
Molde University College-Specialized University in Logistics
P.O. Box 2110, 6402 Molde, Norway
Tel: +47 712 14 226, fax: +47 712 14 100
E-mail: [email protected]
Abstract
The tourism industry in Norway is characterised by strong fluctuations in demand, as it is
highly seasonal. This creates a number of challenges such as those related to the recruitment
of competent staff and the ability to develop a profitable industry. Combating seasonality and
prolonging the tourism season is often viewed as being important for reducing the challenges
associated with seasonal demand for tourism but in order to develop counter-seasonal
strategies, it is necessary to have an understanding of the seasonal concentration of demand
for tourism and the relative marginal effect of different markets.
Using Gini coefficients, this study investigates the seasonal concentration of demand for
tourism in Norway between 1999 and 2011. Seasonal concentration is investigated at both the
national and regional level. Seasonal concentration of demand in 2011 is then decomposed at
the national level according to nationality, accommodation, and main purpose of visit. The
decomposition determines the relative marginal effect that different markets have on the
seasonal concentration of demand for tourism.
The decomposition technique used in this study is based on three factors that measure the
contribution of a particular market to overall seasonal concentration; the Gini coefficient of
the market, the correlation between monthly demand for the market and overall monthly
demand, and the annual share that the market has of overall demand. Market share is arguably
the easiest of the three to change. Consequently, the decomposition technique could be used
to identify and subsequently target markets that reduce seasonal concentration (i.e. via
product development or advertising and promotional campaigns). The decomposition
technique could also be used to simulate possible outcomes of growing or contracting certain
markets.
Keywords: seasonality, measurement, Gini coefficient, decomposition, counter-
seasonal strategy, Norway.
Themes: sustainability and competitiveness (cross-cutting horizontal theme),
seasonality in tourism (vertical theme 1).

2
1. Introduction
Tourism in Norway is characterised by strong fluctuations in demand that are a consequence
of seasonal concentration. This results in a number of challenges for the Norwegian tourism
industry including the ability to generate profits and attract and retain staff at all levels.
Reducing seasonal concentration of demand for tourism is therefore a priority (e.g. see
Norwegian Ministry of Trade and Industry 2005).
In order to develop counter-seasonal strategies, it is useful to have an understanding of the
seasonal concentration of demand for tourism and the relative marginal effect of different
markets. The former identifies patterns of seasonal concentration and can be used to measure
any year-on-year changes. It can also be used to benchmark seasonal concentration in one
geographical area against that of other areas. The latter provides opportunities to target
markets that reduce (or at least minimise growth in) seasonal concentration.
This paper investigates the seasonal concentration of demand for tourism in Norway and the
relative marginal effect of different markets. Section 2 provides background to the study.
Section 3 outlines the methodological approach taken. Section 4 provides a summary of the
main findings. Section 5 provides concluding remarks.
2. Background
Tourism is an important part of the Norwegian economy. In 2011, demand for tourism in
Norway contributed 29 million commercial guest nights including at hotels and similar
establishments, campsites, cabins and hostels. Over a quarter of those guest nights were
foreign (Statistics Norway, 2012). Total expenditure by tourists in Norway was estimated to
be 106 billion Norwegian Kroner in 2009 with almost 30 per cent of total expenditure by
foreign tourists. The tourism industry employed 2.2 million full-time equivalents in 2009. The
tourism industry’s total share of Norwegian GDP and employment was 3.3 per cent and 6.3
per cent respectively in 2009 (Statistics Norway, 2012) 1
.
In its Soria Moria Declaration, the Norwegian Government states that national strategies will
be developed within the five industries where Norway has expertise or a special advantage,
and tourism is one of those five industries. One of the main tasks involved in the development
of tourism in Norway is “to ensure that further growth is converted into increased value
creation and greater profitability (Norwegian Ministry of Trade and Industry, 2005; p8)”.
There are a number of challenges facing the Norwegian tourism industry that affect its ability
to increase value creation and achieve greater profitability. One of the challenges is the
seasonal concentration of demand for tourism in Norway.
”The industry is characterised by strong fluctuations in demand, as it is
highly seasonal….. It is characterised by high labour turnover because of the
strong seasonal fluctuations in employment. Attracting staff with the required
competence at all levels is therefore a challenge for tourism enterprises. It is
also a challenge to develop a profitable travel and tourism industry….. The
development of year-round tourism may therefore be the correct strategy in
certain cases for improving profitability (Ministry of Trade and Industry,
2005; p9)”
1 Due to a revision of the Norwegian national accounts, updated results for the tourism satellite accounts were
not published for 2010 data, and have not yet been published for 2011.

3
Reducing seasonal concentration of demand for tourism is no easy matter because the causes
are usually structural in nature and are therefore difficult to change. Based on a review of
literature, Baum and Hagen (1999) identify a range of causes that can be classified into three
main categories: natural (i.e. climate), institutional (i.e. holiday periods, calendar effects and
social or business customs), and supply-side constraints (i.e. availability of labour,
accommodation and transport infrastructure). Baum and Hagen (1999) also identify the main
types of initiatives that can be used to counter seasonal concentration:
Market diversification, which can be combined with segmentation strategies, price
differentials and targeted advertising and promotional campaigns.
Product diversification, which could include the introduction of events and festivals.
Structural responses such as public sector initiatives to maintain services and access to
facilities outside of the main season.
The work by Baum and Hagen (1999) is somewhat dated however, recent works on
seasonality still tend to use their work as a starting point and conduct empirical analysis on
individual counter-seasonal strategies. For instance, Jang (2004) investigates market
segmentation solutions to seasonal tourism in Canada. Higham and Hinch (2002) investigate
how changes to sport seasons can reduce seasonal sports tourism in New Zealand. Parrilla et
al. (2007) investigates supply determinants of seasonality related to accommodation services
on the Balearic Islands in Spain.
In order to develop counter-seasonal strategies, it is useful to have an understanding of the
seasonal concentration of demand for tourism and the relative marginal effect of different
markets. The former identifies patterns of seasonal concentration and can be used to measure
any year-on-year changes. It can also be used to benchmark seasonal concentration in one
geographical area against that of other areas. The latter provides opportunities to target
markets that reduce (or at least minimise growth in) seasonal concentration.
This study investigates the seasonal concentration of demand for tourism in Norway between
1999 and 2011. Seasonal concentration is investigated at both the national and regional level.
Seasonal concentration of demand in 2011 is then decomposed at the national level according
to nationality, accommodation, and main purpose of visit. The decomposition determines the
relative marginal effect that different markets have on the seasonal concentration of demand
for tourism.
The decomposition technique used in this study is based on three factors that measure the
contribution of a particular market to overall seasonal concentration; the Gini coefficient of
the market, the correlation between monthly demand for the market and overall monthly
demand, and the annual share that the market has of overall demand. Market share is arguably
the easiest of the three to change. Consequently, the decomposition technique could be used
to identify and subsequently target markets that reduce seasonal concentration (i.e. via
product development or advertising and promotional campaigns). The decomposition
technique could also be used to simulate possible outcomes of growing or contracting certain
markets.
The methodology and approach to empirical analysis in this study is not new. It has been used
in a tourism context as a measure of seasonal concentration in previous studies including
Fernández-Moralez (2003), Fernández-Moralez and Mayorga-Toledano (2008), and Nadal et

4
al. (2004). However, every region or country is characterised by unique patterns of
seasonality and it is important for studies to be region- or country-specific. In addition,
previous studies have tended to focus on a narrow range of component markets. This study
decomposes seasonal concentration of demand according to three main components;
nationality, accommodation and main purpose of visit.
3. Methodology
The unit used to measure demand for tourism in Norway is the number of commercial guest
nights including at hotels and similar establishments, campsites, cabins and hostels. Data on
guest nights is available from Statistics Norway on a monthly basis from 1999 to 2011. Data
is disaggregated according to three types of market; nationality, accommodation, and main
purpose of visit. Nationality is disaggregated into domestic and international markets. The
international market is further disaggregated by country and provides data for 41 individual
countries worldwide. Accommodation is disaggregated into four markets; hotels and similar
establishments, campsites, cabins, and hostels. Main purpose of visit is disaggregated into
three markets; course and conference, business, and holiday and leisure. It must be noted that
data on guest nights according to main purpose of visit is only available for hotels and similar
establishments so the total number of guest nights is lower than it is for guest nights by
nationality and accommodation.
Different methods can be used to measure the seasonal concentration of demand for tourism
(e.g. see Lundtorp, 2001). Yacomis (1980) uses two methods; the coefficient of seasonal
variation and the seasonality ratio. The coefficient of seasonal variation is equal to the
standard deviation seasonal indices where the index (index = 100) is the average number of
guest nights each month. The seasonality ratio measures the ratio between the maximum
number of guest nights in a particular month versus the average number of monthly guest
nights. These two methods have been criticised (e.g. see Wanhill and Yacomis, 1980) on the
basis that they take no account of the skewness of distribution and are both influenced by
extreme values. Instead, Wanhill and Yacomis (1980) recommends the use of the Gini
coefficient.
The Gini coefficient is a measure of statistical dispersion that was first developed in 1912.
The Gini coefficient was, and still is, commonly used in an economics context as a measure of
income inequality in society (e.g. see OECD, 2008). It is commonly used in a tourism context
as a measure of seasonal concentration (e.g. see Fernández-Moralez, 2003; Fernández-
Moralez and Mayorga-Toledano, 2008; Nadal et al., 2004). There are different ways of
calculating the Gini coefficient (e.g. see Xu, 2003) but a simple formula applied to tourism
and used in this study is represented by formula 1.
.10
11
N
i
iiii XXYYG (1)
X is the cumulative number of months in a year and Y is the cumulative number of guest
nights in each month (both X and Y are in fractions). N is the number of observations.
The Gini coefficient ( G ) will be a value of between 0 (perfect equality between months) and
1 (perfect inequality between months).
The benefits of the Gini coefficient are that unlike the seasonality ratio, it is less dependent on
a maximum value and is therefore more sensitive to variations outside the peak season. It is

5
also less influenced by extreme values compared to the coefficient of seasonal variation and
the seasonality ratio.
The Gini coefficient is used in this study to measure seasonal concentration of demand for
tourism in Norway on an annual basis between 1999 and 2011 therefore providing an
understanding of the seasonal concentration of demand for tourism in Norway during the most
recent year and how it has changed over time. The Gini coefficient is not additive so in order
to investigate the relative marginal effect of different markets, it is necessary to decompose
seasonal concentration. The decomposition in this study is carried out on demand for tourism
in Norway in 2011.
The decomposition method used in this study was developed by Lerman and Yitzaki (1985)
and has been used in a tourism context by Fernández-Moralez and Mayorga-Toledano (2008).
The method has also been used by the author to carry out a decomposition of seasonal
passenger demand at airports in Spain (see Halpern, 2011). The decomposition measures the
contribution that component markets have on seasonal concentration. For instance, guest
nights can be decomposed by two markets; international ( m ¹) and domestic ( m ²) so in this
case, 2m . The nature of the decomposition is represented by formula 2.
mm
m
m
m SRGG
1
(2)
mG is the annual Gini coefficient of market m , mR is the coefficient for the correlation
between total monthly guest nights and monthly guest nights for market m , and mS is the
annual share that market m has of total annual guest nigths. The contribution that each
market ( mC ) has on seasonal concentration is therefore dependent on mG , mR and mS (i.e.
mC = mG x mR x mS ). The contribution of each market can also be expressed in relative terms
as the share of inequality of the market. This is represented by formula 3.
GSRGC mmmm / (3)
The decomposition in formula 3 allows for the calculation of the relative marginal effect (
RME ) that each market has on seasonal concentration where a proportional increment in a
market ( me ) equally distributed throughout the year will reduce or enhance seasonal
concentration in a proportion that is equal to:
1
/
G
GRS
G
eGRME mm
m
m
m (4)
meG / is the partial derivative of G with respect to me , where G is a function on ( 1m , …,
nm ).
4. Findings
6
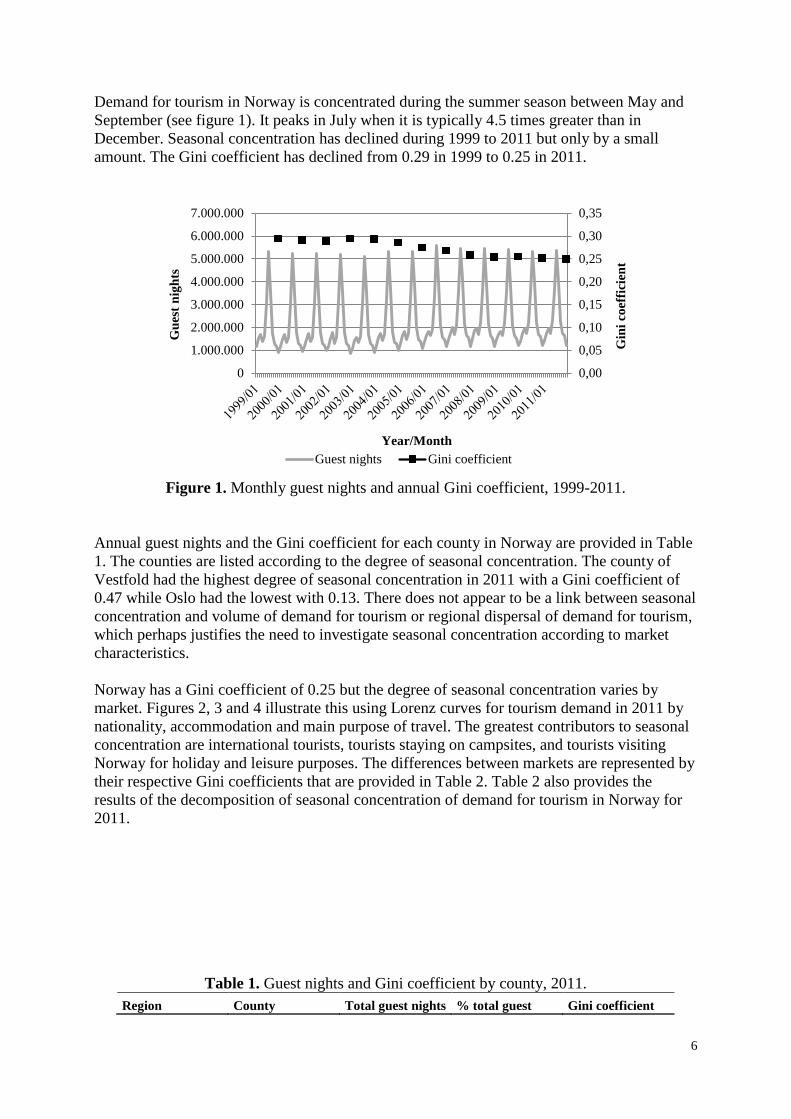
Demand for tourism in Norway is concentrated during the summer season between May and
September (see figure 1). It peaks in July when it is typically 4.5 times greater than in
December. Seasonal concentration has declined during 1999 to 2011 but only by a small
amount. The Gini coefficient has declined from 0.29 in 1999 to 0.25 in 2011.
Figure 1. Monthly guest nights and annual Gini coefficient, 1999-2011.
Annual guest nights and the Gini coefficient for each county in Norway are provided in Table
1. The counties are listed according to the degree of seasonal concentration. The county of
Vestfold had the highest degree of seasonal concentration in 2011 with a Gini coefficient of
0.47 while Oslo had the lowest with 0.13. There does not appear to be a link between seasonal
concentration and volume of demand for tourism or regional dispersal of demand for tourism,
which perhaps justifies the need to investigate seasonal concentration according to market
characteristics.
Norway has a Gini coefficient of 0.25 but the degree of seasonal concentration varies by
market. Figures 2, 3 and 4 illustrate this using Lorenz curves for tourism demand in 2011 by
nationality, accommodation and main purpose of travel. The greatest contributors to seasonal
concentration are international tourists, tourists staying on campsites, and tourists visiting
Norway for holiday and leisure purposes. The differences between markets are represented by
their respective Gini coefficients that are provided in Table 2. Table 2 also provides the
results of the decomposition of seasonal concentration of demand for tourism in Norway for
2011.
Table 1. Guest nights and Gini coefficient by county, 2011.
Region County Total guest nights % total guest Gini coefficient
0,00
0,05
0,10
0,15
0,20
0,25
0,30
0,35
0
1.000.000
2.000.000
3.000.000
4.000.000
5.000.000
6.000.000
7.000.000
Gin
i co
effi
cien
t
Gu
est
nig
hts
Year/Month
Guest nights Gini coefficient

7
nights in Norway
Eastern Norway Vestfold 1,142,638 3.9 0.47
Southern Norway Aust-Agder 676,374 2.3 0.44
Western Norway Sogn & Fjordane 1,345,561 4.6 0.44
Eastern Norway Østfold 797,615 2.7 0.39
Northern Norway Nordland 1,523,500 5.2 0.38
Northern Norway Finnmark 559,979 1.9 0.37
Southern Norway Vest-Agder 1,152,573 4.0 0.37
Western Norway Møre & Romsdal 1,420,013 4.9 0.35
Eastern Norway Telemark 1,041,568 3.6 0.32
Central Norway Nord-Trøndelag 630,980 2.2 0.28
Eastern Norway Oppland 2,774,437 9.5 0.28
Western Norway Hordaland 2,599,333 8.9 0.25
Western Norway Rogaland 1,978,238 6.8 0.22
Central Norway Sør-Trøndelag 1,604,729 5.5 0.22
Eastern Norway Hedmark 1,167,232 4.0 0.21
Northern Norway Troms 1,012,530 3.5 0.21
Eastern Norway Buskerud 2,232,551 7.7 0.19
Eastern Norway Akershus 1,615,992 5.6 0.13
Eastern Norway Oslo 3,798,470 13.1 0.13
Note. The total number of guest nights for Norway is 29,074,313 and the Gini coefficient is 0.25.
Figure 2. Lorenz curve for tourism demand in 2011 by nationality.
0
10
20
30
40
50
60
70
80
90
100
0 10 20 30 40 50 60 70 80 90 100
Cu
mu
lati
ve g
uest
nig
hts
%
Cumulative months %
Perfect equality
Domestic
Total
International

8
Figure 3. Lorenz curve for tourism demand in 2011 by accommodation.
Figure 4. Lorenz curve for tourism demand in 2011 by main purpose of travel.
Note. Data on tourism demand by main purpose of travel is only available for hotels and similar establishments.
Based on the decomposition of demand in 2011 (Table 2), the Norwegian market reduces
seasonal concentration with a relative marginal effect of -14.2 per cent. International markets
increase seasonal concentration with a relative marginal effect of 14.2 per cent. Of the
international markets, German and Dutch markets increase seasonal concentration with
relative marginal effects of 6.8 per cent and 3.8 per cent respectively. Danish, Swedish,
British, Polish and Lithuanian markets reduce seasonality although their relative marginal
effects are fairly small. Hotels and similar establishments and cabins reduce seasonal
concentration with a relative marginal effect of -27.3 per cent and -1.9 per cent respectively.
Campsites and hostels have the greatest propensity to increase seasonal concentration with a
relative marginal effect of 28.8 per cent and 0.5 per cent respectively. Business and course
and conference markets reduce seasonal concentration with relative marginal effects of -23.4
per cent and -13.0 per cent respectively. Holiday and leisure markets increase seasonal
concentration with a relative marginal effect of 36.3 per cent.
0
10
20
30
40
50
60
70
80
90
100
0 10 20 30 40 50 60 70 80 90 100
Cu
mu
lati
ve
gu
est
nig
hts
%
Cumulative months %
Perfect equality
Hotels & similar
Cabins
Total
Hostels
Campsites
0
10
20
30
40
50
60
70
80
90
100
0 10 20 30 40 50 60 70 80 90 100
Cu
mu
lati
ve
gu
est
nig
hts
%
Cumulative months %
Perfect equality
Business
Course & conference
Total
Holiday & leisure

9
Table 2. Decomposition of seasonal concentration of demand, 2011.
Market
share
Gini
correlation
Gini
coefficient
Total
gini
Concentration
contribution RME %
Nationality
Domestic 0,730 0,989 0,204 0,250 0,588 -14.2
International 0,270 0,978 0,390 0,250 0,412 14.2
-Germany 0,055 0,987 0,568 0,250 0,123 6,8
-Sweden 0,032 0,884 0,212 0,250 0,024 -0,8
-Denmark 0,029 0,116 0,405 0,250 0,005 -2,4
-Netherlands 0,026 0,991 0,627 0,250 0,063 3,8
-Great Britain 0,018 0,936 0,150 0,250 0,010 -0,8
-United States 0,011 0,991 0,394 0,250 0,017 0,6
-France 0,011 0,991 0,553 0,250 0,023 1,3
-Spain 0,009 0,975 0,581 0,250 0,020 1,1
-Poland 0,008 0,925 0,228 0,250 0,007 -0,1
-Italy 0,007 0,946 0,532 0,250 0,014 0,7
-Russia 0,006 0,877 0,464 0,250 0,010 0,4
-Finland 0,005 0,945 0,439 0,250 0,008 0,3
-Switzerland 0,005 0,999 0,570 0,250 0,011 0,6
-Japan 0,003 0,986 0,472 0,250 0,006 0,3
-Czech Republic 0,003 0,989 0,527 0,250 0,007 0,4
-China 0,003 0,945 0,550 0,250 0,007 0,3
-Belgium 0,003 0,985 0,548 0,250 0,006 0,3
-Austria 0,003 0,988 0,542 0,250 0,006 0,3
-Lithuania 0,002 0,854 0,211 0,250 0,002 -0,1
-Australia 0,002 0,975 0,397 0,250 0,003 0,1
Accommodation
Hotels & similar 0,660 0,976 0,150 0,250 0,387 -27,3
Campsites 0,278 0,979 0,520 0,250 0,566 28,8
Cabins 0,049 0,648 0,236 0,250 0,030 -1,9
Hostels 0,012 0,995 0,347 0,250 0,017 0,5
Main purpose of travel
Course & conference 0,133 0,020 0,164 0,150 0,003 -13,0
Business 0,379 0,743 0,077 0,150 0,145 -23,4
Holiday & leisure 0,489 0,959 0,273 0,150 0,852 36,3
Notes. Only the top 20 international markets (from a total of 41) are listed. Data on tourism demand by main
purpose of travel is only available for hotels and similar establishments.
Figure 1 illustrated how seasonal concentration has declined since 1999. The decline could be
due to increased year-on-year demand (which has increased from 24.4 million overnights in
1999 to 29.1 million overnights in 2011). The decline also coincides with changes in the
annual market share of a number of key markets, most notably an increase in the domestic
markets (from 68.0 per cent in 1999 to 73.0 per cent in 2011) and a corresponding decrease in
international markets. The business market has increased from 32.4 per cent in 1999 to 37.9
per cent in 2011 and the holiday and leisure market has decreased from 52.5 per cent in 1999
to 48.9 per cent in 2011. The cabins market has increased from 1.5 per cent in 1999 to 4.9 per
cent in 2011 and the hostels market has decreased from 1.6 per cent in 1999 to 1.2 per cent in

10
2011. Changes in market share of hotels and similar establishments and campsites do not
conform to the rule. However, further analysis reveals that the contribution to concentration of
the hotels and similar establishments has declined from 39.2 per cent in 1999 to 38.7 per cent
in 2011 as a consequence of demand for hotels and similar establishments becoming less
seasonally concentrated relative to other accommodation markets. This compensates to some
extent for the loss of market share.
Table 3. Changes in share of total guest nights, 1999 versus 2011.
Share of total guest nights (%)
1999 2011 Change
Nationality
Domestic 68.0 73.0 5.0
International 32.0 27.0 -5.0
Accommodation
Hotels & similar 67,6 66,0 -1,6
Campsites 29,3 27,8 -1,5
Cabins 1,5 4,9 3,4
Hostels 1,6 1,2 -0,3
Main purpose of travel
Course & conference 15,1 13,3 -1,8
Business 32,4 37,9 5,4
Holiday & leisure 52,5 48,9 -3,6
Note. Data on tourism demand by main purpose of travel is only available for hotel and similar establishments.
5. Conclusion
Using Gini coefficients, this study investigates the seasonal concentration of demand for
tourism in Norway between 1999 and 2011. Seasonal concentration of demand in 2011 is then
decomposed according to nationality, accommodation, and main purpose of visit. The study
finds that seasonal concentration has declined slightly between 1999 and 2011. Based on the
decomposition of 2011 data, the study finds that the domestic market reduces seasonal
concentration. The international market, especially the German market enhances seasonal
concentration. Hotels and similar establishments and cabins reduce seasonal concentration.
Campsites and hostels enhance seasonal concentration. Business and course and conference
markets reduce seasonal concentration. Holiday and leisure markets enhance seasonal
concentration.
The decomposition technique used in this study is based on three factors that measure the
contribution of a particular market to overall seasonal concentration; the Gini coefficient of
the market, the correlation between monthly demand for the market and overall monthly
demand, and the annual share that the market has of overall demand. Market share is arguably
the easiest of the three to change. Consequently, the decomposition technique could be used
to identify and subsequently target markets that reduce seasonal concentration (i.e. via
product development or advertising and promotional campaigns). The decomposition
technique could also be used to simulate possible outcomes of increasing or reducing certain
markets.
11
References
Fernández-Moralez, A. (2003) Decomposing seasonal concentration, Annals of Tourism
Research, 30(4), 942-956.
Fernández-Moralez, A., and Mayorga-Toledano, M.C. (2008) Seasonal concentration of the
hotel demand in Costa del Sol: a decomposition by nationalities, Tourism
Management, 29(5), 940-949.
Halpern, N. (2011) Measuring seasonal demand for Spanish airports: implications for counter-
seasonal marketing, Research in Transportation Business and Management, 1(1), 47-
54.
Nadal, J. R., Font, A.R., and Roselló, A.S. (2004) The economic determinants of seasonal
patterns, Annals of Tourism Research, 31(3), 697-711.
Norwegian Ministry of Trade and Industry (2005) Action Plan for the Travel and Tourism
Industry (Oslo: Norwegian Ministry of Trade and Industry).
OECD (2008) Growing Unequal? Income Distribution and Poverty in OECD Countries
(Paris: OECD).
Lerman, R.I., and Yitzaki, S. (1985) Income inequality effects by income. The Review of
Economics and Statistics, 67(1), 151-156.
Lundtorp, S. (2001) Measuring tourism seasonality. In T. Baum and S. Lundtorp (Eds.),
Seasonality in Tourism, pp. 23-50 (Oxford: Pergamon).
Statistics Norway (2012) Tourism Statistics 1999-2011 (Oslo: Statistics Norway).
Baum, T. and Hagen, L. (1999). Responses to seasonality: The experiences of peripheral
destinations, International Journal of Tourism Research, 1(5); 299–312.
Jang, S-C. (2004). Mitigating tourism seasonality: A quantitative approach, Annals of
Tourism Research, 31(4); 819-836.
Higham, J. and Hinch, T. (2002). Tourism, sport and seasons: the challenges and potential of
overcoming seasonality in the sport and tourism sectors, Tourism Management,
23(2);175-185.
Parrilla, J.C., Font, A.R. and Nadal, J.R. (2007). Accommodation determinants of seasonal
patterns, Annals of Tourism Research, 34(2); 422-436.
Yacomis, J. (1980). Tackling seasonality: The case of Sri Lanka, Tourism Management, 1(2);
84-98.
Wanhill, S.R.C. and Yacomis, J. (1980). Tackling seasonality: A technical note, International
Journal of Tourism Management, 1(4); 243-245.
Xu, K. (2003). How has the Literature on Gini’s Index Evolved in the Past 80 Years?
(Halifax: Dalhousie University).

12
Author: Marijana Kožul
Co-author: Ivana Brozović
Organisation: Croatian Bureau of Statistics, Tourism Department
Job Title: Senior Adviser
Job Title: Head of Department,
Address: Ilica 3, 10 000 Zagreb, Croatia
Phone: +385 1 4806 272, +385 1 4806 188
Fax: +385 14873 680
Email: [email protected], [email protected]
Title of the proposed paper: TOURISM CONGRESS AS A SPECIAL TYPE OF TOURISM
Session (theme) where the paper will be presented: Theme 1: Seasonality in Tourism
Abstract:
Since 2006. Central Bureau of Statistics conducted the regular monthly survey on congressional
tourism in the Republic of Croatia on the form TU-23. The purpose of this survey is to provide data
that will be the basis for the analysis of the situation and development of congress tourism in
Croatia, and will also serve businesses to review their position on the tourist market.
The subjects oft his survey are business meetings, incentive travels and team building programs. The
survey covers all business entities performing business meetings, incentive travels and team building
programmes (hotel and restaurant facilities, universities, concert and congress halls, fair, cultural
facilities etc.).After analysis the quality of the obtained statistical results on business meetings, the
Central Bureau of Statistics came to the conclusion that the contents of the form TU-23 should be
changed in order to comply the fundamental principles of official statistics and to
improvethequalityofstatisticaldata. In cooperation with convection and incentive bureaus in Croatia,
it was agreed of reporting on business meetings held on.
The aim of this presentation is to present a new method of monitoring congressional activity in the
Republic of Croatia.
Congressional activity extends tourist season, especially in the classic tourist destination
characterized by highly seasonal concentration of tourists. Finally, satisfied participants of congress

13
and other business meetings are the best promoters of Croatian as a tourist, business, scientific and
cultural destinations.
Keywords: seasonality, measurement, definitions, causality, geography, nichemarkets, seasonal
Adjustment
Methodology: The document will show analyses and main data from survey conducted by Croatian Bureau of Statistics.
User value/Application Context:This document can be used for deeper analyzes of the importance and posibilities of this type of Croatian tourism.
CONGRESS TOURISM IN CROATIA
Introduction
Congress tourism is an important part of business tourism in Europe. In recent years it records huge
growth in the whole world. Congress tourism contributes to the transmission and exchange of
experience and knowledge, as well as generating employment in the area of the congress site. Its
development has positive influence on tourist results in the Republic of Croatia. Due to the importance
of congress sector Croatian Bureau of Statistics conduct the regular Monthly Survey on Congresses
and Other Business Meetings in the Republic of Croatia on the Form TU-23.
The aim of this survey is to insure data which will be basis to analyze congress position and
development of the whole tourism activity in Croatia. Also, the aim is to give overview to the business
entities for their position on tourist market.
The aim of this work is to present a new method of monitoring congress activity in the Republic of
Croatia.

14
Report on business meeting (Form TU-23)
Since January 2006, the Central Bureau of Statistics has been conducting a regular monthly survey
through the TU-23 Form. The survey covers all business entities performing business meetings,
incentive travels and team building programmes (hotel and restaurant facilities, universities, fair,
cultural institutions and convention centres).
Up to 2012 the survey covers all business meetings with at least one realised overnight and all
business meetings without realised overnights attended by 20 participants or more. Report of
Business Meeting (TU-23 form) is followed by the following characteristics: name of business
meeting, type of business meeting, type of facility in which the business meeting is held, the
date of opening a business meeting, the date of closure of business meeting, number of days at
business meeting, business meeting by professional organizer, the number of participants in
business meeting (domestic and foreign), business meeting participants overnights, the
turnover of the business meeting and extra spending.
After an analysis of the quality of obtained statistical results on business meetings ( the period from
2006-2010), CBS came to the conclusion that the content of the Form TU-23 should be
changed in a way to improve data quality and and reduce the burden on reporting units (there were
problems with evidence on number of domestic and foreign participants, no punctual data of number
of participants that realised overnights due to business meeting, no data for extra consumption). In
cooperation with convention bureaus from Zagreb, Dubrovnik and Opatija the content of the TU-23
Form has been improved. CBS sent questionnaire to the report units to give their comments on
the content of the Form TU-23 for 2012. CBS got only compliments on the new TU-23 Form.
In 2012, Report on Business Meeting (TU-23 form) is based on the following characteristics:
name of business meeting, the date of opening a business meeting, the date of closure of
business meeting, business meeting by professional organizer (business meeting organised by
corporations/companies, business meetings by associations/institutions), business meetings
by type (business meeting, congress/conference, incentive, team building), business meetings
by the participants (national, international) and the number of participants at a business
meeting. Report on Business Meeting also includes data about business entities, capacities (number
of hall, auditorium and maximum number of seats).
Because of these changes in methodology, data for 2012 are not comparable with data 2006-
2011.

15
Coverage, meeting types and definitions
In creating methodology and the questionnaire CBS used “Methodological manual for statistics on
Congress and Conferences“ by Eurostat. Also, we take into consideration features that reporting units
and Croatian National Tourist Board proposed.
In order to be counted the meeting shall take place in a venue specifically contracted for the purpose.
The meeting shall have at least 10 participants. The days of the meeting do not include occupied
rooms by participants, before and after the meeting.
Congresses/conferences are meetings in which participants belonging to different places meet in
order to discuss things on a particular topic in a particular place. They can be maintained on a
regular basis (semi-annually, annually or perennial) or ad hoc (keep only once and not
repeated any more). Congresses, in most cases, last for several days and have several
simultaneous sessions. Conferences are usually of limited duration and have specific goals
and tasks
Business meetings are those business-oriented meetings in which the participants represent the same
company, corporate group, joint-venture, or client/provider relation with an orientation toward the
improvement of operations or performance under different conditions
Incentive travel is a marketing method aimed at stimulating the employees of a certain corporation and
improving the corporation’s functioning. Incentive travel is a stimulating travel given as an award to the
best employees of a certain corporation. It has replaced a classic stimulating money award etc. The
firms may thank their clients, motivate or reward their employees for their loyalty and hard work
invested in the firm’s efficiency by taking them to a nice incentive travel. Incentive programmes may
include: golfing, sailing, rafting, ballooning, archery, cycling, paintball, ATV safari etc. Incentive travel
can be national or international, organized for smaller or larger groups and can be part of a
motivational program.
Team building program is a special type of incentive travel and, at the same time, an active relaxation,
organised by agencies for employees of certain firms and institutions with the aim of boosting the team
spirit, practicing coordination and offering other incentives.

16
Professional organisers of business meetings or incentive travels are domestic and foreign
corporation/companies which aim is to make a profit (companies – joint stock company, limited
liability company, general partnership, limited partnership) and nonprofit
organizations/institutions, such as: international governmental organisations (e.g. UN, EU, EFTA,
OECD, NATO), international NGOs, the Government of the Republic of Croatia, administration,
government bodies and bodies of local and regional government and self-government units, universities,
scientific institutions, political bodies, research centers, academies, professional associations, sports
associations and other national and international non-profit organizations/institutions).
International business meeting is a business meeting which has at least 20% of participants that
are not resident in the country where the meeting takes place. In this proportion will not be
reached, the meeting shall be counted as national.
MEETING TYPES
CORPORATE
MEETINGS

17
ASSOCIATION
MEETINGS
CONGRESS/CONFERENCE
BUSINESS MEETING
INSENTIVE
TEAM BUILDING
NATIONAL
INTERNATIONAL

18
Creating of Address list
When we were creating the address list we used different sources such as: CBS Address List for
Monthly Survey on Tourist Arrivals and Tourist Nights and information about congress venues from
Convention Bureaus, Internet and professional magazines.
The address list covered 304 business entities with congress halls, but only 139 business entities
really perform business meetings, incentive arrangements and team building program’s (hotel and
restaurant facilities, universities, concert and congress halls, fairs, cultural facilities). The address list
contents: data about business entities (name, address, county, town/municipalities, and post number),
type of business entities (hotels by categories, universities, fairs, cultural institutions and others),
capacities (number of halls and seats), telephone number and mail address. We are continuously
working on better coverage of this survey.
End of year, CBS send to the report units circular letter with questionnaire (Form TU-23) and detailed
instructions for filling that questionnaire. In order to facilitate the legal obligation to submit monthly
questionnaire TU-23, CBS offers report units two possibility for sending the questionnaire:
1. Excel table - filling data TU-23 in Excel table, prepared by CBS according to Form TU-23.
Excel spreadsheet should be submitted by electronic mail. In this way data from reports TU-
23 is inserted directly into the application, for further statistical analysis.

19
2. Classical way - fulfilling the form TU-23 in paper form in duplicate. Reporting unit keeps
one copy for their own purposes and the other send to the Croatian Bureau of Statistics. In
this way data from reports TU-23 is entered manually into the application.
About 70% of the reporting unit submits Form TU-23 form in Excel and about 30% of them still
delivered in paper.
Reporting units should submit the Report on Business Meeting with data to the 10th of the
month for the previous month.
Response rate is quite satisfactory because reporting units have a legal obligation for filling up Form
TU-23. Also, CBS is very friendly and flexible concerning reporting units that do not submit the Report
on time. Although the reporting units fulfil their legal obligation to submit TU-23 Form, CBS has a
problem with the submission of a report by the deadline. Reporting units from the Address list must be
constantly reminded from CBS of the deadline, either by mail or through the phone, which makes data
collection and processing very difficult.
Survey results about Congress and Other Business Meeting in Croatia for 2012
After finishing monthly data collecting, data analysis and processing, CBS get a following data
about business entities performing business meetings, incentive arrangements and team building
programmes:
- number of business entities in which business meeting were held and their capacities, - number of meetings by type of facilities in which the meeting were held (by venues), - number of meetings by professional organiser, - number of meetings by types,
- number of meetings by participants.
In following tables are data from business entities performing business meetings, incentive
arrangements and team building programmes for period January to June 2012.
1. BUSINESS ENTITIES IN WHICH BUSINESS MEETINGS WERE HELD, JANUARY – JUNE 2012

20
Business entities Congress halls Seats
Hotels and similar accommodation facilities 122 448 46 562
Universities, fair, cultural institutions and
convention centres
7 93 15 216
Total 129 541 61 778
Source: Croatian Bureau of Statistics, 2012
In the period from January to June 2012 this survey covered 129 facilities in which business
meetings were held, of which 89% are hotels with 541 congress halls.
2. BUSINESS MEETINGS, BY TYPES OF FACILITIES IN WHICH THEY WERE HELD, JANUARY – JUNE 2012
Business meetings
Total One-day Multy-day
Business
meetings
Number
of days
at meeting
Participants Business
meetings
Number
of days
at meeting
Participants Business
meetings
Number
of days
at meeting
Participants
Hotels and similar accommodation facilities 3 182 6 926 206 305 1 674 1 674 102 334 1 508 5 252 103 971
Universities, fair, cultural institutions and
convention centres
285 416 46 845 221 221 23 586 64 195 23 259
Total 3 467 7 342 253 150 1 895 1 895 125 920 1 572 5 447 127 230
Source: Croatian Bureau of Statistics, 2012
In the period from January to June 2012 there were 3 467 business meetings held in the
Republic of Croatia, of which 1 895 business meetings were one-day (55%) and 1 572 of the
events were multi-day (45%).The total number of days at business meetings was 7 342.

21
Each meeting was held two days on average. Business meetings were attended by 253 150
participants.
Source: CBS, survey 2012
3. BUSINESS MEETINGS, BY TYPES, JANUARY – JUNE 2012
Business meetings
Total One-day Multy-day
Business
meetings
Number
of days
at meeting
Participants Business
meetings
Number
of days
at meeting
Participants Business
meetings
Number
of days
at meeting
Participants
Congress/conference 1 810 3 995 165 436 892 892 73 500 918 3 103 91 936
Business meeting 1 445 2 619 73 061 953 953 48 869 492 1 666 24 192
Incentive travel 96 357 6 870 11 11 912 85 346 5 958
Team building 116 371 7 783 39 39 2 639 77 332 5 144
Structure of business meetings, by venues, January - June
2012
Hotels and similar
accomodation
92%
Univerzities, fair, tural institutions,
and convention centres
8%

22
Total 3 467 7 342 253 150 1 895 1 895 125 920 1 572 5 447 127 230
Source: Croatian Bureau of Statistics, 2012
There are four types of business meetings by type that are monitored in this survey:
congress/conference, business meeting, incentive travel and team building.
According to the type of business meeting, the most meetings, 52%, were congresses and
conferences, 42% were business meeting, and 6% were incentive and team building. The average
number of days of multi-day congress is 3.3 days and the average number of participants in
these meetings is 100 participants.
Monthly survey on Business Meeting conduced in CBS in 2012 also shows that business meetings
last less than staying on a holiday of classic tourists. Business meetings generally last from one to four
days.
52%
42%
6% Structure of business meetings by type, January - June
2012
Congress/conference
Busines meeting
Incentive and teambuilding

23
Source: CBS, survey 2012
In the period from January – June 2012 even 55% of business meetings were one-day meeting, and
45% of business meetings were multy-day.
Source: CBS, survey 2012
Average days of bussines meetings, January - June 2012
Business meetings,
January - June 2012; One-day;
55; 55%
Business meetings,
January - June 2012; Multy-day; 45; 45%
Business meetings, January - June 2012

24
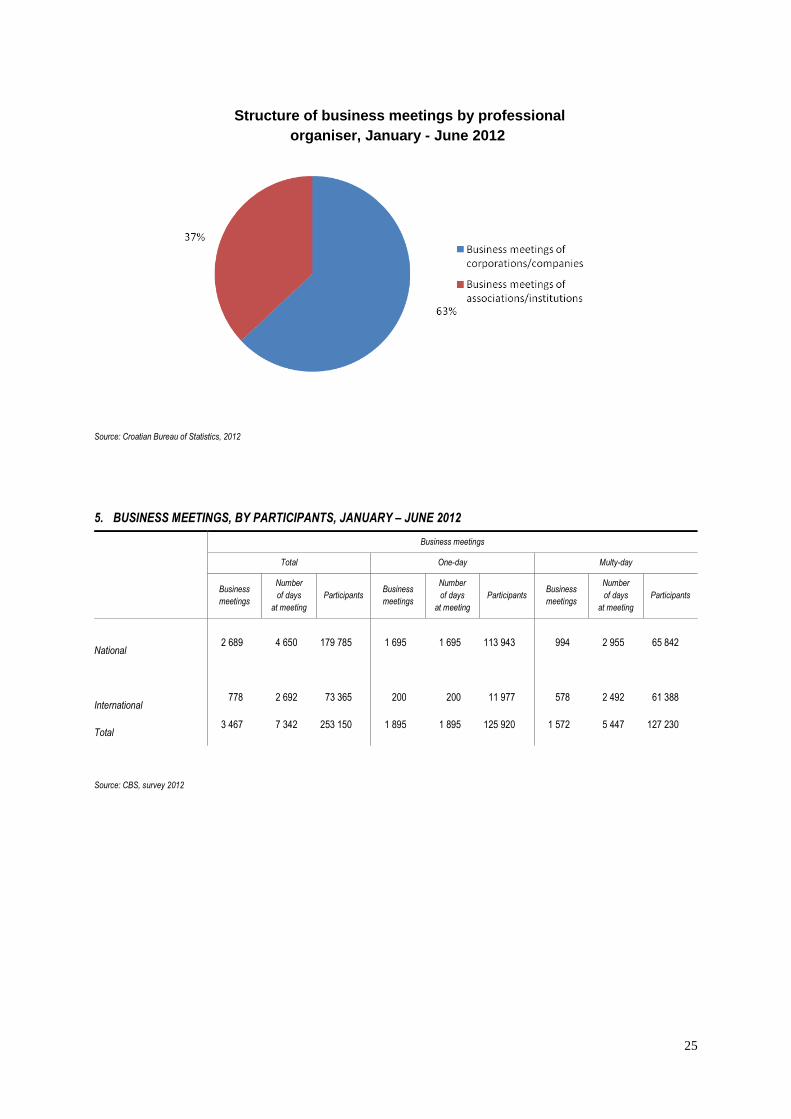
4. BUSINESS MEETINGS, BY PROFESSIONAL ORGANISER, JANUARY– JUNE 2012
Business meetings
Total One-day Multy-day
Business
meetings
Number
of days
at meeting
Participants Business
meetings
Number
of days
at meeting
Participants Business
meetings
Number
of days
at meeting
Participants
Business meetings of corporation/companies 2 182 4 424 141 500 1 236 1 236 73 961 946 3 188 67 539
Business meetings of associations/institutions 1 285 2 918 111 650 659 659 51 959 626 2 259 59 691
Total 3 467 7 342 253 150 1 895 1 895 125 920 1 572 5 447 127 230
Source: Croatian Bureau of Statistics, 2012
By professional organiser, 63% business meetings were organized by corporations and companies
and 37% of business meetings were organized by associations and institutions.
25
Source: Croatian Bureau of Statistics, 2012
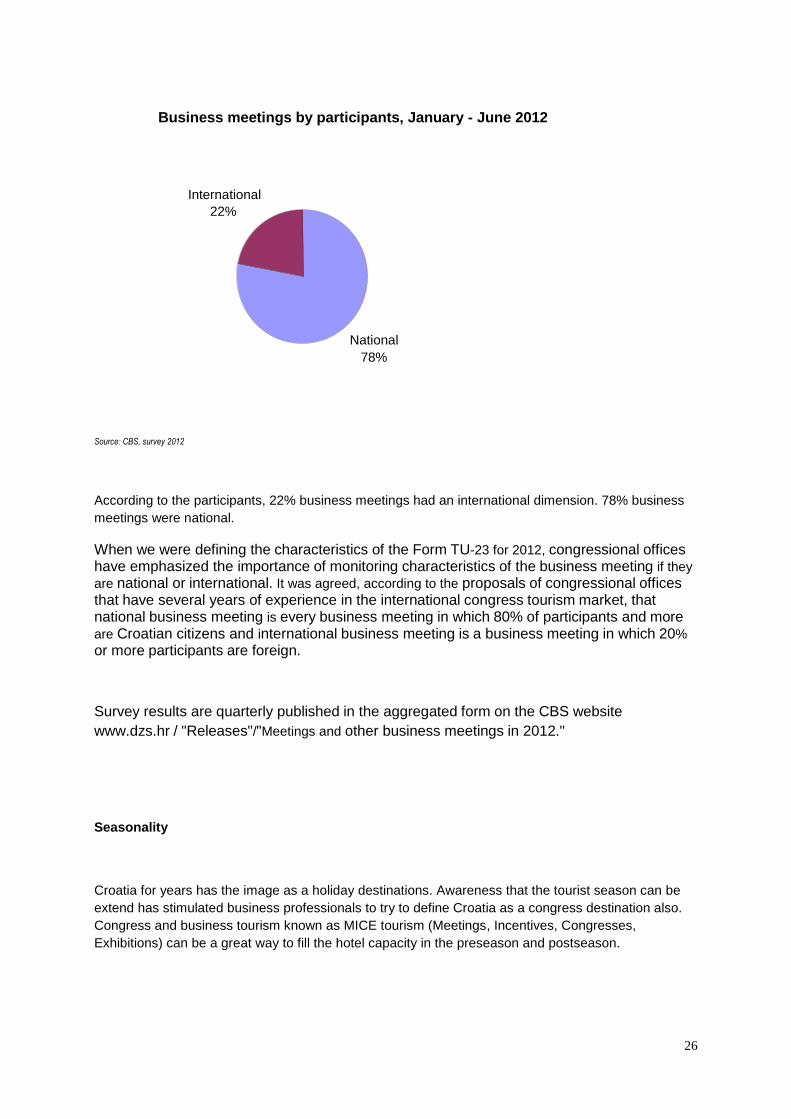
5. BUSINESS MEETINGS, BY PARTICIPANTS, JANUARY – JUNE 2012
Business meetings
Total One-day Multy-day
Business
meetings
Number
of days
at meeting
Participants Business
meetings
Number
of days
at meeting
Participants Business
meetings
Number
of days
at meeting
Participants
National 2 689 4 650 179 785 1 695 1 695 113 943 994 2 955 65 842
International 778 2 692 73 365 200 200 11 977 578 2 492 61 388
Total 3 467 7 342 253 150 1 895 1 895 125 920 1 572 5 447 127 230
Source: CBS, survey 2012
Structure of business meetings by professional
organiser, January - June 2012
Business meetings of association/institutions
8%
Business meetings of corporation/companies
92%
26
Source: CBS, survey 2012
According to the participants, 22% business meetings had an international dimension. 78% business
meetings were national.
When we were defining the characteristics of the Form TU-23 for 2012, congressional offices
have emphasized the importance of monitoring characteristics of the business meeting if they
are national or international. It was agreed, according to the proposals of congressional offices that have several years of experience in the international congress tourism market, that national business meeting is every business meeting in which 80% of participants and more
are Croatian citizens and international business meeting is a business meeting in which 20%
or more participants are foreign.
Survey results are quarterly published in the aggregated form on the CBS website
www.dzs.hr / "Releases"/"Meetings and other business meetings in 2012."
Seasonality
Croatia for years has the image as a holiday destinations. Awareness that the tourist season can be
extend has stimulated business professionals to try to define Croatia as a congress destination also.
Congress and business tourism known as MICE tourism (Meetings, Incentives, Congresses,
Exhibitions) can be a great way to fill the hotel capacity in the preseason and postseason.
Business meetings by participants, January - June 2012
National 78%
International 22%

27
Monthly survey on Business Meeting conducted for years in CBS shows that the period in May and
September has always been the most popular time to organize business meetings. The relative
popularity of July and August has been decreasing over the past five years. The popularity of March
has been increasing. The seasonal distribution of events shows that congress tourism is mainly
performed before and after the tourism season (in the spring and autumn).
Chart of Tourist nights shows that Croatia is still a holiday destination. The largest number of overnight
stays realised in the period from June to August 2012, in the summer.
In 2011, the three summer months, June, July and August, recorded the peak of tourism season.
Tourist nights realised about 75% of the total tourist nights. 2012th shows the same trend.
number of business meetings, by months 2012

28
Source: CBS, survey 2012
Cities with the most business meetings in Croatia
Business travelers are most attracted by Zagreb, Dubrovnik, Opatija, Rijeka, Osijek and Split which
recorded good results in business tourism throughout the whole year. These cities have good
geographic location, they are close to the main generating markets, have significant natural and
cultural attractions, have developed infrastructure, and have large conference halls and five star
hotels. They invest in better transport links and airports.
MUNICIPALITIES, NUMBER OF BUSINESS MEETINGS, NUMBER OF DAYS, JANUARY – JUNE 2012
Municipality Business meetings Participants Days
Zagreb 1 725 137 534 2 669
Dubrovnik 227 16 621 845
Opatija 196 18 886 574
Rijeka 199 10 970 214
Osijek 165 10 058 232
TOURIST NIGHTS, BY MONTHS, AUGUST 2011 – AUGUST 2012
'000
2011. 2012.
0
2 000
4 000
6 000
8 000
10 000
12 000
14 000
16 000
18 000
20 000
22 000
VIII. IX. X. XI. XII. I. II. III. IV. V. VI. VII. VIII.
Total
Foreign tourists
Domestic tourists

29
Split 163 8 391 367
Source: CBS, survey 2012
Source: CBS, survey 2012
The largest number of meetings in the period from January to June 2012, in Croatia, was held
in the Zagreb (50%). In the period from January to June business meetings in Zagreb were
attended by 54% of the total number of participants. Zagreb is the administrative, economic,
diplomatic, and cultural center of the Croatia. From every European city, Zagreb can be
reached by plane in less than two hours.
Excellent offer in organisation of congresses, Dubrovnik makes one of the most important
destinations meeting industry in Croatia. In the spring and the autumn part of the tourist
season, Dubrovnik hosts participants of international congresses and groups with special
Number of business meetings per city, January - June 2012
Opatija
6%
Osijek
5%
Split
5%
Rijeka
6% Dubrovnik
7%
Other
23%
Zagreb
50%
Zagreb Dubrovnik Rijeka Opatija Osijek Split Other

30
programs that during this period of year achieved the great tourist results. Over the years city
established itself as a top congress center for participants 150-700 participants, making
Dubrovnik one of the most famous congress city in Europe.
Together with Zagreb and Dubrovnik, Opatija is the leading city in congress tourism in
Croatia. In the last 5 years, this city has been host to many national and international
conferences. With more than 20 hotels, a variety of restaurants and entertainment programs
and events, Opatija can already satisfy the congress organizers and business meeting
participants.
Except the existing ones, Croatia needs a new congress centers equipped by European
standards with capacities of several thousand seats. With their construction Croatia could
stand side by side with the strongest European congress cities.
Conclusion
Congress activity is very important, not only for tourism, but also it is an important activity for the
Croatian development and the economy. Congress meetings produce an exchange of
experience, knowledge and information. There are significant improvements in transport,
communication and accommodation. Congress activity also increases the international
position of cities. It extends tourist season, especially in the classic tourist destination characterized
by highly seasonal concentration of tourists.
Congress industry produces numerous of major features. First of all, occupancy of the capacity is in
the pre-season. Then it should be noted significantly greater consumption of congress
participants then the tourists on holidays. An additional advantage is that each business
meeting includes short trips so participants have a chance to see natural beauty of Croatia.

31
Satisfied participants of congress and other business meetings are the best promoters of Croatian as
a tourist, business, scientific and cultural destinations.
Therefore, great opportunities for the increasing demand for Croatia can expect in congress tourism.
Significant impact on the development of tourism in Croatia has, and must have, the congress
tourism. Croatia is an ideal destination for this type of tourism. Croatia has good transport links, good
infrastructure and supporting content such as cultural and historical heritage and natural attractions.
Due to the importance of the congress sector, statistics need to be developed to cover a
wide range of users’ requirements. Institutions and government needs statistics to analyses
the flows of congress tourism and to renovate venues to be able to accommodate a larger number
of participants of the congress in one place. Specialised agencies need statistics for monitoring
the movement of congress activities and for further development and spread of work.
Enterprises and tourism suppliers also need statistics. Therefore, statistics has to conduct
and disseminate quality data of congress activity.
In the future CBS will try to enrich the Survey on Congresses and Other Business Meetings with
new data. In association with convention and incentive bureaus CBS will try to prepare survey on
the consumption of participants in business meetings.
Finally, quality data is the base for quality business decisions, in congress industry and in the
tourism in general.

32
Understanding seasonality in peripheral regions The potentials and pitfalls of developing winter tourism in Iceland Seasonal differences in tourism are very pronounced in Iceland, especially in rural areas. During the summer months, ca. 70% of all overnight stays are registered in regions outside of the capital area, whereas in the off-season this ratio of rural regions versus capital area is reversed. One obvious consequence of this is severe under-utilization of tourism infrastructure which in turn has a negative effect both on full-time job creation and on investments, whether in infrastructure or in less tangible things such as quality development, environmental management or innovation. It may also be argued that this “bi-polar” situation has a negative effect on tourism development more generally as companies (the large majority of which are SMEs) tend to become largely “dormant” in the off-season months.
This paper will outline the terms of seasonality in the Icelandic context relating it to seasonal challenges common to peripheral and island destinations in tourism. This geographical focus on seasonality entails an understanding of Iceland’s position as a potential peripheral polar destination and to what extent this classification fits what can be observed in tourism statistics from the island. The paper draws on available statistics in Iceland to demonstrate how these can reveal seasonality dynamics through which an understanding of how destinations are constituted can be provided. Iceland’s two destination character, with the capital region on the one side and the rest of the country on the other, which statistics clearly reveal, is paramount when trying to come to terms with seasonality. Thus the paper will demonstrate the role of tourism statistics in directing policy initiatives to tackle seasonality.
In autumn 2011, the Icelandic government launched a three year marketing and promotion initiative called “Ísland Allt Árið” (Iceland - all year round) which has the primary aim of increasing visitor arrivals in Iceland during the low season(s). Most of the funds made available were earmarked for marketing campaigns which are meant to follow the lead set by the marketing campaign Inspired by Iceland. The success of the campaigns will, apparently, be monitored by the responsible government institutions. No funding, however, has yet been announced for either basic or applied research on the possibility of developing winter tourism in Iceland, its limits or potential consequences. The paper will argue that the inspirations for this campaign are drawn from the available tourism statistics but that it fails to address more fundamental issues of seasonality in a peripheral island destination. The bifurcated nature of Iceland as a destination is reflected in its industry structure and thus the paper argues for the role of niche market industry initiatives as crucial to addressing seasonality. Moreover the role of transportation and infrastructure needs to be integrated.
In order to demonstrate how these marketing initiatives and development projects need to unfold the paper concludes by demonstrating the necessity of understanding the attitudes and expectations of potential winter tourists in Iceland, their experiences and behaviours. The paper will outline possible ways to integrate these insights into tourism statistics that ultimately feed into tourism marketing and development. Keywords: Iceland, seasonality, peripherality, policy, marketing, winter

33
Authors Edward H. Huijbens Director / Reader Icelandic Tourism Research Centre / University of Akureyri Borgum v/Norðurslóð 600 Akureyri, Iceland (IS) Phone: +354 460 8930, fax: 460 8919 [email protected] Þorvarður Árnason Director Hornafjörður University Centre Nýheimar, Litlabrú 2, 780 Höfn, Iceland (IS) Phone: +354 470 8040 [email protected]

34
WHY COMBATING SEASONALITY IN NEW ZEALAND
REQUIRES A MORE COORDINATED MULTI-LAYERED
APPROACH INCLUDING COLLABORATION WITH
AIRLINES
Markus M. M. Landvogt
Professor for Information Management in Tourism, Faculty Tourism, Kempten University,
Bahnhofstraße 61, D-87435 Kempten (Allgäu), Germany. Ph. +49 831 2523 9518,
E-mail: [email protected]
Abstract
This paper analyses the seasonal variation in tourism demand in New Zealand. The tourism industry in New
Zealand faces abnormally strong seasonality for a country of its latitude and climate. In spite of a broad
understanding of the phenomenon of seasonality, tourism strategies to change travel patterns have so far had
limited effect. This paper is based on a quantitative analysis of the publicly available tourism data in New
Zealand by utilising seasonality measures such as the Gini Coefficient. By treating some of the shortcomings of
the data and the measurement methods, new insights into the phenomenon of seasonality are gained. What
seems to be an extreme seasonality problem for the tourism industry onshore is not an issue at all for airlines
flying to New Zealand. Acknowledging these facts may help to understand that only a collaborative approach in
tackling seasonality across all sectors could have the much hoped-for effect of distributing the tourism demand
more evenly.
Key words: New Zealand, Seasonality, Seasonality measures, Gini Coefficient, Collaboration in
tourism
Introduction
Seasonality in tourism is a well-known phenomenon. Academics, policymakers and especially tourism
businesses regularly deal with the issues related to seasonal imbalances in tourism demand.
However, in New Zealand, seasonality is not just a concern but the main problem facing the tourism
industry, as is well recognised by the tourism sector itself and by central government.
New Zealand’s location in the Southern hemisphere, its temperate maritime climate and its
predominantly Western culture and traditions result in the overlap of key drivers for seasonality:
summer, school and industrial holidays, as well as the Christmas/New Year break.

35
This extreme seasonality of tourism demand has a significant impact on the productivity of New
Zealand’s tourism industry. The seasonal fluctuation constrains the more efficient use of tourism
assets and also acts as a disincentive for investment and for the development of employees.
As New Zealand is an island country 1,500 kilometres from the next larger landmass, arrivals are
predominantly (99.1 per cent) by air, with the remainder at sea ports. The limited number of airports
and sea ports allows New Zealand to collect extremely accurate data on visitor arrivals and
departures. In addition, the New Zealand Commercial Accommodation Monitor provides reliable
data on seasonal distribution of tourism onshore.
This paper studies seasonality in New Zealand tourism based on accessible data from these sources.
It focuses on quantitative methods such as the Gini Coefficient to measure seasonality.
Literature review
Seasonality in tourism is not yet sufficiently understood for successful strategies to be developed
that tackle this fluctuation in demand. However, seasonality has become a central theme in practical
tourism management, policy-making and academic studies. Firstly, it is seen as a problem of the
tourism industry, where capacity utilisation has to be maximised in order to achieve profitability.
Secondly, because tourism providers naturally collaborate within the same destination and as a
single provider’s actions can have only limited impact, seasonality becomes an issue of the
destination and its policy-makers in terms of socio-economic impacts and the development of
tourism. Thirdly, seasonality is becoming a focus in the academic literature on tourism (Koenig-Lewis
& Bischoff, 2005).
BarOn (1975) defined seasonality as the effects occurring each year with more or less the same
timing and magnitude. Butler (1994) described seasonality as: “A temporal imbalance in the
phenomenon of tourism, which may be expressed in terms of dimensions of such elements as
numbers of visitors, expenditure of visitors, traffic on highways and other forms of transportation,
employment and admissions to attractions.” Other definitions focus on its causes (Hylleberg, 1992)
or on its yearly reoccurrence (Kuznet, 1933; Hartmann, 1986; Allock, 1989), or try to identify main or
peak tourism seasons (Mitchell & Murphy, 1991; Lim & McAleer, 2001).
Two main causes of seasonality in tourism have been identified: these are the natural and the
institutional causes. Natural causes relate to regular temporal variations in natural phenomena,
particularly those associated with hours of daylight, temperature, rainfall and snow (BarOn, 1975;
Hartmann, 1986; Butler, 1994; Frechtling, 2001). Institutional causes relate to temporal variations
based on social factors and legislated policies. These include the impact of religious and other public
holidays and the longer vacations of educational institutions and workplaces (usually over summer).
The calendar effects of weekdays and weekends, fixed or continuously changing holidays, and single

36
or re-occurring events also have an influence on seasonality. Clearly, natural and institutional causes
are often interlinked (Butler, 1994; Hinch & Jackson, 2000).
A majority of outdoor activities rely on natural, climate-dependent attractions. Destinations
predominantly offering natural scenery and outdoor facilities will therefore experience a much
higher influence of natural causes on seasonality.
The physical and socio-cultural factors causing seasonality might be different in the generating areas
compared to the receiving areas for tourism (Butler & Mao, 1997). Important factors in the origins of
the tourists may act as ‘push-factors’ and factors in the destination as ‘pull-factors’ (Lundtorp,
Rassing & Wanhill, 1999). In order to tackle seasonality, it is important to realise where seasonality is
generated (Butler & Mao, 1997).
Access to a destination has also an impact on seasonality. Peripheral locations, particularly islands,
experience a high level of dependency on access carriers (Baum & Hagen, 1999). Some islands, in
theory, use transport policy as a means to stimulate demand outside the main season.
According to Koenig-Lewis & Bischoff (2005), most of the academic literature dealing with the issues
of seasonality identifies demand fluctuations as a major problem which either has to be overcome,
reduced in its effects or tackled due to its economic, ecologic and socio-cultural impacts. The
economic problem is mainly identified through an inflexibility to expand resources and facilities to
meet total demand in the peak season and an under-utilisation in the off-peak season. The latter is
usually measured with an absence of cost covering or a loss of profit due to inefficient use of
capacities. Particular industries such as the accommodation sector and attractions suffer from this,
either because they cannot be relocated or because they lack an alternative use.
Other economic impacts include the effects of seasonal employment. The most important issue is the
difficulty in recruiting and employing full-time staff. Issues such as reduced time for education,
limited availability of skills, lower payment and a higher fluctuation in the tourism labour market have
an impact on both the employee and employer sides.
Ecological impacts are mainly related to negative effects through a higher concentration of visitors
during the peak season. Overcrowding and overuse result, for example, in heavy traffic and in the
exhaustion of infrastructure and of natural resources such as water supply, sewage, and air pollution.

37
Socio-cultural impacts deal with the effects of seasonal variation on the host community and the
visitors. Problems are related to infrastructure problems and quality of life, as well as to satisfaction
on the demand and supply side.
Tourism in New Zealand
New Zealand is an island country in the South-West Pacific with its administrative boundaries from
33° to 55° South latitude. It is an attractive tourist destination famed for its various beautiful
landscapes, different climate and vegetation zones, good infrastructure, outdoor lifestyle and its
surprisingly empathetic and welcoming people.
Tourism plays an important role in the New Zealand economy as it provides one in eleven jobs both
directly and indirectly. New Zealand’s tourism focus lies on incoming tourism, with international
visitors comprising 40 per cent of all commercial guest nights and contributing 16.8 per cent to the
country’s export revenues. Tourism is, besides the dairy industry, the most important export sector in a
country still regarded as a Western industrial country.
According to the Tourism Satellite Account, tourism’s direct and indirect contribution to New
Zealand’s Gross Domestic Product (GDP) reached 8.6 per cent in 2011. With currently 179,800 jobs,
9.3 per cent of the New Zealand workforce is linked to tourism (Statistics New Zealand, 2011).
For the complete year ended in June 2012, New Zealand attracted 2,635,726 international visitors,
each of these spending an average of 19.4 days in the country (Statistics New Zealand, 2012), and in
total staying for 51,133,084 nights. Based on the population of about 4.4 million people, the tourism
density is 11,600 overnights per 1,000 inhabitants per year.
New Zealand’s temperate climate – which has an average maximum air temperature in its largest city,
Auckland, ranging from 14.7°C in July to 23.7°C in February (NIVA, 2012) – has a strong influence
on seasonality. The peak tourism demand period occurs during the summer months, from
November/December through to March. The bulk of domestic tourism happens over the
Christmas/New Year period because this is the usual close-down time for schools, industry and
commerce (Collier & Latham, 2002).
For most destinations in the northern hemisphere, summer coincides with the main school and
industrial holidays. Although, both causes depend on each other, they are still seen as two drivers for
seasonality in tourism. If three causes overlap, an increased seasonality can be expected, and this is
the case for countries in the southern hemisphere with a predominantly occidental tradition such as
New Zealand. That is because the two causes of seasonality in tourism (summer, and the main school
and industrial holidays) coincide with a third major cause, the Christmas/New Year holiday.
In New Zealand, school holidays start in mid-December and last until the national holiday on 6th of
February, while industry holidays are held in the two weeks after Christmas and are sometimes
extended to the middle of January. This is because there are four national holidays within a short
space of time (December 25, December 26, January 1 and January 2, with all of these taken during
the following week if they fall on a weekend), prompting many government agencies and
commercial businesses to take the opportunity to close for one or two weeks, or even longer.

38
Tourists are well aware of the preferred seasons for travelling to New Zealand. As Lonely Planet New
Zealand says: “The warmer months between November and April are the catalyst for outdoor
exploration and this is the official high season, with the slightly cooler and less tourist-trafficked
months of October/November and April/May the best times to visit. The period around summer
(December to February) is also when Kiwis lift their spirits with numerous food and wine festivals,
concerts and sports events. June to August is the high season in skiing areas.” (Smitz, Robinson,
Rousseau & Watkins, 2004)
Since access to New Zealand happens predominantly by air (99.1 per cent), the business constraints
of airlines add another layer of complexity to the seasonality equation. So too does the fact that New
Zealanders like to travel overseas. The share of returning New Zealand residents, at 46.4 per cent of
all arrivals (2011 figures), is a similar size to inbound tourism.
The first New Zealand Tourism Strategy, New Zealand Tourism Strategy 2010, was launched in 2001
and has been widely used for tourism policy development. It stated that international visitor arrivals
follow a seasonal pattern: “Particularly holiday and VFR arrivals peak in December/January while the
off-peak occurs in May/June. Even the peak has been growing, but the percentage spread over the
year has been relatively constant, seasonality remains a key issue for the sector.” (Davies, 2001)
Consequently, seasonality was identified as one of the objectives for tourism marketing and
management, with a goal to optimise yield, seasonality and regional spread.
While this first strategy suggested positioning New Zealand as a year-round destination by
developing new products, improving asset utilisation and improving pricing strategies, the second
New Zealand Tourism Strategy 2015, launched in 2007, went even further and set a clear target for
reducing seasonality: “Increase the number of international visitors who arrive in the shoulder
season (March and April, September and October) at a rate that is 25 per cent faster than the overall
annual forecast growth rate every year between now and 2015.” (Ministry of Tourism, 2007) If it is
assumed that the decision to host the Rugby World Cup in September and October 2011,
investments in the convention sector and efforts to attract other major events had solely and
deliberately been made in line with this target, these together would have achieved the required
growth rate in the shoulder season in only two of the five years since the target was formulated.
However, when averaging the years 2007-2012, the Rugby World Cup as a one-off event would have
achieved it.
Methodology
In absence of reliable seasonal data on tourist expenses as a measure for the economic impact of
seasonality, arrivals and guest nights can be used as an approximation (Lundtorp, 2001; Nadal et al,
2009). As New Zealand is an island a significant distance away from neighbour states and as the main
mode of transportation is by air or sea, the country generates exceptional data on arrivals and

39
departures collected at the tourist access points. This paper uses mainly the publicly available data
from the International Travel and Migration (ITM) dataset and from the Commercial Accommodation
Monitor (CAM), both published by Statistics New Zealand. Both surveys provide census-like data and
are aggregated monthly, which is the preferred base on which analysis on seasonality is performed.
A variety of approaches to measure seasonality of tourism demand is both used and recommended
(Koenig-Lewis & Bischoff, 2005). Besides plotting tourism flows as monthly time series and using
different measures such as seasonality ratio, seasonality indicator and standard deviation, the Gini
Coefficient (GC) has evolved as an advantageous and therefore preferential method to measure
seasonality (Yacoumis, 1980; Wanhill, 1980; Lundtorp, 2001; Nadal et al, 2009).
The GC is derived from the Lorenz curve and measures the inequality in a population. In the tourism
case, the demand aggregated in months is regarded as the population. The GC is calculated from the
ascending ordered monthly figures ,
0
1
)12(
yn
yni
GC
n
i
i
, where
n
i
iyy1
0
and the number of time periods (Damgaard & Weiner, 2000).
From construction, the GC gives a proportion of the deviation from a uniform demand distribution. By
definition, the GC takes a value from 0 for evenly distributed demand (no seasonality) to 11/12 a total
demand happening in only one month of the year (extreme seasonality).
Most of the case studies in academic papers on tourism seasonality are based on Northern hemisphere
destinations and naturally analyse the variations across a calendar year. However, when analysing
seasonality in Southern hemisphere countries, there are good reasons for considering the year as the
twelve months starting in July. That is because the tourism season is in line with the regular temporal
variations of natural phenomena such as the temperature, so analysing variations in the tourism season
from a July start for Southern hemisphere countries avoids artificially splitting the main season and
allows more direct comparison with Northern hemisphere countries. Business decisions of scheduled
airlines, which may offer more flights in the main season or fly to a tourism destination one season but
opt out the next, are also better accounted for.
It is also known that the inconsistencies of our calendar system can cause some disturbance to seasonal
patterns when analysing monthly variations. It has been suggested, but never implemented, that
seasonal measures should be adjusted for length of month, number of weekends per month, leap years,
movable feast days, public holidays and religious festivals, or that they should be generally analysed
on the basis of weekly rather than monthly data (BarOn, 1975; Frechling, 2001; Koenig-Lewis &
Bischoff, 2005).
However, one of these calendar effects has a significant impact in the New Zealand case. February is
one of the peak months, where demand has occurred in 9.7 per cent (6.9 per cent in leap years) fewer
days than in the two adjacent months, January and March. To cater for this effect, the monthly figures
for the GC are adjusted to average daily figures per month by simply dividing the monthly figures by
the number of days of that month. This not only makes the February values more comparable to the
adjacent months, but better reflects the tourism industry’s focus on daily operations or capacity

40
utilisations rather than on monthly aggregation. For example, airlines operate routes with a certain
number of flights per day or week, rather than per month.
Findings
New Zealand’s tourism suffers from being one of the extreme cases for seasonality, where several
causes coincide. Figure 1 demonstrates this fact by comparing the seasonal variation of international
visitor arrivals with the average daily maximum air temperature as an approximation for the natural
variation of the climatic conditions. Generally, the international visitor arrivals in New Zealand seem
to follow the temperature variation throughout the year except for December, where a distinct peak for
the visitor arrivals occurs. It shows clearly that tourism in New Zealand suffers from the overlap of
natural and constitutional causes (Christmas, school and industry holidays).
Figure 1. Variation of temperature and international visitor arrivals in New
Zealand relative to the annual average
A second peak above the temperature distribution occurs in February, which is the month where
average New Zealand temperatures reach their peak. Arrivals in summer track so much above the
temperature curve that there must be months where arrivals fall below the temperature. This occurs in
the four months from March to June, clearly indicating that marketing activities could find a target in
changing the predominant anticipation of lower temperatures in that time of the year, particularly as
New Zealand autumn weather is usually quite stable and pleasant.
In July, arrivals track slightly above the temperature curve primarily because of the ski season and, to
a lesser extent, the push-factor of long summer and industry holidays in the Northern hemisphere
making it worthwhile to travel to New Zealand at that time.
The February peak would not have become obvious if the absolute monthly arrival figures had been
used. In Figure 2, average arrivals per day of each month expose that second peak in February. That
means the calendar effect does have an impact on measuring seasonality when February belongs to the
peak season. Absolute monthly figures would not necessarily show that February is one of the busiest
60%
80%
100%
120%
140%
160%
180%
Re
lati
ve t
o a
nn
ual
ave
rage
Average daily maximum air temperature in Auckland
Average daily international visitor arrivals 2010/11

41
months for tourism in New Zealand. Therefore, it makes sense to perform the analysis with adjusted
monthly data instead.
Figure 2. Calendar effect for international visitor arrivals in New Zealand
As Figure 1 indicates a strong seasonality for international arrivals into New Zealand, the GC
coefficient proves this fact. In the year ended June 2011, the GC for international arrivals was 0.156.
The linear trend line in Figure 3 indicates that seasonality for this market is almost unchanged with a
tiny upwards trending. Outbound tourism of New Zealand residents shows less seasonality than
inbound tourism when residents returning from overseas trips are considered. Interestingly, both
international traveller figures and returning residents overlap in such a way that the GC of all arrivals
is much less than for each individual market.
The seasonality for all arrivals to New Zealand is also extremely low, with a GC value of 0.075 for the
year ended June 2011 and very stable with a slight downwards trend. From all known studies on
seasonality, this is by far the lowest value for a GC (Wanhill, 1980; Lundtorp, 2001; Koenig-Lewis &
Bischoff, 2005; Tsitouras, 2004). Obviously, airlines flying to New Zealand have managed to overlap
the demand for international flights from international and domestic travellers in such a way that
seasonality does not occur as a problem for them.
The seasonality indicator as a ratio of average demand per month and maximum monthly demand of a
year (Lundtorp, 2001) can be regarded as an upper bound for the seat load factor. For the year ended
June 2011,
Figure 3. Gini Coefficient for international visitor arrivals, returning residents
and all arrivals into New Zealand
-667
1.333
3.333
5.333
7.333
9.333
11.333
13.333
0
50.000
100.000
150.000
200.000
250.000
300.000
350.000
400.000
International visitor arrivals per month
Average daily int. visitor arrivals

42
the seat occupancy for all arrivals would have been close to the value of the seasonality indicator of
82.2 per cent. It may be even higher as the ITM data does not include those travellers in transit at New
Zealand airports while connecting to another international flight. No wonder that New Zealand has
attracted 20 international airlines, of which 13 fly long-hauls. Destination New Zealand guarantees
high load factors thanks to the fitting markets of inbound and outbound tourism.
The overlap of these two markets also explains why international arrivals, on a daily basis, are higher
in December and February than in January. Residents returning from their overseas trips in the
summer period after the Christmas/New Year break displace international visitors who want to arrive
in January, therefore contributing to this double peak for international visitor arrivals.
However, while seasonality does not appear to be an issue for airlines, it is a problem for the tourism
operators onshore. In Figure 4, the GC for international guest nights at commercial accommodation
shows an even higher seasonality indicator than international visitor arrivals.
Figure 4. Gini Coefficient for international visitor arrivals, commercial
international visitor guest nights and all arrivals
y = -0,0001x + 0,075
y = 0,0003x + 0,1456
y = -0,0016x + 0,1254
0
0,04
0,08
0,12
0,16
0,2
GC
arr
ival
s o
f d
iffe
ren
t m
arke
ts
GC all arrivals GC international arrivals GC residents returns
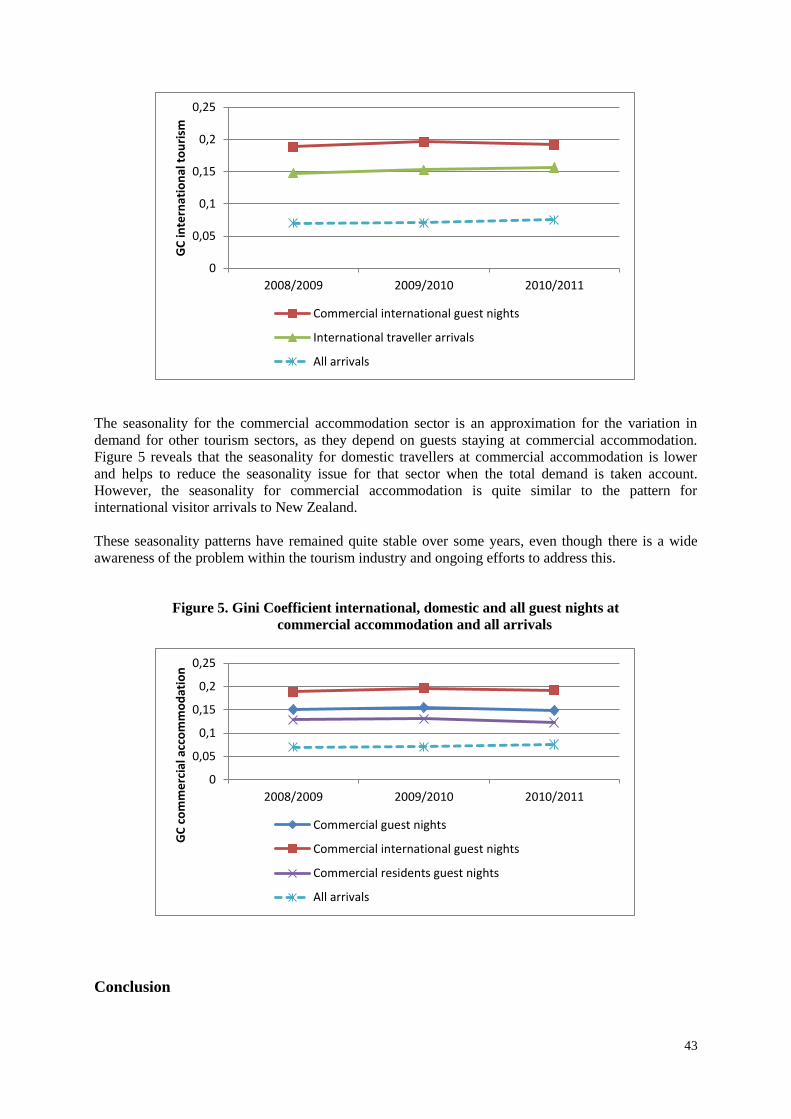
43
The seasonality for the commercial accommodation sector is an approximation for the variation in
demand for other tourism sectors, as they depend on guests staying at commercial accommodation.
Figure 5 reveals that the seasonality for domestic travellers at commercial accommodation is lower
and helps to reduce the seasonality issue for that sector when the total demand is taken account.
However, the seasonality for commercial accommodation is quite similar to the pattern for
international visitor arrivals to New Zealand.
These seasonality patterns have remained quite stable over some years, even though there is a wide
awareness of the problem within the tourism industry and ongoing efforts to address this.
Figure 5. Gini Coefficient international, domestic and all guest nights at
commercial accommodation and all arrivals
Conclusion
0
0,05
0,1
0,15
0,2
0,25
2008/2009 2009/2010 2010/2011
GC
inte
rnat
ion
al t
ou
rism
Commercial international guest nights
International traveller arrivals
All arrivals
0
0,05
0,1
0,15
0,2
0,25
2008/2009 2009/2010 2010/2011
GC
co
mm
erc
ial a
cco
mm
od
atio
n
Commercial guest nights
Commercial international guest nights
Commercial residents guest nights
All arrivals
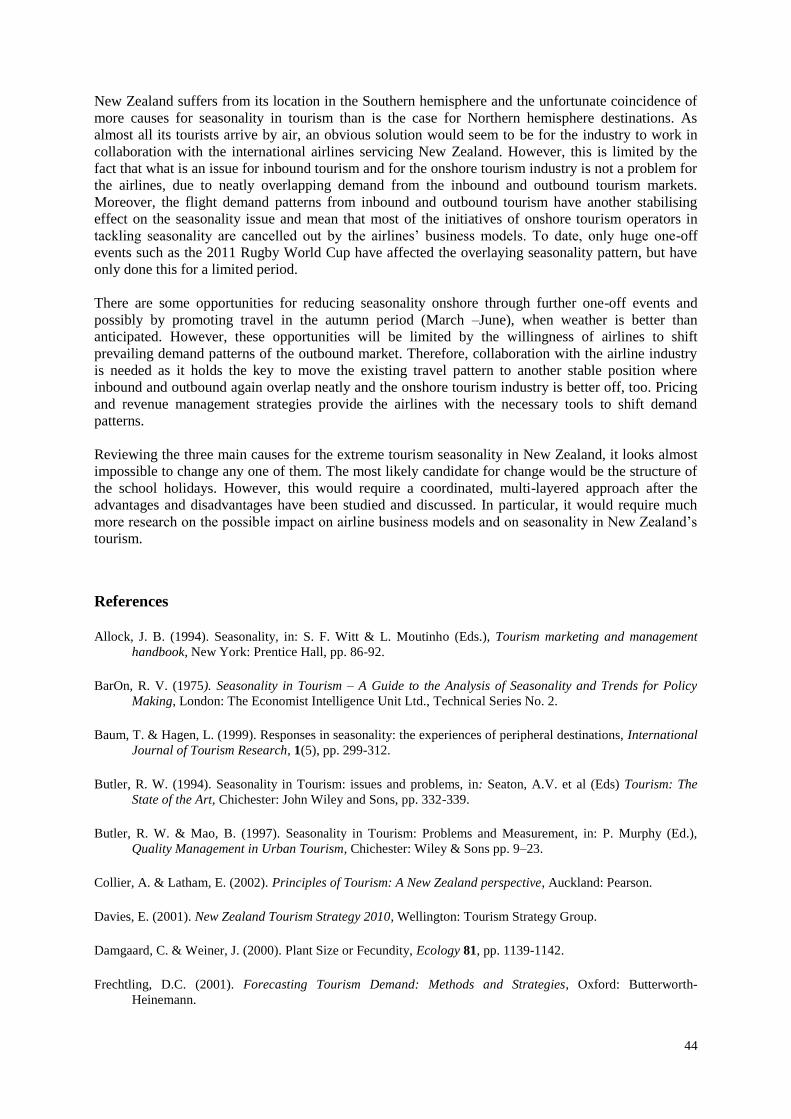
44
New Zealand suffers from its location in the Southern hemisphere and the unfortunate coincidence of
more causes for seasonality in tourism than is the case for Northern hemisphere destinations. As
almost all its tourists arrive by air, an obvious solution would seem to be for the industry to work in
collaboration with the international airlines servicing New Zealand. However, this is limited by the
fact that what is an issue for inbound tourism and for the onshore tourism industry is not a problem for
the airlines, due to neatly overlapping demand from the inbound and outbound tourism markets.
Moreover, the flight demand patterns from inbound and outbound tourism have another stabilising
effect on the seasonality issue and mean that most of the initiatives of onshore tourism operators in
tackling seasonality are cancelled out by the airlines’ business models. To date, only huge one-off
events such as the 2011 Rugby World Cup have affected the overlaying seasonality pattern, but have
only done this for a limited period.
There are some opportunities for reducing seasonality onshore through further one-off events and
possibly by promoting travel in the autumn period (March –June), when weather is better than
anticipated. However, these opportunities will be limited by the willingness of airlines to shift
prevailing demand patterns of the outbound market. Therefore, collaboration with the airline industry
is needed as it holds the key to move the existing travel pattern to another stable position where
inbound and outbound again overlap neatly and the onshore tourism industry is better off, too. Pricing
and revenue management strategies provide the airlines with the necessary tools to shift demand
patterns.
Reviewing the three main causes for the extreme tourism seasonality in New Zealand, it looks almost
impossible to change any one of them. The most likely candidate for change would be the structure of
the school holidays. However, this would require a coordinated, multi-layered approach after the
advantages and disadvantages have been studied and discussed. In particular, it would require much
more research on the possible impact on airline business models and on seasonality in New Zealand’s
tourism.
References
Allock, J. B. (1994). Seasonality, in: S. F. Witt & L. Moutinho (Eds.), Tourism marketing and management
handbook, New York: Prentice Hall, pp. 86-92.
BarOn, R. V. (1975). Seasonality in Tourism – A Guide to the Analysis of Seasonality and Trends for Policy
Making, London: The Economist Intelligence Unit Ltd., Technical Series No. 2.
Baum, T. & Hagen, L. (1999). Responses in seasonality: the experiences of peripheral destinations, International
Journal of Tourism Research, 1(5), pp. 299-312.
Butler, R. W. (1994). Seasonality in Tourism: issues and problems, in: Seaton, A.V. et al (Eds) Tourism: The
State of the Art, Chichester: John Wiley and Sons, pp. 332-339.
Butler, R. W. & Mao, B. (1997). Seasonality in Tourism: Problems and Measurement, in: P. Murphy (Ed.),
Quality Management in Urban Tourism, Chichester: Wiley & Sons pp. 9–23.
Collier, A. & Latham, E. (2002). Principles of Tourism: A New Zealand perspective, Auckland: Pearson.
Davies, E. (2001). New Zealand Tourism Strategy 2010, Wellington: Tourism Strategy Group.
Damgaard, C. & Weiner, J. (2000). Plant Size or Fecundity, Ecology 81, pp. 1139-1142.
Frechtling, D.C. (2001). Forecasting Tourism Demand: Methods and Strategies, Oxford: Butterworth-
Heinemann.

45
Hartmann, R. (1986). Tourism, seasonality and social change, Leisure Studies 5(1), pp. 25-33.
Hinch, T.D. & Jackson, E.L. (2000) Leisure Constraints research: its value as a framework for understanding
tourism seasonality. Current Issues in Tourism, 3(2), pp. 87-106.
Hylleberg, S. (1992). General Introduction, in: Modelling Seasonality, Oxford: University Press, pp. 3-14.
Koenig-Lewis, N. & Bischoff, E. (2005). Seasonality research: the state of the art, International Journal of
Tourism Research, 7(4-5), pp. 201-19.
Kuznets, S. (1933). Seasonal Variations in Industry and Trade, New York: National Bureau of Economic
Research Inc.
Lim, C. & McAleer, M. (2001). Monthly seasonal variations – Asian tourism to Australia, Annals of Tourism
Research, 28(1), pp. 68-82.
Lundtorp, S. (2001). Measuring Tourism Seasonality, in: Baum, T. and Lundtorp, S. (Eds) Seasonality in
Tourism, Oxford: Pergamon, pp. 23-50.
Lundtorp, S., Rassing C. R. & Wanhill, S (1999). Off-season is No-season: The Case of Bornholm. Tourism
Economics, 5(1), pp. 49-68.
Ministry of Tourism (2007). New Zealand Tourism Strategy 2015, Wellington: Ministry of Tourism New
Zealand.
Mitchell, L.S. & Murphy, P. (1991). Geography and tourism, Annals of Tourism Research, 18(1), pp. 57-60.
Nadal, J. R., Font, A. R., & Rossello, A. S. (2004). The economic determinants of seasonal patterns, Annals of
Tourism Research, 31(3), pp. 697-711.
NIWA (2012). Mean daily maximum air temperature in Auckland 1982-2010,
http://www.niwa.co.nz/sites/default/files/mean_daily_maximum_temperatures_deg_c.xlsx accessed
17/09/2012.
Statistics New Zealand (2011). Tourism satellite account: 2011, Wellington: Statistics New Zealand.
Statistics New Zealand (2012). International Travel and Migration,
http://www.stats.govt.nz/browse_for_stats/population/Migration/international-travel-and-migration-info-
releases.aspx accessed 17/09/2012.
Smitz, P., Robinson, M., Rousseau, N. Watkins, R. et al. (2004). Lonely Planet New Zealand.
Yacoumis, J. (1980). Tackling seasonality: The case of Sri Lanka. International Journal of Tourism
Management, 1(2), pp. 84-98.
Wanhill, S.R.C. (1980). Tackling seasonality: a technical note, International Journal of Tourism Management,
1(4), pp. 243-245.