measurement and analysis of rural household income in a dualistic economy: the case of south africa...
TRANSCRIPT

Measurement and Analysis of Measurement and Analysis of Rural Household Income in a Rural Household Income in a Dualistic Economy: The Case Dualistic Economy: The Case
of South Africaof South Africa
Johann Kirsten
University of Pretoria
&
Walter Moldenhauer
Department of Agriculture
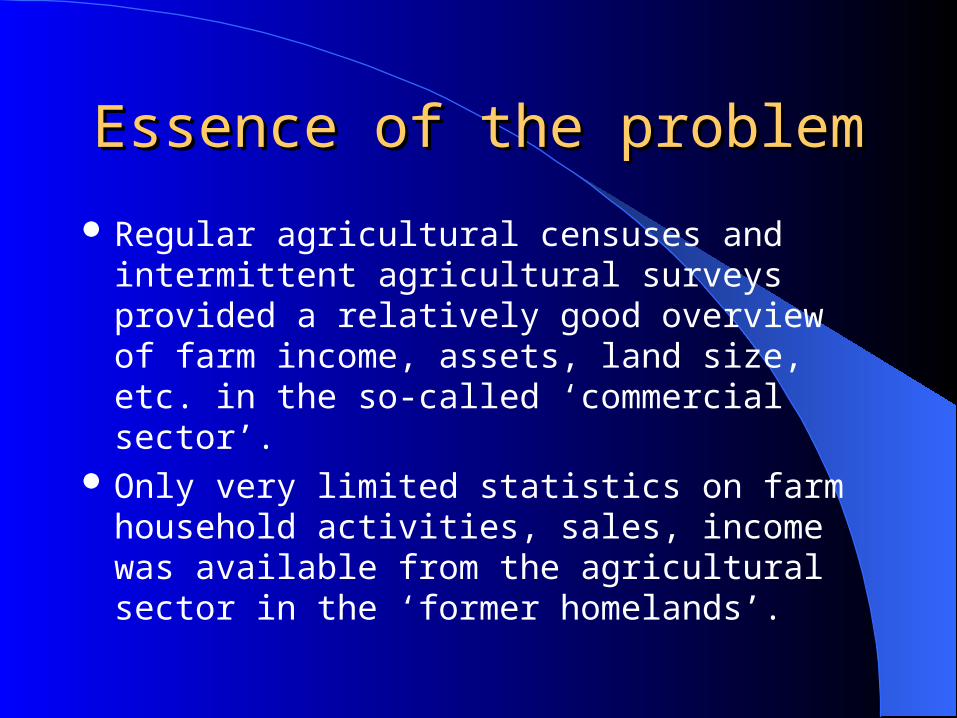
Essence of the problemEssence of the problem
Regular agricultural censuses and intermittent agricultural surveys provided a relatively good overview of farm income, assets, land size, etc. in the so-called ‘commercial sector’.
Only very limited statistics on farm household activities, sales, income was available from the agricultural sector in the ‘former homelands’.

Essence of the problem Essence of the problem
None of the agricultural censuses in the pre-1994 years covered these regions resulting in only a one-sided picture of the total agricultural sector and also a total data void on rural households and livelihoods in the ‘former homelands’.

Tools for Rural Income Tools for Rural Income Measurement & AnalysisMeasurement & Analysis
Agricultural censuses & surveysRural indicators / surveys

Agricultural Censuses & Agricultural Censuses & SurveysSurveys
Main information source on farming income.
Did not consider total household income.The censuses & surveys were regularly
conducted.Were mainly based on mail questionnaires,
which farmers had to complete.Results were fairly aggregated.

Agricultural Censuses & Agricultural Censuses & Surveys (2)Surveys (2)
It only covered the so-called ‘commercial sector.’ Farmers in the homelands were excluded from the
censuses & surveys. Had a fairly good coverage. Income were measured solely on income earned
from agricultural activities. Partly because farming was considered a full-time
activity.

Agricultural Censuses & Agricultural Censuses & surveys (3)surveys (3)
The censuses and surveys continued to exclude farmers from the former homelands.
Hence, the vital information needed to steer policy in the new democracy was not available.

Survey of Large & Small-scale Survey of Large & Small-scale Agriculture 2000Agriculture 2000
This was Statistics South Africa’s first attempt to collect data on the small-scale and subsistence farming sector in south Africa.
Divided the farming sector into a former south Africa and a former homelands region.
Former SA: large-scale commercial farms. Former homelands: small & subsistence farms
from the former homelands.

Survey of Large & Small-scale Survey of Large & Small-scale Agriculture 2000 (Income)Agriculture 2000 (Income)
This was the first attempt to measure income as the amount generated from agricultural and non-agricultural activities.
Results contained information on total income, farming turnover, expenses, debt, farming profit and total profit.
Information was useful to estimate non-farm income for the 2 regions.

Farming Income and Non-farm Income As a Percentage of Farming Income and Non-farm Income As a Percentage of
Total Income of Farm Households in South AfricaTotal Income of Farm Households in South Africa
94.6% 95.5%
23.2%
76.8%
5.4% 4.5%
0%
10%
20%
30%
40%
50%
60%
70%
80%
90%
100%
South Africa Former South Africa Former Homelands
Perc
en
tag
e o
f to
tal
inco
me
Farm income Non-farm income

ResultsResults
Results revealed that only 13.7% of total farming operations were situated in the Former SA, received 98.8% of total farm income.
Non-farm income was far more important in the former homelands.
The 943 000 farming operations in the former homelands covered a total land surface of 97,3 million hectares while the 150 000 farming operations in the former South Africa covered a total land surface of 217,98 million hectares.

Total land surface of farming operations according Total land surface of farming operations according
to geographical locationto geographical location
97
218
315
0
50
100
150
200
250
300
350
Former Homelands Former South Africa South Africa
Mill
ion
ha

Census of Commercial Census of Commercial Agriculture 2002Agriculture 2002
Once again it only covered the activities on commercial farms in South Africa.
For the purposes of the census, a commercial farm was defined as a farm that is registered for Value Added Tax (VAT).
As far as income is concerned, one can consider the census as step towards the right direction.

Census of Commercial Census of Commercial Agriculture 2002 (2)Agriculture 2002 (2)
The census captured all income earned from farming activities as well as other sources of income.
The biggest problem here lies in the last section: ‘other sources of income’. It is not clear whether salaries from non-farm employment were captured here.

ResultsResults
The preliminary findings were released on 15 September 2004.
According to the results, there were 45 818 active commercial farming units in South Africa in 2002. This is a decrease of 12 162 farming units since the last agricultural census in 1993.
Although there were fewer farming units, the gross farming income generated was R53 billion compared to the R39 billion generated in 1993 at 2002 constant prices.

Principal Statistics; 1993 & 2002Principal Statistics; 1993 & 2002
Item Unit 1993 2002
Farming units Number 57 980 45 818
Employment Number 1 161 912 986 842
Employees’ remuneration (constant 2002 prices)
R1 000 5 782 480 6 215 583
Gross farming income (constant 2002 prices)
R1 000 38 813 291 52 971 214

ResultsResults
Gross farming income as released on 15 Sep 2004, only includes income earned from agricultural products sold.
Household income was once again not reported

Rural Indicators / SurveysRural Indicators / Surveys
Prior to democracy in 1994, government had little interest very few surveys were undertaken in the former homeland areas.
Various studies and data ‘panel-beating’ exercises tried to fill this information gap.

PSLSD, 1993PSLSD, 1993
The Project for Statistics and Living Standards and Development (PSLSD) was the first South African household survey.
Was undertaken in the last half of 1993 by a consortium of South African survey groups and universities.
It was a comprehensive household survey and collected a broad array of information on the socio-economic conditions of households.

KIDS 1993 - 1997KIDS 1993 - 1997
The KwaZulu-Natal Income Dynamics Survey (KIDS) was a re-survey of households surveyed by the PSLSD in KwaZulu-Natal with the aim of addressing the dynamics of poverty in South Africa.

The Rural Survey of 1997The Rural Survey of 1997
Was conducted by Statistics South Africa (STATSSA) in 1997.
Was specifically designed to provide in-depth information about living conditions of rural households in the former homelands of South Africa.
The sampling frame was derived from the 1996 population census database and yielded a sample of +/- 6 000 households.

ResultsResults
In June 1997, about 12.7 million people, or 31.4% of the total South African population, lived in rural areas of the former homelands of South Africa.
Access to farmland is crucial for these rural households since they either depend entirely on farming activities for their survival and generation of income, or depend on these activities to supplement their main source or sources of income.

Results (2)Results (2)
As many as 71% of the 2.4 million households (approximately 1.7 million) in the rural areas in the former homelands had access to land for farming purposes.
Only 3% of the 2.4 million households in the sample relied on farming activities as their main source of income.
Household income was mostly generated from household members’ salaries and wages and pensions received by the senior citizens of the households.

Most Important Sources of Income of Most Important Sources of Income of Households in Rural AreasHouseholds in Rural Areas
37.69%
31.25%
21.35%
2.72%5.59%
1.41%
0%
5%
10%
15%
20%
25%
30%
35%
40%
Salaries &wages
Pension Remittances Farming Other Unspecified
Per
cen
tag
e o
f h
ou
seh
old
s

Conclusion:Conclusion: Treatment of household income in Treatment of household income in
different agricultural and rural surveysdifferent agricultural and rural surveys Survey / Census Coverage Income definition
Agricultural census 1993 Only commercial farms in former ‘white’ South Africa
Sales of farm products and farm-related income
Agricultural census 2002 Only commercial farms (farms registered for VAT)
Sales of farm products and farm-related income PLUS other income
Agricultural surveys: 1994, 1995, 1996
10% of commercial farms in former ‘white’ South Africa
Sales of farm products and farm-related income
Survey of large and small scale agriculture, 2000
Farm households in ‘former homelands’ and commercial farms
Total income from agricultural and non-agricultural activities
PLSDS 1993 Sample of 9000 urban and rural households
Total income from agricultural and non-agricultural activities
KIDS, 1998 Same households from PSLDS in KwaZulu-Natal
Total income from agricultural and non-agricultural activities
Rural Survey, 1997 Households in former homelands Total income from agricultural and non-agricultural activities