measure of the impacts of, vulnerability and adaptation to...
TRANSCRIPT
José A. Marengo Instituto Nacional de Pesquisas Espaciais – INPE
Measure of the impacts of, Measure of the impacts of, vulnerability and adaptation to vulnerability and adaptation to
climate change in South Americaclimate change in South America
Conference on Climate Change and Official Statistics
Oslo, Norway, 14-16 April 2008
• Climate change in Brazil, impacts, vulnerability
• Future climate change scenarios and the Amazon, results from downscaling experiments in Brazil
• Hots spots for climate change: Amazonia(biodiversity and social), Northeast Brazil (social) southern Brazil (agriculture and hydroelectricgeneration)
• Adaptation and mitigation alternatives: Deforestation, environmental services, biofuel
Contents…
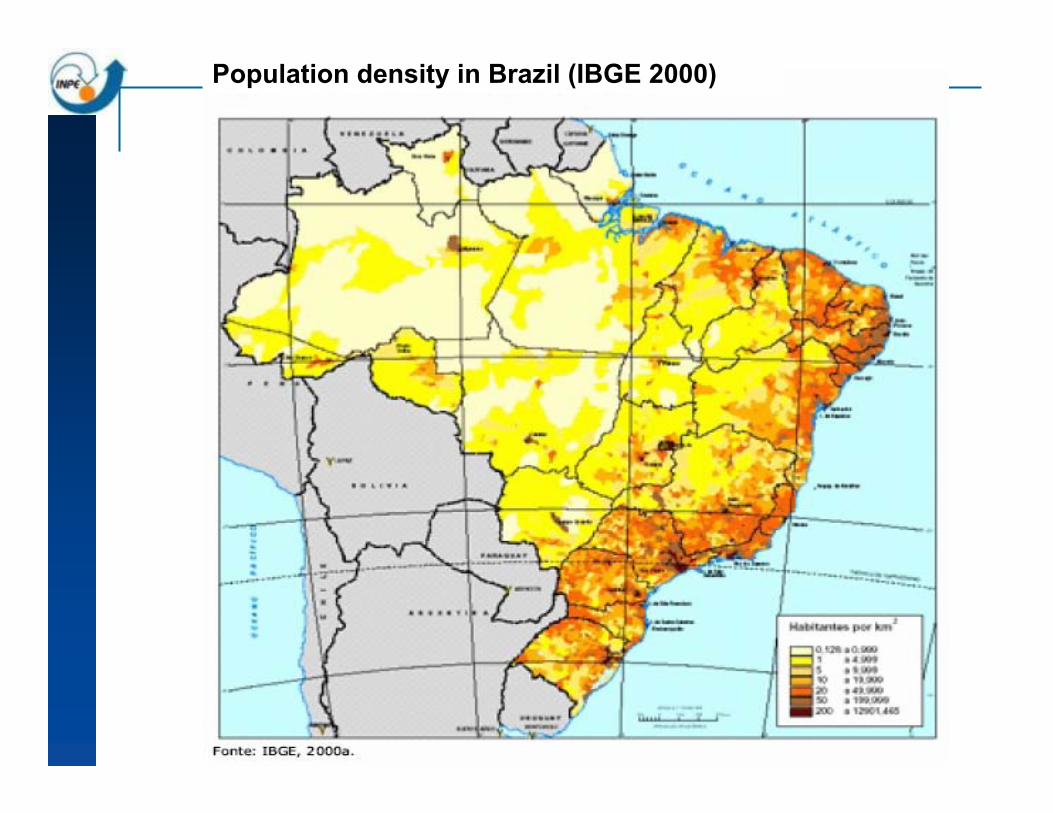
Population density in Brazil (IBGE 2000)
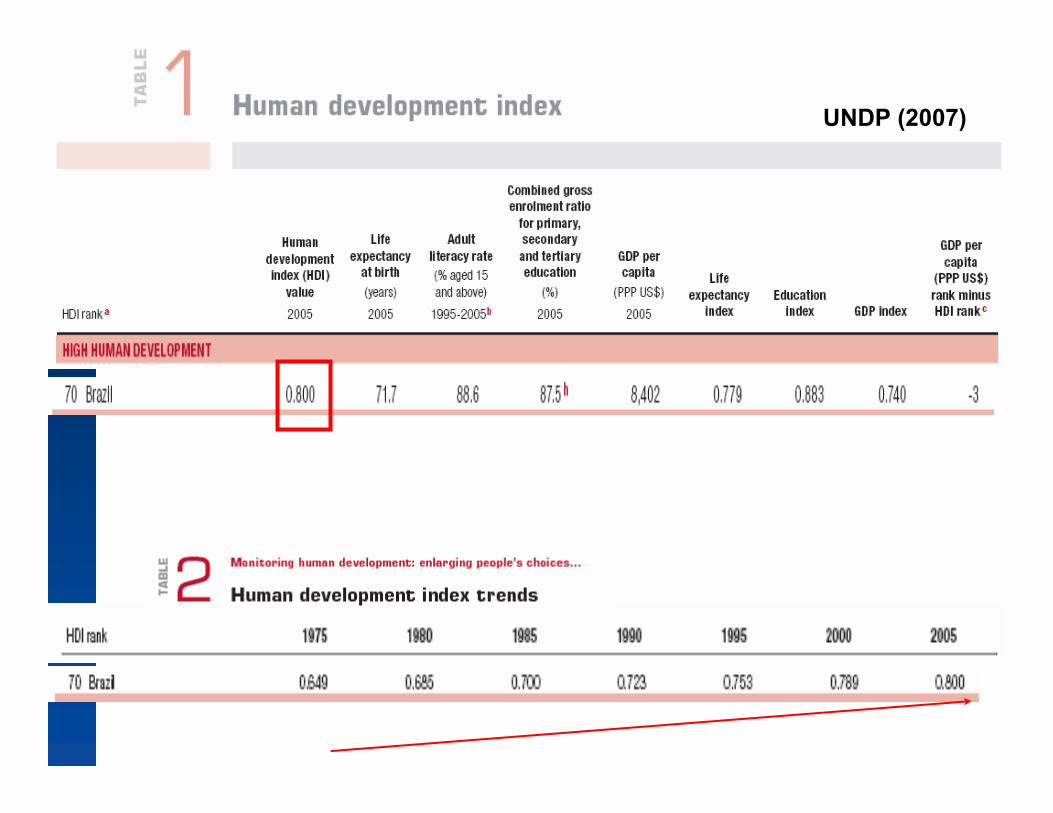
UNDP (2007)
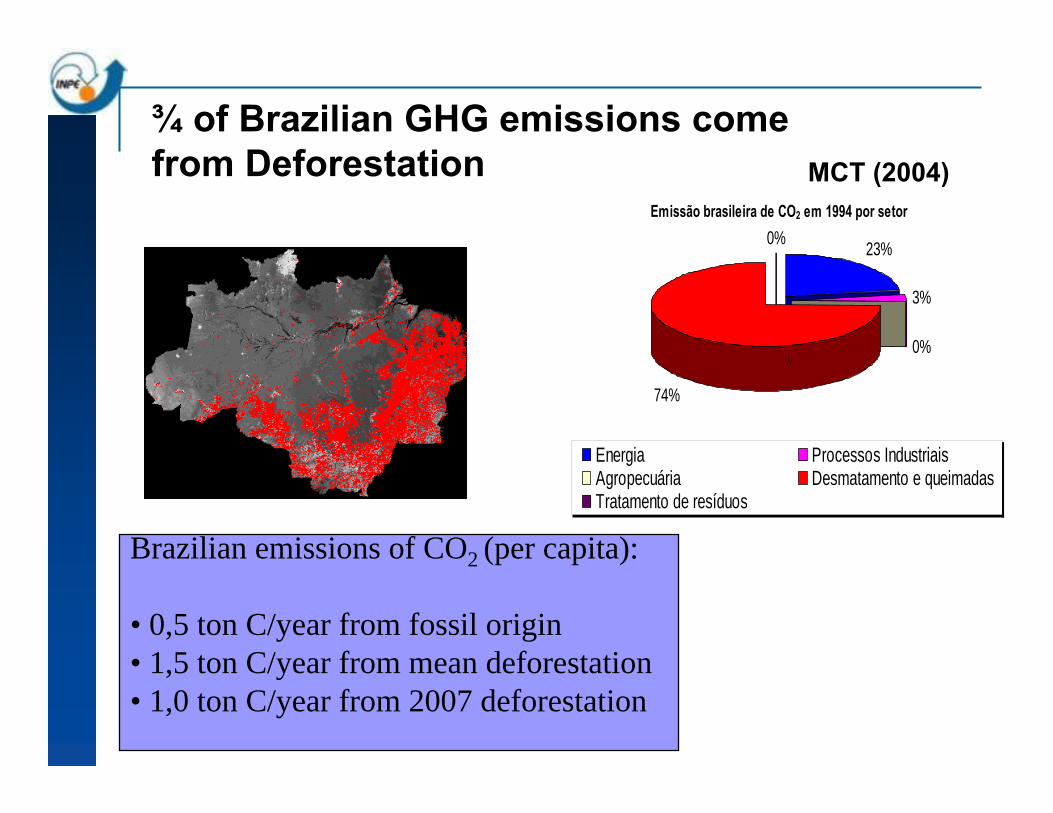
Emissão brasileira de CO2 em 1994 por setor
23%
3%
0%
74%
0%
Energia Processos IndustriaisAgropecuária Desmatamento e queimadasTratamento de resíduos
v
¾ of Brazilian GHG emissions come from Deforestation
Brazilian emissions of CO2 (per capita):
• 0,5 ton C/year from fossil origin• 1,5 ton C/year from mean deforestation• 1,0 ton C/year from 2007 deforestation
MCT (2004)
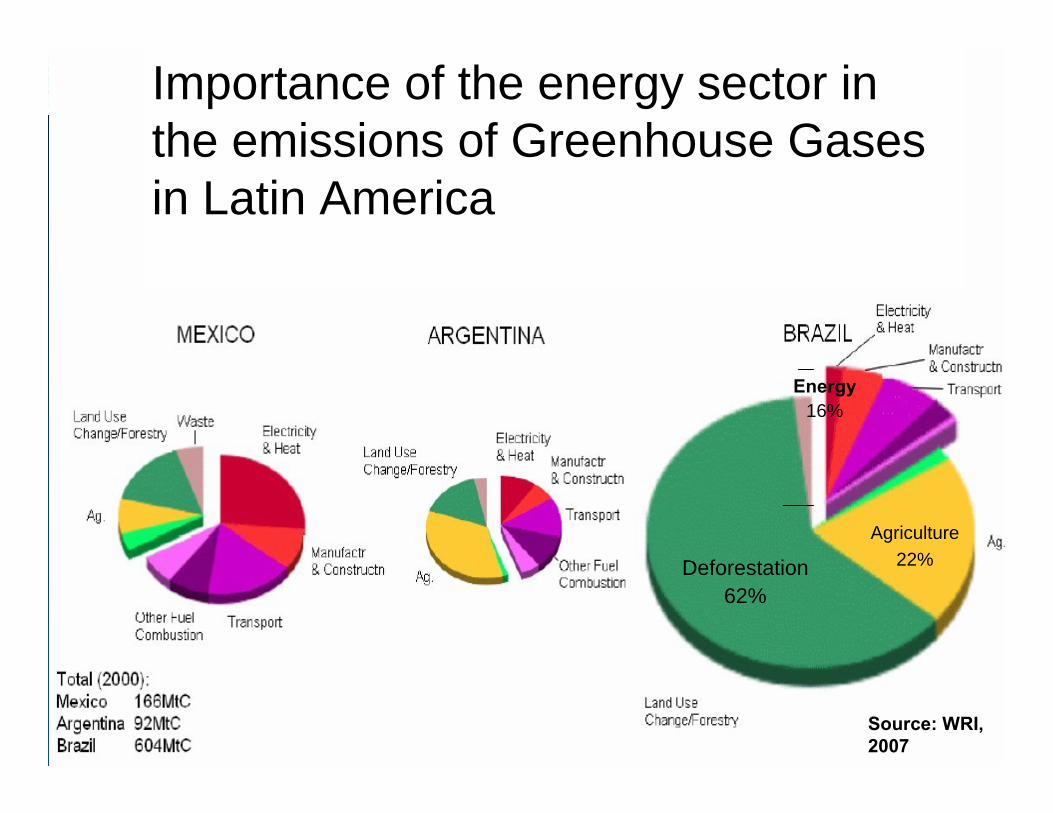
Deforestation62%
Agriculture22%
Energy16%
Source: WRI, 2007
Importance of the energy sector in the emissions of Greenhouse Gases in Latin America
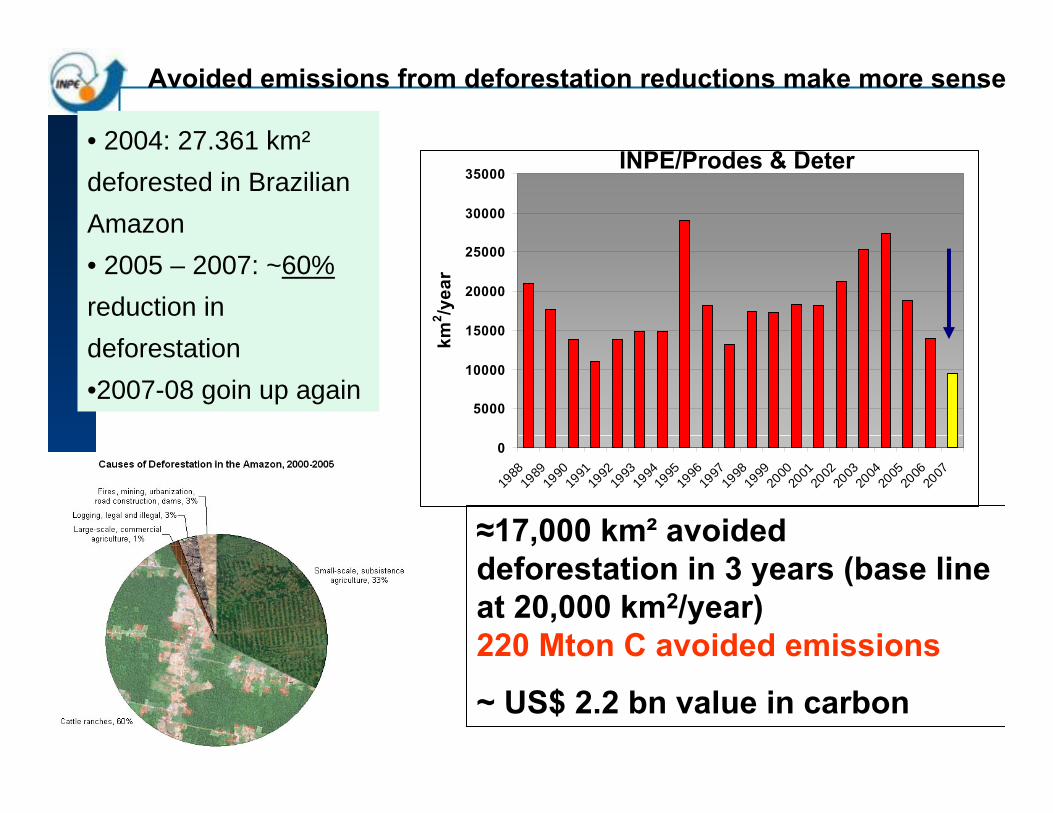
Avoided emissions from deforestation reductions make more sense
• 2004: 27.361 km²deforested in BrazilianAmazon• 2005 – 2007: ~60% reduction in deforestation•2007-08 goin up again
≈17,000 km² avoideddeforestation in 3 years (base lineat 20,000 km2/year) 220 Mton C avoided emissions
~ US$ 2.2 bn value in carbon
0
5000
10000
15000
20000
25000
30000
35000
1988
1989
1990
1991
1992
1993
1994
1995
1996
1997
1998
1999
2000
2001
2002
2003
2004
2005
2006
2007
km2 /y
ear
INPE/Prodes & Deter
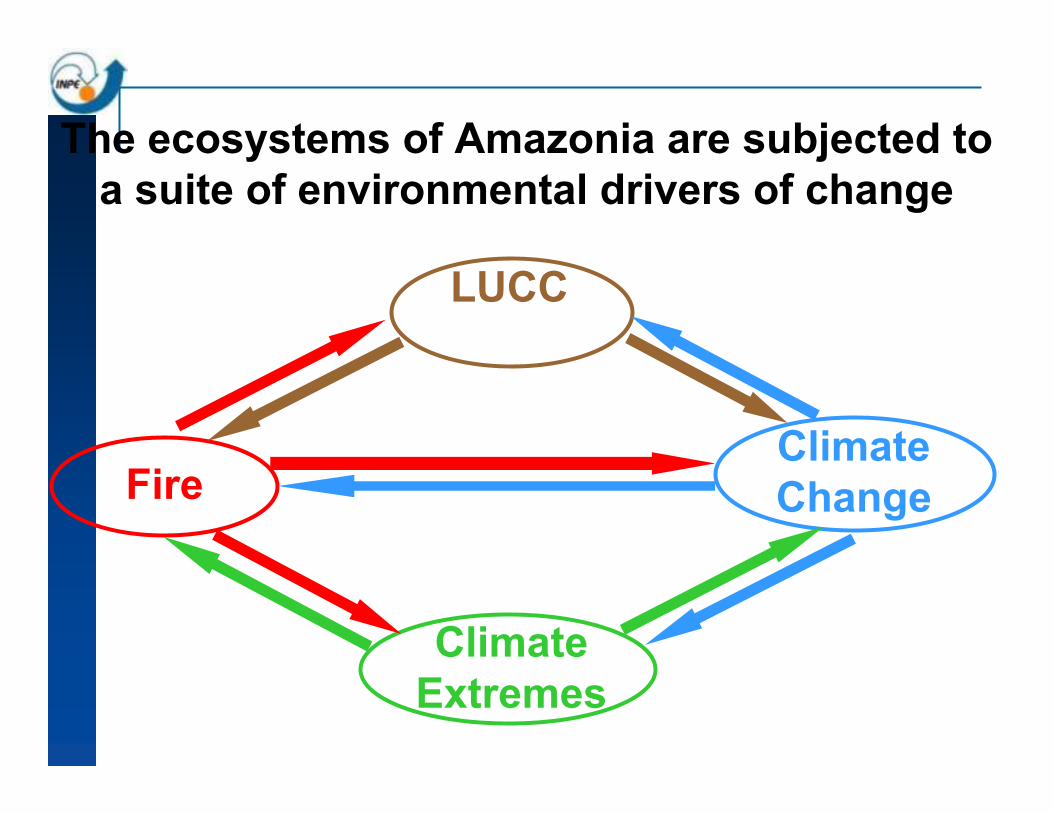
The ecosystems of Amazonia are subjected to a suite of environmental drivers of change
LUCC
FireClimateChange
ClimateExtremes
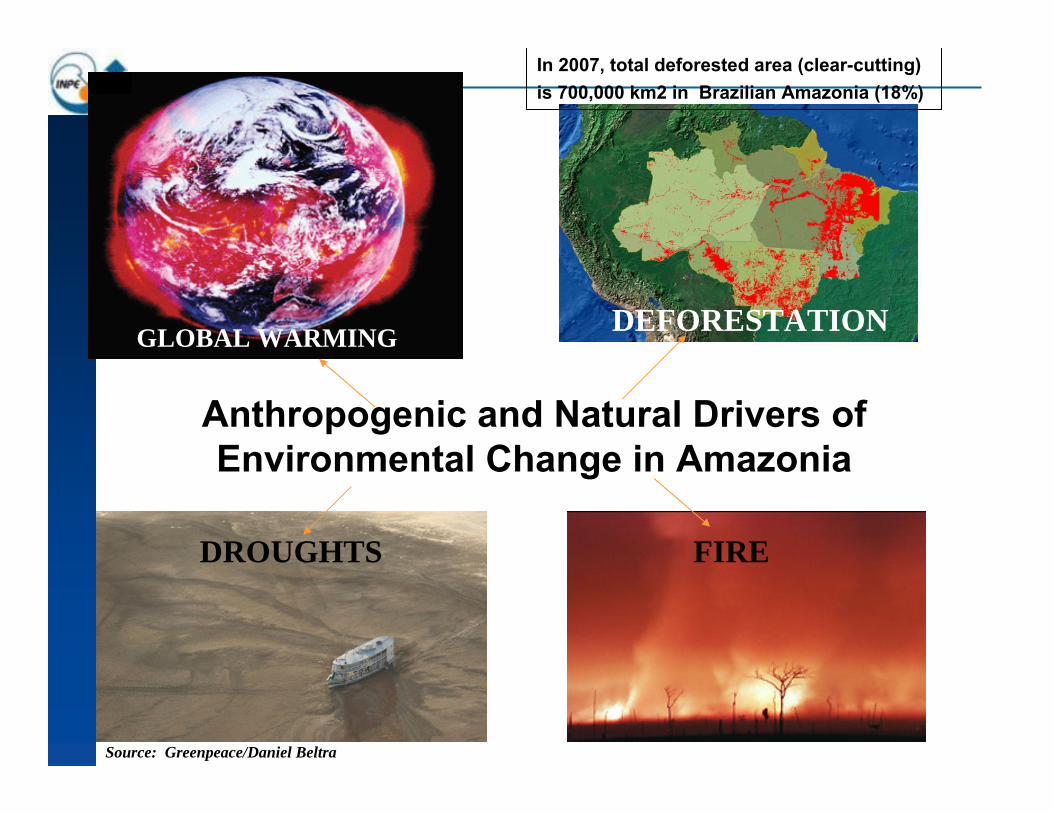
In 2007, total deforested area (clear-cutting) is 700,000 km2 in Brazilian Amazonia (18%)
Source: Greenpeace/Daniel Beltra
Anthropogenic and Natural Drivers of Environmental Change in Amazonia
DROUGHTS FIRE
DEFORESTATIONGLOBAL WARMING
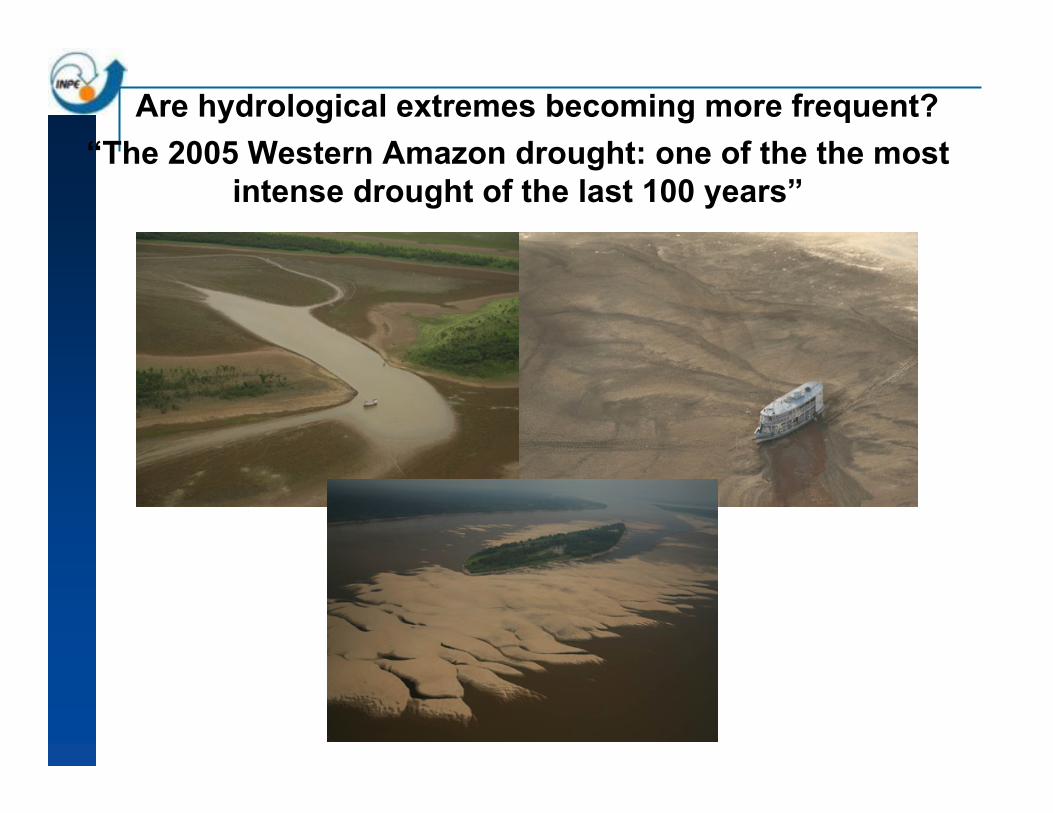
Are hydrological extremes becoming more frequent?“The 2005 Western Amazon drought: one of the the most
intense drought of the last 100 years”
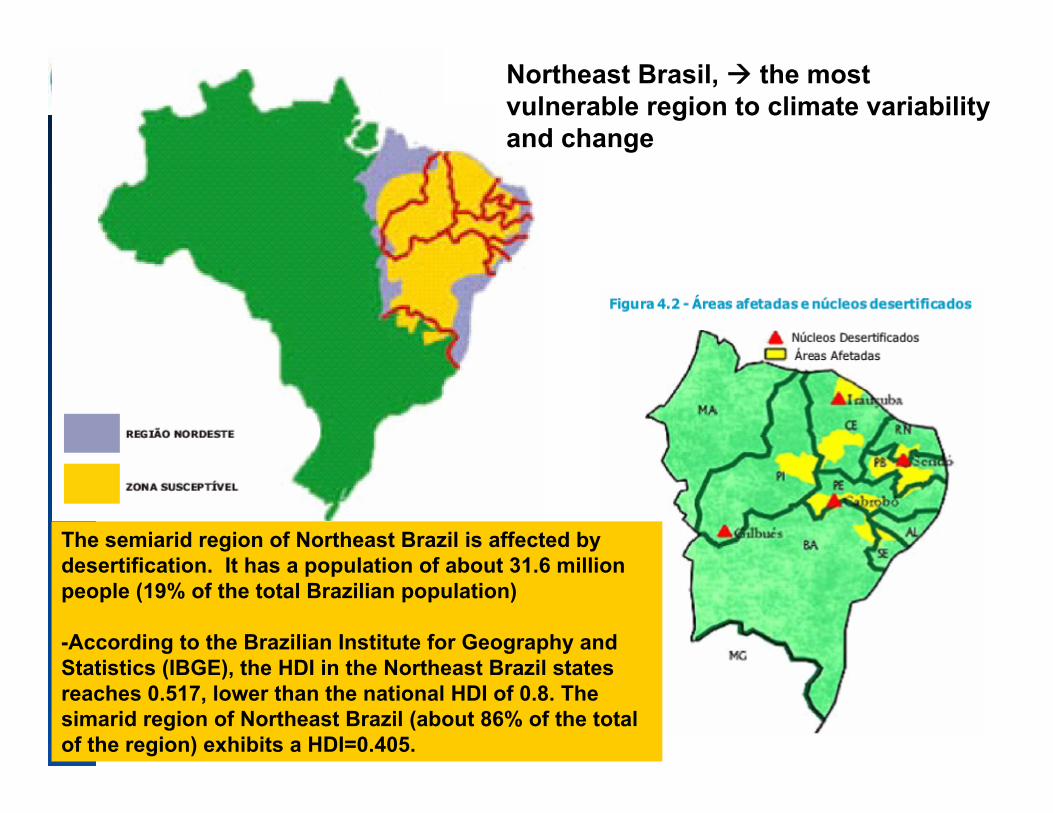
The semiarid region of Northeast Brazil is affected bydesertification. It has a population of about 31.6 millionpeople (19% of the total Brazilian population)
-According to the Brazilian Institute for Geography andStatistics (IBGE), the HDI in the Northeast Brazil states reaches 0.517, lower than the national HDI of 0.8. Thesimarid region of Northeast Brazil (about 86% of the total of the region) exhibits a HDI=0.405.
Northeast Brasil, the mostvulnerable region to climate variabilityand change
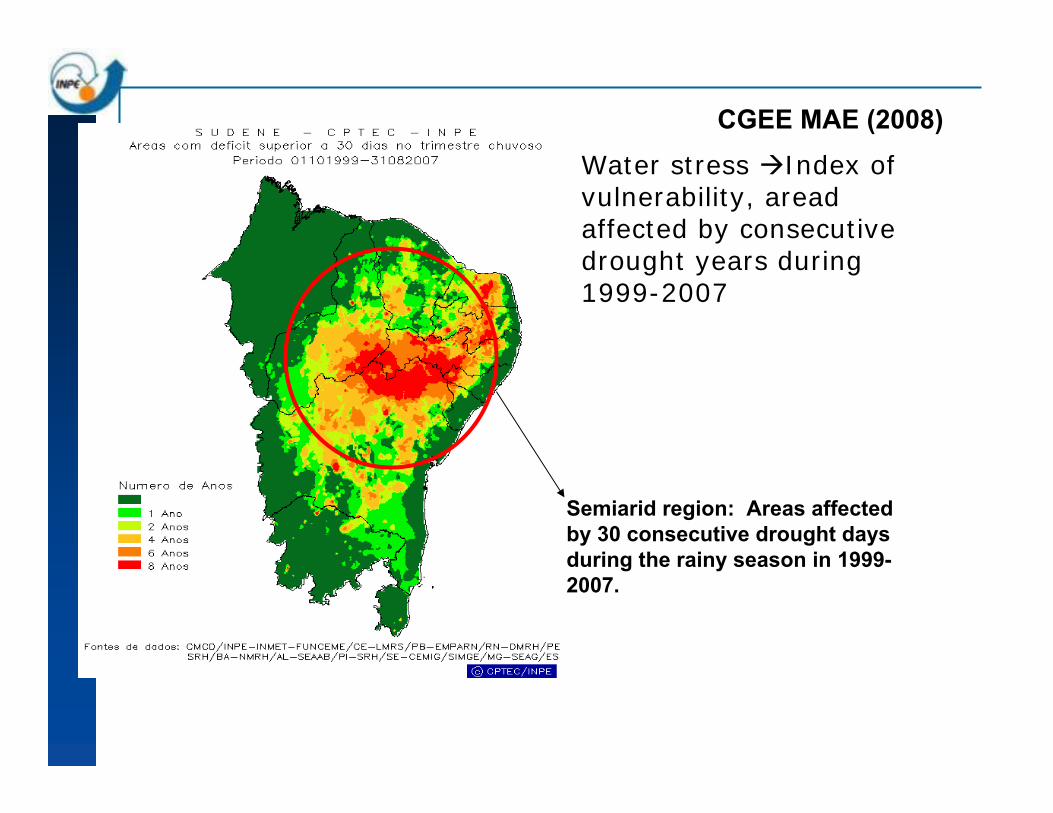
Water stress Index ofvulnerability, areadaffected by consecutivedrought years during1999-2007
Semiarid region: Areas affectedby 30 consecutive drought daysduring the rainy season in 1999-2007.
CGEE MAE (2008)
Climate Change projections in South America
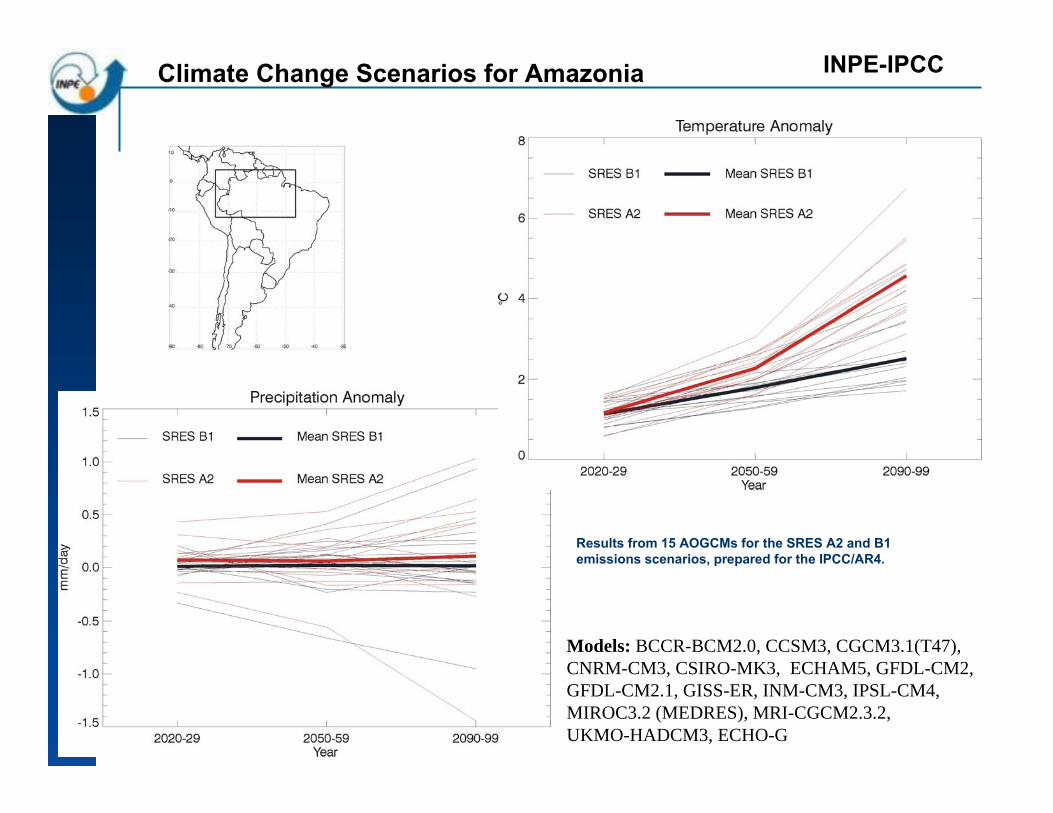
Climate Change Scenarios for Amazonia
Results from 15 AOGCMs for the SRES A2 and B1 emissions scenarios, prepared for the IPCC/AR4.
Models: BCCR-BCM2.0, CCSM3, CGCM3.1(T47), CNRM-CM3, CSIRO-MK3, ECHAM5, GFDL-CM2, GFDL-CM2.1, GISS-ER, INM-CM3, IPSL-CM4, MIROC3.2 (MEDRES), MRI-CGCM2.3.2, UKMO-HADCM3, ECHO-G
INPE-IPCC
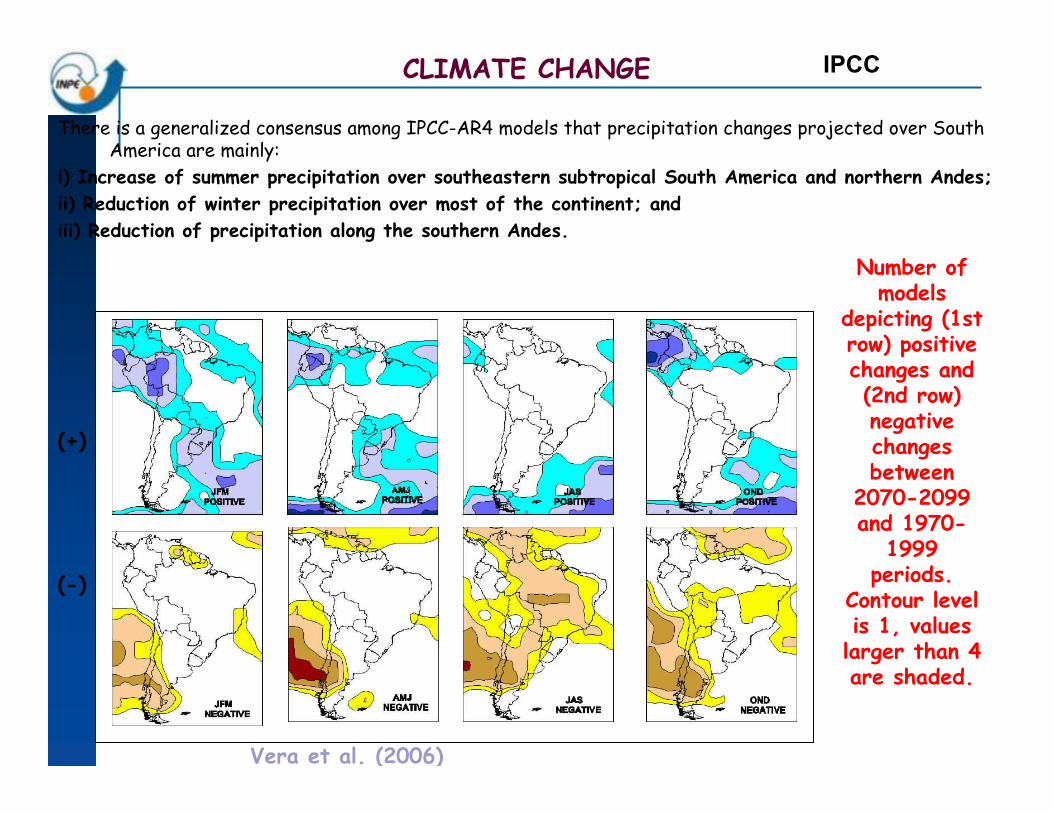
Number of models
depicting (1st row) positive changes and (2nd row) negative changes between
2070-2099 and 1970-
1999 periods.
Contour level is 1, values
larger than 4 are shaded.
(+)
(-)
There is a generalized consensus among IPCC-AR4 models that precipitation changes projected over South America are mainly:
i) Increase of summer precipitation over southeastern subtropical South America and northern Andes; ii) Reduction of winter precipitation over most of the continent; and iii) Reduction of precipitation along the southern Andes.
Vera et al. (2006)
CLIMATE CHANGE IPCC
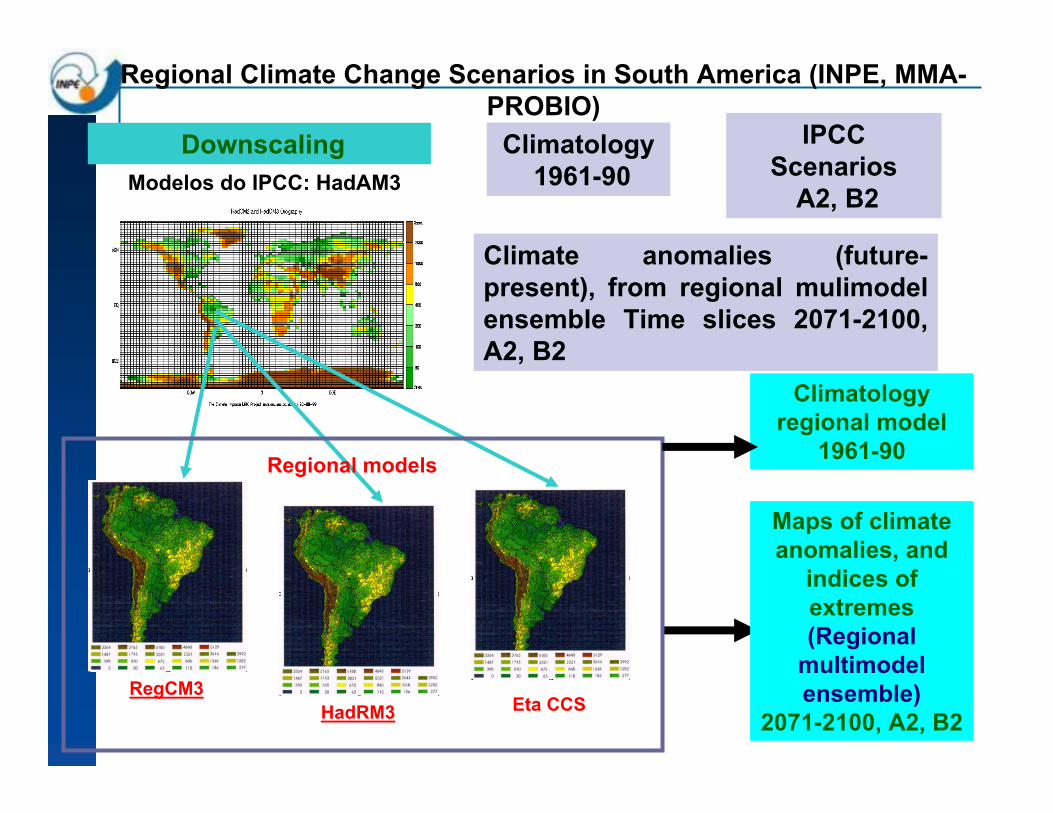
Modelos do IPCC: HadAM3
RegCM3
Downscaling IPCC Scenarios
A2, B2
HadRM3 Eta CCS
Regional models
Climatology1961-90
Regional Climate Change Scenarios in South America (INPE, MMA-PROBIO)
Maps of climate anomalies, and
indices of extremes (Regional
multimodelensemble)
2071-2100, A2, B2
Climatology regional model
1961-90
Climate anomalies (future-present), from regional mulimodelensemble Time slices 2071-2100, A2, B2
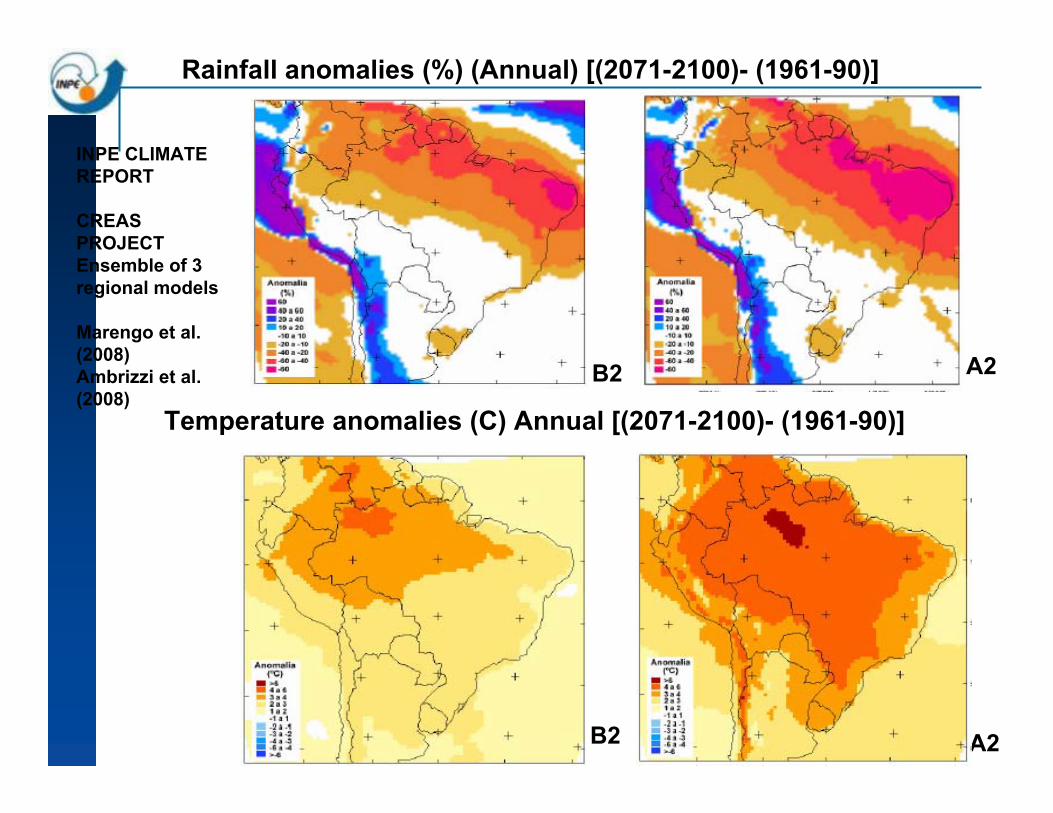
Rainfall anomalies (%) (Annual) [(2071-2100)- (1961-90)]
Temperature anomalies (C) Annual [(2071-2100)- (1961-90)]
Seco
Quente Quente
B2
B2
A2
A2
INPE CLIMATE REPORT
CREAS PROJECTEnsemble of 3 regional models
Marengo et al. (2008)Ambrizzi et al. (2008)
Possible impacts and changes in extremes
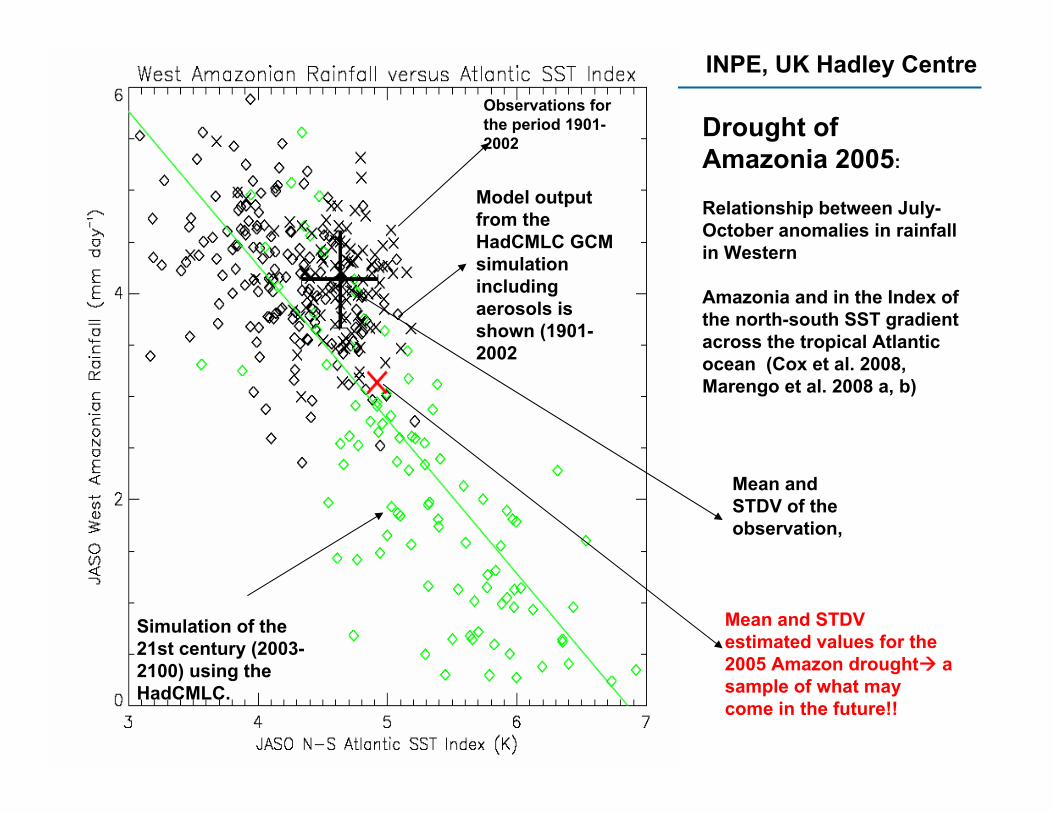
Drought ofAmazonia 2005:
Relationship between July-October anomalies in rainfallin Western
Amazonia and in the Index ofthe north-south SST gradientacross the tropical Atlanticocean (Cox et al. 2008, Marengo et al. 2008 a, b)
Observations for the period 1901-2002
Model output from theHadCMLC GCM simulationincludingaerosols is shown (1901-2002
Simulation of the21st century (2003-2100) using theHadCMLC.
Mean andSTDV of theobservation,
Mean and STDV estimated values for the2005 Amazon drought a sample of what maycome in the future!!
INPE, UK Hadley Centre
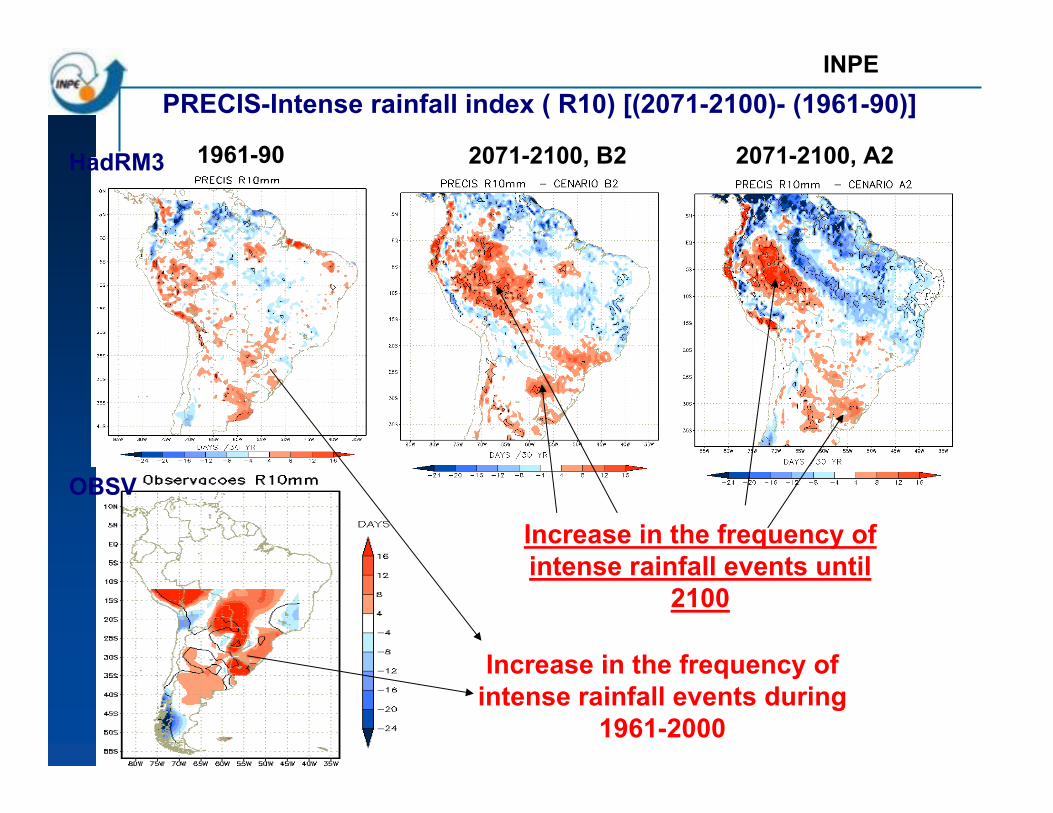
Increase in the frequency of intense rainfall events until
2100
PRECIS-Intense rainfall index ( R10) [(2071-2100)- (1961-90)]
Increase in the frequency of intense rainfall events during
1961-2000
OBSV
1961-90 2071-2100, B2 2071-2100, A2HadRM3
INPE
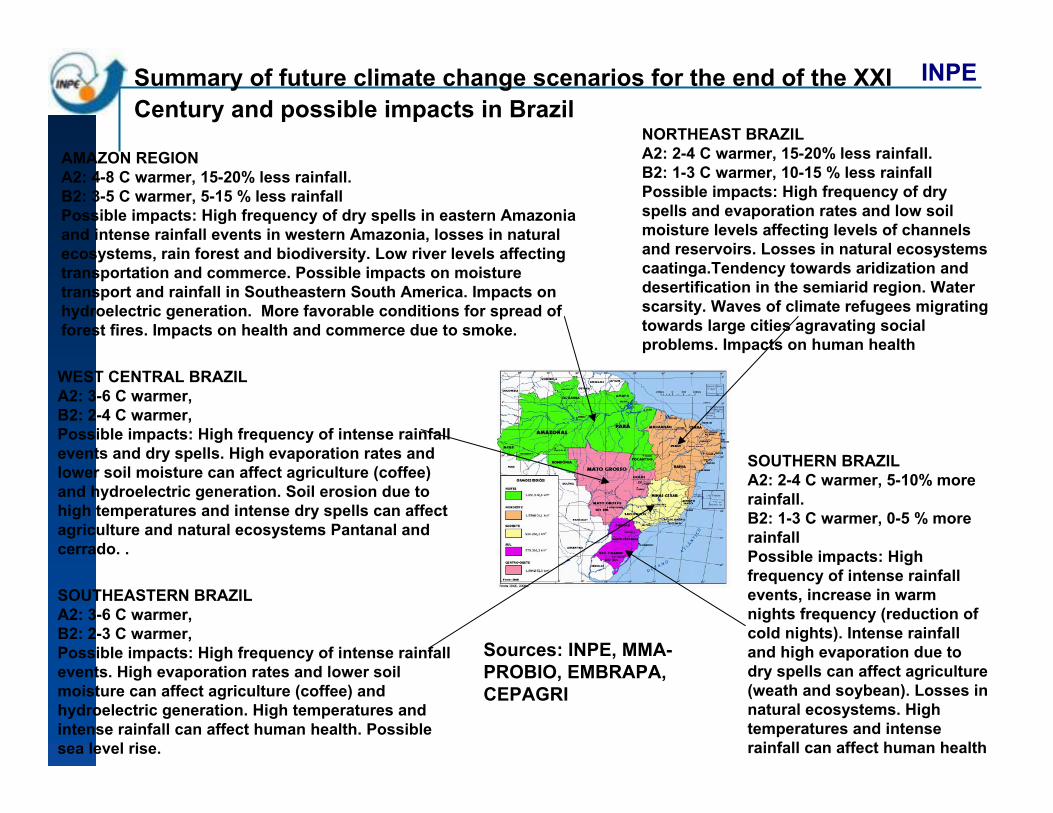
NORTHEAST BRAZILA2: 2-4 C warmer, 15-20% less rainfall. B2: 1-3 C warmer, 10-15 % less rainfallPossible impacts: High frequency of dryspells and evaporation rates and low soilmoisture levels affecting levels of channelsand reservoirs. Losses in natural ecosystemscaatinga.Tendency towards aridization anddesertification in the semiarid region. Waterscarsity. Waves of climate refugees migratingtowards large cities agravating social problems. Impacts on human health
AMAZON REGIONA2: 4-8 C warmer, 15-20% less rainfall. B2: 3-5 C warmer, 5-15 % less rainfallPossible impacts: High frequency of dry spells in eastern Amazoniaand intense rainfall events in western Amazonia, losses in natural ecosystems, rain forest and biodiversity. Low river levels affectingtransportation and commerce. Possible impacts on moisturetransport and rainfall in Southeastern South America. Impacts onhydroelectric generation. More favorable conditions for spread offorest fires. Impacts on health and commerce due to smoke.
SOUTHERN BRAZILA2: 2-4 C warmer, 5-10% more rainfall. B2: 1-3 C warmer, 0-5 % more rainfallPossible impacts: Highfrequency of intense rainfallevents, increase in warmnights frequency (reduction ofcold nights). Intense rainfalland high evaporation due to dry spells can affect agriculture(weath and soybean). Losses in natural ecosystems. Hightemperatures and intenserainfall can affect human health
SOUTHEASTERN BRAZILA2: 3-6 C warmer, B2: 2-3 C warmer, Possible impacts: High frequency of intense rainfallevents. High evaporation rates and lower soilmoisture can affect agriculture (coffee) andhydroelectric generation. High temperatures andintense rainfall can affect human health. Possiblesea level rise.
WEST CENTRAL BRAZILA2: 3-6 C warmer, B2: 2-4 C warmer, Possible impacts: High frequency of intense rainfallevents and dry spells. High evaporation rates andlower soil moisture can affect agriculture (coffee) and hydroelectric generation. Soil erosion due to high temperatures and intense dry spells can affectagriculture and natural ecosystems Pantanal andcerrado. .
Summary of future climate change scenarios for the end of the XXI Century and possible impacts in Brazil
Sources: INPE, MMA-PROBIO, EMBRAPA,CEPAGRI
INPE
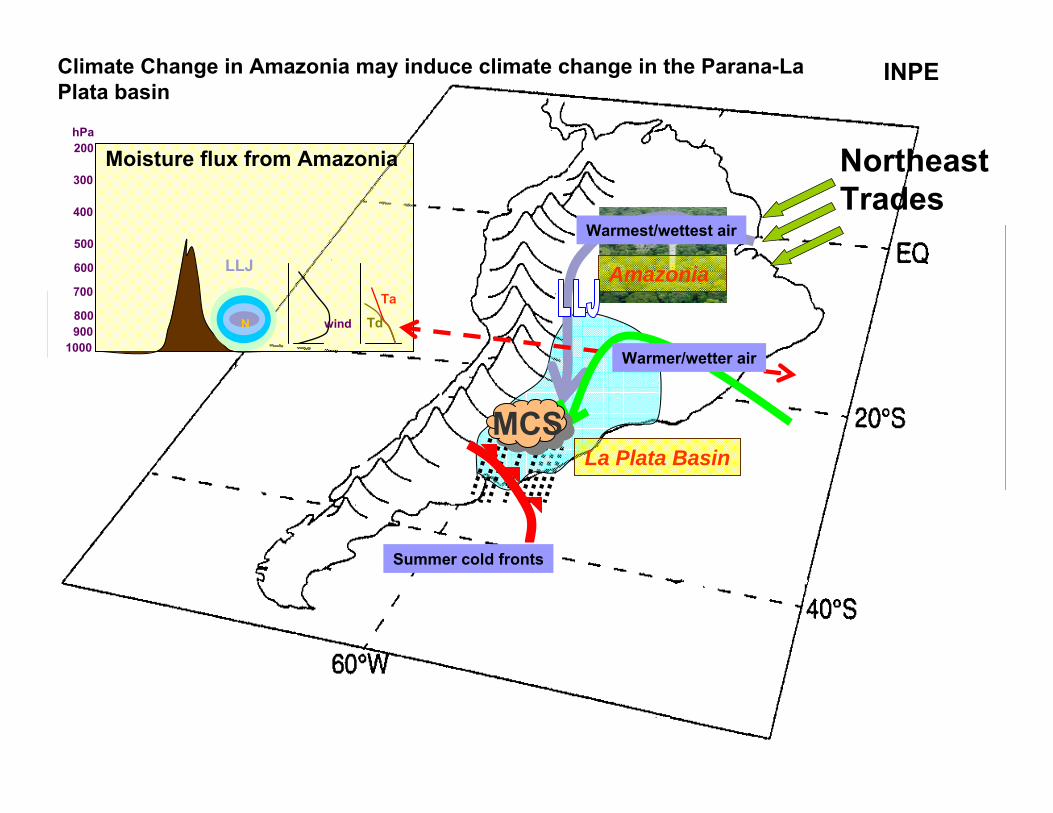
NortheastTrades
Amazonia
La Plata Basin
wind
Ta
Td
LLJ
N
500
200hPa
1000
800900
600
700
400
300Moisture flux from Amazonia
MCS
Warmest/wettest air
Climate Change in Amazonia may induce climate change in the Parana-La Plata basin
Warmer/wetter air
Summer cold fronts
INPE
What are the likely biome changes in Tropical South
America due to Global Warming scenarios of climate
change?
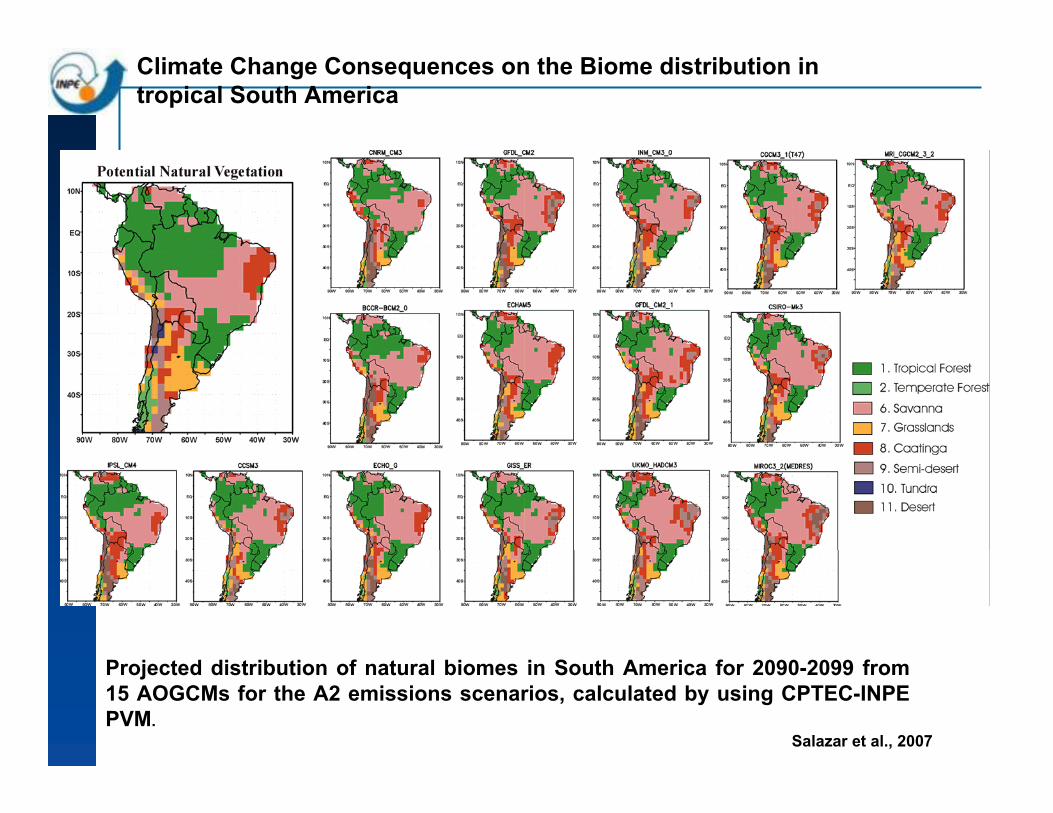
Projected distribution of natural biomes in South America for 2090-2099 from 15 AOGCMs for the A2 emissions scenarios, calculated by using CPTEC-INPE PVM.
Climate Change Consequences on the Biome distribution in tropical South America
Salazar et al., 2007
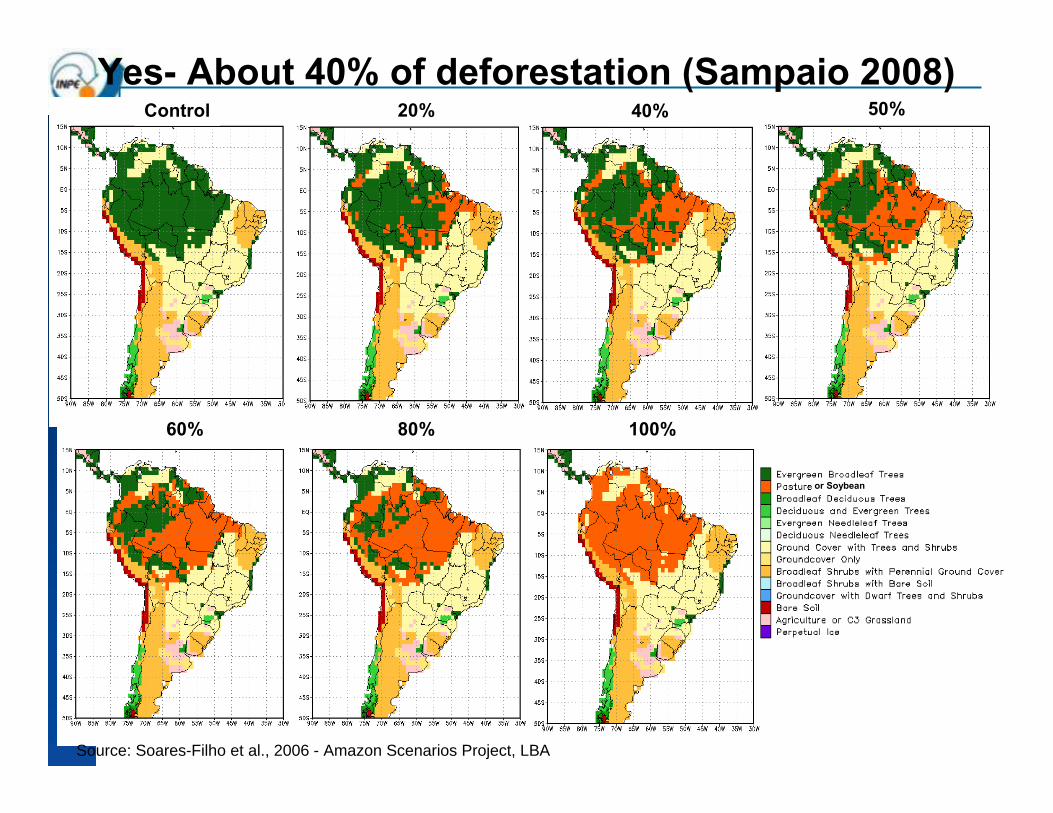
Yes- About 40% of deforestation (Sampaio 2008)Control 20% 40% 50%
60% 80% 100%
or Soybean
Source: Soares-Filho et al., 2006 - Amazon Scenarios Project, LBA
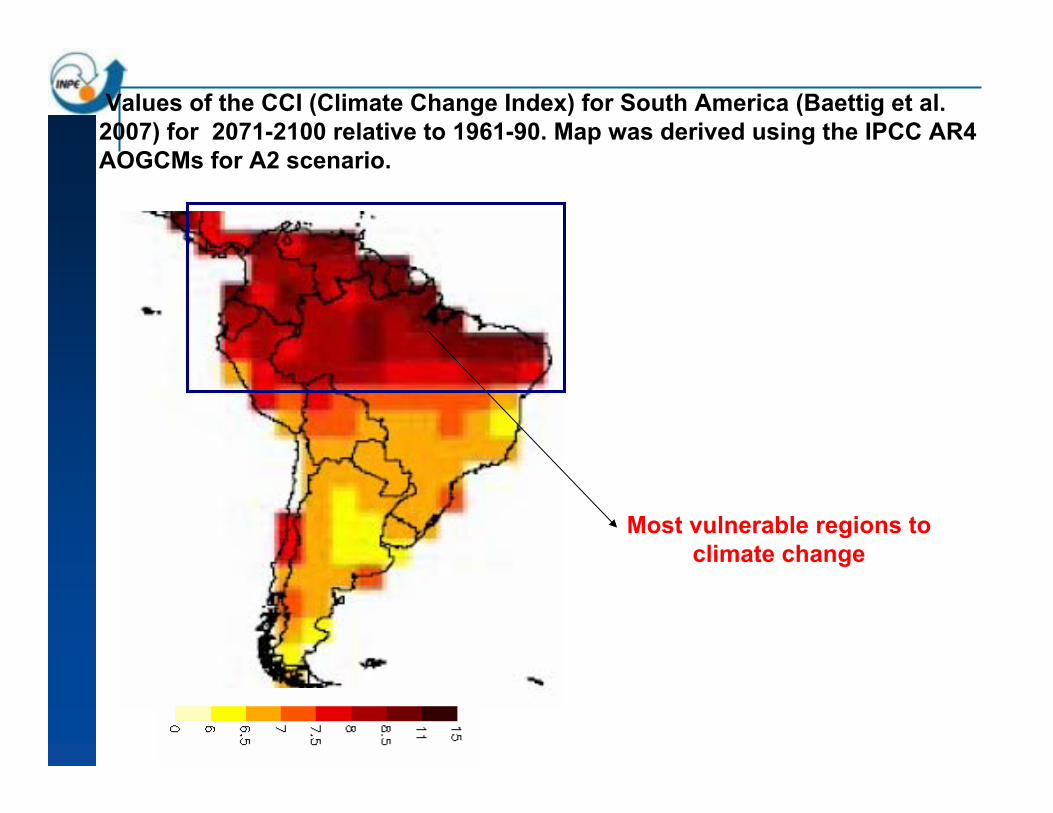
Values of the CCI (Climate Change Index) for South America (Baettig et al. 2007) for 2071-2100 relative to 1961-90. Map was derived using the IPCC AR4 AOGCMs for A2 scenario.
Most vulnerable regions to climate change
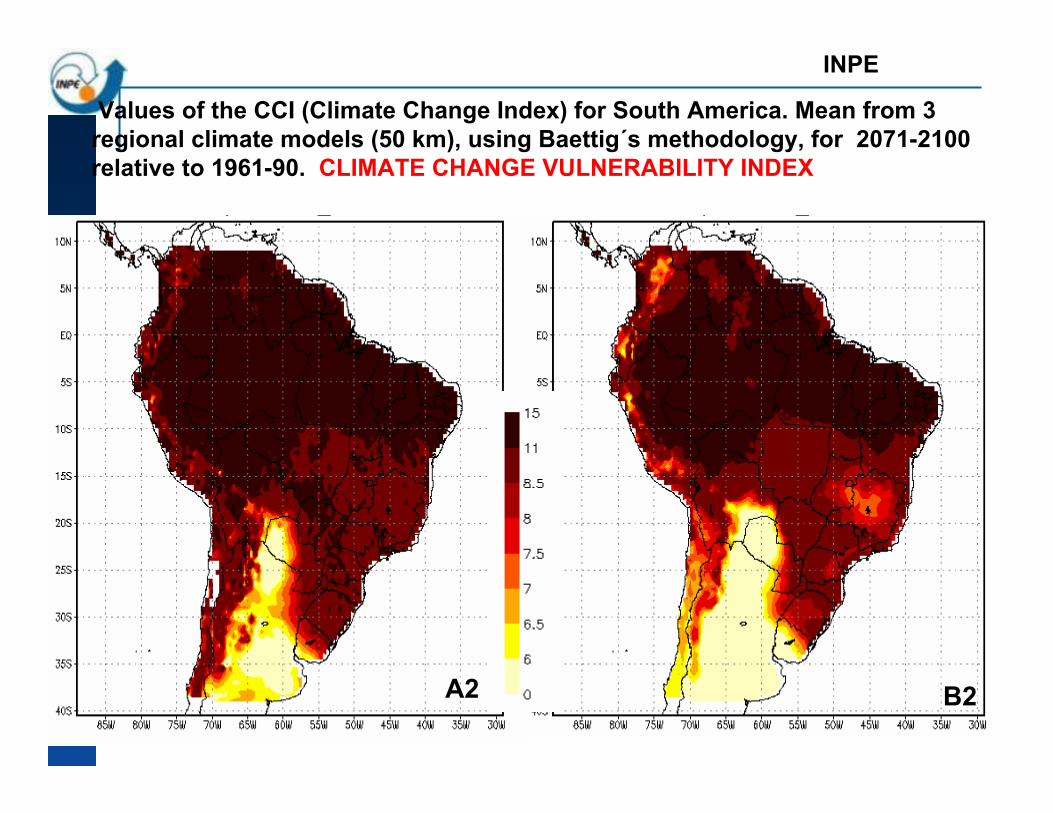
Values of the CCI (Climate Change Index) for South America. Mean from 3 regional climate models (50 km), using Baettig´s methodology, for 2071-2100 relative to 1961-90. CLIMATE CHANGE VULNERABILITY INDEX
A2 B2
INPE
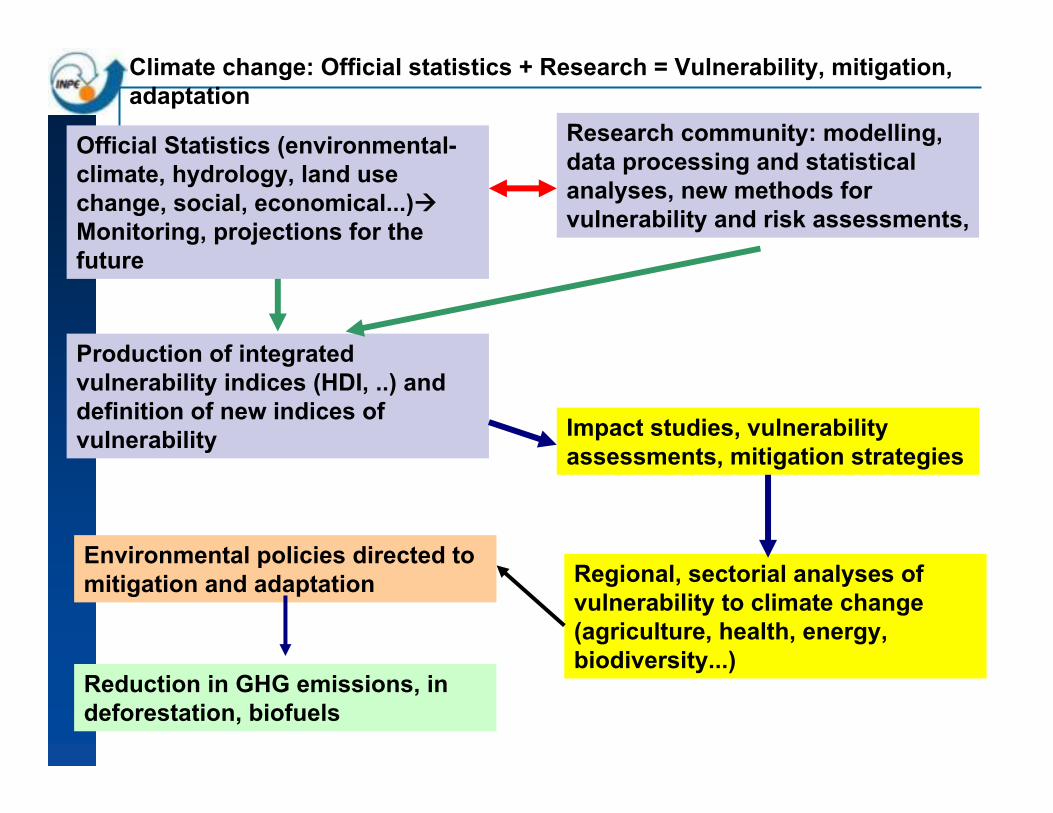
Official Statistics (environmental-climate, hydrology, land use change, social, economical...)Monitoring, projections for thefuture
Impact studies, vulnerabilityassessments, mitigation strategies
Regional, sectorial analyses ofvulnerability to climate change(agriculture, health, energy, biodiversity...)
Research community: modelling, data processing and statisticalanalyses, new methods for vulnerability and risk assessments,
Production of integratedvulnerability indices (HDI, ..) anddefinition of new indices ofvulnerability
Environmental policies directed to mitigation and adaptation
Reduction in GHG emissions, in deforestation, biofuels
Climate change: Official statistics + Research = Vulnerability, mitigation, adaptation
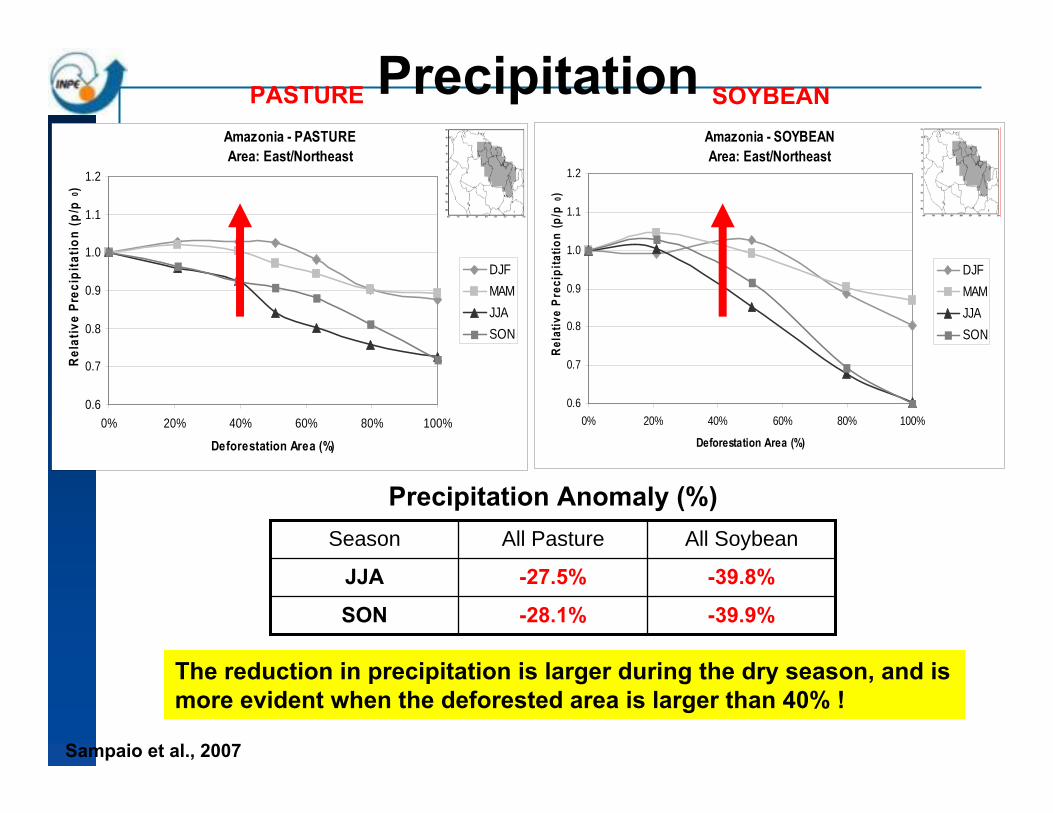
-28.1%
-27.5%
All Pasture
-39.8%JJA
-39.9%SON
All SoybeanSeason
PrecipitationAmazonia - PASTUREArea: East/Northeast
0.6
0.7
0.8
0.9
1.0
1.1
1.2
0% 20% 40% 60% 80% 100%
Deforestation Area (%)
Rel
ativ
e Pr
ecip
itatio
n (p
/p0 )
DJFMAMJJASON
Amazonia - SOYBEANArea: East/Northeast
0.6
0.7
0.8
0.9
1.0
1.1
1.2
0% 20% 40% 60% 80% 100%
Deforestation Area (%)
Rel
ativ
e P
reci
pita
tion
(p/p
0)
DJFMAMJJASON
PASTURE SOYBEAN
Precipitation Anomaly (%)
Sampaio et al., 2007
The reduction in precipitation is larger during the dry season, and is more evident when the deforested area is larger than 40% !
Environmental services, adaptation and mitigation
options
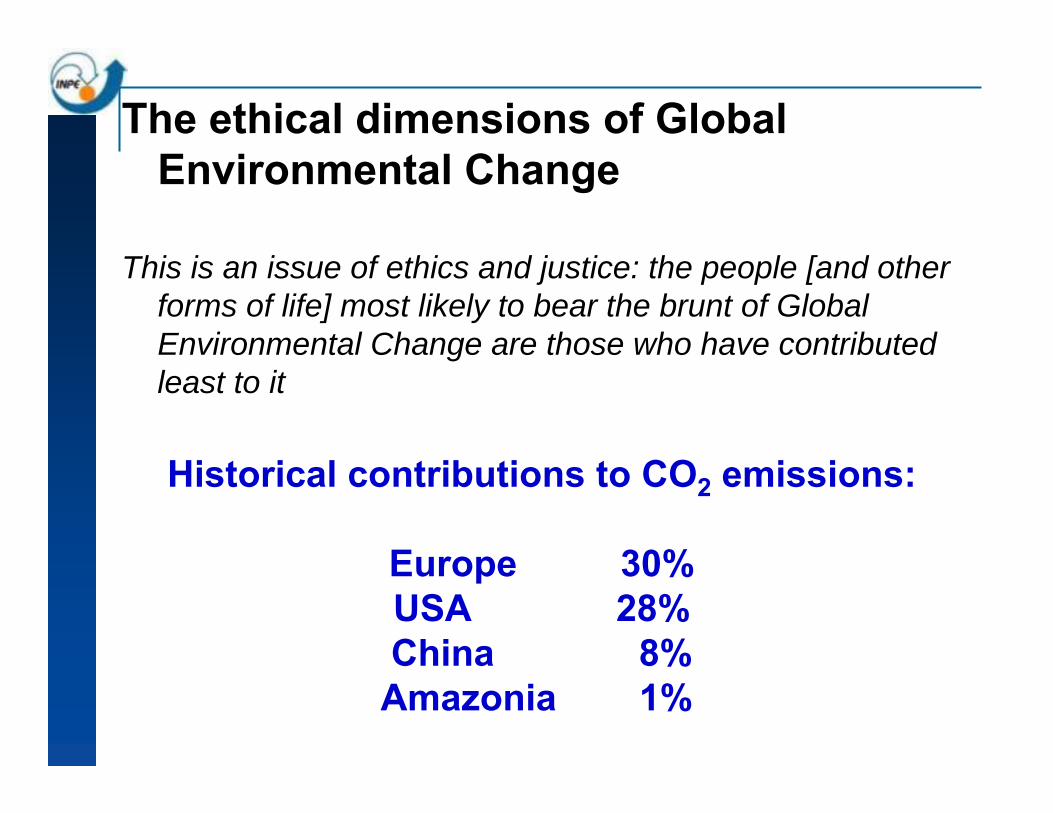
The ethical dimensions of Global Environmental Change
This is an issue of ethics and justice: the people [and other forms of life] most likely to bear the brunt of Global Environmental Change are those who have contributed least to it
Historical contributions to CO2 emissions:
Europe 30%USA 28%China 8%
Amazonia 1%
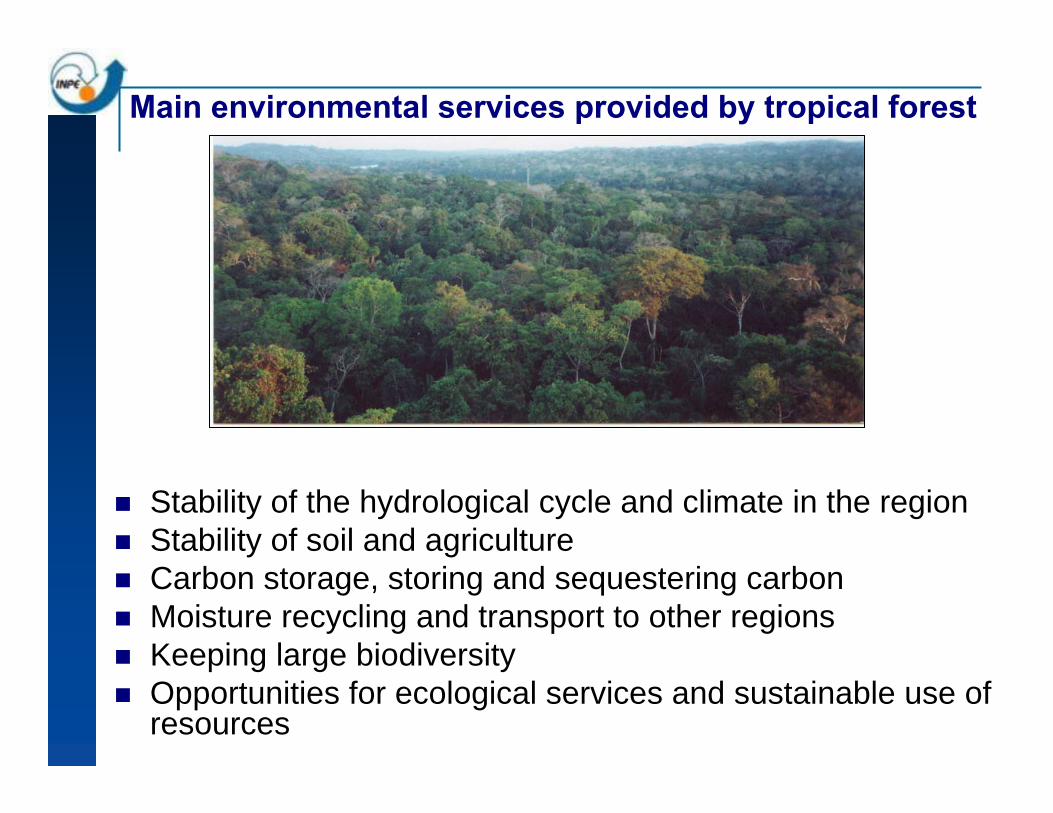
Stability of the hydrological cycle and climate in the regionStability of soil and agricultureCarbon storage, storing and sequestering carbonMoisture recycling and transport to other regions Keeping large biodiversity Opportunities for ecological services and sustainable use of resources
Main environmental services provided by tropical forest
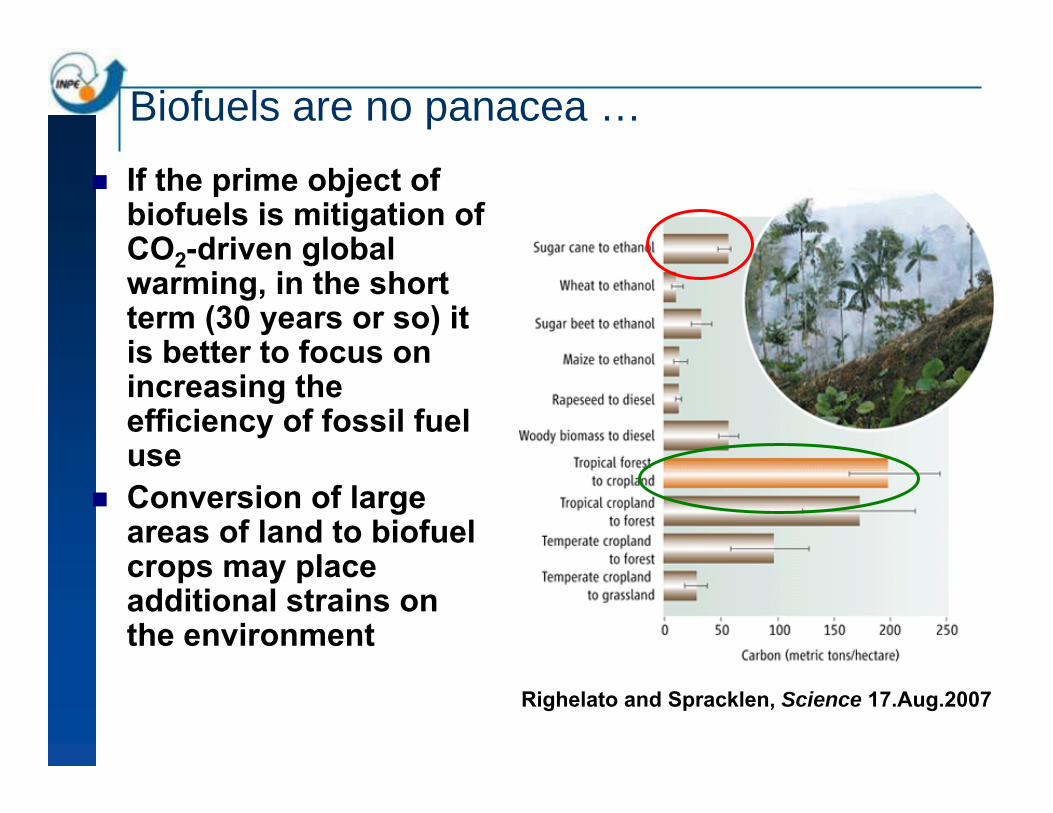
Biofuels are no panacea …If the prime object ofbiofuels is mitigation ofCO2-driven global warming, in the short term (30 years or so) it is better to focus onincreasing theefficiency of fossil fueluseConversion of largeareas of land to biofuelcrops may placeadditional strains onthe environment
Righelato and Spracklen, Science 17.Aug.2007
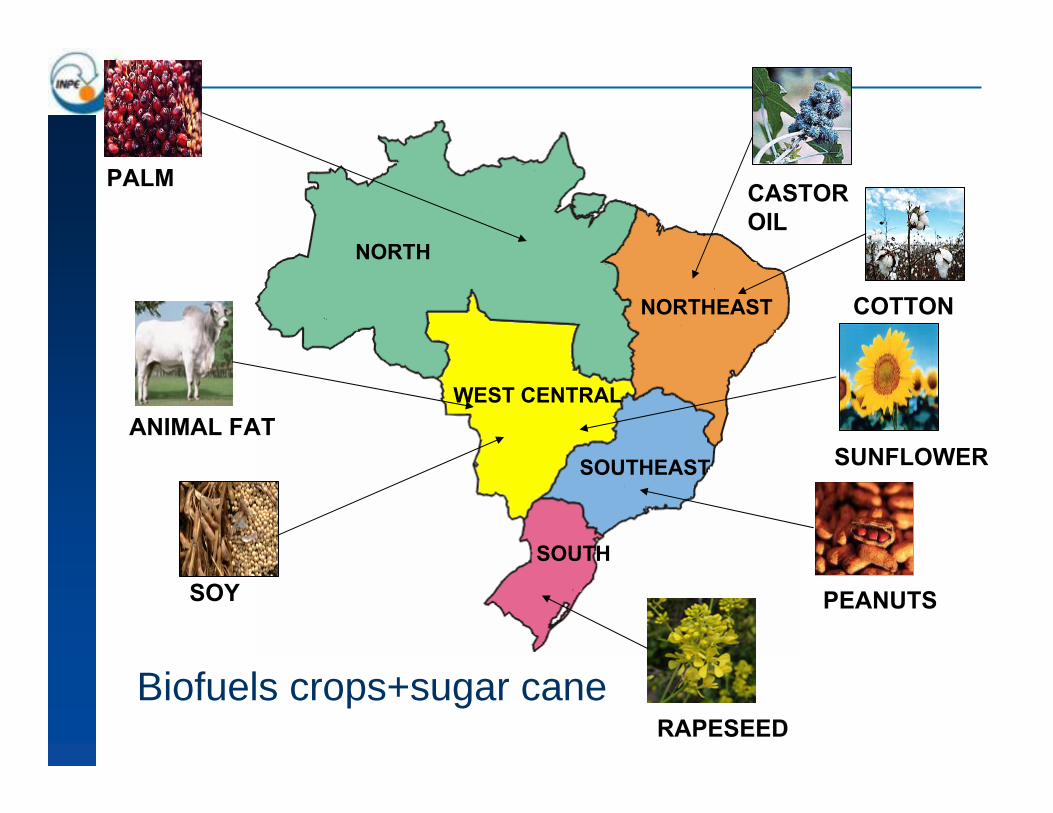
SUNFLOWER
NORTH
WEST CENTRAL
NORTHEAST
SOUTHEAST
SOUTH
PALM
ANIMAL FAT
SOY
RAPESEED
CASTOR OIL
COTTON
PEANUTS
Biofuels crops+sugar cane
Climate change is a serious issue in Brazil, changes in extremes have beenaffecting population and possible impacts may have large social, economicaland political impacts: eg. drought of Amazonia in 2005
The synergistic combination of regional climate changes caused by bothglobal warming and land cover change over the next several decades, exacerbated by increased drought and forest fire frequency, could tip thebiome-climate state to a new stable equilibrium with ‘savannization’ of partsof Amazonia and catastrophic species losses, and “aridization” in NortheastBrazil, with huge negative social impacts
CO2 “fertilization” effects could increase forest resilience, but with lessefficiency with continued warming and deforestation.
Biofuel use does not guarantee reduction in GHG emissions
Reduction in emission of GHG from industrial activities and fromdeforestation is a major goal from the Brazilian Govermenmt, keeping in mind that the economical growth of Brazil should continue in a sustainabledevelopment goal
Need for a strong interaction between academics and goverment