meaningful metrics: answering the “so what?” rick aldrich, jd, ll.m, cissp, cipt...
TRANSCRIPT
Meaningful Metrics: Answering the “So What?”
Rick Aldrich, JD, LL.M, CISSP, [email protected], 703-601-6124
Cybersecurity Metrics Workshop, Rome, NY, 12 Nov 2014

2
Observations about Cyber Metrics“Can’t manage what you can’t measure,” but cyber metrics… Often based on what’s available, not what would be most helpful
• Implementation counts• Date of last antivirus update
Often very technical• Top vulnerability was VulKey 123456
Often overwhelming based on size and diversity of issues• Scans that show dozens of software applications have not had the
latest patch applied on thousands of machines• Too many metrics
Often not tied to operational impact• Leads to the question, “So what?”
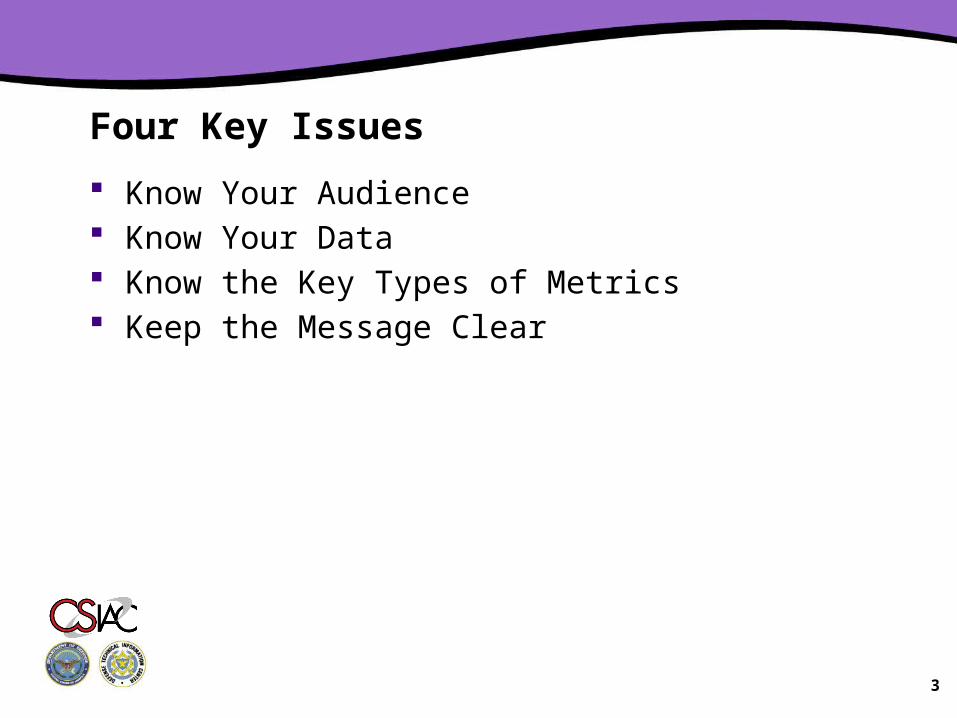
Four Key Issues
Know Your Audience Know Your Data Know the Key Types of Metrics Keep the Message Clear
3
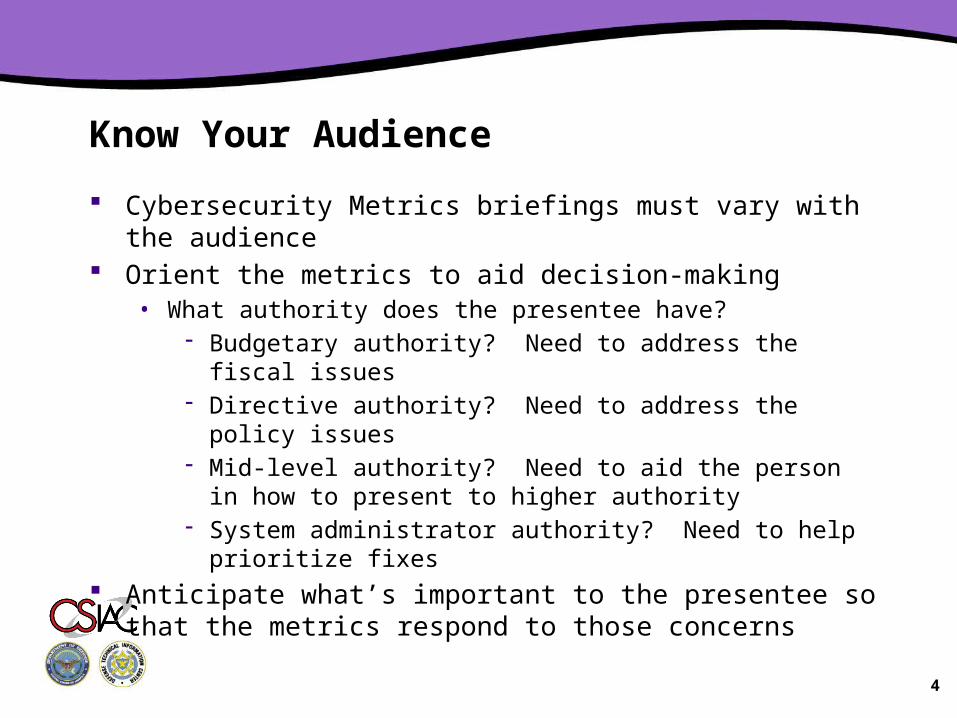
Know Your Audience
Cybersecurity Metrics briefings must vary with the audience Orient the metrics to aid decision-making
• What authority does the presentee have?- Budgetary authority? Need to address the fiscal issues- Directive authority? Need to address the policy issues- Mid-level authority? Need to aid the person in how to present
to higher authority- System administrator authority? Need to help prioritize fixes
Anticipate what’s important to the presentee so that the metrics respond to those concerns
4

Know Your Data
Most data sources have significant limitations• Be frank about those shortfalls• Don’t oversell the data, but don’t let the desire for perfection
impede progress Examples of limitations
• Self-reported data tends to be self-serving, inaccurate and dated- Nevertheless, don’t be afraid to use it (just qualify it)- Strengthen it (e.g., inspections or the threat of inspections,
mixed self-serving goals, correlations with automated data)• Automated data
- Limited to collecting objective, automatable data- May be limited in scope (e.g., only hosts with agents)- May be incomplete (non-responsive roll-up servers)- May be gamed (disconnecting assets at key times)
5

Know Your Data (cont.) Examples of limitations (cont.)
• Data from inspections, assessments, etc.- May present best light (prep for the test)- May be gamed (hide non-compliant assets, add stub
capabilities)- May need to conduct no-notice, short-notice
• Correlation does NOT equal causation Cybersecurity’s value over time vs. point in time
• Trending data may be more meaningful• Too difficult to have all machines always fully patched, fully STIGed
and properly configured, but are you trending in the right direction? Compare against industry, peers, benchmarks
6

Know the Types of Metrics
Metrics types• Implementation, Effectiveness/Efficiency, Impact (NIST 800-55)• Quantitative, Qualitative• Strategic, Tactical
Dimensions: Time, Risk, ROI, Effectiveness• Time: Will we make it to the goal line in time?
- Windows XP End-of-Life- IAVA compliance
• Risk: Are we adequately responding to threat, vulnerability and potential impact?
• ROI: If we had more money, where should I spend my next dollar?- If I have to cut money, where will I be hurt the least?
• Effectiveness: Are our mitigation and remediation efforts successfully producing the desired result?
7

Keep the Message Clear
Avoid distracting charts• Saturated colors, inconsistent or overuse of color
- Red generally means “bad,” so beware of alternate uses• Too wordy, too complex, too technical
Visualizations should be intuitive• In 2x2 or 5x5 charts, upper right should be area of interest• Metrics that increase with improvement, should trend up over time• Those that decrease with improvement, should trend down over time• Radar charts should show best values furthest from center• For senior decision-makers charts should start high-level• Allow for drill down in specific areas if desired
8

Risk Matrix
9
Cybersecurity Risk Matrix
Likelihood
Highly Improbable
Probable
Occasional
Remote
Improbable
Insignificant Minimal Damaging Major Critical
Mission Impact

Trend chart
10

Radar Chart
11
Supply Chain Risk Management
Hardware Asset Management
Software Asset Management
Perimeter Defense
Physical Access Control Management
Vulnerability ManagementConfiguration Management
Incident Detection
Incident Response
Data Leak Protection
Contingency Planning
0
33
66
99 Relative Risk
Current Program Efficacy
Potential efficacy

Questions?
Rick Aldrich, JD, LL.M, CISSP, [email protected], 703-601-6124
Cybersecurity Metrics Workshop, Rome, NY, 12 Nov 2014