mean platelet volume in biopsy-proven non-alcoholic fatty liver disease
TRANSCRIPT
2013
Platelets, May 2013; 24(3): 194–199� 2013 Informa UK Ltd.ISSN 0953-7104 print/ISSN 1369-1635 onlineDOI: 10.3109/09537104.2012.688898
ORIGINAL ARTICLE
Mean platelet volume in biopsy-proven non-alcoholic fatty liver disease
Mehmet Celikbilek1, Sebnem Gursoy1, Kemal Deniz2, Ahmet Karaman1, Gokmen Zararsiz3 & Alper Yurci1
1Department of Gastroenterology and Hepatology, Erciyes University, Medical School, Kayseri, Turkey, 2Department of Pathology,Erciyes University, Medical School, Kayseri, Turkey, and 3Department of Biostatistics and Medical Informatics, Erciyes University,Medical School, Kayseri, Turkey
AbstractNon-alcoholic fatty liver disease (NAFLD) is increasingly recognized as the most common cause of chronic liver disease worldwide. It hasbeen shown that NAFLD has a strong association with metabolic syndrome and its component like insulin resistance (IR). Cardiovasculardisease has a relation with NAFLD. Platelet volume is an indicator of platelet function and activation. Mean platelet volume (MPV) has beenreported as a risk factor for atherothrombosis. In our study, we aimed to investigate the relation of MPV with NAFLD and IR in the NAFLDpatients. A total of 54 patients with histologically proven NAFLD and 41 healthy age-matched control subject were enrolled in this study.The NAFLD subjects were divided into two subgroups: 42 patients in the insulin resistant group (median age 39.5, females 22 [52%]) and12 patients in the insulin sensitive group (median age 38, females 5 [41.7%]). MPV were significantly higher in the NAFLD group in univariateanalysis (p< 0.05). In the NAFLD patients, we did not find any relation between steatosis grade, lobular inflammation, hepatocellularballooning, NAFLD activity score and fibrosis with MPV value. Among the insulin resistant and sensitive groups in the NAFLD patients MPVvalues were similar. The results of this study showed that MPV, an indicator of platelet activation, increased in biopsy proven NAFLD patientsbut MPV is not correlated with the increase of IR in NAFLD patients. MPV is not related with inflammation and steatosis degree,hepatocellular ballooning and fibrosis in NAFLD patients.
Keywords: Non-alcoholic fatty liver disease, non-alcoholic steatohepatitis, mean platelet volume, insulin resistance
Introduction
Non-alcoholic fatty liver disease (NAFLD) is increasingly
recognized as the most common cause of chronic liver disease
worldwide [1]. The disease is a common clinicopathological
condition characterized by significant lipid deposition in the
hepatocytes of the liver parenchyma in the absence of
alcohol abuse, contributing medications and viral hepatitis.
It comprises a disease spectrum which includes variable
degrees of simple steatosis (fatty liver), non-alcoholic
steatohepatitis (NASH) and cirrhosis [2]. It has been shown
that NAFLD has a strong association with metabolic syndrome
and its components like insulin resistance (IR), obesity,
hypertension and dyslipidaemia. NAFLD is now regarded as
the liver manifestation of metabolic syndrome [3–5].
Platelet volume is an indicator of platelet function and
activation [6]. Platelet activity and aggregation capacity can be
easily determined by measuring mean platelet volume (MPV)
[7]. Large platelets have more granules, aggregate more
rapidly with collagen, produce higher levels of thromboxane
A2 and express more glycoprotein Ib and IIb/IIIa receptors
than smaller ones [8–10]. MPV has been reported as a risk
factor for atherothrombosis [6,11]. Elevated MPV values have
been shown in atherothrombotic diseases like acute myocar-
dial ischemia, acute myocardial infarction, coronary athero-
sclerosis and cerebrovascular events. Increase in MPV has also
been reported in situations that are closely associated with IR
like metabolic syndrome, obesity, diabetes mellitus (DM) and
hypertension [11].
In our study, we aimed to investigate the relation of MPV
with NAFLD, the degree of NAFLD activity score (NAS),
NAS components and IR in biopsy proven NAFLD patients.
To the best of our knowledge, no study has been conducted
on the relationship between MPV and IR in biopsy proven
NAFLD patients.
Methods
Study population
A total of 95 patients enrolled in this study between September
2010 and January 2012 at Erciyes University Gastroenterology
Department. Fifty-four patients with histologically proven
NASH were included. The inclusion criteria were as follows:
1–18 years or older, 2-persistently elevated (for at least 6
months) aminotransferases, 3-ultrasonographic presence of
hyperechogenic liver and 4-liver histology with a diagnosis
of NASH without cirrhosis obtained no more than 6 months
before the study design. The exclusion criteria were as
follows: (1) a history of any level of alcohol consumption;
(2) hypertension (4140 systolic, 490 diastolic or antihyper-
tensive use); (3) any other form of chronic liver disease;
(4) use of any medications thought to cause or affect NAFLD;
(5) abnormal thyroid function tests; (6) plasma fasting glucose
�126 mg/dl or antidiabetic drug use; (7) any medication that
Correspondence: Mehmet Celikbilek, Erciyes Universitesi T|p Fakultesi Hastanesi Gastroenteroloji Bilim Dal|, Talas, Kayseri, Turkey.Tel: þ90 505 6615375. Fax: þ90 352 437 52 73. E-mail: [email protected]
(Received 20 March 2012; revised 21 April 2012; accepted 23 April 2012; published online 30 May 2012)
Plat
elet
s D
ownl
oade
d fr
om in
form
ahea
lthca
re.c
om b
y U
nive
rsity
of
Uls
ter
at J
orda
nsto
wn
on 1
1/25
/14
For
pers
onal
use
onl
y.
can interfere with platelet function (e.g. aspirin); (8) heart
failure; (9) valvular heart disease; (10) chronic obstructive
pulmonary disease; (11) peripheral and cerebral vascular
disease; (12) hematologic disorders; (13) acute or chronic
infection; (14) history of cancer; (15) chronic kidney diseases;
and (16) documented coronary artery disease (CAD).
According to the homeostasis model assessment IR index
(HOMA-IR), the NAFLD subjects were divided into two
subgroups: 42 patients in the insulin resistant group (median
age 39.5, females 22 [52%]), and 12 patients in the insulin
sensitive group (median age 38, females 5 [41.7%]). To reduce
the influence of possible confusing factors, we excluded
diseases known to be associated with increased MPV values
such as hypertension, DM, CAD, and cerebrovascular
diseases.
The control group consisted of 41 healthy age-matched
subjects with normal liver enzymes and abdominal ultrasono-
graphy findings. All subjects underwent a clinical examination
and were questioned about their medical history. Body mass
index (BMI) was calculated as body weight/height2.
This study was performed in accordance with the principles
of the Helsinki Declaration. This study was approved by the
ethical committee of the Medical School of Erciyes University
and informed consent was obtained from all participants.
Biochemical measurements
Blood samples were drawn after an overnight fast from an
antecubital vein; fasting plasma glucose, serum basal insulin
level, high-density lipoprotein cholesterol (HDL), triglycerides
(TG), low-density lipoprotein cholesterol (LDL), creatinine,
alanine aminotransferase (ALT), aspartate aminotransferase
(AST), serum total bilirubin, serum indirect bilirubin, alkaline
phosphatase (AP), and gamma glutamyl transferase (GGT)
were determined by the standard methods.
The estimate of IR by HOMA-IR was calculated with
the formula: fasting serum insulin (mIU/l)� fasting plasma
glucose (mmol/l) /22.5 [12]. The 70th percentile HOMA-IR
value in non-diabetic subjects was 2.245 in the Turkish Adult
Risk Factor Study [13]. IR was defined as42.245 in this study.
MPV was measured in a blood sample collected with
ethylene diamine tetra acetic acid (EDTA) as an anticoagulant.
The samples were used within an hour to prevent EDTA
induced swelling. Dastjerdi et al. [14] reported that MPV
measured within an hour of sampling, using both citrate and
EDTA as an anticoagulant were not significantly different
when compared to each other.
Histopathologic analysis
The liver tissue was stained with hematoxylin–eosin and
Masson’s trichrome stains. The review of the specimens was
carried out by a single experienced liver pathologist. All cases
were scored by using NAS [15]. A 4-point scale for steatosis
[(0) <5%, (1) 5–33%, (2) 433–66%, and (3) 466%], lobular
inflammation [(0) no foci, (1) <2 foci, (2) 2–4 foci, and (3)44
foci] and a 3-point scale for ballooning [(0) none, (1) mild, and
(2) moderate-marked] resulted in a maximal sum score of
eight. A NAS score of five correlated with the diagnosis of
NASH, patients with scores <3 were diagnosed as not having
NASH, and patients with scores of three and four were
diagnosed as having borderline NASH. Fibrosis was scored on
the Masson’s trichrome stain by using the NASH scoring
system [(0): none, (1) perisinusoidal or periportal fibrosis,
(2) perisinusoidal and periportal fibrosis, (3) bridging fibrosis,
and (4) cirrhosis]. Steatosis coded as 0¼mild (steatosis grade
1); or 1¼moderate to severe (steatosis grades 2–3). Lobular
inflammation coded as 0¼ absent-mild (lobular inflammation
0–1); or 1¼moderate–severe (lobular inflammation 2–3).
Fibrosis coded as 0¼ no significant fibrosis (F0–F1); or
1¼ significant fibrosis (F2–F4).
Statistical analysis
The Shapiro–Wilk test was used to check the normality
assumptions and the Levene test for the variance homogeneity
of variables. Results are expressed as frequencies (percen-
tages), mean�SD or median (25th and 75th percentiles).
The differences between groups were tested by independent
two-samples t-test, Mann–Whitney U-test, one-way analysis of
variance and the Kruskal–Wallis test for continuous variables
and �2 analysis for categorical variables. Univariate and
multivariate logistic regression analyses were used to identify
the risk factors of NASH. The odds ratios are given with the
95% confidence intervals. Variables which are statistically
significant in univariate analysis were included in the multi-
variate logistic regression analysis. Backward stepwise selec-
tion was used at a stringency level of p< 0.10 to detect the
independent risk factors on NASH. p< 0.05 probability level
was considered statistically significant. All analyses were
performed with SPSS 15.0 (SPSS Inc., Chicago, IL, USA).
Results
The clinical and laboratory data of the 95 patients with
NAFLD and the controls are presented in Table I. Histological
variables were as follows in NAFLD patients: mild steatosis
28 (51.9%), mild lobular inflammation 15 (27.8%), mild
ballooning 40 (74.1%) and mild fibrosis 31 (57.4%). Twenty-
seven (50%) of the NAFLD patients were classified as
borderline NASH according to the NAS score (Table II).
The IR group number was 42 (77.8%) in the NAFLD patients.
Age, LDL and fasting glucose were similar between the
NAFLD and control groups. BMI, systolic blood pressure
(BP), diastolic BP, LDL, TG, AST, ALT, AP, GGT, insulin,
HOMA-IR, MCV and MPV were significantly higher in the
NAFLD group in univariate analysis (p< 0.05). HDL and
platelet count were significantly lower in the NAFLD group
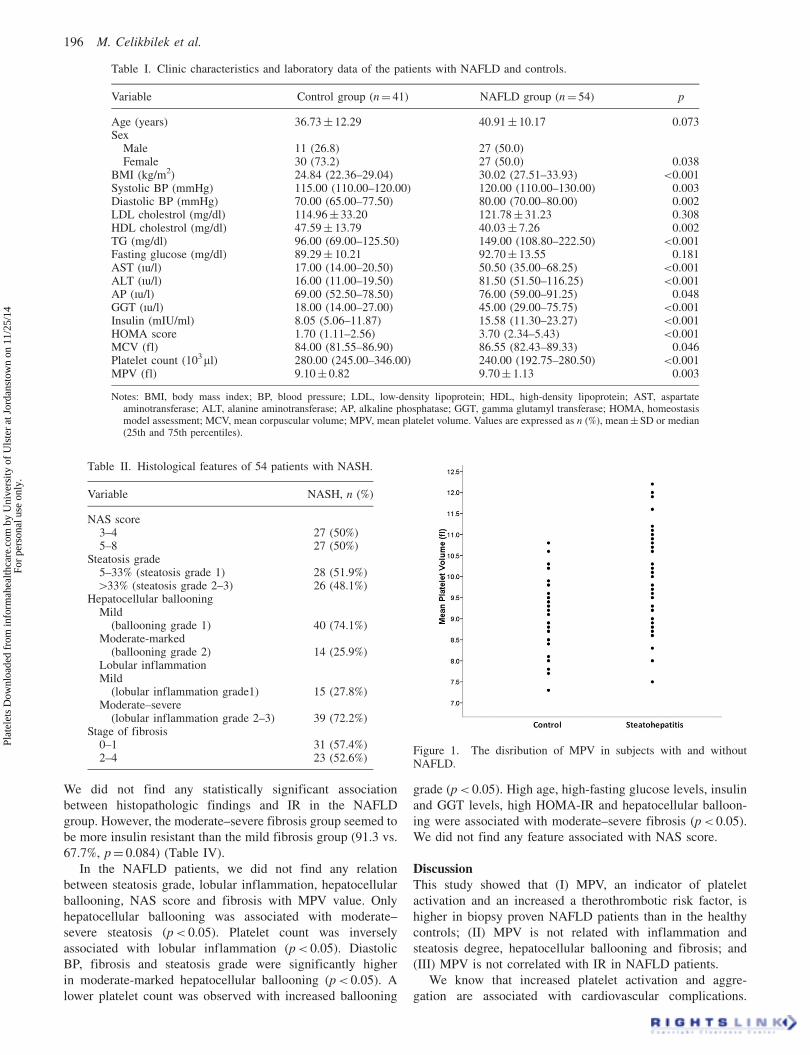
in univariate analysis (p< 0.05). Distributions of MPV
levels in subjects with and without NAFLD were showed in
Figure 1. Multivariate logistic regression analysis showed that
only ALT was significantly associated with NAFLD. Due to
the significant differences in age and sex between the study
groups assessed in univariate analyses, we also adjusted the
logistic regression models for age and sex variables. Both
crude and adjusted regression results are given in Table III.
Among the insulin resistant and sensitive groups in the
NASH patients, age, gender, LDL, fasting glucose, systolic
BP, diastolic BP, LDL, TG, HDL, AST, ALT, AP, platelet
count, MCV and MPV values were similar. BMI and GGT
values were significantly higher in insulin resistant NAFLD
patients than in insulin sensitive NAFLD patients (p< 0.05).
Mean platelet volume in non-alcoholic steatohepatitis 195
Plat
elet
s D
ownl
oade
d fr
om in
form
ahea
lthca
re.c
om b
y U
nive
rsity
of
Uls
ter
at J
orda
nsto
wn
on 1
1/25
/14
For
pers
onal
use
onl
y.
We did not find any statistically significant association
between histopathologic findings and IR in the NAFLD
group. However, the moderate–severe fibrosis group seemed to
be more insulin resistant than the mild fibrosis group (91.3 vs.
67.7%, p¼ 0.084) (Table IV).
In the NAFLD patients, we did not find any relation
between steatosis grade, lobular inflammation, hepatocellular
ballooning, NAS score and fibrosis with MPV value. Only
hepatocellular ballooning was associated with moderate–
severe steatosis (p< 0.05). Platelet count was inversely
associated with lobular inflammation (p< 0.05). Diastolic
BP, fibrosis and steatosis grade were significantly higher
in moderate-marked hepatocellular ballooning (p< 0.05). A
lower platelet count was observed with increased ballooning
grade (p< 0.05). High age, high-fasting glucose levels, insulin
and GGT levels, high HOMA-IR and hepatocellular balloon-
ing were associated with moderate–severe fibrosis (p< 0.05).
We did not find any feature associated with NAS score.
Discussion
This study showed that (I) MPV, an indicator of platelet
activation and an increased a therothrombotic risk factor, is
higher in biopsy proven NAFLD patients than in the healthy
controls; (II) MPV is not related with inflammation and
steatosis degree, hepatocellular ballooning and fibrosis; and
(III) MPV is not correlated with IR in NAFLD patients.
We know that increased platelet activation and aggre-
gation are associated with cardiovascular complications.
Table I. Clinic characteristics and laboratory data of the patients with NAFLD and controls.
Variable Control group (n¼ 41) NAFLD group (n¼ 54) p
Age (years) 36.73� 12.29 40.91� 10.17 0.073Sex
MaleFemale
11 (26.8)30 (73.2)
27 (50.0)27 (50.0) 0.038
BMI (kg/m2) 24.84 (22.36–29.04) 30.02 (27.51–33.93) <0.001Systolic BP (mmHg) 115.00 (110.00–120.00) 120.00 (110.00–130.00) 0.003Diastolic BP (mmHg) 70.00 (65.00–77.50) 80.00 (70.00–80.00) 0.002LDL cholestrol (mg/dl) 114.96� 33.20 121.78� 31.23 0.308HDL cholestrol (mg/dl) 47.59� 13.79 40.03� 7.26 0.002TG (mg/dl) 96.00 (69.00–125.50) 149.00 (108.80–222.50) <0.001Fasting glucose (mg/dl) 89.29� 10.21 92.70� 13.55 0.181AST (|u/l) 17.00 (14.00–20.50) 50.50 (35.00–68.25) <0.001ALT (|u/l) 16.00 (11.00–19.50) 81.50 (51.50–116.25) <0.001AP (|u/l) 69.00 (52.50–78.50) 76.00 (59.00–91.25) 0.048GGT (|u/l) 18.00 (14.00–27.00) 45.00 (29.00–75.75) <0.001Insulin (mIU/ml) 8.05 (5.06–11.87) 15.58 (11.30–23.27) <0.001HOMA score 1.70 (1.11–2.56) 3.70 (2.34–5.43) <0.001MCV (fl) 84.00 (81.55–86.90) 86.55 (82.43–89.33) 0.046Platelet count (103ml) 280.00 (245.00–346.00) 240.00 (192.75–280.50) <0.001MPV (fl) 9.10� 0.82 9.70� 1.13 0.003
Notes: BMI, body mass index; BP, blood pressure; LDL, low-density lipoprotein; HDL, high-density lipoprotein; AST, aspartateaminotransferase; ALT, alanine aminotransferase; AP, alkaline phosphatase; GGT, gamma glutamyl transferase; HOMA, homeostasismodel assessment; MCV, mean corpuscular volume; MPV, mean platelet volume. Values are expressed as n (%), mean� SD or median(25th and 75th percentiles).
Table II. Histological features of 54 patients with NASH.
Variable NASH, n (%)
NAS score3–4 27 (50%)5–8 27 (50%)
Steatosis grade5–33% (steatosis grade 1) 28 (51.9%)433% (steatosis grade 2–3) 26 (48.1%)
Hepatocellular ballooningMild
(ballooning grade 1) 40 (74.1%)Moderate-marked
(ballooning grade 2) 14 (25.9%)Lobular inflammationMild
(lobular inflammation grade1) 15 (27.8%)Moderate–severe
(lobular inflammation grade 2–3) 39 (72.2%)Stage of fibrosis
0–1 31 (57.4%)2–4 23 (52.6%)
Figure 1. The disribution of MPV in subjects with and withoutNAFLD.
196 M. Celikbilek et al.
Plat
elet
s D
ownl
oade
d fr
om in
form
ahea
lthca
re.c
om b
y U
nive
rsity
of
Uls
ter
at J
orda
nsto
wn
on 1
1/25
/14
For
pers
onal
use
onl
y.
Some markers can be used to evaluate platelet activation like
CD62 (P-selectin), CD63, glycoprotein IIb/IIIa receptors,
platelet factor 4 and �-thromboglobulin. These methods are
costly, time consuming and are not omnipresent. In contrast,
MPV is a cost effective and practical method to evaluate
platelet function and activity [16]. Larger platelets are more
active than smaller ones. Larger platelets also have more
granules, produce more thrombotic factors like thromboxane
A2, aggregate more rapidly with collagen and express more
glycoprotein IIb/IIIa receptors [17–19].
MPV has been found to be higher in patients with metabolic
syndrome, obesity, DM, CAD and hypertension, conditions
Table IV. Clinical characteristics and the laboratory data of the insulin resistant and insulin sensitive patientswith NAFLD.
Insulin sensitive group (n¼ 12) Insulin resistant group (n¼ 42) p
Age (years) 37.58� 11.04 41.86� 9.84 0.202BMI (kg/m2) 26.57 (24.72–29.22) 30.94 (28.28–35.01) 0.003Systolic BP (mmHg) 120.00 (110.00–128.75) 120.00 (110.00–130.00) 0.724Diastolic BP (mmHg) 80.00 (71.25–87.50) 80.00 (70.00–80.00) 0.770LDL-C (mg/dl) 122.33� 39.08 121.62� 29.17 0.945HDL-C (mg/dl) 39.92� 7.06 40.06� 7.39 0.953TG (mg/dl) 126.00 (95.50–207.75) 149.50 (115.00–240.00) 0.201Fasting glucose (mg/dl) 86.92� 9.82 94.36� 14.10 0.094AST (|u/l) 45.00 (30.00–66.00) 50.50 (35.00–68.25) 0.525ALT (|u/l) 65.50 (43.00–107.00) 83.50 (53.00–117.50) 0.240AP (|u/l) 83.00 (57.00–94.25) 75.50 (59.00–87.50) 0.610GGT (|u/l) 31.50 (21.00–44.50) 50.50 (35.25–84.00) 0.038Insulin (mIU/ml) 7.70 (6.71–8.85) 18.75 (13.45–24.93) <0.001HOMA-IR 1.67 (1.36–1.80) 4.37 (3.14–6.10) <0.001MCV (fl) 87.25 (84.15–91.85) 86.30 (81.60–89.30) 0.186Platelet count (103ml) 250.17� 63.05 236.45� 60.19 0.494MPV (fl) 9.10 (8.63–9.75) 9.75 (8.80–10.75) 0.133
HistologyNAS (3–4/�5) 5 (18.5)/7 (25.9) 22 (81.5)/20 (74.1) 0.743Lobular inflammation (1/2–3) 3 (20.0)/9 (23.1) 12 (80.0)/30 (76.9) 0.999Steatosis (1/2–3) 6 (21.4)/6 (23.1) 22 (78.6)/20 (76.9) 0.999Hepatocellular ballooning (1/2) 10 (25.0)/2 (14.3) 30 (75.0)/12 (85.7) 0.710Fibrosis (0–1/2–4) 10 (32.3)/2 (8.7) 21 (67.7)/21 (91.3) 0.084
Notes: BMI, body mass index; BP, blood pressure; LDL, low-density lipoprotein; HDL, high-density lipoprotein; AST, aspartateaminotransferase; ALT, alanine aminotransferase; AP, alkaline phosphatase; GGT, gamma glutamyl transferase; HOMA,homeostasis model assessment; MCV, mean corpuscular volume; and MPV, mean platelet volume. Values are expressed asmean�SD, number of cases (%) or median (25th and 75th percentiles).
Table III. Logistic regression analysis results for steatohepatitis.
Crude Adjusted
Variable OR 95% CI W OR 95% CI W
BMI (kg/m2) 1.22 1.11–1.36 14.78 1.29 1.13–1.47 14.05Systolic BP (mmHg) 1.06 1.02–1.10 8.36 1.06 1.01–1.11 6.78Diastolic BP (mmHg) 1.07 1.02–1.13 8.49 1.08 1.02–1.14 7.58LDL cholestrol (mg/dl) 1.01 0.99–1.02 1.05 1.01 0.99–1.02 0.11HDL cholestrol (mg/dl) 0.93 0.89–0.97 9.39 0.94 0.90–0.99 5.95TG (mg/dl) 1.01 1.01–1.02 11.22 1.01 1.01–1.02 8.02Fasting glucose (mg/dl) 1.02 0.99–1.06 1.79 1.02 0.98–1.06 0.81AST (|u/l) 1.52 1.23–1.89 14.80 1.62 1.20–2.19 10.01ALT (|u/l) 1.36* 1.12–1.64 10.06 1.70* 1.01–2.85 3.96AP (|u/l) 1.01 1.00–1.03 2.47 1.01 1.00–1.03 1.45GGT (|u/l) 1.08 1.04–1.12 15.76 1.08 1.04–1.12 13.75Insulin (mIU/ml) 1.06 1.01–1.11 5.96 1.06 1.01–1.11 4.63HOMA score 1.28 1.05–1.56 5.74 1.25 1.01–1.54 4.29MCV (fl) 1.07 1.00–1.15 3.83 1.05 0.98–1.13 1.80Platelet count (103ml) 0.99 0.98–0.99 12.09 0.99 0.98–0.99 7.80MPV (fl) 1.85 1.18–2.90 7.13 1.75 1.09–2.83 5.26
Notes: Adjusted odds ratios are adjusted for age and sex. W, Wald statistic; BMI, body mass index; BP, blood pressure; LDL,low-density lipoprotein; HDL, high-density lipoprotein; AST, aspartate aminotransferase; ALT, alanine aminotransferase;AP, alkaline phosphatase; GGT, gamma glutamyl transferase; HOMA, homeostasis model assessment; MCV, mean corpuscularvolume; and MPV, mean platelet volume. *Statistically significant after multiple logistic regression analysis.
Mean platelet volume in non-alcoholic steatohepatitis 197
Plat
elet
s D
ownl
oade
d fr
om in
form
ahea
lthca
re.c
om b
y U
nive
rsity
of
Uls
ter
at J
orda
nsto
wn
on 1
1/25
/14
For
pers
onal
use
onl
y.
which are closely associated with IR [11,20]. MPV increase
may contribute to diabetes associated vascular damage like
retinopathy, and microalbuminuria in patients with DM [17].
Several studies have found higher MPV values in ischemic
stroke and have implicated the role of MPV in prognosis and
severity in cerebrovascular disease. Evidence suggest a
correlation between an increase in MPV and the risk of
thrombosis [11,18,19,21]. Increased MPV values have also
been reported in patients with NAFLD [22–24]. In these
studies, authors showed that MPV increases in NAFLD
patients but they did not confirm the diagnosis of NAFLD
with liver biopsy. They did not study MPV and its relation with
NAS components, fibrosis, NAS score and IR in NASH
patients. One study with biopsy confirmed NAFLD subjects
did not find any difference in MPV levels between patients and
controls [25]. In newly published data by Alkhouri et al.
with biopsy proven NAFLD, MPV values were higher for
NASH than for simple steatosis and normal biopsy. Also, the
histologic severity of liver injury and inflammation was
related with higher MPV levels in this data [26]. In our study,
we found higher MPV values in biopsy proven NAFLD
patients compatible with Alkhouri et al. We investigated NAS
components, NAS score, fibrosis degree and their relation
with MPV. Our findings did not confirm any relation between
NAS components, NAS score and fibrosis degree with MPV
which is discordant with the findings of Alkhouri et al. As
mentioned before, MPV is a risk factor, a prognostic indicator
and may play a prominent part in acute myocardial infarction
and cerebrovascular disease pathogenesis [11]. We suggest
that MPV may be considered as an important risk factor in
vascular complications of NAFLD.
In one study an association between MPV and ischemic
electrocardiographic changes was found and MPV tended to be
higher in subjects with higher HOMA index levels in elderly
subjects [27]. In a non-obese and normoglycemic population
with CAD, MPV values were found to be significantly higher
in the insulin resistant group than in the insulin sensitive group
and researchers mentioned the close connection between IR
and MPV [28]. Another study investigated the relationship
between IR and MPV levels in obese adolescent NAFLD
patients and found a positive correlation between MPV and
HOMA-IR [24]. However, the researchers did not study the
relationship between IR and MPV in patients with biopsy
proven NAFLD. For the first time in the literature, we
investigated the direct relationship between IR calculated as
HOMA-IR and MPV in non-diabetic and non-hypertensive
patients with biopsy proven NAFLD. According to our
findings, although MPV was higher in the NAFLD group
than in controls, it was not related with IR in NAFLD patients.
Cytokines are central mediators of hepatic inflammation
and cytokines derived from adipose tissue are thought to play
a key role in NAFLD [29,30]. In one review, the authors
suggested that adipose tissue and a dysfunctioning endothe-
lium may affect bone marrow to produce larger platelets by
cytokines, and added that an altered cytokine profile may
affect platelet size in NAFLD patients [17]. Cytokine plasma
levels are related to hepatic fat content, degree of inflamma-
tion and extent of fibrosis [31]. Basili et al. [32] found
that platelet activation was higher in cirrhotic patients than
in controls and they also reported that cirrhosis is character-
ized by enhanced production of isoprostanes, an index of
oxidative stress in vivo, which is known to elicit platelet
activation. Although we did not examine the cytokine profile
and oxidative stress and their relation with MPV, it makes
sense that MPV may be affected by the altered cytokine profile
and oxidative stress in NAFLD.
There are some limitations in our study. First, the study
population was small and the duration of the study was long
which could affect validity of the results of this study. Second,
the HOMA formula, used to calculate the insulin sensitivity,
is only estimate method and cannot give data as definitive
as the euglycemic–hyperinsulinemic clamp test. As a third
limitation we excluded DM but we did not apply an oral
glucose tolerance test to exclude impaired glucose tolerance.
In conclusion, the results of this study showed that MPV, an
indicator of platelet activation, increased in biopsy proven
NAFLD patients but MPV is not correlated with the increase
of IR in NAFLD patients. In our opinion, cytokine profile,
rather than IR, may play a role in MPV values. Considering
that studies suggest elevated MPV values increase the risk of
CVD, higher MPV values should alert physicians to CVD risk
in NAFLD.
Acknowledgements
We thank Dr Edip Torun, Dr Serkan Dogan, Dr Demet Ozel,
Dr Ahmet Yagbasan for patient support and contributions,
Dr Omer Ozbak|r, Dr Kadri Guven, Dr Mehmet Yucesoy for
their helpful discussion and excellent advise.
References1. Chitturi S, Farrell G, George J. Non-alcoholic steatohepatitis
in the Asia-Pacific Region: Future shock? J GastroenterolHepatol 2004;19:368–374.
2. Angulo P. Nonalcoholic fatty liver disease. N Engl J Med2002;346:1221–1231.
3. Marchesini G, Brizi M, Bianchi G, Tomassetti S, Bugianesi E,Lenzi M, McCullough AJ, Natale S, Forlani G, Melchionda N.Nonalcoholic fatty liver disease: A feature of the metabolicsyndrome. Diabetes 2001;50:1844–1850.
4. Marchesini G, Bugianesi E, Forlani G, Cerrelli F, Lenzi M,Manini R, Natale S, Vanni E, Villanova N, Melchionda N,Rizzetto M. Nonalcoholic fatty liver, steatohepatitis, and themetabolic syndrome. Hepatology 2003;37:917–923.
5. Marchesini G, Marzocchi R. Metabolic syndrome and NASH.Clin Liver Dis 2007;11:105–117.
6. Park Y, Schoene N, Haris W. Mean platelet volume as anindicator of platelet activation: Methodological issues. Platelets2002;13:301–306.
7. Bancroft AJ, Abel EW, Mclaren M, Belch JJ. Mean plateletvolume is a useful parameter: A reproducible routine methodusing a modified Coulter thrombocytometer. Platelets2000;11:379–387.
8. Martin JF, Trowbridge EA, Salmon G, Plumb J. The biologicalsignificance of platelet volume: Its relationship to bleeding time,platelet thromboxane B2 production and megakaryocyte nuclearDNA concentration. Thromb Res 1983;32:443–460.
9. Jakubowski JA, Thompson CB, Vaillancourt R, Valeri CR,Deykin D. Arachidonic acid metabolism by platelets of differingsize. Br J Haematol 1983;5:503–11.
10. Giles H, Smith REA, Martin JF. Platelet glycoprotein IIb–IIIa andsize are increased in acute myocardial infarction. Eur J ClinInvest 1994;24:69–72.
198 M. Celikbilek et al.
Plat
elet
s D
ownl
oade
d fr
om in
form
ahea
lthca
re.c
om b
y U
nive
rsity
of
Uls
ter
at J
orda
nsto
wn
on 1
1/25
/14
For
pers
onal
use
onl
y.
11. Gasparyan AY, Ayvazyan L, Mikhailidis DP, Kitas GD. Meanplatelet volume: A link between thrombosis and inflammation?Curr Pharm Des 2011;17:47–58.
12. Matthews DR, Hosker JP, Rudenski AS, Naylor BA, Treacher DF,Turner RC. Homeostasis model assessment: Insulin resistanceand beta-cell function from fasting plasma glucose and insulinconcentrations in man. Diabetologia 1985;28:412–419.
13. Onat A, Hergenc G, Turkmen S, Yazici M, Sari I, Can G.Discordance between insulin resistance and metabolic syndrome:Features and associated cardiovascular risk in adults with normalglucose regulation. Metabolism 2006;55:445–452.
14. Dastjerdi MS, Emami T, Najafian A, Amini M. Mean plateletvolume measurement, EDTA or citrate? Hematology2006;11:317–319.
15. Kleiner DE, Brunt EM, Van Natta M, Behling C, Contos MJ,Cummings OW, Ferrell LD, Liu YC, Torbenson MS, Unalp-Arida A, Yeh M, McCullough AJ, Sanyal AJ; NonalcoholicSteatohepatitis Clinical Research Network. Design and validationof a histological scoring system for nonalcoholic fatty liverdisease. Hepatology 2005;41:1313–1321.
16. Bath PM, Butterworth RJ. Platelet size: Measurement, physiologyand vascular disease. Blood Coagul Fibrinolysis. 1996;7:157–161.
17. Vizioli L, Muscari S, Muscari A. The relationship of meanplatelet volume with the risk and prognosis of cardiovasculardiseases. Int J Clin Pract 2009;63:1509–1515.
18. O’Malley T, Langhorne P, Elton RA, Stewart C. Platelet size instroke patients. Stroke 1995;26:995–999.
19. Butterworth RJ, Bath PM. The relationship between mean plateletvolume, stroke subtype and clinical outcome. Platelets 1998;9:359–364.
20. Tavil Y, Sen N, Yazici HU, Hizal F, Abaci A, Cengel A. Meanplatelet volume in patients with metabolic syndrome and itsrelationship with coronary artery disease. Thromb Res2007;120:245–250.
21. Muscari A, Puddu GM, Cenni A, Silvestri MG, Giuzio R,Rosati M, Santoro N, Bianchi G, Magalotti D, Zoli M. Meanplatelet volume (MPV) increase during acute non-lacunarischemic strokes. Thromb Res 2009;123:587–591.
22. Ozhan H, Aydin M, Yazici M, Yazgan O, Basar C, Gungor A,Onder E. Mean platelet volume in patients with non-alcoholicfatty liver disease. Platelets 2010;21:29–32.
23. Shin WY, Jung DH, Shim JY, Lee HR. The association betweennon-alcoholic hepatic steatosis and mean platelet volume in anobese Korean population. Platelets 2011;22:442–6.
24. Mean platelet volume in obese adolescents with nonalcoholicfatty liver disease. Arslan N, Makay B. J Pediatr EndocrinolMetab 2010;23:807–813.
25. Kilciler G, Genc H, Tapan S, Ors F, Kara M, Karadurmus N,Ercin CN, Karslioglu Y, Kilic S, Bagci S, Erbil MK, Dogru T.Mean platelet volume and its relationship with carotid athero-sclerosis in subjects with non-alcoholic fatty liver disease. Ups JMed Sci 2010;115:253–259.
26. Alkhouri N, Kistangari G, Campbell C, Lopez R, Zein NN,Feldstein AE. Mean platelet volume as a marker of increasedcardiovascular risk in patients with nonalcoholic steatohepatitis.Hepatology 2012;55:331.
27. Muscari A, De Pascalis S, Cenni A, Ludovico C, Castaldini N,Antonelli S, Bianchi G, Magalotti D, Zoli M. Determinants ofmean platelet volume (MPV) in an elderly population: Relevanceof body fat, blood glucose and ischaemic electrocardiographicchanges. Thromb Haemost 2008;99:1079–1084.
28. Varol E, Akcay S, Ozaydin M, Erdogan D, Dogan A, Altinbas A.Mean platelet volume is associated with insulin resistance in non-obese, non-diabetic patients with coronary artery disease. JCardiol 2010;56:154–158.
29. Tilg H. The role of cytokines in non-alcoholic fatty liver disease.Dig Dis 2010;28:179–85.
30. Tilg H, Diehl AM. Cytokines in alcoholic and nonalcoholicsteatohepatitis. N Engl J Med 2000;343:1467–1476.
31. Tilg H. Adipocytokines in nonalcoholic fatty liver disease:Key players regulating steatosis, inflammation and fibrosis.Curr Pharm Des 2010;16:1893–1895.
32. Basili S, Raparelli V, Riggio O, Merli M, Carnevale R,Angelico F, Tellan G, Pignatelli P, Violi F; Group CALC.NADPH oxidase-mediated platelet isoprostane over-production incirrhotic patients: Implication for platelet activation. Liver Int2011;31:1533–1540.
Mean platelet volume in non-alcoholic steatohepatitis 199
Plat
elet
s D
ownl
oade
d fr
om in
form
ahea
lthca
re.c
om b
y U
nive
rsity
of
Uls
ter
at J
orda
nsto
wn
on 1
1/25
/14
For
pers
onal
use
onl
y.